Abstract
Aims
The purpose of the study was to establish if enzyme activities from key metabolic pathways and levels of markers of oxidative damage to proteins and lipids differed between distinct liver mitochondrial sub-populations, and which specific sub-populations contributed to these differences.
Main methods
Male C57BL/6J mice were fed non-purified diet for one month then separated into two groups, control and calorie-restricted (CR). The two groups were fed semi-purified diet (AIN93G), with the CR group receiving 40% less calories than controls. After two months, enzyme activities and markers of oxidative damage in mitochondria were determined.
Key findings
In all mitochondrial sub-populations, Enzyme activities and markers of oxidative damage, from control and CR groups, showed a pattern of M1 > M3 > M10. Higher acyl-CoA dehydrogenase (β-oxidation) and β-hydroxybutryate dehydrogenase (ketogenesis) activities and lower carbonyl and TBARS levels were observed in M1 and M3 fractions from CR mice. ETC enzyme activities did not show a consistent pattern. In the Krebs cycle, citrate synthase and aconitase activities decreased while succinate dehydrogenase and malate dehydrogenase activities increased in the M1 mitochondria from the CR versus control mice.
Significance
CR does not produce uniform changes in enzyme activities or markers of oxidative damage in mitochondrial sub-populations, with changes occurring primarily in the heavy mitochondrial populations. Centrifugation at 10,000 g to isolate mitochondria likely dilutes the mitochondrial populations which show the greatest response to CR. Use of lower centrifugal force (3,000 g or lower) may be beneficial for some studies.
Keywords: Reactive oxygen species, protein carbonyls, lipid peroxidation, TBARS, electron transport chain, Krebs cycle
Introduction
Chronic calorie restriction (CR) has been reported to induce shifts in metabolism towards increased capacity for gluconeogenesis (Dhahbi et al., 2001; Dhahbi et al., 1999; Hagopian et al., 2003a) and fatty acid oxidation (Bruss et al., 2010), and decreased capacity for glycolysis (Dhahbi et al., 1999; Hagopian et al., 2003b). Alterations in liver mitochondria have been proposed to play an important role in the metabolic adaptations to CR (Anderson and Weindruch, 2010). In particular, CR-induced mitochondrial changes could influence capacity for β-oxidation, ketogenesis and utilization of proteins for gluconeogenesis. However, it is not known if CR induces uniform changes in all liver mitochondria or if particular sub-populations are primarily responsible for the metabolic changes observed with CR.
Mitochondria are composed of heterogeneous populations that can be separated by differential centrifugation into distinct sub-populations. Previous studies have separated rat (Lanni et al., 1996) and mouse (Hagopian et al., 2011) liver mitochondria into three distinct fractions, with the heaviest showing the highest respiration rates. An association between mitochondrial biogenesis and mitochondrial fractions has been proposed, indicating the presence of a growth cycle where lighter mitochondria are considered to be the precursors of the heavy mitochondria (Gianotti et al., 1998; Justo et al., 2005; Koekemoer and Oelofsen, 2001; Lombardi et al., 2000). Previous results from brown adipose tissue (BAT) studies support this idea, showing that acute cold exposure or fasting influence the lighter mitochondria primarily (Gianotti et al., 1998; Moreno et al., 1994) whereas overfeeding, chronic fasting or cold acclimation also affects the heavy mitochondria (Gianotti et al., 1998; Matamala et al., 1996; Moreno et al., 1994).
Previous studies have indicated that biochemical differences exist between the heavy and light mitochondria. For example, higher oxygen consumption rates, ROS generation and lower antioxidant capacity have been observed in liver heavy mitochondria compared to lighter ones (Venditti et al., 2002; Venditti et al., 1996). Additionally, several enzymes from key metabolic pathways have been reported to display increased activities in heavy compared to light mitochondria from both liver and white adipose tissue (Koekemoer and Oelofsen, 2001). Specifically, cytochrome c oxidase activity has been reported to be increased in heavy versus light mitochondria from liver (Koekemoer and Oelofsen, 2001; Lanni et al., 1996), white adipose tissue (Koekemoer and Oelofsen, 2001) and brown adipose tissue (Moreno et al., 1994). In addition, we reported recently (Hagopian et al., 2011) that H2O2 was generated by M1 and M3 fractions, with M1 showing higher rates than M3.
In the current study, our aim was to establish if enzyme activities from several intermediary metabolism pathways, levels of markers of oxidative damage to proteins and lipids, and the activities of the ETC enzymes differed between distinct liver mitochondrial sub-populations. Furthermore, a goal of the study was also to determine which specific mitochondrial sub-populations contributed to changes in enzyme activities and oxidative stress with CR.
Materials and Methods
Animals and Diets
Male mice of the C57BL/6J strain were purchased from Jackson Laboratories (West Sacramento, CA) at three months of age and housed singly. Animal maintenance and care protocols were approved by UC Davis Institutional Animal Care and Use Committee and were in accordance with all local and federal guidelines. Mice were kept at 22°C on a 12h dark 12h light cycle with lights on from 0600 to 1800h, with free access to water. All mice were fed a 7012 Teklad non-purified diet (Harlan Laboratories, Madison, WI), ad libitum for one month until they were four months old. At four months of age, the mice were assigned to either a control or CR group and fed a semi-purified diet (AIN93G) with the CR group being fed 40% less calories than the control group. All mice were on their respective diets for two months, which made them six months old when sacrificed for the experiments.
Chemicals
All chemicals were purchased from Sigma Chemical Company (St Louis, MO). Bio-Rad protein assay kit was from Bio-Rad laboratories (Hercules, CA) and Pierce BCA protein assay kit was from Thermo Scientific (Waltham, MA).
Liver mitochondrial isolation
Mice were sacrificed by cervical dislocation, body weights recorded and livers were removed immediately, weighed and processed for mitochondrial isolation. Livers were placed in ice-cold isolation medium (220 mM mannitol, 70 mM sucrose, 20 mM Tris-HCl, 1 mM EDTA and 0.1% (w/v) fatty acid-free BSA, pH 7.4 at 4°C) and minced with scissors into small pieces. The buffer was aspirated and fresh buffer added to rinse the liver pieces and help in the removal of blood. This step was repeated three times and the final liver suspension was homogenized, using a cold glass/Teflon homogenizer using isolation medium (at 1:10 w/v ratio), with 4-6 strokes of the Teflon pestle at 500rpm. The homogenizer was kept in an ice-packed beaker during the homogenization process. The homogenate was centrifuged at 500g for 10 minutes at 4°C and the resulting supernatant was kept for further analysis while the pellet was discarded. The crude supernatant from above was centrifuged at 1000g for 10 minutes at 4°C and the resulting supernatant (S1) was retained while the pellet was washed twice in suspension medium (same as the isolation medium but without BSA) and re-suspended in a minimal volume of suspension medium, labeled M1 and kept on ice. The supernatant S1 was centrifuged at 3000g for 10 minutes at 4°C and the resulting supernatant S3 was retained while the pellet was washed twice in suspension medium and re-suspended in a minimal volume of suspension medium, labeled M3 and kept on ice. The supernatant S3 was centrifuged at 10000g for 10 minutes at 4°C and the resulting pellet was washed twice in suspension medium and re-suspended in a minimal volume of suspension medium, labeled M10 and kept on ice. The final supernatant from this step was used for assays of lactate dehydrogenase and citrate synthase as marker enzymes.
Electron transport chain (ETC) enzyme assays
The activities of ETC enzymes (Complexes I-IV) were determined in all three mitochondrial fractions. All assays were performed at 30°C using 25mM potassium phosphate assay buffer, pH 7.2, in a final volume of 1ml, using a PerkinElmer Lambda 25 UV/VIS spectrophotometer equipped with a Peltier heating system, as described before (Hagopian et al., 2010). Briefly, complex I (NADH:ubiquinone oxidoreducatse, EC 1.6.5.3) activity was measured at 340nm (ε = 6.22 mM−1.cm−1) in the assay buffer containing (final concentrations) 5mM MgCl2, 0.13mM NADH, 65μM ubiquinone-1, 2.5mg/ml BSA and 5μg/ml Antimycin A. Activity was measured for 1-2 minutes after which rotenone (5μg/ml) was added and activity measured for a further 2 minutes, allowing the determination of rotenone-sensitive activity. Complex II (succinate:ubiquinone oxidoreductase, EC 1.3.5.1) activity was measured at 600nm (ε = 19.1 mM−1.cm−1) by initially incubating the sample in the assay buffer containing 20mM succinate for 10 minutes at assay temperature, followed by the addition of (final concentrations) 5mM MgCl2, 2mM KCN, 5μg/ml antimycin A, 5μg/ml rotenone, 50μM dichlorophenolindophenol and 65μM ubiquinone-1 to start the assay. Complex III (ubiquinol:ferricytochrome c oxidoreductase, EC 1.10.2.2) activity was measured at 550nm (ε = 19.1 mM−1.cm−1) in the assay buffer containing (final concentrations) 5mM MgCl2, 2mM KCN, 5μg/ml rotenone, 2.5mg/ml BSA, 50μM oxidized cytochrome c and mitochondrial sample. Assays were started by adding 60μM decylubiquinol, in the presence (5μg/ml) or absence of antimycin A to distinguish the reduction of ferricytochrome c by decylubiquinol from the non-enzymic reduction. Decylubiquinol was prepared as previously described (Trounce et al., 1996). Complex IV (cytochrome c oxidase, EC 1.9.3.1) activity was determined at 550nm (ε = 19.1 mM−1.cm−1) in the assay buffer containing 15μM reduced cytochrome c and mitochondrial sample, for 2 minutes. Reduced cytochrome c was prepared as previously described (Trounce et al., 1996). The activities of the ETC enzymes were expressed as μmol/min/mg protein and presented as Mean ± SEM (n = 6).
Metabolic enzyme activities
Mitochondrial enzymes from several metabolic pathways were also measured in the three fractions. From the Krebs cycle, the activities of citrate synthase (CS) (EC 2.3.3.1), aconitase (ACO) (EC 4.2.1.3) and malate dehydrogenase (MDH) (EC 1.1.1.37) were measured at 412nm (ε = 13.6 mM−1.cm−1), 240nm (ε = 3.6 mM−1.cm−1) and 340nm (ε = 6.22 mM−1.cm−1), respectively, as previously described (Hagopian et al., 2004). Succinate dehydrogenase (SDH; complex II of the ETC) was also measured, as described in the previous section. Acyl-CoA dehydrogenase (ACDH) (β–oxidation pathway, EC 1.3.99.13) was assayed at 600nm (ε = 21 mM−1.cm−1), using palmitoyl-Co-A as substrate and β-hydroxybutyrate dehydrogenase (HBDH) (ketogenesis pathway, EC 1.1.1.3) was measured at 340nm (ε = 6.22 mM−1.cm−1), as previously described (Hagopian et al., 2012). Also measured was lactate dehydrogenase (LDH) (EC 1.1.1.27), at 340nm (ε = 6.22 mM−1.cm−1), as described before (Hagopian et al., 2011). CS and LDH were used as marker enzymes to confirm mitochondrial purity.
Mitochondrial protein carbonyl measurements
Mitochondrial protein carbonyls were measured in all three fractions. Protein carbonyls were determined by using 2,4-dinitropheylhydrazine (DNPH) (Levine et al., 1990). Briefly, mitochondrial fractions were treated with streptomycin sulfate (1% final concentration), incubated at room temperature for 15 minutes to remove nucleic acids, centrifuged (6000g, 10 minutes) and supernatants kept for assays. For assays, 250μl sample was mixed with 250μl DNPH and allowed to stand for 1 hour in the dark. Blanks were treated the same way with samples mixed with HCl instead of DNPH. After incubation, the protein was precipitated with 77μl of 75% TCA solution to give 10% final concentration and allowed to stand on ice. This was followed with centrifugation at 16,000g for 10 minutes at 4°C. The resulting pellet was washed three times with ethanol:ethyl acetate (1:1, v:v) to remove free reagent and centrifuged as above. The final pellet was dissolved in 20mM potassium dihydrogen phosphate, pH 2.3, containing 6M guanidine-HCl and allowed to stand overnight. Carbonyl concentrations were measured spectrophotometrically at 366nm using a molar absorption coefficient (ε) of 22,000 M−1.cm−1.
Mitochondrial lipid peroxidation
Lipid peroxidation of the mitochondrial membranes was determined from all three fractions as levels of thiobarbituric acid reactive substances (TBARS), as previously described (Buege and Aust, 1978). Prior to the assay, mitochondrial fractions were treated as described previously (Ramsey et al., 2004), to remove the sucrose buffer which interferes with the assay, followed by treatment with butylated hydroxytoluene (BHT) to avoid generation and overestimation of artificial peroxidation developed during the heating step (Guerrero et al., 1999). TBARS were measured spectrophotometrically at 535nm (ε = 1.56 × 10⁵ M−1.cm−1), and values expressed as nmole TBARS per mg protein.
Protein assays
Protein concentrations were determined using a Bio-Rad protein assay kit (Bio-Rad Laboratories, Hercules, CA) with BSA as standard, for all procedures except for protein carbonyls. For protein carbonyl assays, in the presence of high levels of guanidine hydrochloride, protein concentrations were determined using the BCA protein assay kit (Thermo Scientific, Waltham, MA), with BSA as standard.
Statistical analysis
All data were expressed as means ± SEM. Normality of the data distributions were checked using the Shapiro-Wilk test. Comparisons between diet groups (control vs. CR) and mitochondrial subpopulations within a diet group were made using the Student's t-test, with values of P < 0.05 taken as statistically significant. All statistical comparisons were made using JMP software (SAS Institute, Cary, NC).
Results
Mitochondrial sub-population preparations
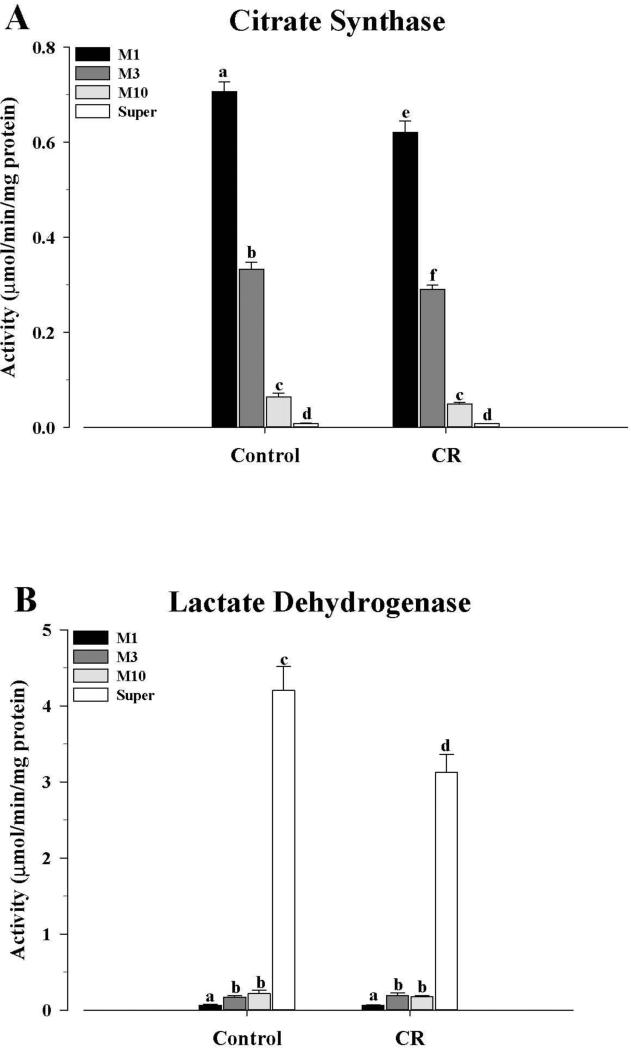
The three mitochondrial sub-populations were assessed for their integrity and purity by measuring the activity levels of CS and LDH (Fig. 1). These results were similar to those obtained previously (Hagopian et al., 2011), with CS activity of the fractions being M1 > M3 > M10 and negligible in the supernatant, in both control and CR mice (Fig. 1A). M1 and M3 fractions from CR mice were significantly lower (P < 0.05) than those of control mice, while M10 and supernatant activities were not different between the two groups. LDH activities (Fig. 1B), on the other hand, were very low in all three fractions from both control and CR mice, with the activities being M1 < M3 = M10 in both the control and CR groups. There were no differences when control mitochondrial fractions were compared with the CR fractions. As expected, the supernatants showed the greatest activities, with the levels being lower in the CR group (P < 0.05).
Figure 1.
Mitochondrial fraction purity from control and CR mice as assessed by the distribution of the activities of (A) citrate synthase and (B) lactate dehydrogenase. Enzyme activities were determined in the three mitochondrial fractions, as well as the cytosol, as described in the text, and expressed as μmol/min/mg protein. All values were presented as mean ± SEM (n = 6). Bars within a group, and between groups, that do not share the same letter are significantly different (P < 0.05). Black bar, M1; Gray bar, M3; Light gray bar, M10; White bar, cytosol.
Mitochondrial metabolic enzyme activities
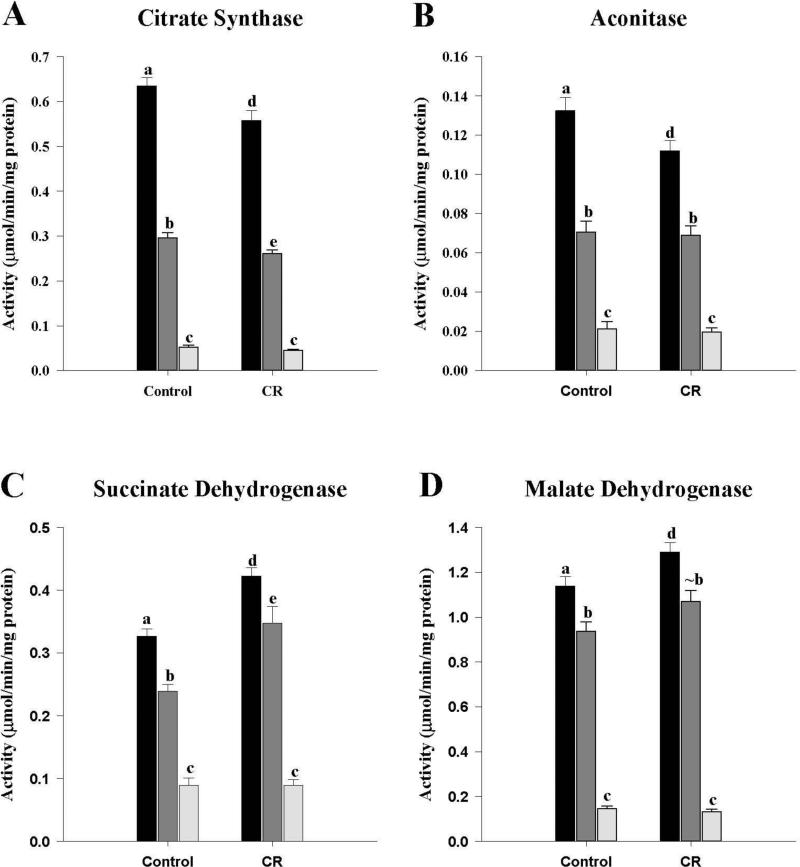
The activities of several representative enzymes from key metabolic pathways were measured. The activities of all enzymes showed a pattern of M1 > M3 > M10 (Figures 2-4). From the Krebs cycle the activities of CS, ACO, SDH and MDH were measured. CS activities (Fig. 2A) were the same as those presented in Figure 1A and discussed in the previous section, but without the cytosolic fraction. The activity of ACO (Fig. 2B) in the M1 fraction was lower (P < 0.05) in the CR compared to control mice while the M3 and M10 fractions did not differ between the two groups. In the case of SDH (Fig. 2C), which is also part of the ETC, as complex II, activities in the M1 and M3 fractions from the CR group were higher (P < 0.05) than controls, but the M10 fractions were not different. MDH (Fig. 2D) activities were higher (P < 0.05) in the M1 fraction from the CR group compared to the controls, while the M3 fraction from CR showed a trend towards an increase (P = 0.074). No differences were observed between the M10 fractions of the two groups.
Figure 2.
Activities of Krebs cycle enzymes of the mitochondrial fractions from control and CR mice. Four representative enzymes from the cycle were assayed as described in the text. A, citrate synthase; B, aconitase; C, succinate dehydrogenase (complex II); D, malate dehydrogenase. All enzyme activities were expressed as μmol/min/mg protein and presented as mean ± SEM (n = 6). Bars within a group, and between groups, that do not share the same letter are significantly different (P < 0.05). The symbol (~) is used to indicate a trend towards an increase or a decrease (P < 0.10) when the difference is not significant. Black bar, M1; Gray bar, M3; Light gray bar, M10.
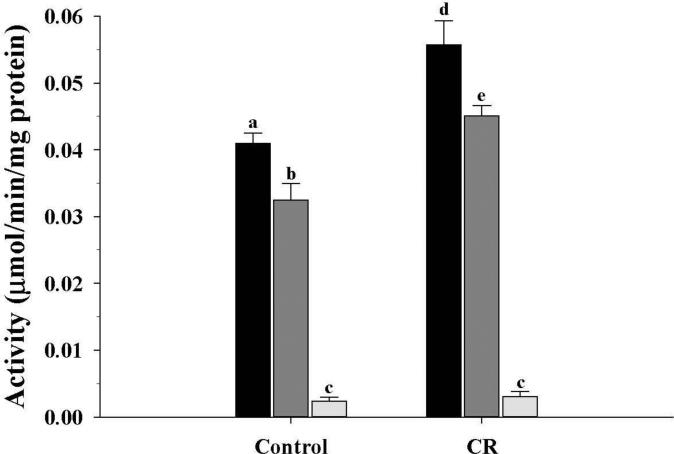
Figure 4.
Activity of β-hydroxybutyrate dehydrgenase of the ketogenic pathway from mitochondrial fractions of control and CR mice. Activity was expressed as μmol/min/mg protein and presented as mean ± SEM (n = 6). Bars within a group, and between groups, that do not share the same letter are significantly different (P < 0.05). Black bar, M1; Gray bar, M3; Light gray bar, M10.
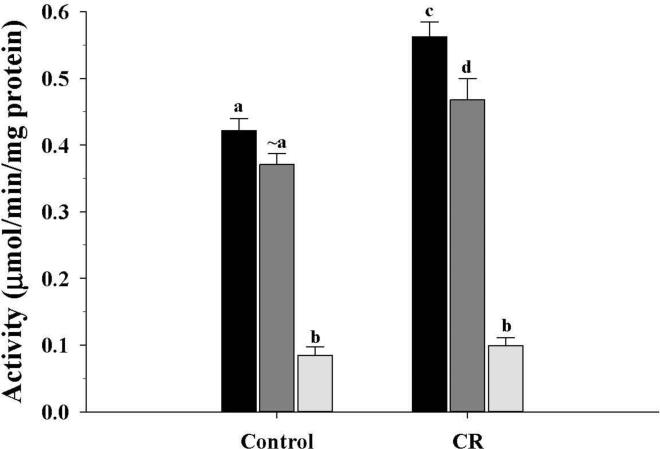
In the CR group, ACDH (β-oxidation pathway) activity (Fig. 3), was increased (P < 0.05) in the M1 and M3 fractions compared to controls, while the M10 fractions were not different. As for HBDH (Fig. 4) from the ketogenesis pathway, the CR mice showed the same pattern of change as observed for ACDH activity, with higher activities (P < 0.05) in the CR M1 and M3 fractions.
Figure 3.
Activity of acyl-CoA dehydrogenase of the β-oxidation pathway from mitochondrial fractions of control and CR mice. Activity was expressed as μmol/min/mg protein and presented as mean ± SEM (n = 6). Bars within a group, and between groups, that do not share the same letter are significantly different (P < 0.05). The symbol (~) is used to indicate a trend towards an increase or a decrease when the difference is not significant. Black bar, M1; Gray bar, M3; Light gray bar, M10.
Mitochondrial protein carbonyls and lipid peroxidation (TBARS)
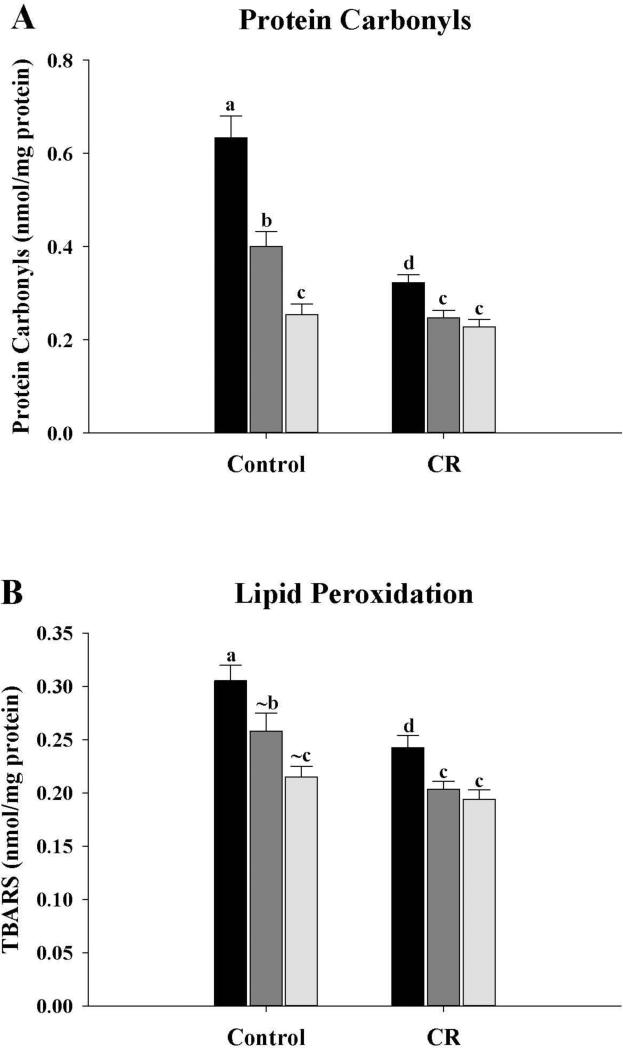
Mitochondrial protein carbonyl and TBARS levels were measured in all fractions (Fig. 5). Carbonyl levels (Fig. 5A) were significantly different (P < 0.05) between the three fractions from control mice, with M1 > M3 > M10. However, for the CR mice, carbonyl levels were M1 > M3 = M10. Carbonyl levels of the CR mice were significantly lower for the M1 and M3 fractions (P < 0.05) while M10 fractions were unchanged, when compared with controls.
Figure 5.
Markers of oxidative damage of mitochondrial proteins and membrane lipids from control and CR mice. A, Protein carbonyl levels of mitochondrial fractions from control and CR mice. All values were expressed as nmol/mg protein and presented as mean ± SEM (n = 6). B, Mitochondrial membrane lipid peroxidation levels (TBARS) of the fractions from control and CR mice. All values were expressed as nmol/mg protein and presented as mean ± SEM (n = 6). Bars within a group, and between groups, that do not share the same letter are significantly different (P < 0.05). The symbol (~) is used to indicate a trend towards an increase or a decrease (P < 0.10) when the difference is not significant. Black bar, M1; Gray bar, M3; Light gray bar, M10.
In the control mice, TBARS levels (Fig. 5B) were lower (P < 0.05) in M10 compared with M1 while trends towards a decrease were observed between M1 and M3 (P = 0.07) and between M3 and M10 (P = 0.064. In the CR mice, TBARS levels showed a significant decrease (P < 0.05) between M1 and M3 and between M1 and M10, but no differences between M3 and M10. When comparisons were made between control and CR fractions, TBARS levels of the CR mice were significantly lower for the M1 and M3 fractions (P < 0.05) when compared with controls, while M10 fractions were unchanged.
Electron transport chain enzyme activities
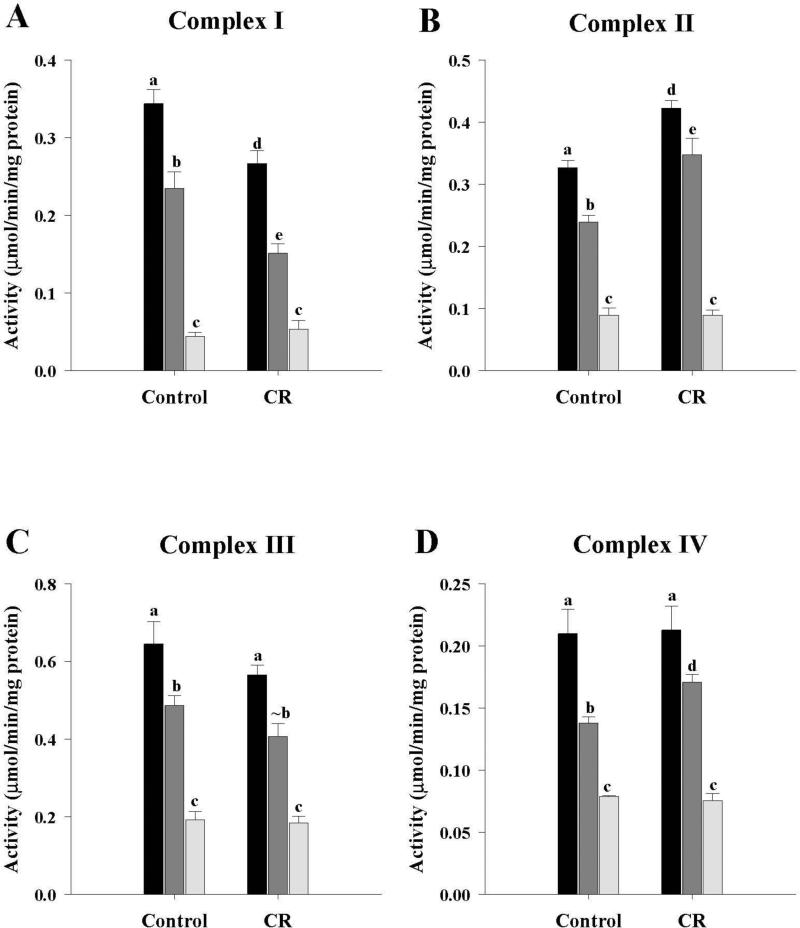
The activities of the four ETC enzymes are shown in Figure 6. In both control and CR groups, the activities of the ETC enzymes were M1 > M3 > M10. Comparing control and CR fractions, complex I activities (Fig. 6A) from CR mice were significantly lower (P < 0.05) for M1 and M3 while M10 was unchanged. Complex II (Fig. 6B) is part of the ETC and Krebs cycle and activity results have already been described in the preceding section as SDH (Fig. 2C). Complex III activity (Fig. 6C) showed that M1 and M10 fractions from CR mice were not different from the control group, while the M3 fraction showed a trend towards a decrease (P = 0.08). For complex IV (Fig. 6D), CR mice were not different from controls for the M1 and M10 fractions while M3 was significantly higher (P < 0.05).
Figure 6.
Activities of the electron transport chain enzymes of the mitochondrial fractions from control and CR mice. A, Complex I activities; B, Complex II activities; C, Complex III activities; D, Complex IV activities. All activities were expressed as μmol/min/mg protein and presented as mean ± SEM (n = 6). Bars within a group, and between groups, that do not share the same letter are significantly different (P < 0.05). The symbol (~) is used to indicate a trend towards an increase or a decrease (P < 0.10) when the difference is not significant. Black bar, M1; Gray bar, M3; Light gray bar, M10.
Protein content of mitochondrial sub-populations
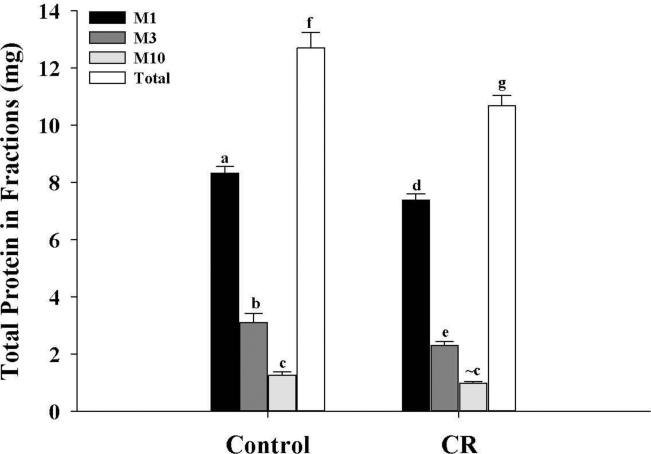
Total protein levels of each mitochondrial sub-population, as well as the overall total protein levels of the three fractions combined, were determined in both control and CR mice (Fig. 7). Results showed the highest total fractional protein levels were observed in M1, followed by M3 and M10 fractions, respectively, in both control and CR mice, with significant differences (P < 0.05) between all fractions within a group. Moreover, in the CR group, protein levels of the M1 and M3 fractions were lower (P < 0.05) than their corresponding control fractions while the M10 fraction of the CR group showed a trend towards a decrease (P = 0.08) compared to control. The overall total protein levels of the three fractions in the CR group was also lower (P < 0.05) compared to controls. The results showed that in the control group, 65.6%, 24.5% and 9.9% of total protein was in the M1, M3 and M10 fraction, respectively. In the CR group, 69.2%, 21.6% and 9.2% of total protein was in the M1, M3 and M10 fractions, respectively. This indicates that the bulk of protein, almost two-thirds, in both control and CR groups, is in the M1 fraction.
Figure 7.
Total protein levels of different fractions and the overall total protein levels from control and CR mice. Protein levels were determined and were expressed in mg. All values were expressed as mg protein and presented as mean ± SEM (n = 6). Bars within a group, and between groups, that do not share the same letter are significantly different (P < 0.05). The symbol (~) is used to indicate a trend towards an increase or a decrease (P < 0.10) when the difference is not significant. Black bar, M1; Gray bar, M3; Light gray bar, M10; white bars, overall total protein (sum of the three fractions).
Discussion
Mitochondrial populations are heterogeneous and can be separated into distinct sub-populations by differential centrifugation, as previously reported (Hagopian et al., 2011; Lanni et al., 1996). The purpose of this study was to determine which mitochondrial populations were responsible for the majority of the changes in enzyme activities and markers of oxidative stress in liver.
There were two major conclusions from this study. First, the enzymatic activities of key metabolic pathways and markers of oxidative stress differ between heavy and light population of mitochondria. Second, CR-induced changes in enzyme activities and markers of oxidative stress occur primarily in the heavy mitochondrial populations (M1 and M3). The results clearly showed a pattern of overall activity with M1 > M3 > M10. The high activities in the M1 fraction likely reflect the fact that this fraction contains the greatest amount of mitochondrial protein, as reported in this study (Fig. 7) and previous studies (Hagopian et al., 2011; Lanni et al., 1996; Venditti et al., 2004). The higher percentage of total mitochondrial protein in the M1 fraction indicates that this fraction is responsible for the majority of total enzyme activities and markers of oxidative stress. In contrast, the low activities in the M10 fraction at least partially reflect the fact that this fraction contains the lowest amount of mitochondrial protein and some contamination by other organelles (Hagopian et al., 2011). CR-induced changes in enzyme activities were limited to the heavy mitochondria, with no changes observed in the M10 fraction. It has been proposed that mitochondria undergo a growth cycle with the light mitochondria serving as precursors for the more differentiated heavy mitochondria (Gianotti et al., 1998; Justo et al., 2005; Koekemoer and Oelofsen, 2001; Lombardi et al., 2000). Therefore, the lack of difference in enzyme activities between the CR and control M10 mitochondria may indicate that the enzyme activity changes induced with sustained CR require time to develop and may only occur in more mature mitochondria. Alternatively, light mitochondria may also include some dysfunctional mitochondria which have been fragmented and targeted for mitophagy (Chen and Chan, 2009; Seo et al., 2010). Damage to these mitochondria may dampen CR-related changes in enzyme activities. Nonetheless, CR-induced changes in liver mitochondrial enzyme activities are restricted to alterations in the M1 and M3 fractions.
One factor that needs to be considered with enzyme activity measurements is normalization of the activity values. In the present study, enzyme activities were normalized by protein level. This approach was used because our primary goal was to determine which fractions made the greatest contribution to overall liver enzyme activities. Another approach would be to normalize enzyme activities for mitochondrial content using standard approaches, such as dividing by citrate synthase activity (Larsen et al., 2012). However, the use of citrate synthase activity can be problematic when normalizing data from the M10 fraction. This reflects the fact that the M10 fraction contains some damaged mitochondria which has lost matrix enzymes. Thus, use of citrate synthase activities to normalize data in this fraction can lead to overestimation of other enzyme activities in the M10 fraction.
It has been shown previously (Hagopian et al., 2004) that liver Krebs cycle enzyme activities are influenced differentially by CR, with the cycle being divided into two blocks. In the first block (CS, ACO, SDH) the enzymes show decreased activities while the second block (containing all the other enzymes) show increased or no change in activities. Decreased liver glycolysis has also been demonstrated in CR mice (Hagopian et al., 2003b), and this would lead to decreased supply of substrates to the first block of Krebs cycle. Moreover, we have also reported that CR results in increased gluconeogenesis and transamination (Hagopian et al., 2003a), leading to the entry of substrates into the second block of the cycle at several points (Hagopian et al., 2004). The results of the present study are consistent with this differential change in Krebs cycle enzyme activities with CR. However, this pattern of change in enzyme activities is not uniform among all mitochondrial subpopulations and only the M1 fraction showed significant CR-induced changes in the activities of the four Krebs cycle enzymes analyzed. If mitochondria undergo a growth cycle with the heavy mitochondria being the most differentiated (Gianotti et al., 1998; Justo et al., 2005; Koekemoer and Oelofsen, 2001; Lombardi et al., 2000), the results of the present study suggest that CR-induced changes in Krebs cycle enzymes occur only in the final stages of mitochondrial differentiation/maturation. Similarly, CR-induced increases in the activities of β-oxidation (ACDH) and ketogenic (HBDH) enzymes occurred only in the M1 and M3 fractions. These results indicate a range of responses to CR, with the M10 fraction showing no changes in enzyme activities, the M1 fraction showing the greatest changes and the M3 fractions showing changes intermediate to those of the other fractions. Additional time course studies are needed to determine to determine if these enzyme changes are influenced by mitochondrial maturation or if they simply indicate differences in responsiveness to CR between mitochondrial subpopulations.
Relatively little is known about the influence of CR on the activities of liver mitochondrial ETC enzymes. The results of the present study indicate that CR-induced no overall pattern of up- or down-regulation of ETC enzyme activities. Also, CR did not induce uniform changes in ETC activities among mitochondrial subpopulations. It has previously been reported that 25% CR induces a decrease in the amount of liver mitochondrial ETC proteins (Gomez et al., 2007). Decreased Complex I activity in the M1 and M3 fractions is consistent with a decrease in amount of ETC proteins. However, increased Complex II (SDH) activity in the M1 and M3 fractions and increased Complex IV activity in the M3 fraction are not consistent with an overall decrease in ETC activity due to low levels of ETC proteins. Post-translational modification of mitochondrial ETC proteins by acetylation (Ahn et al., 2008; Cimen et al., 2010; Finley et al., 2011; Shinmura et al., 2011), phosphorylation (Huttemann et al., 2007), or oxidative damage (Andersen, 2004; Danielson and Andersen, 2008; Musatov and Robinson, 2012; Ryan et al., 2012) can influence the activity of these enzymes. However, studies investigating the role post-translational modifications play in the regulation of ETC enzyme activities have only been completed on whole tissue homogenates or standard mitochondria preparations. It is not known if these protein modifications occur uniformly across mitochondrial subpopulations. The results of the current study are consistent with the idea that regulation of ETC activity may differ between populations of mitochondria. Additional studies are needed to determine if differences in response to CR between mitochondrial sub-populations are related to differences in ETC post-translational modifications between these populations of mitochondria.
A side product of oxidative metabolism is the production of ROS. We have previously shown that CR decreases ETC Complex I–linked ROS production in M1, M3 and M10 fractions (Hagopian et al., 2011). The results of the present study, however, indicate that CR only induces decreases in protein (carbonyls) and lipid (TBARS) oxidative damage in the heaviest (M1 and M3) mitochondrial fractions. These results are consistent with several previous studies which have reported that CR decreases liver mitochondrial protein (Gomez et al., 2007; Hagopian et al., 2005; Li et al., 2012) and lipid (Gomez et al., 2007; Laganiere and Yu, 1987; Li et al., 2012) oxidative damage, although the current study suggests that observed changes in markers of oxidative damage are not due to uniform changes in all mitochondrial sub-populations. The current study also found that oxidative damage is greatest in the M1 compared to the other mitochondrial fractions. This finding is consistent with the idea that the M1 fraction may represent the oldest, most differentiated mitochondria. The current study was only completed on relatively young mice (6 months of age when mitochondria were isolated) that were maintained on CR for 2 months. Thus, it remains to be determined if the same pattern of change in markers of oxidative damage would be observed in older animals that have greater levels of oxidative damage.
Conclusions
The results of the present study indicate that CR does not produce uniform changes in enzyme activities or markers of oxidative damage in all mitochondrial subpopulations. The heaviest mitochondrial fractions are exclusively responsible for the CR-induced changes in enzyme activities (and oxidative stress) observed in the present study. These results have at least two key implications. First, many studies routinely use centrifugation at 10,000 g to isolate all mitochondrial populations. This approach likely dilutes the mitochondrial populations which show the greatest response to CR and may mask some changes which occur in the M1 or M3 populations. The use of lower centrifugal force (3,000 g or lower) may be beneficial for some studies. Second, very few CR studies have investigated the influence of this intervention on specific mitochondrial sub-populations. Since these sub-populations show different responses to CR, it is worthwhile to consider which specific populations are responsible for these changes.
Acknowledgements
The work was funded by National Institutes of Health Grants R01 AG028125 and P01 AG025532.
Footnotes
Publisher's Disclaimer: This is a PDF file of an unedited manuscript that has been accepted for publication. As a service to our customers we are providing this early version of the manuscript. The manuscript will undergo copyediting, typesetting, and review of the resulting proof before it is published in its final citable form. Please note that during the production process errors may be discovered which could affect the content, and all legal disclaimers that apply to the journal pertain.
Conflict of interest
The authors declare that there are no conflicts of interest.
References
- Ahn BH, Kim HS, Song S, Lee IH, Liu J, Vassilopoulos A, et al. A role for the mitochondrial deacetylase Sirt3 in regulating energy homeostasis. Proc Natl Acad Sci USA. 2008;105:14447–52. doi: 10.1073/pnas.0803790105. [DOI] [PMC free article] [PubMed] [Google Scholar]
- Andersen JK. Oxidative stress in neurodegeneration: cause or consequence? Nat Med. 2004;10(Suppl):S18–25. doi: 10.1038/nrn1434. [DOI] [PubMed] [Google Scholar]
- Anderson RM, Weindruch R. Metabolic reprogramming, caloric restriction and aging. Trends Endocrinol Metab. 2010;21:134–41. doi: 10.1016/j.tem.2009.11.005. [DOI] [PMC free article] [PubMed] [Google Scholar]
- Bruss MD, Khambatta CF, Ruby MA, Aggarwal I, Hellerstein MK. Calorie restriction increases fatty acid synthesis and whole body fat oxidation rates. Am J Physiol Endocrinol Metab. 2010;298:E108–16. doi: 10.1152/ajpendo.00524.2009. [DOI] [PMC free article] [PubMed] [Google Scholar]
- Buege JA, Aust SD. Microsomal lipid peroxidation. Methods Enzymol. 1978;52:302–10. doi: 10.1016/s0076-6879(78)52032-6. [DOI] [PubMed] [Google Scholar]
- Chen H, Chan DC. Mitochondrial dynamics--fusion, fission, movement, and mitophagy--in neurodegenerative diseases. Hum Mol Genet. 2009;18:R169–76. doi: 10.1093/hmg/ddp326. [DOI] [PMC free article] [PubMed] [Google Scholar]
- Cimen H, Han MJ, Yang Y, Tong Q, Koc H, Koc EC. Regulation of succinate dehydrogenase activity by SIRT3 in mammalian mitochondria. Biochemistry. 2010;49:304–11. doi: 10.1021/bi901627u. [DOI] [PMC free article] [PubMed] [Google Scholar]
- Danielson SR, Andersen JK. Oxidative and nitrative protein modifications in Parkinson's disease. Free Radic Biol Med. 2008;44:1787–94. doi: 10.1016/j.freeradbiomed.2008.03.005. [DOI] [PMC free article] [PubMed] [Google Scholar]
- Dhahbi JM, Mote PL, Wingo J, Rowley BC, Cao SX, Walford RL, et al. Caloric restriction alters the feeding response of key metabolic enzyme genes. Mech Ageing Dev. 2001;122:1033–48. doi: 10.1016/s0047-6374(01)00230-5. [DOI] [PubMed] [Google Scholar]
- Dhahbi JM, Mote PL, Wingo J, Tillman JB, Walford RL, Spindler SR. Calories and aging alter gene expression for gluconeogenic, glycolytic, and nitrogen-metabolizing enzymes. Am J Physiol. 1999;277:E352–60. doi: 10.1152/ajpendo.1999.277.2.E352. [DOI] [PubMed] [Google Scholar]
- Finley LW, Haas W, Desquiret-Dumas V, Wallace DC, Procaccio V, Gygi SP, et al. Succinate dehydrogenase is a direct target of sirtuin 3 deacetylase activity. PloS one. 2011;6:e23295. doi: 10.1371/journal.pone.0023295. [DOI] [PMC free article] [PubMed] [Google Scholar]
- Gianotti M, Clapes J, Llado I, Palou A. Effect of 12, 24 and 72 hours fasting in thermogenic parameters of rat brown adipose tissue mitochondrial subpopulations. Life Sci. 1998;62:1889–99. doi: 10.1016/s0024-3205(98)00153-2. [DOI] [PubMed] [Google Scholar]
- Gomez J, Caro P, Naudi A, Portero-Otin M, Pamplona R, Barja G. Effect of 8.5% and 25% caloric restriction on mitochondrial free radical production and oxidative stress in rat liver. Biogerontology. 2007;8:555–66. doi: 10.1007/s10522-007-9099-1. [DOI] [PubMed] [Google Scholar]
- Guerrero A, Pamplona R, Portero-Otin M, Barja G, Lopez-Torres M. Effect of thyroid status on lipid composition and peroxidation in the mouse liver. Free Radic Biol Med. 1999;26:73–80. doi: 10.1016/s0891-5849(98)00173-7. [DOI] [PubMed] [Google Scholar]
- Hagopian K, Chen Y, Simmons Domer K, Soo Hoo R, Bentley T, McDonald RB, et al. Caloric restriction influences hydrogen peroxide generation in mitochondrial sub-populations from mouse liver. J Bioenerg Biomembr. 2011;43:227–36. doi: 10.1007/s10863-011-9353-8. [DOI] [PMC free article] [PubMed] [Google Scholar]
- Hagopian K, Harper ME, Ram JJ, Humble SJ, Weindruch R, Ramsey JJ. Long-term calorie restriction reduces proton leak and hydrogen peroxide production in liver mitochondria. Am J Physiol. 2005;288:E674–84. doi: 10.1152/ajpendo.00382.2004. [DOI] [PubMed] [Google Scholar]
- Hagopian K, Ramsey JJ, Weindruch R. Caloric restriction increases gluconeogenic and transaminase enzyme activities in mouse liver. Exp Gerontol. 2003a;38:267–78. doi: 10.1016/s0531-5565(02)00202-4. [DOI] [PubMed] [Google Scholar]
- Hagopian K, Ramsey JJ, Weindruch R. Influence of age and caloric restriction on liver glycolytic enzyme activities and metabolite concentrations in mice. Exp Gerontol. 2003b;38:253–66. doi: 10.1016/s0531-5565(02)00203-6. [DOI] [PubMed] [Google Scholar]
- Hagopian K, Ramsey JJ, Weindruch R. Krebs cycle enzymes from livers of old mice are differentially regulated by caloric restriction. Exp Gerontol. 2004;39:1145–54. doi: 10.1016/j.exger.2004.04.009. [DOI] [PubMed] [Google Scholar]
- Hagopian K, Tomilov AA, Tomilova N, Kim K, Taylor SL, Lam AK, et al. Shc proteins influence the activities of enzymes involved in fatty acid oxidation and ketogenesis. Metabolism. 2012 doi: 10.1016/j.metabol.2012.05.007. [DOI] [PMC free article] [PubMed] [Google Scholar]
- Hagopian K, Weber KL, Hwee DT, Van Eenennaam AL, Lopez-Lluch G, Villalba JM, et al. Complex I-Associated Hydrogen Peroxide Production Is Decreased and Electron Transport Chain Enzyme Activities Are Altered in n-3 Enriched fat-1 Mice. PloS one. 2010:5. doi: 10.1371/journal.pone.0012696. [DOI] [PMC free article] [PubMed] [Google Scholar]
- Huttemann M, Lee I, Samavati L, Yu H, Doan JW. Regulation of mitochondrial oxidative phosphorylation through cell signaling. Biochim Biophys Acta. 2007;1773:1701–20. doi: 10.1016/j.bbamcr.2007.10.001. [DOI] [PubMed] [Google Scholar]
- Justo R, Oliver J, Gianotti M. Brown adipose tissue mitochondrial subpopulations show different morphological and thermogenic characteristics. Mitochondrion. 2005;5:45–53. doi: 10.1016/j.mito.2004.09.003. [DOI] [PubMed] [Google Scholar]
- Koekemoer TC, Oelofsen W. Properties of porcine white adipose tissue and liver mitochondrial subpopulations. Int J Biochem Cell Biol. 2001;33:889–901. doi: 10.1016/s1357-2725(01)00064-4. [DOI] [PubMed] [Google Scholar]
- Laganiere S, Yu BP. Anti-lipoperoxidation action of food restriction. Biochem Biophys Res Commun. 1987;145:1185–91. doi: 10.1016/0006-291x(87)91562-2. [DOI] [PubMed] [Google Scholar]
- Lanni A, Moreno M, Lombardi A, Goglia F. Biochemical and functional differences in rat liver mitochondrial subpopulations obtained at different gravitational forces. Int J Biochem Cell Biol. 1996;28:337–43. doi: 10.1016/1357-2725(95)00137-9. [DOI] [PubMed] [Google Scholar]
- Larsen S, Nielsen J, Hansen CN, Nielsen LB, Wibrand F, Stride N, et al. Biomarkers of mitochondrial content in skeletal muscle of healthy young human subjects. J Physiol. 2012;590:3349–60. doi: 10.1113/jphysiol.2012.230185. [DOI] [PMC free article] [PubMed] [Google Scholar]
- Levine RL, Garland D, Oliver CN, Amici A, Climent I, Lenz AG, et al. Determination of carbonyl content in oxidatively modified proteins. Methods Enzymol. 1990;186:464–78. doi: 10.1016/0076-6879(90)86141-h. [DOI] [PubMed] [Google Scholar]
- Li XD, Rebrin I, Forster MJ, Sohal RS. Effects of age and caloric restriction on mitochondrial protein oxidative damage in mice. Mech Ageing Dev. 2012;133:30–6. doi: 10.1016/j.mad.2011.12.001. [DOI] [PMC free article] [PubMed] [Google Scholar]
- Lombardi A, Damon M, Vincent A, Goglia F, Herpin P. Characterisation of oxidative phosphorylation in skeletal muscle mitochondria subpopulations in pig: a study using top-down elasticity analysis. FEBS Lett. 2000;475:84–8. doi: 10.1016/s0014-5793(00)01633-1. [DOI] [PubMed] [Google Scholar]
- Matamala JC, Gianotti M, Pericas J, Quevedo S, Roca P, Palou A, et al. Changes induced by fasting and dietetic obesity in thermogenic parameters of rat brown adipose tissue mitochondrial subpopulations. Biochem J. 1996;319:529–34. doi: 10.1042/bj3190529. [DOI] [PMC free article] [PubMed] [Google Scholar]
- Moreno M, Puigserver P, Llull J, Gianotti M, Lanni A, Goglia F, et al. Cold exposure induces different uncoupling-protein thermogenin masking/unmasking processes in brown adipose tissue depending on mitochondrial subtypes. Biochem J. 1994;300:463–8. doi: 10.1042/bj3000463. [DOI] [PMC free article] [PubMed] [Google Scholar]
- Musatov A, Robinson NC. Susceptibility of mitochondrial electron-transport complexes to oxidative damage. Focus on cytochrome c oxidase. Free Rad Res. 2012;46:1313–26. doi: 10.3109/10715762.2012.717273. [DOI] [PubMed] [Google Scholar]
- Ramsey JJ, Hagopian K, Kenny TM, Koomson EK, Bevilacqua L, Weindruch R, et al. Proton leak and hydrogen peroxide production in liver mitochondria from energy-restricted rats. Am J Physiol. 2004;286:E31–40. doi: 10.1152/ajpendo.00283.2003. [DOI] [PubMed] [Google Scholar]
- Ryan K, Backos DS, Reigan P, Patel M. Post-translational oxidative modification and inactivation of mitochondrial complex I in epileptogenesis. J Neurosci. 2012;32:11250–8. doi: 10.1523/JNEUROSCI.0907-12.2012. [DOI] [PMC free article] [PubMed] [Google Scholar]
- Seo AY, Joseph AM, Dutta D, Hwang JC, Aris JP, Leeuwenburgh C. New insights into the role of mitochondria in aging: mitochondrial dynamics and more. J Cell Sci. 2010;123:2533–42. doi: 10.1242/jcs.070490. [DOI] [PMC free article] [PubMed] [Google Scholar]
- Shinmura K, Tamaki K, Sano M, Nakashima-Kamimura N, Wolf AM, Amo T, et al. Caloric restriction primes mitochondria for ischemic stress by deacetylating specific mitochondrial proteins of the electron transport chain. Circ Res. 2011;109:396–406. doi: 10.1161/CIRCRESAHA.111.243097. [DOI] [PubMed] [Google Scholar]
- Trounce IA, Kim YL, Jun AS, Wallace DC. Assessment of mitochondrial oxidative phosphorylation in patient muscle biopsies, lymphoblasts, and transmitochondrial cell lines. Methods Enzymol. 1996;264:484–509. doi: 10.1016/s0076-6879(96)64044-0. [DOI] [PubMed] [Google Scholar]
- Venditti P, Costagliola IR, Di Meo S. H2O2 production and response to stress conditions by mitochondrial fractions from rat liver. J Bioenerg Biomembr. 2002;34:115–25. doi: 10.1023/a:1015175925756. [DOI] [PubMed] [Google Scholar]
- Venditti P, De Rosa R, Caldarone G, Di Meo S. Functional and biochemical characteristics of mitochondrial fractions from rat liver in cold-induced oxidative stress. Cell Mol Life Sci. 2004;61:3104–16. doi: 10.1007/s00018-004-4308-4. [DOI] [PubMed] [Google Scholar]
- Venditti P, Di Meo S, De Leo T. Effect of Thyroid State on Characteristics Determining the Susceptibility to Oxidative Stress of Mitochondrial Fractions from Rat Liver. Cell Physiol Biochem. 1996;6:283–95. [Google Scholar]


