

Abstract
Background
Surgical treatment of peripheral artery disease, even if successful, does not prevent reoccurrence. Under these conditions, increased oxidative stress is a crucial determinant of tissue damage. Given its reported antioxidant effects, we investigated the potential of unacylated‐ghrelin (UnAG) to reduce ischemia‐induced tissue damage in a mouse model of peripheral artery disease.
Methods and Results
We show that UnAG but not acylated ghrelin (AG) induces skeletal muscle regeneration in response to ischemia via canonical p38/mitogen‐actived protein kinase signaling UnAG protected against reactive oxygen species–induced cell injuries by inducing the expression of superoxide dismutase‐2 (SOD‐2) in satellite cells. This led to a reduced number of infiltrating CD68+ cells and was followed by induction of the myogenic process and a reduction in functional impairment. Moreover, we found that miR‐221/222, previously linked to muscle regeneration processes, was up‐regulated and negatively correlated with p57Kip2 expression in UnAG‐treated mice. UnAG, unlike AG, promoted cell‐cycle entry in satellite cells of mice lacking the genes for ghrelin and its receptor (GHSR1a). UnAG‐induced p38/mitogen‐actived protein kinase phosphorylation, leading to activation of the myogenic process, was prevented in SOD‐2–depleted SCs. By siRNA technology, we also demonstrated that SOD‐2 is the antioxidant enzyme involved in the control of miR‐221/222–driven posttranscriptional p57Kip2 regulation. Loss‐of‐function experiments targeting miR‐221/222 and local pre–miR‐221/222 injection in vivo confirmed a role for miR‐221/222 in driving skeletal muscle regeneration after ischemia.
Conclusions
These results indicate that UnAG‐induced skeletal muscle regeneration after ischemia depends on SOD‐2–induced miR‐221/222 expression and highlight its clinical potential for the treatment of reactive oxygen species–mediated skeletal muscle damage.
Keywords: miRNAs, ROS, satellite cells, superoxide dismutase‐2, UnAG
Introduction
Peripheral artery disease (PAD) is a widespread condition caused by atherosclerosis of the peripheral arteries.1 Diabetes and obesity are major risk factors for PAD and its associated complications.2 Although surgical or endovascular intervention remains the standard therapy to improve blood flow,3 even after successful revascularization, most patients complain of persistent or recurring symptoms.4 Consequently, in an aging population with an increasingly high incidence of metabolic disease, new treatment options for PAD represent a major unmet need.
In PAD, reduced blood supply to the ischemic limb leads to skeletal muscle injury.5 In response to tissue damage, resident stem cells, the satellite cells (SCs), are recruited and participate in regenerative processes.6 On ischemia, SCs undergo asymmetric division7 that gives rise to cells that enter the cell‐cycle via p38/mitogen‐activated protein kinase (MAPK) activation and myogenic differentiation antigen D (MyoD) induction8 and daughter cells that lack p38/MAPK‐mediated signals and refill the SC pool.9 In addition to the role of MyoD and the regulatory myogenic factor 5 (Myf5), posttranscriptional regulation, involving small noncoding micro‐RNAs (miRs), is known to play a role in skeletal muscle regeneration.10–12 Different families of miRs, including miR‐221/222, have been shown to be involved in the control of a complex network of genes during myogenesis.13–14
Changes in local oxygen availability in PAD result in increased numbers of dysfunctional mitochondria.5,15 Defective mitochondrial electron transfer chain and increased reactive oxygen species (ROS) generation are crucial determinants of oxidative damage and impaired cellular functions16–19 that ultimately lead to muscle damage.20 Interestingly, superoxide dismutase‐2 (SOD‐2), the initial line of defense against ROS in the mitochondria, is deficient in PAD muscles.5 Consistent with this observation, antioxidant administration ameliorates skeletal muscle mitochondrial dysfunction and functional recovery in humans.21 Thus, molecules that exert protective effects against oxidative stress might represent an alternative therapeutic strategy to preserve skeletal muscle function in PAD.
In this study, we investigate the potential therapeutic use of unacylated ghrelin (UnAG) for the treatment of PAD. Ghrelin is present in the circulation in both acylated (AG) and unacylated (UnAG) forms.22 The term “ghrelin” has traditionally been used to refer only to AG, which has been considered the only active peptide form. It binds to the Gq‐coupled growth hormone (GH) secretagogue receptor type 1a (GHSR1a)23 and mediates GH‐releasing properties and other significant neuroendocrine actions.24 In contrast, UnAG does not bind to GHSR1a and lacks GH‐secretagogue activity.24 AG and UnAG have been shown to exert effects on muscle and vascular cell differentiation through a common receptor.25–27 However, clinical studies have shown that UnAG and AG exhibit opposing metabolic actions.28–29 Similarly, UnAG and AG induce different biological responses in neonatal mouse and rat cardiomyocytes,30 and only UnAG protects endothelial progenitor cells from oxidative stress by avoiding ROS generation.31–32 This protective effect occurs via a receptor not shared with AG.31 Thus, clinical28–29 and experimental30–31 data suggest the existence of an additional unidentified receptor for UnAG. Here, we evaluated the effects of UnAG and AG on skeletal muscle regeneration in a mouse model of PAD.
Methods
Reagents were obtained as follows. Collagen I, collagenase II, FCS, FBS, RNase, propidium iodide, SDS, PIPES, Triton X‐100, Nonidet P‐40, NaCl, NaF, NaOV4, Na4P2O7, MgCl2, KCl, HCl, Na‐azide, Tris, EDTA, EGTA, ethanol, aprotinin, PMSF, DTT, leupeptin, penicillin‐streptomycin, HEPES, tribromoethylalcohol (Avertin), barium chloride (BaCl2), chicken embryo extract (CEE), RPMI, and DAPI were from Sigma‐Aldrich. Collagenase/dispase was from Roche. Protein molecular weight markers, acrylammide, and polyvinylidene difluoride (PVDF) membranes were from Bio‐Rad. Gene Ruler DNA Ladder Mix and Gene Ruler DNA Ladder Plus were from Fermentas International Inc. Nylon mesh cell strainer (100 μm, 70 μm, 40 μm) was from BD Bioscience Pharmingen. SB202190, p38/MAPK substrate inhibitor, and Akt inhibitor VI (TCL110‐24, H‐AVTDHPDRLWAWEKF‐OH) were from Calbiochem. c‐Met inhibitor (Crizotinib) was from Selleck Chemicals. AG and UnAG were from Phoenix Pharmaceuticals. D‐PBS, Optifect, Lipofectin Reagent, TRIzol, DMEM, and DCF‐DA were from Invitrogen (Life Technologies). Antibodies were obtained as follows. Monoclonal anti‐PCNA was from Abcam. Anti‐CD31 and ‐CD68 were from BD Bioscience Pharmingen. Anti‐MyoD, anti‐p57Kip2, anti‐p27Kip1, anti–SOD‐2, anti‐myogenin, anti‐Myf5, anti‐p38/MAPK, anti–Pax‐7, and anti–Pax‐3 were from Santa Cruz Biotechnology. Anti–phospho‐p38/MAPK, anti–phospho Akt, anti‐Akt, anti‐rabbit IgG, HRP linked, and anti‐mouse IgG, HRP linked, were from Cell Signaling. Anti–α‐actin, anti‐tubulin, and anti‐mouse, ‐rabbit, and ‐goat IgG‐FITC and ‐PE were from Sigma‐Aldrich.
Murine Hindlimb Ischemia Model
Male C57BL/6J mice (Charles River Laboratories International Inc) were anesthetized by intra‐peritoneal administration of tribromoethanol (Avertin) (375 to 425 mg/kg), and unilateral hindlimb ischemia was induced as described.33 The entire femoral artery and vein of the right hindlimb were exposed and isolated (inguinal ligament to its bifurcation into saphenous and popliteal artery). Exposed vessels were ligated at their proximal and distal ends (poplitea ramification), and both vessels were excised. The normo‐perfused contralateral limb of each mouse was used as an internal control.
After hindlimb ischemia, animals (27 mice per group) were treated via intraperitoneal injection daily from days 0 to 21 with either saline, AG (100 μg/kg), or UnAG (100 μg/kg). In selected experiments, C57BL/6J mice received intramuscular injections of pre‐miR oligonucleotides (5 mice/group), and Balb/c mice (Charles River Labs; 3 mice/group) were treated via daily intraperitoneal injection with either saline, AG (100 μg/kg), or UnAG (100 μg/kg) from days 0 to 21 after the induction of ischemia. To induce toxic damage, 100 μL of 1% BaCl2 was injected unilaterally into the hindlimb at day 0 (9 mice), and the mice were killed 48 hours later. Within each group, some animals were killed at days 1, 3, 5, and 7 and the remainder at day 21. Gastrocnemius muscles were dissected and processed as described here later. Mice were treated according to European guidelines and policies as approved by the University of Turin Ethical Committee.
Laser Doppler Perfusion Imaging
Mice were anesthetized as described here, and hair was removed using an electric shaver. Serial, noninvasive assessment of ischemic limb microvascular perfusion was performed in triplicate and in a blinded manner using the laser Doppler Perfusion Imaging system (PIM3; Perimed). Identical regions, equal in area, encompassing the distal leg (entire foot) of both ischemic and contralateral, nonischemic limbs were assessed for quantification of perfusion using the laser Doppler perfusion imaging processing software (version 5.0).
In Vivo Assessment of Limb Function
Semiquantitative estimation of foot damage (by repeated‐measures ANOVA and Newman–Keuls multiple‐comparisons test) was performed serially using the following classification: 3=dragging of foot (foot necrosis), 2=no dragging but no plantarflexion (foot damage), 1=plantarflexion but no toe flexion (toe damage), and 0=flexing the toes to resist gentle traction on the tail (no damage).34
Histological and Immunofluorescence Analysis
Gastrocnemius muscles were recovered from ischemic and normo‐perfused limbs of treated animals, fixed in 10% formalin, and embedded in paraffin. Tissue sections (5 μm) were stained with hematoxylin and eosin for histological analysis. The proportion of fibers with central nuclei (regenerating fibers) was counted in the injured area and the cross‐sectional areas of the fibers in the injured and noninjured areas. Measurements were obtained using the MetaMorph software (Life Sciences Research Imaging Systems). For immunofluorescence assay, muscle sections were processed as described previously35 using anti‐CD68, anti–SOD‐2, anti‐myogenin, anti‐MyoD, anti‐CD31, and anti–Pax‐7 antibodies. DAPI was used as a nuclear marker. To quantify cells expressing the indicated markers, positive cells were counted in 10 randomly selected fields in 5 different samples (×40 magnification). The number of CD31+ vessels was evaluated by counting 10 randomly selected fields in 3 different samples (×40 magnification). Images were acquired with a Zeiss LSM 5 Pascal confocal laser‐scanning microscope (Carl Zeiss) equipped with a helium/neon laser (543 mm), an argon laser (450 to 530 mm), and an EC planar Neofluar ×40/1.3 oil‐immersion differential interference contrast objective lens. Images were analyzed using Zeiss LSM 5 version 3.2 software.35
Cell Cultures and In Vitro Ischemia
SCs were isolated from gastrocnemius muscles subjected to ischemia. In selected experiments, SCs were also recovered from 10‐ to 12‐week‐old male C57BL/6J mice lacking the GH secretagogue receptor 1 and ghrelin genes (double‐knockout mice) (10 mice, the kind gift of Professor M. Tschöp).36 To obtain SCs, muscle samples were subjected to enzymatic digestion using collagenase type II (0.1 mg/mL) in DMEM for 20 minutes at 37°C and then collagenase/dispase (1 mg/mL) in DMEM for 30 minutes at 37°C, as described previously.37 After centrifugation at 30 g at 4°C for 10 minutes, the pellet was washed with DMEM and recentrifuged at 160 g at 4°C for 10 minutes. The pellet was then passed through a graduated series of nylon mesh cell strainers (100, 70, and 40 μm) to separate mononuclear cells from muscle fibers and myofibril fragments. The resulting supernatants were centrifuged at 160 g for 10 minutes and cells were preplated for 1 hour in a humidified CO2 incubator at 37°C to remove fibroblasts, as described elsewhere.37 This adhering/detachment procedure was repeated twice to remove residual fibroblasts. Purified SCs were then plated at 2.5×10⁴ cells/cm2 and cultured on collagen I–coated dishes with DMEM supplemented with 20% FBS, 3% chick embryo extract, 1% penicillin‐streptomycin, and HEPES (10 nmol/L). Murine C2C12 cells (Istituto Zooprofilattico Sperimentale della Lombardia e dell'Emilia) were cultured in DMEM supplemented with 10% FBS, 1% penicillin‐streptomycin. COS‐7 cells were cultured in RPMI supplemented with 10% FBS, 1% penicillin‐streptomycin. In selected experiments, SCs, recovered from normo‐perfused muscles, and COS‐7 and C2C12 cells were treated for 3 days with saline, AG (1 μmol/L), or UnAG (1 μmol/L), or with the retro‐des‐acyl ghrelin peptide (1–14),32 which was used as a negative control (1 μmol/L, scramble peptide). At day 4, cells were subjected to in vitro ischemia. In vitro ischemia was induced by incubating cells in DMEM+2% FCS at 5% CO2/95% N2 humidified atmosphere, yielding 1% O2 concentrations for 24 hours.18 Where indicated, in vitro ischemia was also performed in the presence of the specific inhibitor of p38/MAPK SB202190 (1 μmol/L), the specific Akt inhibitor TCL110‐24 (100 nmol/L), or Crizotinib (1 μmol/L),38 an inhibitor of mesenchymal‐epidermal transition (c‐Met) receptor tyrosine kinase. Crizotinib was added to SCs 1 day before the indicated treatments.
Cell‐Cycle Progression and Proliferation
Cell‐cycle progression of SCs was evaluated by FACS analysis, as described previously.39 The percentage of cells in each cell‐cycle phase was determined using ModFit LT software (Verity Software House, Inc). Cell proliferation was also assayed by evaluating the percentage of PCNA+ cells by FACS analysis.
Western Blot Analysis
Cells were lysed (50 mmol/L Tris‐HCl [pH 8.3], 1% Triton X‐100, 10 mmol/L PMSF, 100 U/mL aprotinin, 10 μmol/L leupeptin) and protein concentrations were obtained as previously described.40 Proteins (50 μg) were subjected to SDS‐PAGE, transferred onto nitrocellulose membranes, blotted with the indicated antibodies, and revealed using an enhanced chemiluminescence detection system (ECL). Densitometric analysis was used to calculate the differences in the fold induction of protein levels and normalized to tubulin, α‐actin, Akt, or p38MAPK content. Values are reported as relative amount.
Oxidative Stress Measurement
Intracellular ROS production was evaluated using the DCF‐DA (5‐ [and 6‐]carboxy‐2′,7′‐dichlorofluorescein diacetate, 0.5 μmol/L final concentration; Molecular Probe, Invitrogen) assay. The majority of experiments were performed after 2 hours of the indicated treatments, as previously described.31 Thiobarbituric acid reactive substances (TBARS) were evaluated to measure in vivo oxidative stress levels in gastrocnemius muscles. The formation of TBARS was determined using the OXI‐TEK kit (ZeptoMetrix Corp) and a luminescence spectrometer (Bio‐Rad Laboratories) with excitation set at 530 nm and emission at 550 nm.19
RNA Isolation and Quantitative Real‐Time PCR (qRT‐PCR) for miRNAs
Total RNA was isolated using TRIzol reagent (Invitrogen) from SCs recovered from the muscles of treated animals or from SCs subjected to in vitro ischemia. The RNA was then reverse‐transcribed using a TaqMan microRNA RT kit specific for miR‐221 and miR‐222, and subjected to quantitative real‐time PCR using TaqMan microRNA assay kit and the ABI PRISM 7700 sequence detection system (Applied Biosystems).41 Expression of miRNAs was normalized to the small nuclear RNA RNU6B. Loss‐of‐function experiments were performed in saline‐ or UnAG‐treated SCs transfected for 48 hour with anti‐miRNA negative control, anti–miR‐221, or anti–miR‐222 antagonists (Applied Biosystem), according to the manufacturer's instructions.41
SOD‐2 Silencing by Small Interfering RNAs
To obtain SOD‐2 inactivation, SCs were transiently transfected with small interfering RNA (siRNA) for SOD‐2 or with duplex siRNAs (Qiagen) and treated as indicated. Transfection was performed according to the manufacturer's instructions. Whole cell extracts were processed 48 hours after transfection. Cell viability was evaluated at the end of each experiment.35
Luciferase miRNA Target Reporter Assay
The luciferase reporter assay was performed using a construct generated by subcloning the PCR products amplified from the full‐length 3′‐UTR of p57Kip2 DNA into the SacI restriction site of the luciferase reporter vector pmiR (Ambion, Applied Biosystem). The PCR products were obtained using the following primers: p57Kip2: sense, 5′‐TTGAGCTCCCCTTCTTCTCGCTGTCCTCT‐3′; antisense, 5′‐AAGAGCTCCTCTTTGGGCTCTAAATTGGC‐3′. The insert identities were verified by sequencing. The pmiR empty vector and pmiR‐3′‐UTR p57Kip2 reporter vector were transiently co‐transfected in SCs subjected to in vitro ischemia and treated as indicated at a 30:1 molar ratio with the pRL vector, coding for the Renilla luciferase, used as an internal control for the luciferase assay.40
In Vivo Gain‐of‐Function Analysis
To evaluate the effects of miR‐221/222 expression in vivo, a combination of pre–miR‐221 and pre–miR‐222 or pre‐miR negative control (50 μL of 50 nmol/L stock solution of pre‐miR oligonucleotides added to 12 μL of Optifect [Invitrogen]) was injected directly into the ischemic gastrocnemius muscle of C57BL/6J mice. Pre‐miRs or controls were administered 3 times a week. At day 7, animals were killed, and tissues were recovered and processed as described earlier for histological analysis. SCs were also isolated and evaluated by Western blot for the indicated markers and by quantitated real‐time PCR for miRNA expression.
Statistical Analysis
All data are presented as mean±SEM. The D'Agostino–Pearson test was used to test normality. Data on blood perfusion, damage score, number of vessels, percentage of regenerating fibers, inflammatory cells, recovery of SCs, Pax7/MyoD co‐localization, TBARS, miR‐221/222, and p57Kip2/p27Kip1 expression from ischemic and nonischemic limbs of treated mice at days 7 and 21 were analyzed by using the 2‐way ANOVA followed by the post‐hoc test with Bonferroni correction for multiple comparison. Data on myogenin expression, ROS generation, Pax‐7/SOD‐2 co‐localization, percentage of cell‐cycle phases, PCNA expression, luciferase assay, and miR‐221/222 expression in in vitro or in gain‐of‐function experiments were analyzed with 1‐way ANOVA followed by Tukey's multicomparison post‐hoc test. Data on densitometric analysis for Western blots were analyzed by Student t test for 2‐group comparison and by 1‐way ANOVA, followed by Tukey's multiple comparison test for ≥3 groups.
The cut‐off for statistical significance was set up at P<0.05 (*P<0.05, **P<0.01, ***P<0.001). All statistical analyses were carried out with GraphPad Prism version 5.04 (Graph Pad Software, Inc).
Results
UnAG Protects Skeletal Muscles Against Ischemia‐Induced Functional Impairment
Unilateral hindlimb ischemia, which mimics critical limb ischemia (CLI) in humans, was induced in C57BL/6J mice, and mice were treated daily with saline, AG, or UnAG, beginning at day 0 and ending at day 21. Laser Doppler perfusion imaging was performed at the indicated days after surgery. There were no significant differences among treatment groups in large‐vessel reperfusion (Figure 1A). However, when a functional score was applied, the damage was significantly higher in saline‐ and AG‐treated groups than in the UnAG‐treated group even at days 1, 3, and 5 (Figures 1B and 2A). Similar results were obtained in Balb/c mice (data not shown).
Figure 1.

UnAG protects against ischemia‐mediated functional impairment in skeletal muscle. A, Histogram representation of limb perfusion reported as ratio (mean±SEM, n=27 for each group) of ischemic to normal hindlimb for each group of mice (0b: before surgery; 0a: after surgery; ***P<0.001 ischemic limb vs normal limb). B, Foot damage score was evaluated for the indicated times as reported in Methods. Data are expressed as mean±SEM, n=27 (***P<0.001 ischemic limb of UnAG mice vs ischemic limb of AG and saline mice). C, The graph represents the number of vessels in ischemic (ih) and normo‐perfused (nh) gastrocnemius muscles of each group of animals, evaluated by 3 different operators counting 10 fields at ×40 magnification and are reported as mean±SEM (n=9 each group at day 7 and at day 21) of vessels per field (***P<0.001 ih muscles of UnAG mice vs ih muscles of AG and saline mice at days 7 and 21). D, Representative hematoxylin and eosin–stained sections of ischemic and normo‐perfused (normal) muscles from UnAG‐, AG‐, and saline‐treated mice, at days 7 and 21 post surgery. Scale bar: 80 μm (×20 magnification). Insets show myofibers at higher magnification; green arrows indicate regenerating myofibers, characterized by central nucleus location at days 7 and 21 in UnAG mice. E, Quantification of the percentage (mean±SEM) of regenerating fibers, characterized by the presence of centrally located nucleus. UnAG‐, AG‐, and saline‐treated mice were analyzed at days 7 and 21 postsurgery (***P<0.001 ischemic muscles of UnAG‐treated mice vs AG‐ and saline‐treated mice at days 7 and 21; normal muscles vs ischemic muscles of treated mice). F, Quantification of inflammatory cells in the ischemic and normal muscles of UnAG‐, AG‐, and saline‐treated mice, at days 7 and 21 postsurgery. Data are expressed as mean±SEM of CD68+ cells per field (×40 magnification) (***P<0.001 ischemic muscles of AG‐ and saline‐ vs UnAG‐treated mice at days 7 and 21; normal muscles vs ischemic muscles of treated mice). E and F: n=9 each group at day 7 and at day 21. AG indicates acylated ghrelin; UnAG, unacylated ghrelin.
Figure 2.

Effects of UnAG and AG at days 1, 3, and 5 after ischemia. A, Foot damage score of treated mice was evaluated for the indicated times. Data are expressed as mean±SEM (n=3 each group at days 1, 3, and 5) (***P<0.001 ischemic limb of UnAG‐ vs AG‐ and saline‐treated mice). B, Representative hematoxylin and eosin–stained sections of ischemic muscles from UnAG‐, AG‐, and saline‐treated mice at days 1, 3, and 5 post surgery. Scale bar: 80 μm (×20 magnification). Black arrows indicate the inflammatory infiltrates. C, Sections of ischemic muscles recovered from treated mice at days 3 and 5 post surgery and stained for Pax‐7 (green), MyoD (red), and DAPI (blue). Yellow arrows indicate Pax‐7+/MyoD+ cells. Scale bar: 40 μm (×40 magnification). Quantification of Pax‐7+/MyoD+ cells per field (×40 magnification) in ischemic limb of treated mice is reported (mean±SEM (n=3 each group at days 3 and 5) (***P<0.001 Pax‐7+/MyoD+ cells in UnAG‐ vs AG‐ and saline‐treated mice at day 5). AG indicates acylated ghrelin; UnAG, unacylated ghrelin.
To assess whether these functional differences were due to differences in tissue reperfusion, the number of vessels was counted in ischemic muscles of treated animals at different intervals. UnAG‐treated mice had a larger number of functional vessels compared with the other groups (Figures 1C and 3). Furthermore, ischemic muscles from AG‐ and saline‐treated mice had a significantly lower capillary density than in contralateral control muscles from the same animals, whereas no such differences were observed in UnAG‐treated animals (Figure 1C). This effect was already evident at day 3 and 5 (data not shown). Analysis of tissue regeneration in gastrocnemius muscles revealed that muscles from UnAG‐treated mice contained an increased number of regenerating myofibers starting from day 7 (Figures 1D, 1E, and 2B). In addition, those mice had a reduced number of CD68+ inflammatory cells throughout the treatment (Figures 1F and 4). No changes were observed in the numbers of regenerating fibers or CD68+ inflammatory cells in normo‐perfused muscles (Figure 1D through 1F). Thus, in our model, UnAG but not AG appears to protect against ischemia‐induced damage.
Figure 3.
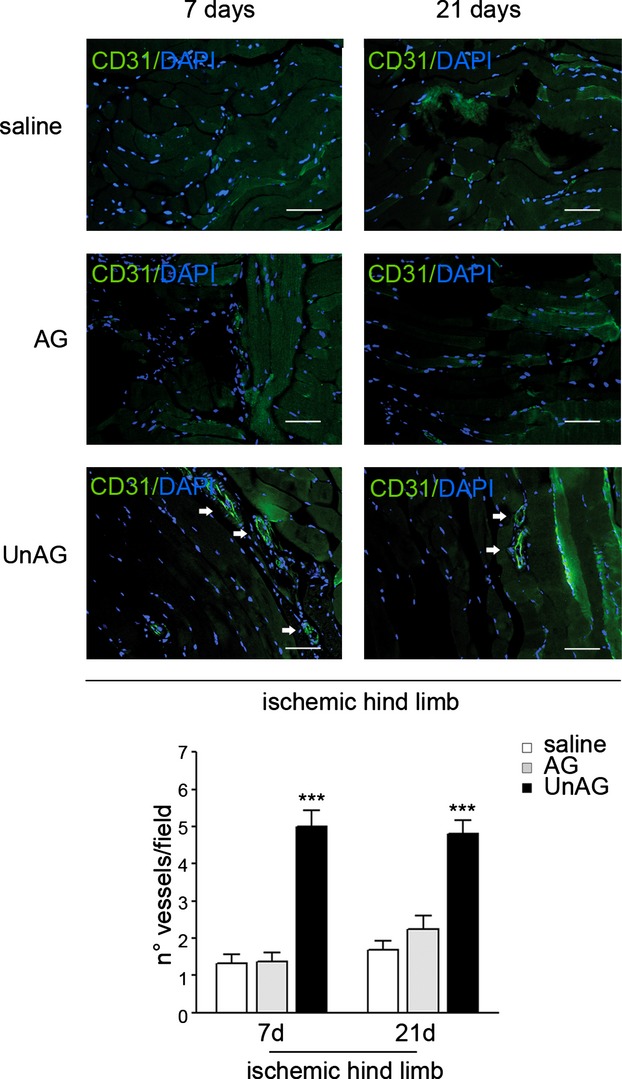
Vessel quantification. Sections of ischemic muscles recovered from saline‐, AG‐, and UnAG‐treated mice at days 7 and 21 post surgery and stained for CD31 (green) and DAPI (blue). White arrows indicate vessels. Scale bar: 40 μm (×40 magnification). The graph represents the number of vessels in ischemic muscles of each group of animals, evaluated by 3 different operators counting 10 fields at ×40 magnification, and reported as mean±SEM (n=9 each group at day 7 and at day 21) of vessels per field (***P<0.001 ischemic muscles of UnAG‐ vs AG‐ and saline‐treated mice at days 7 and 21). AG indicates acylated ghrelin; UnAG, unacylated ghrelin.
Figure 4.
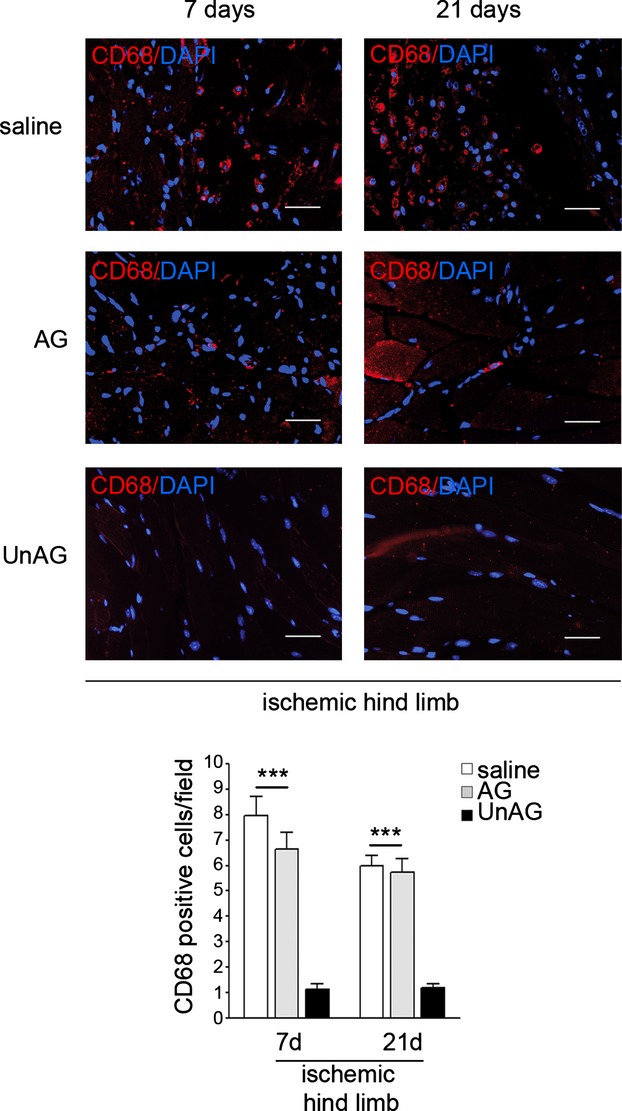
Inflammatory cell infiltration. Sections of ischemic muscles recovered from saline‐, AG‐, and UnAG‐treated mice at days 7 and 21 post surgery and stained for CD68 (red) and DAPI (blue). Scale bar: 40 μm (×40 magnification). Quantification of inflammatory cells in the ischemic muscles from UnAG‐, AG‐, and saline‐treated mice, at days 7 and 21 post surgery. Data are expressed as mean±SEM (n=9 each group at day 7 and at day 21) of CD68+ cells per field (×40 magnification) (***P<0.001 ischemic muscles of AG‐ and saline‐ vs UnAG‐treated mice at days 7 and 21). AG indicates acylated ghrelin; UnAG, unacylated ghrelin.
UnAG Increases the Number of Pax‐7/MyoD–Positive Cells
Skeletal muscle regeneration in vivo depends on the expansion and differentiation of SCs9 coexpressing Pax‐7 and MyoD. Thus, the number of cells expressing both Pax‐7 and MyoD was evaluated at different intervals. Small numbers of double‐positive cells were already detectable at day 5 in UnAG mice (Figure 2C). This effect was much more evident at day 7. In fact, at day 7 ischemic muscles from UnAG‐treated mice had an increased number of Pax‐7+/MyoD+ cells compared with ischemic muscles from AG‐treated and control mice (Figure 5A and 5B). At day 21, scattered Pax‐7+/MyoD+ cells were still present in ischemic muscles from UnAG‐ but not AG‐ or saline‐treated mice (Figures 5A, 5B, and 6). To evaluate in vivo data, SCs were isolated and counted (Figure 5C). This ex vivo evaluation revealed a significantly increased number of Pax‐7+/MyoD+ SCs in UnAG‐treated mice compared with AG‐ and saline‐treated animals (Figure 5C through 5E) at day 7. Besides Pax‐7, Pax‐342–43 was expressed in SCs recovered from UnAG‐ but not AG‐ or saline‐ treated mice (Figure 5D). Consistent with previous reports indicating that SC proliferation depends on p38/MAPK activation,8–9 levels of phospho(p)‐p38/MAPK protein at day 7 were found to be higher in SCs from UnAG‐treated mice than in those from saline‐ or AG‐treated groups (Figure 5D). Myf5 was also expressed at day 7 in SCs from UnAG mice. In addition, the presence of a few MyoD+/myogenin+ cells was detectable in ischemic muscles from UnAG‐treated mice at day 7 (Figure 5F). Double‐positive cells were almost undetectable at day 21. At day 21, the majority of cells were MyoD−/myogenin+ (Figure 5F and 5G). Scattered Pax‐7+/MyoD−cells were detected in normo‐perfused muscles in all groups (data not shown).
Figure 5.
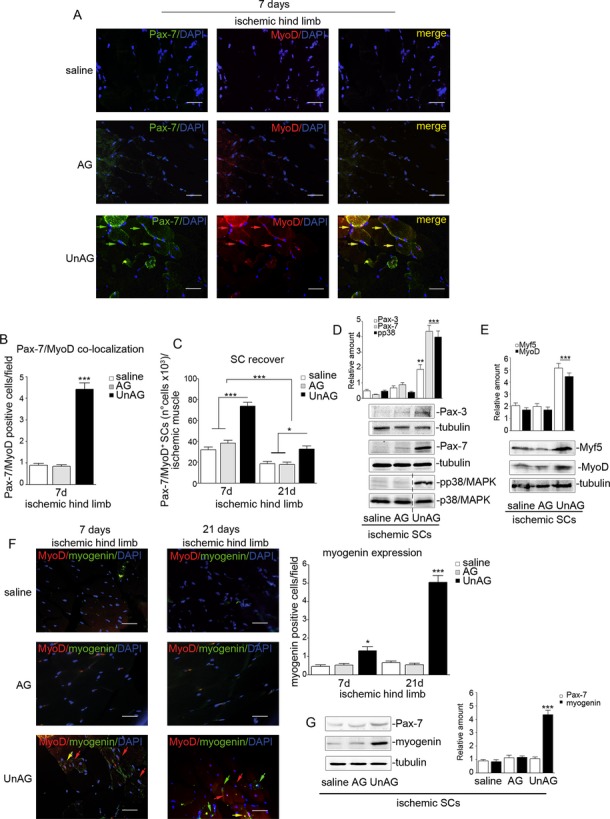
UnAG activates the myogenic process. A, Representative sections of ischemic muscles recovered from saline‐, AG‐, and UnAG‐treated mice stained for Pax‐7 (green), MyoD (red), and DAPI (blue). Yellow arrows indicate Pax7+/MyoD+ cells. Scale bar: 40 μm (×40 magnification). B, Quantification of Pax‐7+/MyoD+ cells in ischemic muscles at day 7. Data are expressed as mean±SEM of Pax‐7+/MyoD+ cells per field (×40 magnification) (***P<0.001 ischemic muscles from UnAG‐ vs AG‐ and saline‐treated mice at day 7). C, Number (mean±SEM) of Pax‐7+/MyoD+ SCs recovered from ischemic muscles of treated mice, at days 7 and 21 post surgery (*P<0.05 SCs from UnAG‐ vs AG‐ and saline‐treated mice at day 21; ***P<0.001 SCs from UnAG‐ vs AG‐ and saline‐treated mice at day 7; ***P<0.001 SCs from treated mice at day 7 vs day 21). D and E, Cell extracts from SCs recovered from ischemic muscles at day 7 were analyzed by Western blot for Pax‐3, Pax‐7, and phospho(p)‐p38/MAPK (D) or for Myf5 and MyoD content (E). Protein levels were normalized to tubulin or p38/MAPK content (**P<0.01 Pax‐3 content in ischemic SCs from UnAG‐ vs AG‐ and saline‐treated mice; ***P<0.001 Pax‐7 and p‐p38/MAPK content in ischemic SCs from UnAG‐ vs AG‐ and saline‐treated mice; ***P<0.001 Myf5 and Myo‐D content in ischemic SCs from UnAG‐ vs AG‐ and saline‐treated mice). F, Sections of ischemic muscles stained for MyoD (red), myogenin (green), and DAPI (blue) recovered from treated mice at days 7 and 21 post surgery. Red arrows indicate MyoD+ cells, green arrows indicate myogenin+ cells, and yellow arrow indicates MyoD+/myogenin+ cells. Scale bar: 40 μm (×40 magnification). Quantification of myogenin+ cells per field (×40 magnification) in ischemic limb of treated mice is reported (mean±SEM) (*P<0.05 myogenin+ cells in UnAG‐ vs AG‐ and saline‐treated mice at day 7; ***P<0.001 myogenin+ cells in UnAG‐ vs AG‐ and saline‐treated mice at day 21). G, Pax‐7 and myogenin content was evaluated by Western blot in SCs from ischemic muscles of treated animals (day 21). Protein level was normalized to tubulin content (***P<0.001 myogenin content in SCs from ischemic muscles of UnAG‐ vs AG‐ and saline‐treated mice). Results are representative of all experiments. A, B, C, and F, n=9 each group at days 7 and 21; D and E, n=9 each group at day 7; G, n=9 each group at day 21. AG indicates acylated ghrelin; SC, satellite cell; MAPK, mitogen‐activated protein kinase; UnAG, unacylated ghrelin.
Figure 6.

Pax‐7 and MyoD co‐localization at day 21 after ischemia. Sections of ischemic muscle recovered from saline‐, AG‐, and UnAG‐treated mice at day 21 post surgery and stained for Pax‐7 (green), MyoD (red), and DAPI (blue). Yellow arrows indicate merged Pax7+/MyoD+ cells. Scale bar: 40 μm (×40 magnification). Quantification of Pax7+/MyoD+cells in ischemic muscles of treated animals at day 21 is reported. Data are expressed as mean±SEM (n=9 each group at day 7 and at day 21) of Pax7+/MyoD+ cells per field (×40 magnification) (***P<0.001 ischemic muscles of UnAG‐ vs AG‐ and saline‐treated mice at day 21). AG indicates acylated ghrelin; UnAG, unacylated ghrelin.
UnAG Induces SOD‐2 Expression in SCs Subjected to Ischemia
Increased ROS production and decreased antioxidant response seem to be crucial determinants of tissue damage in ischemic conditions.5 Thus, TBARS were first evaluated in ischemic muscles. Significant increases in the concentration of TBARS were observed in AG‐ and saline‐ but not UnAG‐treated muscles (Figure 7A). These data suggest that UnAG may exert its biological effects by inducing an efficient antioxidant response. Since the mitochondria‐specific antioxidant enzyme SOD‐2 is known to be diminished in patients with PAD,5 we analyzed SOD‐2 expression and ROS content in SCs isolated from different groups. We found that ROS production was lower and SOD‐2 protein expression higher in SCs from UnAG‐treated mice than in SCs from AG‐ or saline‐treated animals (Figure 7B and 7C). Furthermore, double immunostaining of ischemic muscles from UnAG‐treated mice revealed an increased number of SOD‐2+/Pax‐7+ cells compared with AG‐treated mice and controls (Figure 7D).
Figure 7.
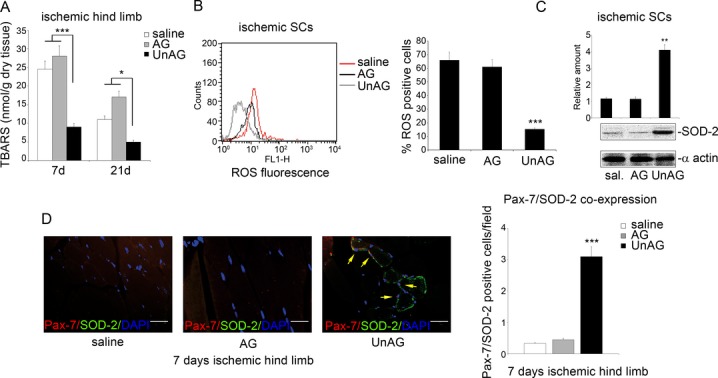
UnAG prevents ROS production in SCs by inducing SOD‐2 expression. A, TBARS were determined in gastrocnemius muscle of UnAG‐, AG‐, and saline‐treated mice at days 7 and 21 after ischemia. Values are expressed as nanomoles per gram of dry tissue (mean±SEM, n= 6 each group at days 7 and 21) (***P<0.001 ischemic muscle of UnAG‐treated mice vs AG‐ and saline‐treated mice at day 7; *P<0.05 ischemic muscle of UnAG‐treated mice vs AG‐ and saline‐treated mice at day 21). B, To evaluate ROS generation, DCF‐DA assay was performed on SCs recovered from muscles of UnAG‐, AG‐, and saline‐treated mice at day 7 after ischemia. The percentage of DCF‐DA+ cells (mean±SEM, n=6 each group) is reported (***P<0.001 ROS generation in ischemic muscles from UnAG‐ vs AG‐ and saline‐treated mice). C, SCs recovered from ischemic muscles of treated mice were subjected to Western blot normalized to α‐actin content; SOD‐2 content was evaluated. The results are representative of all experiments (n=6 each group) (***P<0.001 ischemic SCs from UnAG‐ vs AG‐ and saline‐treated mice). D, Representative stained sections for Pax‐7 (red), SOD‐2 (green), and DAPI (blue) of muscles recovered at day 7 after ischemia. Yellow arrows indicate Pax7+/SOD‐2+ cells. Scale bar: 40 μm (×40 magnification). Quantification of Pax‐7+/SOD‐2+ cells per field (×40 magnification) in ischemic muscles of treated mice is reported in the histogram (mean±SEM, n=9 each group) (***P<0.001 UnAG treatment vs AG and saline treatment at day 7). AG indicates acylated ghrelin; DCF‐DA, 5‐ (and 6‐)carboxy‐2′,7′‐dichlorofluorescein diacetate; ROS, reactive oxygen species; SC, satellite cell; SOD‐2, superoxide dismutase‐2; UnAG, unacylated ghrelin; TBARS, thiobarbituric acid reactive substances.
To validate the possibility that UnAG acts by inducing an efficient antioxidant response, UnAG was administered to mice treated with BaCl2, which is known to induce ROS‐independent damage.44 As shown in Figure 8, regeneration of skeletal muscle was no longer observed. Thus, UnAG appears to influence skeletal muscle regeneration via an antioxidant effect.
Figure 8.
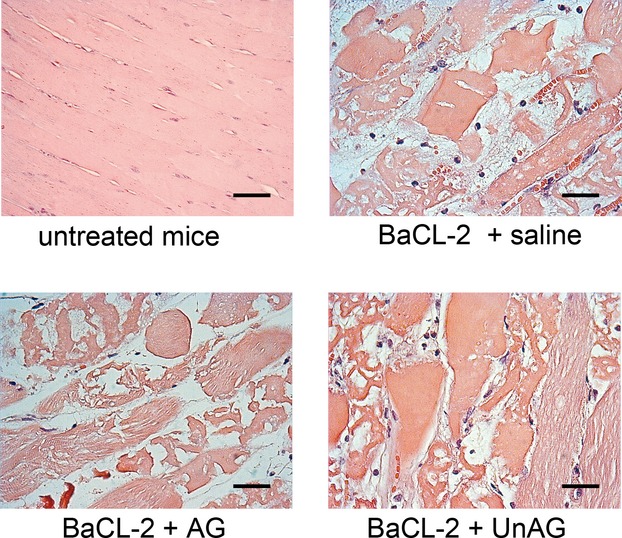
UnAG has no protective effect against toxic damage. Representative hematoxylin and eosin–stained sections of toxic damage induced by injection of 1% barium chloride (BaCl2) in gastrocnemius muscles of C57BL/6J mice. Mice were treated as indicated, n=3 each group. AG indicates acylated ghrelin; UnAG, unacylated ghrelin.
UnAG‐Induced SC Cell‐Cycle Entry Is Recapitulated In Vitro
To evaluate whether the in vivo effects of UnAG are recapitulated in vitro, primary SCs recovered from normo‐perfused muscles were subjected to in vitro ischemia and evaluated on treatment. Again, only UnAG challenge induced expression of Pax‐7, MyoD (Figure 9A), and myogenin (Figure 9B) and increased levels of p‐p38/MAPK (Figure 9C). In addition, UnAG challenge increased PCNA expression (Figure 9D) and the number of cells in the S phase (Figure 9E).
Figure 9.
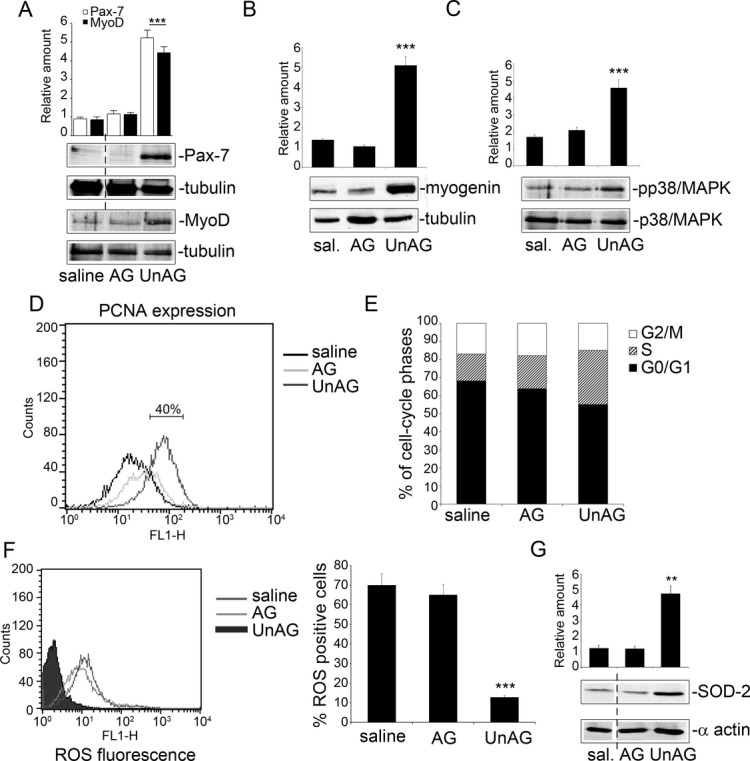
UnAG effects are recapitulated in vitro in primary SCs. A through C, SCs recovered from normoperfused muscles were treated for 72 hours with the indicated stimuli and subjected to in vitro ischemia for an additional 24 hours. Cell extracts were analyzed by Western blot for Pax‐7 and MyoD (A), for myogenin (B), and for p‐p38/MAPK content (C) by densitometry (relative amount). Protein levels were normalized to tubulin or p38/MAPK content. The results are representative of 5 different experiments performed in triplicate (n=5) (***P<0.001 Pax‐7 and MyoD [A], myogenin [B], and p‐p38/MAPK [C] content in UnAG‐ vs AG‐ or saline‐treated SCs). D, SCs subjected to in vitro ischemia and treated as indicated were analyzed by FACS for PCNA expression. The graph is representative of 5 independent experiments. E, FACS analysis indicates the percentage of SCs, treated as above, in the different cell‐cycle phases. The results are representative of 5 different experiments performed in triplicate. F, To evaluate ROS generation, DCF‐DA assay was performed on SCs subjected to in vitro ischemia and treated as indicated. The percentage of DCF‐DA+ cells (mean±SEM, n=5) is reported (***P<0.001 ROS generation in UnAG‐ vs AG‐ and saline‐treated SCs). G, SOD‐2 content was analyzed by Western blot (normalized to α‐actin) in SCs subjected to in vitro ischemia. The results are representative of 5 different experiments performed in triplicate (**P<0.01 UnAG‐ vs AG‐ and saline‐treated SCs). AG indicates acylated ghrelin; DCF‐DA, 5‐ (and 6‐)carboxy‐2′,7′‐dichlorofluorescein diacetate; MAPK, mitogen‐activated protein kinase; ROS, reactive oxygen species; SC, satellite cell; SOD‐2, superoxide dismutase‐2; UnAG, unacylated ghrelin; FACS, fluorescence‐activated cell sorting; PCNA, proliferating cell nuclear antigen.
When examined under the same experimental conditions, ROS production was decreased (Figure 9F) and SOD‐2 expression increased (Figure 9G) following UnAG treatment. When SOD‐2 was silenced in SCs using siRNA (Figure 10A) and SCs subjected to in vitro ischemia, UnAG did not protect SCs against ROS generation (Figure 10B) and did not induce p38/MAPK phosphorylation (Figure 10D), and the cells did not undergo cell‐cycle progression (Figure 10C). Moreover, the addition of SB202190, an inhibitor of p38/MAPK phosphorylation, blocked cell‐cycle entry and prevented MyoD and myogenin expression in SCs exposed to UnAG (Figure 10E and 10F). These data indicate that, after ischemia, SOD‐2 expression is crucial for UnAG‐induced p38/MAPK phosphorylation, leading to activation of the myogenic process. Finally, the specificity of UnAG activity in SCs subjected to ischemia is supported by the finding that the retro‐des‐acyl ghrelin peptide (1–14)32 was unable to induce similar effects and UnAG had no effect on SOD‐2 expression in non‐SCs (Figure 11A and 11B).
Figure 10.

UnAG induces SC cell‐cycle entry via SOD‐2 and p38/MAPK phosphorylation. A, SCs recovered from normo‐perfused muscles were treated for 72 hours with the indicated stimuli and subjected to in vitro ischemia. SOD‐2 content was evaluated in SCs transfected for the last 48 hours with scramble or SOD‐2 siRNA. Protein level was normalized to α‐actin. The results are representative of 4 different experiments performed in triplicate (***P<0.001 SCs transfected with the SOD‐2 siRNA vs SCs transfected with the scramble). B, To evaluate ROS generation, DCF‐DA assay was performed on SCs depleted for SOD‐2 and treated as indicated (n=4). C, FACS analysis indicates the percentage of SCs transfected with scramble or with SOD‐2 siRNA in the presence of UnAG in the different cell‐cycle phases. The results are representative of 4 different experiments performed in triplicate. D, SCs transfected with scramble or SOD‐2 siRNA and subjected to in vitro ischemia in the presence of UnAG were analyzed by Western blot for p‐p38/MAPK content by densitometry (relative amount). The results are representative of 4 different experiments performed in triplicate (**P<0.01 SOD‐2–silenced SCs vs scramble‐transfected SCs). E, FACS analysis indicates the percentage of SCs in the different cell‐cycle phases following treatment with the indicated stimuli. The results are representative of 4 different experiments performed in triplicate. F, Cell extracts from SCs treated as indicated were analyzed by Western blot for MyoD and myogenin content by densitometry (relative amount). Protein levels were normalized to tubulin content. The results are representative of 4 different experiments performed in triplicate. AG indicates acylated ghrelin; DCF‐DA, 5‐(and 6‐)carboxy‐2′,7′‐dichlorofluorescein diacetate; ROS, reactive oxygen species; SC, satellite cell; siRNA, small interfering RNA; MAPK, mitogen‐activated protein kinase; SOD‐2, superoxide dismutase‐2; UnAG, unacylated ghrelin; FACS, fluorescence‐activated cell sorting.
Figure 11.
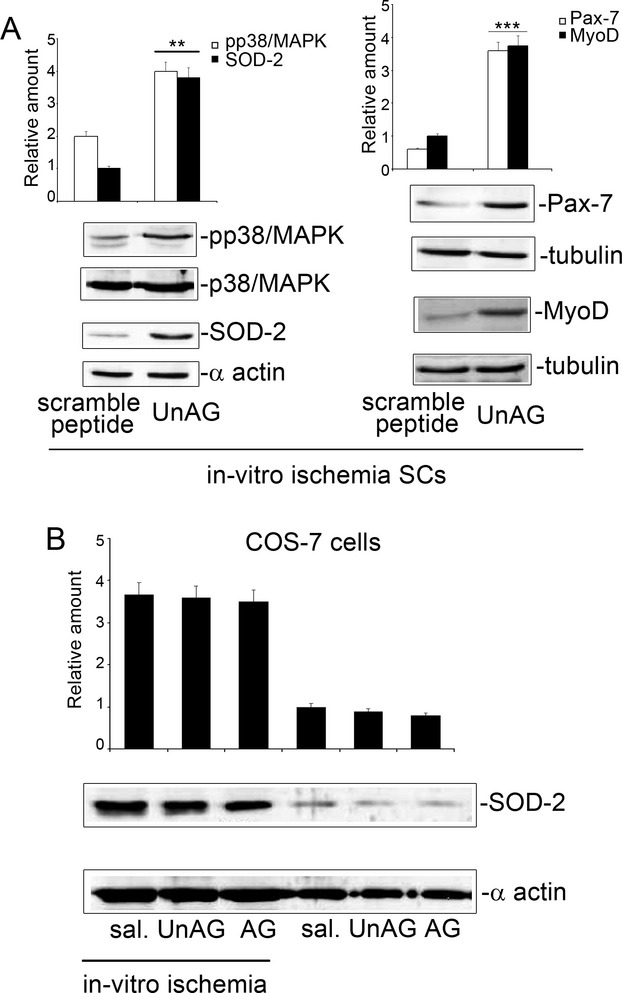
A, Scramble peptide vs UnAG treatment. SCs recovered from normo‐perfused muscles and subjected to in vitro ischemia were treated with scramble peptide or UnAG. Cell extracts were analyzed by Western blot for p‐p38/MAPK and SOD‐2 (left) and for Pax‐7 and MyoD (right) content by densitometry (relative amount). Protein levels were normalized to p38/MAPK, α‐actin, or tubulin content. The results are representative of 5 different experiments performed in triplicate (***P<0.001 p‐p38/MAPK and SOD‐2 content in UnAG‐treated SCs vs scramble‐treated SCs; ***P<0.001 Pax‐7 and MyoD content in UnAG‐treated SCs vs scramble‐treated SCs). B, SOD‐2 content in UnAG‐treated non‐SCs. Cell extracts from COS‐7 cells, treated as indicated and subjected or not to in vitro ischemia, were analyzed by Western blot for SOD‐2 content by densitometry (relative amount). Protein levels were normalized to α‐actin content. The results are representative of 5 different experiments performed in triplicate. AG indicates acylated ghrelin; SC, satellite cell; SOD‐2, superoxide dismutase‐2; UnAG, unacylated ghrelin.
UnAG‐Mediated SC Proliferation s Independent of Akt or Hepatocyte Growth Factor
It has been reported that both AG and UnAG activate PI3Kβ‐mTORC2 pathways in C2C12 cell line and protect myotubes from dexamethazone‐induced atrophy.27 In our in vitro model of ischemia, we were unable to demonstrate the activation of these signaling pathways (data not shown). Similarly, treatment with the specific Akt inhibitor TCL110‐24 showed that protection against ROS generation was independent of Akt in C2C12 cell line (Figure 12). Moreover, Akt inactivation had no significant effects on p38/MAPK activation and SOD‐2, Pax‐7, or myogenin expression in either C2C12 cells (Figure 12A) or SCs (data not shown).
Figure 12.

Akt is not involved in UnAG‐mediated signals in C2C12 cells subjected to in vitro ischemia. A, Cell extracts from C2C12 cells, treated as indicated and subjected to in vitro ischemia, were analyzed by Western blot for pAkt, SOD‐2, p‐p38/MAPK, Pax‐7, and myogenin content by densitometry (relative amount). Protein levels were normalized to Akt, α‐actin, p38/MAPK, or tubulin content. The results are representative of 5 different experiments performed in triplicate (*P<0.05 myogenin content in UnAG‐treated cells+iAkt vs AG‐ and saline‐treated cells+iAkt; **P<0.01 SOD‐2 content UnAG‐treated cells+iAkt vs saline‐treated cells+iAkt; myogenin content in UnAG‐ vs AG‐ and saline‐treated cells; ***P<0.001 SOD‐2, p‐p38/MAPK, and Pax‐7 content in UnAG‐ vs AG‐ and saline‐treated cells; ***P<0.001 p‐p38/MAPK and Pax‐7 content in UnAG‐treated cells+iAkt vs saline‐treated cells+iAkt). B and C, To evaluate ROS generation, DCF‐DA assay was performed on C2C12 cells subjected to in vitro ischemia and treated as indicated in the presence or absence of Akt inhibitor. The percentage of DCF‐DA+ cells (mean±SEM, n=5) is reported (***P<0.001 ROS generation in UnAG‐ vs AG‐ and saline‐treated cells in the presence or absence of Akt inhibitor). AG indicates acylated ghrelin; DCF‐DA, 5‐ (and 6‐)carboxy‐2′,7′‐dichlorofluorescein diacetate; ROS, reactive oxygen species; SOD‐2, superoxide dismutase‐2; UnAG, unacylated ghrelin.
It has been extensively reported that after muscle injury, SCs activate cell‐cycle entry in an hepatocyte growth factor–dependent manner.45–47 Therefore, we investigated the contribution of hepatocyte growth factor in mediating UnAG action. To this end, SCs treated with UnAG or saline were subjected to in vitro ischemia in the presence or absence of the c‐Met kinase inhibitor Crizotinib.48 The results reported in Figure 13 demonstrate that the c‐Met kinase inhibitor did not interfere with UnAG.
Figure 13.

The c‐Met kinase inhibitor does not affect UnAG‐mediated signals in SCs subjected to in vitro ischemia. A, Cell extracts from SCs, treated with saline and UnAG in the presence or absence of c‐Met kinase inhibitor and subjected to in vitro ischemia, were analyzed by Western blot for phospho‐c‐Met (pMet), p‐p38/MAPK, SOD‐2, and Pax‐7 content by densitometry (relative amount). Protein levels were normalized to c‐Met, p38/MAPK, α‐actin, or tubulin content. The results are representative of 5 different experiments performed in triplicate (*P<0.05 p‐p38/MAPK and SOD‐2 content in UnAG‐ vs saline‐treated cells; pMet content in saline‐ and UnAG‐treated cells+iMet vs saline‐ and UnAG‐treated cells; SOD‐2 content in UnAG‐treated cells+iMet vs saline‐treated cells+iMet **P<0.01 Pax‐7 content in UnAG‐ vs saline‐treated cells; p‐p38/MAPK and Pax‐7content in UnAG‐treated cells+iMet vs saline‐treated cells+iMet). B and C, To evaluate ROS generation, DCF‐DA assay was performed on SCs subjected to in vitro ischemia and treated as indicated in the presence or absence of c‐Met kinase inhibitor. The percentage of DCF‐DA+ cells (mean±SEM, n=5) is reported (***P<0.001 ROS generation in UnAG‐ vs AG‐ and saline‐treated cells in the presence or absence of c‐Met kinase inhibitor). AG indicates acylated ghrelin; DCF‐DA, 5‐ (and 6‐)carboxy‐2′,7′‐dichlorofluorescein diacetate; ROS, reactive oxygen species; SC, satellite cell; SOD‐2, superoxide dismutase‐2; UnAG, unacylated ghrelin.
UnAG Acts Independently of Ghrelin to Induce Skeletal Muscle Regeneration
To assess whether the effects of UnAG on SC fate occurred through the classic ghrelin signaling pathway, we analyzed mice lacking the GHSR1a and ghrelin genes.36 SCs from these double‐knockout mice were subjected to in vitro ischemia in the presence of AG or UnAG. Again, only UnAG promoted SC cell‐cycle progression (Figure 14A) and induced p‐p38/MAPK, Pax‐7, MyoD, Myf5, and myogenin expression (Figure 14B and 14C). Moreover, unlike AG, UnAG protected SCs from ROS generation and induced SOD‐2 expression (Figure 14C and 14D). We cannot exclude the possibility that, similar to C2C12 cells,25,27 SCs express a receptor shared by AG and UnAG. However, these results, along with the failure to detect in vivo effects of AG, support the possibility that UnAG can induce AG‐independent activities in SCs. Along with data obtained in endothelial progenitor cells31 and neonatal cardiomiocytes,30 our findings thus suggest the existence of an additional unidentified receptor for UnAG.
Figure 14.
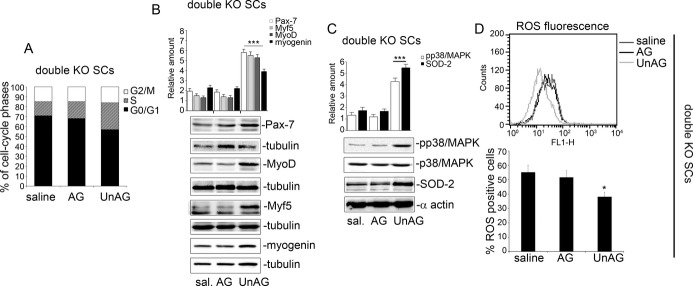
UnAG induces cell‐cycle entry of SCs from double‐KO mice via SOD‐2 and p38/MAPK phosphorylation. A, SCs recovered from double‐KO mice were stimulated with saline, AG, and UnAG and subjected to in vitro ischemia. FACS analysis was performed to evaluate SC cell‐cycle progression. The results are representative of 5 different experiments performed in triplicate. B and C, Cell extracts from KO‐derived SCs, treated as indicated and subjected to in vitro ischemia, were analyzed by Western blot for Pax‐7, MyoD, Myf5, and myogenin (B) and for p‐p38/MAPK and SOD‐2 (C) content by densitometry (relative amount). Protein levels were normalized to tubulin, p38/MAPK, or α‐actin content. The results are representative of 5 different experiments performed in triplicate (***P<0.001 Pax‐7, MyoD, Myf5, and myogenin content in SCs derived from UnAG‐ vs AG‐ and saline‐treated double‐KO mice; ***P<0.001 p‐p38/MAPK and SOD‐2 in SCs derived from UnAG‐ vs AG‐ and saline‐treated double‐KO mice). D, To evaluate ROS generation, DCF‐DA assay was performed on SCs derived from double‐KO mice, treated as indicated. The percentage of DCF‐DA+ cells (mean±SEM, n=5) is reported (*P<0.05 ROS generation in UnAG‐ vs AG‐ and saline‐treated SCs). AG indicates acylated ghrelin; DCF‐DA, 5‐ (and 6‐)carboxy‐2′,7′‐dichlorofluorescein diacetate; KO, knockout; ROS, reactive oxygen species; SC, satellite cell; SOD‐2, superoxide dismutase‐2; UnAG, unacylated ghrelin.
miR‐221 and miR‐222 Control UnAG‐Induced SC Cell‐Cycle Entry by Regulating the Expression of p57 Kip2 but Not That of p27 Kip1
To address the molecular mechanism through which UnAG exerts its effects, we analyzed the expression of miR‐221 and miR‐222, which have recently emerged as important regulators of myogenesis.13–14 Expression of miR‐221 and miR‐222 was significantly increased in SCs recovered from muscles of UnAG‐treated mice compared with controls (Figure 15A). We therefore analyzed the expression of p27Kip1 and p57Kip2, known target genes of miR‐221/222,13,49 and found that only the levels of p57Kip2 protein were reduced in SCs from UnAG‐treated mice (Figure 15B). Similar results were obtained when SCs recovered from normo‐perfused muscles were subjected to in vitro ischemia and treated with UnAG (Figure 15C and 15D). To ascertain the direct effect of miR‐221/222 on p57Kip2‐3'‐UTR, a luciferase reporter vector containing the wild‐type full‐length p57Kip2‐3′‐UTR was transfected in SCs. Decreased luciferase activity was detected in p57Kip2‐3′‐UTR expressing SCs exposed to in vitro ischemia (Figure 15E). Furthermore, in loss‐of‐function experiments involving transfection of SCs with anti–miR‐221/222 (Figure 16), UnAG no longer had any effect on cell‐cycle entry or expression of Pax‐7, MyoD, or myogenin in SCs (Figure 15F and 15G). The observation that p‐p38/MAPK levels were reduced under these experimental conditions (Figure 15G) provides further evidence that both miRs are crucial mediators of myogenesis. Interestingly, loss‐of‐function experiments demonstrate that miR‐221/222 are under the control of SOD‐2 expression (Figure 15G).
Figure 15.

UnAG induces SC cell‐cycle entry by regulating miR‐221/222 expression. A, miR‐221/222 expression was evaluated by qRT‐PCR on SCs from ischemic (ih) and nonischemic (nh) muscles of mice treated as indicated, at days 7 and 21 post surgery. Data normalized to RNU6B are representative of 9 experiments (n=9 each group) (miR‐221/222 expression: ***P<0.001 ih SCs from UnAG‐ vs saline‐treated mice at day 7; **P<0.01 ih SCs from UnAG‐ vs saline‐treated mice for miR‐221 and ***P<0.001 ih SCs from UnAG‐ vs saline‐treated mice for miR‐222 at day 21 [s indicates saline; U, UnAG]). B, p57kip2 and p27kip1 content was analyzed in SCs from ih and nh muscles at days 7 and 21 by densitometry (relative amount) (n=9 each group at days 7 and 21: **P<0.01 p57kip2 in SCs from ischemic muscle of UnAG‐treated mice vs the other experimental groups at day 7; *P<0.05 p57kip2 in ih SCs from UnAG‐ vs saline‐treated mice at day 21). C, miR‐221/222 expression was analyzed by qRT‐PCR on SCs from nh muscles subjected to in vitro ischemia and treated as indicated. Data normalized to RNU6B are representative of 5 different experiments performed in triplicate (***P<0.001 UnAG‐ vs saline‐treated SCs). D, Cell extracts from SCs treated as above were analyzed for p57kip2 and p27kip1 content and normalized to α‐actin content. The results are representative of 5 different experiments performed in triplicate (***P<0.001 p57kip2 in UnAG‐ vs saline‐treated SCs). E, SCs were transfected with pmiR empty vector or pmiR‐3′‐UTR p57kip2 luciferase constructs, treated as indicated and subjected to in vitro ischemia. The relative luciferase expression is reported (***P<0.001 UnAG‐ vs saline‐treated SCs) (n=3). F, SCs, transfected with anti‐miR negative control (neg c) or anti–miR‐221/222 were subjected to in vitro ischemia. SC cell‐cycle progression was analyzed by FACS. Results are representative of 5 different experiments performed in triplicate. G, MyoD, Pax‐7, myogenin, p‐p38/MAPK, and SOD‐2 content was analyzed on SCs stimulated as above. Protein levels were normalized to tubulin, p38/MAPK, or α‐actin content. Results are representative of 5 different experiments performed in triplicate (***P<0.001 Pax‐7, MyoD, myogenin, and p‐p38/MAPK in UnAG‐treated SCs+anti‐miR neg c vs saline‐treated SCs+anti‐miR neg c; ***P<0.001 SOD‐2 in UnAG‐treated SCs+anti‐miR neg c and UnAG‐treated SCs+anti–miR‐221/222 vs saline treatment; ***P<0.001 MyoD, Pax‐7, myogenin, and p‐p38/MAPK content in UnAG‐treated SCs+anti–miR‐221/222 vs UnAG‐treated SCs+anti‐miR neg c). qRT‐PCR indicates quantitative real‐time PCR; miR, microRNA; SC, satellite cell; SOD‐2, superoxide dismutase‐2; UnAG, unacylated ghrelin; FACS, fluorescence‐activated cell sorting.
Figure 16.
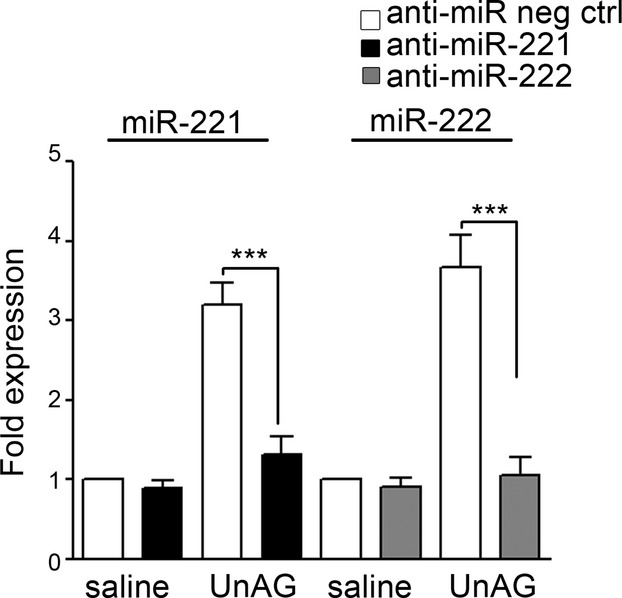
In vitro loss‐of‐function experiments. Following transfection with anti‐miR neg ctrl or anti–miR‐221/222, qRT‐PCR was performed on SCs treated as indicated to evaluate miR‐221 and miR‐222 expression. The reported data are normalized to RNU6B and are representative of 5 experiments (***P<0.001 miR‐221 and miR‐222 expression in UnAG‐treated SCs+anti–miR‐221/222 vs UnAG‐treated SCs+anti‐miR neg ctrl). qRT‐PCR indicates quantitative real‐time PCR; miR, microRNA; SC, satellite cell; UnAG, unacylated ghrelin.
miR‐221/222 Expression Is Modulated by Oxidative Stress and Is Crucial for Skeletal Muscle Regeneration on Ischemia
To validate the relevance of SOD‐2 in miR‐221/222 expression, the in vitro ischemia was induced following SOD‐2 depletion (Figure 17A). Under these conditions, UnAG‐induced miR‐221/222 expression was blocked (Figure 17B), suggesting that miR‐221/222 expression could be modulated by ROS generation. It would therefore be expected that miR‐221/222 overexpression protects against ischemia‐induced damage. To assess this possibility, we analyzed the in vivo role of miR‐221/222 in skeletal muscle regeneration by injection of pre–miR‐221/222 in our model. Under these conditions, pre–miR‐221/222 injection led to lower damage scores and significant myofiber regeneration (Figure 17C through 17E) even in the absence of UnAG. Furthermore, SCs recovered from those mice had high levels of miR‐221/222 expression (Figure 17F) and increased levels of MyoD, myogenin, and p‐p38/MAPK protein (Figure 17G).
Figure 17.

In vivo miR‐221/222 expression recapitulates UnAG effects. A, SCs recovered from normo‐perfused muscles were treated for 72 hours with the indicated stimuli and subjected to in vitro ischemia. SOD‐2 content was evaluated in SCs transfected for the past 48 hours with scramble or SOD‐2 siRNA. Protein level was normalized to α‐actin. The results are representative of 3 different experiments performed in triplicate (***P<0.001 SOD‐2 siRNA‐ vs scramble‐transfected SCs). B, miR‐221/222 expression was evaluated by qRT‐PCR on SCs silenced for SOD‐2 and subjected to in vitro ischemia. Data normalized to RNU6B are representative of 4 different experiments performed in triplicate (***P<0.001 UnAG‐treated SCs transfected with scramble vs saline‐treated cells; ***P<0.001 UnAG‐treated SCs transfected with SOD‐2 siRNA vs UnAG‐treated SCs transfected with scramble). C, Representative hematoxylin and eosin–stained sections of ischemic and normo‐perfused (normal) muscles of mice injected with pre‐miR negative control (neg ctrl) or with pre‐miR‐221/222, killed at day 7 post surgery. Scale bar: 80 μm (×20 magnification). Inset shows myofibers at higher magnification; green arrows indicate regenerating myofibers, characterized by central nucleus location at day 7 in mice expressing pre–miR‐221/222. D, Foot damage score of treated mice evaluated for the indicated times. Data are expressed as mean±SEM (n=5) (***P<0.001 ischemic limb of pre–miR‐221/222–treated vs pre‐miR neg ctrl–treated mice). E, Percentage (mean±SEM) of regenerating fibers in pre‐miR neg ctrl or pre–miR‐221/222–treated mice after ischemia (n=5) (***P<0.001 ischemic muscles of pre–miR‐221/222–treated vs pre‐miR neg ctrl–treated mice at day 7; normal muscles vs ischemic muscles of treated mice). F, miR‐221/222 expression was evaluated by qRT‐PCR on SCs recovered from mice treated as indicated 7 days after ischemia. Data normalized to RNU6B are representative of 5 different experiments (***P<0.001 miR‐221/222 expression in ischemic SCs from pre–miR‐221/222–treated vs pre‐miR neg ctrl–treated mice). G, MyoD, p‐p38/MAPK, myogenin and Pax‐7 content was analyzed in SCs recovered from mice treated as above and normalized to tubulin content. The results are representative of 5 different experiments (***P<0.001 MyoD, and myogenin content in ischemic SCs from pre–miR‐221/222–treated vs pre‐miR neg ctrl mice; *P<0.05 p‐p38/MAPK content in ischemic SCs from pre–miR‐221/222–treated vs pre‐miR neg ctrl mice). qRT‐PCR indicates quantitative real‐time PCR; miR, microRNA; SC, satellite cell; SOD‐2, superoxide dismutase‐2; UnAG, unacylated ghrelin.
Discussion
In this study, we have shown that UnAG improves skeletal muscle regeneration in a mouse model of CLI by inducing protective effects against ROS‐induced cell injury. In particular, we found that ROS imbalance is corrected by UnAG‐mediated SOD‐2 expression in SCs. This expression of SOD‐2 is also crucial for SC cell‐cycle entry via a mechanism involving miR‐221/222. Taken together, these data suggest that UnAG treatment could offer clinical benefit in the treatment of PAD and provide important insights into its mechanism of action.
A major factor in the development of symptoms and skeletal muscle damage in PAD is the persistence of an oxidative environment.5 In our study, although there was no effect of AG or UnAG treatment on large‐vessel reperfusion, ischemic muscles of UnAG‐treated mice had a larger number of functional vessels than observed in AG‐ or saline‐treated animals. Furthermore, the number of vessels was similar in ischemic and normo‐perfused muscles from UnAG‐treated mice. Since UnAG protects endothelial cells and endothelial progenitor cells against apoptosis and senescence without promoting proliferation,26,31 these data suggest that UnAG protects muscles against ischemia‐induced tissue injury rather than promoting neovessel formation. This possibility is further supported by our observation of a low number of proangiogenic infiltrating CD68+ cells50 and a low score for hindlimb functional damage in UnAG‐treated animals.
One possibility to explain the reduction of ischemia‐induced injury by UnAG treatment is via an effect on skeletal muscle regeneration. We found that UnAG promotes skeletal muscle regeneration by inducing cell‐cycle entry and generation of Pax‐7+/MyoD+ myoblasts by SCs. Recently, it has been reported that asymmetric activation and localization of p38/MAPK in dividing cells dictate myoblast expansion.9 Consistent with that observation, we found that p38/MAPK was phosphorylated in SCs recovered from ischemic muscles of UnAG‐treated mice. Moreover, SCs subjected to in vitro ischemia and exposed to UnAG undergo cell‐cycle progression by p38/MAPK phosphorylation.
Our finding that UnAG treatment on ischemia leads to the generation of myogenin‐positive cells and regenerating myofibers suggests that, directly or indirectly, UnAG‐mediated signals might play a role in driving the myogenic differentiating program. The SC population is considered heterogeneous in terms of gene expression, myogenic differentiation potential, and propensity to generate stem cells.47,51 Pax‐7 is widely expressed, whereas expression of its paralog Pax‐342–43 is less widespread and does not correlate with the embryonic origin or innervation of SCs.52 We found that UnAG treatment on ischemia led to expansion of a population of SCs that express Pax‐7 and Pax‐3 as well as Myf5 and MyoD, which are specific markers of differentiating myoblasts.47 It is well established that, after limited round of proliferation, terminal differentiation starts with the expression of myogenin,53–54 primarily induced by the transcriptional activity of MyoD.55 Thus, the presence of myogenin‐positive cells and regenerating myofibers in our model is consistent with the promotion of muscle regeneration by UnAG. Recently, Porporato et al27 demonstrated that transgenic mice constitutively producing high levels of UnAG exhibit long‐term protection against experimentally induced muscle atrophy. Furthermore, it is well established that long‐term denervation causes a severe reduction of SC numbers and thus leads to muscle atrophy.47,56 Thus, as the reduced number of SCs is, at least in part, due to the impaired capability of SCs to enter the cell cycle,57 it is conceivable that the protective effect observed in the transgenic mice could depend on UnAG‐mediated functional recovery of SCs.
Consistent with our previous finding that UnAG, unlike AG, acts by reducing ROS production,31–32 we found that the formation of TBARS was significantly lower in muscles recovered from UnAG‐treated mice than in those from AG‐treated mice. In addition, SCs recovered from ischemic muscles of UnAG‐treated animals displayed a low intracellular ROS content. Importantly, mice subjected to ROS‐independent damage did not benefit of UnAG administration. Thus, our data suggest that the effect of UnAG on skeletal muscle regeneration mainly occurs via a mechanism involving protection of SCs against oxidative damage.
The primary enzymatic antioxidant defense against intracellular ROS relies on efficient antioxidant machinery,5 including SOD‐2. Not surprisingly, SOD‐2 is diminished in muscles of patients with PAD and this seems to contribute to tissue damage.5 Given that, under ischemic conditions, UnAG prevents ROS generation, we investigated its effects on SOD‐2 expression. We found that SOD‐2 could be detected in Pax‐7+ cells and its expression was increased in SCs from UnAG‐ but not AG‐ or saline‐treated animals. Thus, the promotion of SC cell‐cycle entry and skeletal muscle regeneration by UnAG appears to occur via an antioxidant effect promoted by the upregulation of SOD‐2 expression. Together, these data suggest that UnAG recapitulates the defense against ROS observed in p66Shc‐A knockout mice19 and that aging‐related diseases16–17 and myotonic dystrophy type 1,58 characterized by mitochondrial dysfunction and increased ROS generation, might also benefit from UnAG treatment.
In addition to precise transcriptional regulation,9 muscle regeneration requires posttranscriptional regulation of genes involved in cell‐cycle progression.10–12,59 The microRNAs miR‐221 and miR‐222 have been described as potent regulators of progression through the G1/S phase via posttranscriptional regulation of the Cip/Kip family members p27Kip1 and p57Kip2 in various malignancies,60 in endothelial cells,40 and in myoblasts.14 For instance, Cardinale et al13 have demonstrated that, in both quail embryo myoblasts and C2C12 cells, miR‐221/222 control the expression of p27Kip1 but not that of p57Kip1 during differentiation and maturation of skeletal muscle cells. In our study, only p57Kip2 was downregulated in SCs recovered from ischemic muscles of UnAG‐treated animals, and its expression was correlated with the expression of miR‐221/222. After proliferation, the majority of SCs enter the myogenic differentiation program, a process that requires changes in the cell‐cycle machinery. It has been shown that an impaired p27Kip1 accumulation resulting from miR‐221/222 overexpression13 leads to a transient delay in the exit from the cell cycle in vitro and that knock down of p27Kip1 and p57Kip2 is sufficient to prevent myogenesis.61 This suggests that in our in vivo ischemia model, the balance between the levels of p27Kip1 and p57Kip2 might be crucial for completion of the regenerative process. Moreover, given that SC fate in vivo is more complex than expected in vitro, alternative mechanisms could account for our results. Accumulating evidence indicates that a number of miRs, either directly or indirectly, control the transition from cell‐cycle progression to the induction of cell‐cycle quiescence and differentiation in skeletal muscles.62 Our findings that anti–miR‐221/222 prevent UnAG‐mediated expression of transcriptional factors associated with myogenesis and that in vivo administration of pre–miR‐221/222 induces skeletal muscle regeneration do not exclude the possibility that other miRs, or miRs under the control of miR‐221/222, could participate and finely regulate the entire process. Finally, our finding that miR‐221/222 expression in response to UnAG treatment is under the control of SOD‐2 suggests that, in addition to fine‐tuning the response to specific metabolic demands, mitochondrial enzymes may also actively participate in tissue repair following ischemia by regulating miR‐221/222 expression (see the proposed model in Figure 18).
Figure 18.
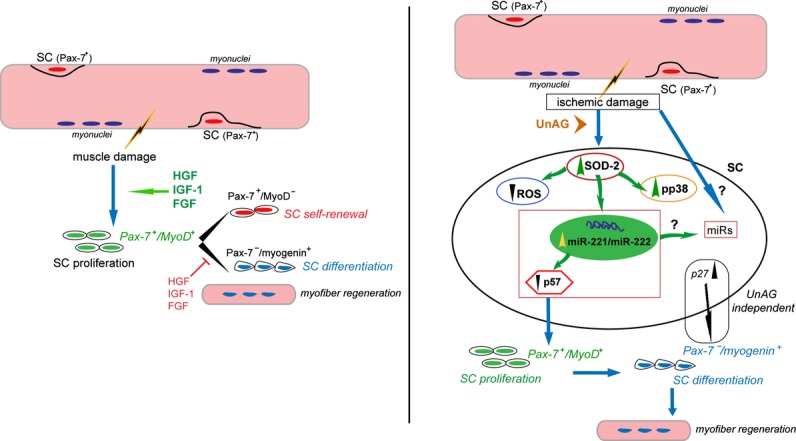
Schematic representation of the molecular events activated by UnAG treatment following ischemia. Left: SC proliferation in response to muscle damage. Following muscle damage in response to microenvironmental stimuli, quiescent SCs undergo proliferation and differentiation to form new myofibers. Right: Proposed mechanism of UnAG action in response to ischemia. Following ischemic damage, quiescent SCs, protected from ROS generation by UnAG‐mediated SOD‐2 expression and miR‐221/222–driven p57Kip2 posttranscriptional regulation, proliferate. As UnAG treatment leads to skeletal muscle regeneration, we hypothesize that the balance between p27Kip1 and p57Kip2 content or, alternatively, the expression of miRs different from miR‐221/222 or regulated by miR‐221/222 might be relevant for the entire regenerative process. FGF indicates fibroblast growth factor; HGF, hepatocyte growth factor; IGF‐1, insulin‐like growth factor‐1; miR, microRNA; ROS, reactive oxygen species; SC, satellite cell; SOD‐2, superoxide dismutase‐2; UnAG, unacylated ghrelin.
Although UnAG effects can be recapitulated in the in vitro model of ischemia, it is likely that the ischemic microenvironment in vivo itself influences the response to UnAG. It is known that a number of soluble factors are released locally and actively participate in muscle regeneration and hypertrophy.63–64 Consistent with data obtained by Porporato et al,27 in our model, UnAG treatment led to skeletal muscle regeneration but not hypertrophy (data not shown). Likewise, the numbers of infiltrating CD68+ cells, which are known to act as mitogens for SCs,65 were decreased in muscles from UnAG‐treated animals. Finally, even by interfering with hepatocyte growth factor–mediated activity, UnAG still retained the ability to direct myoblast expansion in ischemic conditions. Taken together, these data suggest that although the release of soluble molecules into the ischemic microenvironment might contribute to the entire regenerative process, UnAG acts independently of hepatocyte growth factor to drive SC expansion after ischemia.
In summary, our data demonstrate that, unlike AG, UnAG exerts antioxidant effects and promotes skeletal muscle regeneration on ischemia. Efforts should now be made to further investigate the therapeutic potential of UnAG‐related peptides or pre–miR‐221/222 for the treatment of PAD and other conditions in which ROS scavenging and antioxidant efficiency is required.
Sources of Funding
This work was supported by grants obtained by Drs Brizzi, Granata, and Ghigo from Ministero dell'Università e della Ricerca Scientifica (MIUR) progetto PRIN, from Unito‐Compagnia S. Paolo, and by Dr Brizzi from Fondazione per la Ricerca Diabetologica FO.Ri.SID.
Disclosures
None.
Acknowledgments
Dr Brizzi is the guarantor of this work, had full access to all the data, and takes full responsibility for the integrity of data and the accuracy of data analysis. We are grateful to Silvia Giordano for her helpful advices.
References
- 1.Weitz JI, Byrne J, Clagett GP, Farkouh ME, Porter JM, Sackett DL, Strandness DE, Jr, Taylor LM. Diagnosis and treatment of chronic arterial insufficiency of the lower extremities: a critical review. Circulation. 1996; 94:3026-3049 [DOI] [PubMed] [Google Scholar]
- 2.Alexander CM, Landsman PB, Teutsch SM, Haffner SMThird National Health and Nutrition Examination Survey (NHANES III); National Cholesterol Education Program (NCEP) NCEP‐defined metabolic syndrome, diabetes, and prevalence of coronary heart disease among NHANES III participants age 50 years and older. Diabetes. 2003; 52:1210-1214 [DOI] [PubMed] [Google Scholar]
- 3.Gray BH, Conte MS, Dake MD, Jaff MR, Kandarpa K, Ramee SR, Rundback J, Waksman RAmerican Heart Association Writing Group 7 Atherosclerotic Peripheral Vascular Disease Symposium II: lower‐extremity revascularization: state of the art. Circulation. 2008; 118:2864-2872 [DOI] [PubMed] [Google Scholar]
- 4.Cieri E, Lenti M, De Rango P, Isernia G, Marucchini A, Cao P. Functional ability in patients with critical limb ischaemia is unaffected by successful revascularisation. Eur J Vasc Endovasc Surg. 2011; 41:256-263 [DOI] [PubMed] [Google Scholar]
- 5.Pipinos II, Judge AR, Selsby JT, Zhu Z, Swanson SA, Nella AA, Dodd SL. The myopathy of peripheral arterial occlusive disease: Part 2. Oxidative stress, neuropathy, and shift in muscle fiber type. Vasc Endovascular Surg. 2008; 42:101-112 [DOI] [PubMed] [Google Scholar]
- 6.Kuang S, Gillespie MA, Rudnicki MA. Niche regulation of muscle satellite cell self‐renewal and differentiation. Cell Stem Cell. 2008; 2:22-31 [DOI] [PubMed] [Google Scholar]
- 7.Kuang S, Kuroda K, Le Grand F, Rudnicki MA. Asymmetric self‐renewal and commitment of satellite stem cells in muscle. Cell. 2007; 129:999-1010 [DOI] [PMC free article] [PubMed] [Google Scholar]
- 8.Jones NC, Tyner KJ, Nibarger L, Stanley HM, Cornelison DD, Fedorov YV, Olwin BB. The p38alpha/beta MAPK functions as a molecular switch to activate the quiescent satellite cell. J Cell Biol. 2005; 169:105-116 [DOI] [PMC free article] [PubMed] [Google Scholar]
- 9.Troy A, Cadwallader AB, Fedorov Y, Tyner K, Tanaka KK, Olwin BB. Coordination of satellite cell activation and self‐renewal by Par‐complex‐dependent asymmetric activation of p38α/β MAPK. Cell Stem Cell. 2012; 11:541-553 [DOI] [PMC free article] [PubMed] [Google Scholar]
- 10.Rao PK, Kumar RM, Farkhondeh M, Baskerville S, Lodish HF. Myogenic factors that regulate expression of muscle‐specific microRNAs. Proc Natl Acad Sci USA. 2006; 103:8721-8726 [DOI] [PMC free article] [PubMed] [Google Scholar]
- 11.Chen JF, Mandel EM, Thomson JM, Wu Q, Callis TE, Hammond SM, Conlon FL, Wang DZ. The role of microRNA‐1 and microRNA‐133 in skeletal muscle proliferation and differentiation. Nat Genet. 2006; 38:228-233 [DOI] [PMC free article] [PubMed] [Google Scholar]
- 12.Sweetman D, Goljanek K, Rathjen T, Oustanina S, Braun T, Dalmay T, Münsterberg A. Specific requirements of MRFs for the expression of muscle specific microRNAs, miR‐1, miR‐206 and miR‐133. Dev Biol. 2008; 321:491-499 [DOI] [PubMed] [Google Scholar]
- 13.Cardinali B, Castellani L, Fasanaro P, Basso A, Alemà S, Martelli F, Falcone G. Microrna‐221 and microrna‐222 modulate differentiation and maturation of skeletal muscle cells. PLoS One. 2009; 4:e7607. [DOI] [PMC free article] [PubMed] [Google Scholar]
- 14.Greco S, Perfetti A, Fasanaro P, Cardani R, Capogrossi MC, Meola G, Martelli F. Deregulated microRNAs in myotonic dystrophy type 2. PLoS One. 2012; 7:e39732. [DOI] [PMC free article] [PubMed] [Google Scholar]
- 15.Bhat HK, Hiatt WR, Hoppel CL, Brass EP. Skeletal muscle mitochondrial DNA injury in patients with unilateral peripheral arterial disease. Circulation. 1999; 99:807-812 [DOI] [PubMed] [Google Scholar]
- 16.Finkel T. Radical medicine: treating ageing to cure disease. Nat Rev Mol Cell Biol. 2005; 6:971-976 [DOI] [PubMed] [Google Scholar]
- 17.Madamanchi NR, Runge MS. Mitochondrial dysfunction in atherosclerosis. Circ Res. 2007; 100:460-473 [DOI] [PubMed] [Google Scholar]
- 18.Zaccagnini G, Martelli F, Fasanaro P, Magenta A, Gaetano C, Di Carlo A, Biglioli P, Giorgio M, Martin‐Padura I, Pelicci PG, Capogrossi MC. p66ShcA modulates tissue response to hindlimb ischemia. Circulation. 2004; 109:2917-2923 [DOI] [PubMed] [Google Scholar]
- 19.Zaccagnini G, Martelli F, Magenta A, Cencioni C, Fasanaro P, Nicoletti C, Biglioli P, Pelicci PG, Capogrossi MC. p66(ShcA) and oxidative stress modulate myogenic differentiation and SMR after hind limb ischemia. J Biol Chem. 2007; 282:31453-31459 [DOI] [PubMed] [Google Scholar]
- 20.Pedersen BL, Baekgaard N, Quistorff B. Muscle mitochondrial function in patients with type 2 diabetes mellitus and peripheral arterial disease: implications in vascular surgery. Eur J Vasc Endovasc Surg. 2009; 38:356-364 [DOI] [PubMed] [Google Scholar]
- 21.Loffredo L, Marcoccia A, Pignatelli P, Andreozzi P, Borgia MC, Cangemi R, Chiarotti F, Violi F. Oxidative‐stress‐mediated arterial dysfunction in patients with peripheral arterial disease. Eur Heart J. 2007; 28:608-612 [DOI] [PubMed] [Google Scholar]
- 22.Kojima M, Hosoda H, Date Y, Nakazato M, Matsuo H, Kangawa K. Ghrelin is a growth‐hormone‐releasing acylated peptide from stomach. Nature. 1999; 402:656-660 [DOI] [PubMed] [Google Scholar]
- 23.Howard AD, Feighner SD, Cully DF, Arena JP, Liberator PA, Rosenblum CI, Hamelin M, Hreniuk DL, Palyha OC, Anderson J, Paress PS, Diaz C, Chou M, Liu KK, McKee KK, Pong SS, Chaung LY, Elbrecht A, Dashkevicz M, Heavens R, Rigby M, Sirinathsinghji DJ, Dean DC, Melillo DG, Patchett AA, Nargund R, Griffin PR, DeMartino JA, Gupta SK, Schaeffer JM, Smith RG, Van der Ploeg LH. A receptor in pituitary and hypothalamus that functions in growth hormone release. Science. 1996; 273:974-977 [DOI] [PubMed] [Google Scholar]
- 24.van der Lely AJ, Tschöp M, Heiman ML, Ghigo E. Biological, physiological, pathophysiological, and pharmacological aspects of ghrelin. Endocr Rev. 2004; 25:426-457 [DOI] [PubMed] [Google Scholar]
- 25.Filigheddu N, Gnocchi VF, Coscia M, Cappelli M, Porporato PE, Taulli R, Traini S, Baldanzi G, Chianale F, Cutrupi S, Arnoletti E, Ghè C, Fubini A, Surico N, Sinigaglia F, Ponzetto C, Muccioli G, Crepaldi T, Graziani A. Ghrelin and des‐acyl ghrelin promote differentiation and fusion of C2C12 skeletal muscle cells. Mol Biol Cell. 2007; 18:986-994 [DOI] [PMC free article] [PubMed] [Google Scholar]
- 26.Baldanzi G, Filigheddu N, Cutrupi S, Catapano F, Bonissoni S, Fubini A, Malan D, Baj G, Granata R, Broglio F, Papotti M, Surico N, Bussolino F, Isgaard J, Deghenghi R, Sinigaglia F, Prat M, Muccioli G, Ghigo E, Graziani A. Ghrelin and des‐acyl ghrelin inhibit cell death in cardiomyocytes and endothelial cells through ERK1/2 and PI 3‐kinase/AKT. J Cell Biol. 2002; 159:1029-1037 [DOI] [PMC free article] [PubMed] [Google Scholar]
- 27.Porporato PE, Filigheddu N, Reano S, Ferrara M, Angelino E, Gnocchi VF, Prodam F, Ronchi G, Fagoonee S, Fornaro M, Chianale F, Baldanzi G, Surico N, Sinigaglia F, Perroteau I, Smith RG, Sun Y, Geuna S, Graziani A. Acylated and unacylated ghrelin impair skeletal muscle atrophy in mice. J Clin Invest. 2013; 123:611-622 [DOI] [PMC free article] [PubMed] [Google Scholar]
- 28.Gauna C, Delhanty PJ, Hofland LJ, Janssen JA, Broglio F, Ross RJ, Ghigo E, van der Lely AJ. Ghrelin stimulates, whereas des‐octanoyl ghrelin inhibits, glucose output by primary hepatocytes. J Clin Endocrinol Metab. 2005; 90:1055-1060 [DOI] [PubMed] [Google Scholar]
- 29.Soares JB, Leite‐Moreira AF. Ghrelin, des‐acyl ghrelin and obestatin: three pieces of the same puzzle. Peptides. 2008; 29:255-1270 [DOI] [PubMed] [Google Scholar]
- 30.Lear PV, Iglesias MJ, Feijóo‐Bandín S, Rodríguez‐Penas D, Mosquera‐Leal A, García‐Rúa V, Gualillo O, Ghè C, Arnoletti E, Muccioli G., Diéguez C, González‐Juanatey JR, Lago F. Des‐acyl ghrelin has specific binding sites and different metabolic effects from ghrelin in cardiomyocytes. Endocrinology. 2010; 151:3286-3298 [DOI] [PubMed] [Google Scholar]
- 31.Togliatto G, Trombetta A, Dentelli P, Baragli A, Rosso A, Granata R, Ghigo D, Pegoraro L, Ghigo E, Brizzi MF. Unacylated ghrelin rescues endothelial progenitor cell function in individuals with type 2 diabetes. Diabetes. 2010; 59:1016-1025 [DOI] [PMC free article] [PubMed] [Google Scholar]
- 32.Granata R, Settanni F, Julien M, Nano R, Togliatto G, Trombetta A, Gallo D, Piemonti L, Brizzi MF, Abribat T, van Der Lely AJ, Ghigo E. Des‐acyl ghrelin fragments and analogues promote survival of pancreatic β‐cells and human pancreatic islets and prevent diabetes in streptozotocin‐treated rats. J Med Chem. 2012; 55:2585-2596 [DOI] [PubMed] [Google Scholar]
- 33.Hellingman AA, Bastiaansen AJ, de Vries MR, Seghers L, Lijkwan MA, Löwik CW, Hamming JF, Quax PH. Variations in surgical procedures for hind limb ischaemia mouse models result in differences in collateral formation. Eur J Vasc Endovasc Surg. 2010; 40:796-803 [DOI] [PubMed] [Google Scholar]
- 34.Bosch‐Marce M, Okuyama H, Wesley JB, Sarkar K, Kimura H, Liu YV, Zhang H, Strazza M, Rey S, Savino L, Zhou YF, McDonald KR, Na Y, Vandiver S, Rabi A, Shaked Y, Kerbel R, Lavallee T, Semenza GL. Effects of aging and hypoxia‐inducible factor‐1 activity on angiogenic cell mobilization and recovery of perfusion after limb ischemia. Circ Res. 2007; 101:1310-1318 [DOI] [PubMed] [Google Scholar]
- 35.Zeoli A, Dentelli P, Rosso A, Togliatto G, Trombetta A, Damiano L, di Celle PF, Pegoraro L, Altruda F, Brizzi MF. Interleukin‐3 promotes expansion of hemopoietic‐derived CD45+ angiogenic cells and their arterial commitment via STAT5 activation. Blood. 2008; 112:350-361 [DOI] [PubMed] [Google Scholar]
- 36.Kirchner H, Tong J, Tschöp MH, Pfluger PT. Ghrelin and PYY in the regulation of energy balance and metabolism: lessons from mouse mutants. Am J Physiol Endocrinol Metab. 2010; 298:E909-E919 [DOI] [PubMed] [Google Scholar]
- 37.Musarò A, Barberi L. Isolation and culture of mouse satellite cells. Methods Mol Biol. 2010; 633:101-111 [DOI] [PubMed] [Google Scholar]
- 38.Doherty KR, Wappel RL, Talbert DR, Trusk PB, Moran DM, Kramer JW, Brown AM, Shell SA, Bacus S. Multi‐parameter in vitro toxicity testing of crizotinib, sunitinib, erlotinib, and nilotinib in human cardiomyocytes. Toxicol Appl Pharmacol. 2013; 272:245-255 [DOI] [PubMed] [Google Scholar]
- 39.Dentelli P, Rosso A, Olgasi C, Camussi G, Brizzi MF. IL‐3 is a novel target to interfere with tumor vasculature. Oncogene. 2011; 30:4930-4940 [DOI] [PubMed] [Google Scholar]
- 40.Togliatto G, Trombetta A, Dentelli P, Rosso A, Brizzi MF. MIR221/MIR222‐driven post‐transcriptional regulation of P27KIP1 and P57KIP2 is crucial for high‐glucose‐ and AGE‐mediated vascular cell damage. Diabetologia. 2011; 54:1930-1940 [DOI] [PubMed] [Google Scholar]
- 41.Dentelli P, Rosso A, Orso F, Olgasi C, Taverna D, Brizzi MF. microRNA‐222 controls neovascularization by regulating signal transducer and activator of transcription 5A expression. Arterioscler Thromb Vasc Biol. 2010; 30:1562-1568 [DOI] [PubMed] [Google Scholar]
- 42.Montarras D, Morgan J, Collins C, Relaix F, Zaffran S, Cumano A, Partridge T, Buckingham M. Direct isolation of satellite cells for skeletal muscle regeneration. Science. 2005; 309:2064-2067 [DOI] [PubMed] [Google Scholar]
- 43.Relaix F, Montarras D, Zaffran S, Gayraud‐Morel B, Rocancourt D, Tajbakhsh S, Mansouri A, Cumano A, Buckingham M. Pax3 and Pax7 have distinct and overlapping functions in adult muscle progenitor cells. J Cell Biol. 2006; 172:91-102 [DOI] [PMC free article] [PubMed] [Google Scholar]
- 44.Lu H, Huang D, Ransohoff RM, Zhou L. Acute skeletal muscle injury: CCL2 expression by both monocytes and injured muscle is required for repair. FASEB J. 2011; 25:3344-3355 [DOI] [PMC free article] [PubMed] [Google Scholar]
- 45.Allen RE, Sheehan SM, Taylor RG, Kendall TL, Rice GM. Hepatocyte growth factor activates quiescent skeletal muscle satellite cells in vitro. J Cell Physiol. 1995; 165:307-312 [DOI] [PubMed] [Google Scholar]
- 46.Miller KJ, Thaloor D, Matteson S, Pavlath GK. Hepatocyte growth factor affects satellite cell activation and differentiation in regenerating skeletal muscle. Am J Physiol Cell Physiol. 2000; 278:C174-C181 [DOI] [PubMed] [Google Scholar]
- 47.Yin H, Price F, Rudnicki MA. Satellite cells and the muscle stem cell niche. Physiol Rev. 2013; 93:23-67 [DOI] [PMC free article] [PubMed] [Google Scholar]
- 48.Cui JJ, Tran‐Dubé M, Shen H, Nambu M, Kung PP, Pairish M, Jia L, Meng J, Funk L, Botrous I, McTigue M, Grodsky N, Ryan K, Padrique E, Alton G, Timofeevski S, Yamazaki S, Li Q, Zou H, Christensen J, Mroczkowski B, Bender S, Kania RS, Edwards MP. Structure based drug design of crizotinib (PF‐02341066), a potent and selective dual inhibitor of mesenchymal‐epithelial transition factor (c‐MET) kinase and anaplastic lymphoma kinase (ALK). J Med Chem. 2011; 54:6342-6363 [DOI] [PubMed] [Google Scholar]
- 49.Liu X, Cheng Y, Zhang S, Lin Y, Yang J, Zhang C. A necessary role of miR‐221 and miR‐222 in vascular smooth muscle cell proliferation and neointimal hyperplasia. Circ Res. 2009; 104:476-487 [DOI] [PMC free article] [PubMed] [Google Scholar]
- 50.Losordo DW, Dimmeler S. Therapeutic angiogenesis and vasculogenesis for ischemic disease. Part I: angiogenic cytokines. Circulation. 2004; 109:2487-2491 [DOI] [PubMed] [Google Scholar]
- 51.Harel I, Nathan E, Tirosh‐Finkel L, Zigdon H, Guimarães‐Camboa N, Evans SM, Tzahor E. Distinct origins and genetic programs of head muscle satellite cells. Dev Cell. 2009; 16:822-832 [DOI] [PMC free article] [PubMed] [Google Scholar]
- 52.Sacco A, Doyonnas R, Kraft P, Vitorovic S, Blau HM. Self‐renewal and expansion of single transplanted muscle stem cells. Nature. 2008; 456:502-506 [DOI] [PMC free article] [PubMed] [Google Scholar]
- 53.Smith CK, II, Janney MJ, Allen RE. Temporal expression of myogenic regulatory genes during activation, proliferation, and differentiation of rat skeletal muscle satellite cells. J Cell Physiol. 1994; 159:379-385 [DOI] [PubMed] [Google Scholar]
- 54.Cornelison DD, Olwin BB, Rudnicki MA, Wold BJ. MyoD(−/−) satellite cells in single‐fiber culture are differentiation defective and MRF4 deficient. Dev Biol. 2000; 224:122-137 [DOI] [PubMed] [Google Scholar]
- 55.Cao Y, Kumar RM, Penn BH, Berkes CA, Kooperberg C, Boyer LA, Young RA, Tapscott SJ. Global and gene‐specific analyses show distinct roles for Myod and Myog at a common set of promoters. EMBO J. 2006; 25:502-511 [DOI] [PMC free article] [PubMed] [Google Scholar]
- 56.Rodrigues Ade C, Schmalbruch H. Satellite cells and myonuclei in long‐term denervated rat muscles. Anat Rec. 1995; 243:430-437 [DOI] [PubMed] [Google Scholar]
- 57.Kuschel R, Yablonka‐Reuveni Z, Bornemann A. Satellite cells on isolated myofibers from normal and denervated adult rat muscle. J Histochem Cytochem. 1999; 47:1375-1384 [DOI] [PubMed] [Google Scholar]
- 58.Toscano A, Messina S, Campo GM, Di Leo R, Musumeci O, Rodolico C, Aguennouz M, Annesi G, Messina C, Vita G. Oxidative stress in myotonic dystrophy type 1. Free Radic Res. 2005; 39:771-776 [DOI] [PubMed] [Google Scholar]
- 59.Farina NH, Hausburg M, Betta ND, Pulliam C, Srivastava D, Cornelison D, Olwin BB. A role for RNA post‐transcriptional regulation in satellite cell activation. Skelet Muscle. 2012; 2:21. [DOI] [PMC free article] [PubMed] [Google Scholar]
- 60.Calin GA, Croce CM. MicroRNA signatures in human cancers. Nat Rev Cancer. 2006; 6:857-866 [DOI] [PubMed] [Google Scholar]
- 61.Zhang P, Wong C, Liu D, Finegold M, Harper JW, Elledge SJ. p21(CIP1) and p57(KIP2) control muscle differentiation at the myogenin step. Genes Dev. 1999; 13:213-224 [DOI] [PMC free article] [PubMed] [Google Scholar]
- 62.Gagan J, Dey BK, Dutta A. MicroRNAs regulate and provide robustness to the myogenic transcriptional network. Curr Opin Pharmacol. 2012; 12:383-388 [DOI] [PMC free article] [PubMed] [Google Scholar]
- 63.Engert JC, Berglund EB, Rosenthal N. Proliferation precedes differentiation in IGF‐I‐stimulated myogenesis. J Cell Biol. 1996; 135:431-440 [DOI] [PMC free article] [PubMed] [Google Scholar]
- 64.Cornelison DD. Context matters: in‐vivo and in‐vitro influences on muscle satellite cell activity. J Cell Biochem. 2008; 105:663-669 [DOI] [PMC free article] [PubMed] [Google Scholar]
- 65.Tidball JG. Mechanical signal transduction in skeletal muscle growth and adaptation. J Appl Physiol. 2005; 98:1900-1908 [DOI] [PubMed] [Google Scholar]