Abstract
Background
Obesity can cause structural and functional abnormalities of the heart via complex but largely undefined mechanisms. Emerging evidence has shown that obesity results in reduced oxygen concentrations, or hypoxia, in adipose tissue. We hypothesized that the adipocyte hypoxia‐signaling pathway plays an essential role in the development of obesity‐associated cardiomyopathy.
Methods and Results
Using a mouse model in which the hypoxia‐inducible factor (HIF) pathway is activated by deletion of the von Hippel–Lindau gene specifically in adipocytes, we found that mice with adipocyte–von Hippel–Lindau deletion developed lethal cardiac hypertrophy. HIF activation in adipocytes results in overexpression of key cardiomyopathy‐associated genes in adipose tissue, increased serum levels of several proinflammatory cytokines including interleukin‐1β and monocyte chemotactic protein‐1, and activation of nuclear factor–κB and nuclear factor of activated T cells in the heart. Interestingly, genetic deletion of Hif2a, but not Hif1a, was able to rescue cardiac hypertrophy and abrogate adipose inflammation.
Conclusion
We have discovered a previously uncharacterized mechanism underlying a critical and direct role of the adipocyte HIF‐2 transcription factor in the development of adipose inflammation and pathological cardiac hypertrophy.
Keywords: adipocytes, cardiomyopathy, hypoxia, inflammation, obesity
Introduction
Obese patients often develop cardiomyopathy with increased wall thickness and cavity volume of the left ventricle.1 Amad et al2 reported that increase in heart weight above the predicted normal value was almost proportional to the increase of body weight over the normal range and that the predominant and most specific alteration in the hearts of grossly obese persons was ventricular hypertrophy. Although the exact mechanisms by which obesity contributes to changes in cardiac structure and function remain to be fully elucidated, obesity‐induced changes in adipose tissue functions, especially abnormal metabolism and chronic inflammation, are thought to play a critical role in the development of heart disease.3–4 Deciphering the mechanisms by which adipose tissue can have these critical effects on the heart, an anatomically separate organ, is of high clinical significance.
Emerging evidence has shown that adipose tissues in obese mice and humans become hypoxic or oxygen deficient.5–7 Direct Po2 measurement has revealed an average Po2 of 15.2 mm Hg in adipose tissue of ob/ob mice, compared with 47.9 mm Hg in that of lean mice.6 In a cohort of overweight or obese patients, the mean adipose Po2 is ≈15% lower than that of the lean subjects and decreases further with increasing body fat percentage.5 Previously, we found that hypoxia directly regulates adipocyte differentiation and function.8–9 Others have found that hypoxia exerts a strong impact on glucose and lipid metabolism, as well as the production of adipokines and inflammatory cytokines in adipose tissue.5–6 These observations suggest a possible mechanistic sequence in which obesity leads to hypoxia‐mediated changes in adipose tissue biology that in turn effect pathological abnormalities in remote tissues and organs, including the heart.
The most prominent O2‐sensing mechanism in mammalian cells is manifested by transcription activities of the hypoxia‐inducible factors (HIF) consisting of an O2‐sensitive HIF‐α (HIF‐1α or HIF‐2α) and the O2‐insensitive HIF‐1β subunit.10 Under normoxic conditions, HIF‐α becomes hydroxylated by prolyl hydroxylases, and the hydroxylated HIF‐α is degraded by proteasomes via interaction with the von Hippel–Lindau protein (pVHL).11 When hydroxylation of HIF‐α is inhibited by hypoxia (eg, <2% O2), HIF‐α becomes stabilized and dimerizes with the constitutively expressed HIF‐1β to activate transcription of a wide range of genes, including those involved in the regulation of angiogenesis and energy metabolism.10,12 Recent studies have also suggested a role of the HIF pathway in obesity, diabetes, and metabolic syndrome.13
We found that Hif1a is expressed in both mature adipocytes and progenitor cells and that activation of HIF‐1 inhibits adipogenic differentiation.8–9 In contrast, Hif2a is expressed in differentiated adipocytes but not in preadipocytes,8 suggesting a specific role of HIF‐2α in mature adipocytes. Interestingly, adipose tissue from obese mice shows elevated levels of HIF‐1α6 and increased HIF DNA‐binding activities.7 Increased levels of HIF‐2α protein have also been found in mouse adipose tissue after 4 weeks of a high‐fat diet.14 These observations not only provide additional evidence regarding adipose hypoxia but also suggest an important role of HIF‐1α and/or HIF‐2α in the regulation of biological functions of adipose tissue.
We investigated whether HIF activation in adipocytes effects pathological changes in the heart using tissue‐specific gene targeting in mice. We show here that adipocyte‐specific activation of the HIF‐pathway results in pathological cardiomegaly featuring myocardial hypertrophy, left ventricular dilation, and cardiac contractile dysfunction. The cardiac phenotype is correlated with marked HIF‐induced adipose tissue inflammation and activation of the prohypertrophy pathways mediated by nuclear factor–κB (NF‐κB) and nuclear factor of activated T cells (NFAT) in the heart. Interestingly, we find that adipocyte HIF‐2α, not HIF‐1α, plays an essential role in the development of fatal cardiac hypertrophy. These data support a model in which activation of HIF‐2α in adipocytes leads to increased production of adipose tissue–derived inflammatory cytokines that, together with other adipocyte‐derived factors, drive pathological changes in remote tissues such as the heart. This previously unappreciated mechanistic link can be potentially exploited for clinical intervention of obesity‐associated cardiomyopathy or other related metabolic syndromes.
Methods
Generation and Analysis of Mice
Transgenic mice with floxed Vhl,15 Hif1a,16 or Hif2a17 alleles were crossed with aP2/Fabp4‐Cre mice18 to create adipose‐specific knockout (KO) mice. The aP2/Fabp4‐Cre mice had been subsequently backcrossed into the C57BL/6 background for >10 generations. Cre‐mediated recombination of Vhl in adipocytes was accomplished by generating mice that were homozygous for the floxed (2‐lox) Vhl alleles and expressed the aP2/Fabp4‐Cre transgene. Littermates without the cre transgene were used as control animals. Primer sequences used to detect the aP2/Fabp4‐Cre transgene as well as the nonrecombined (2‐lox), recombined (1‐lox), and wild‐type (WT) alleles for Vhl have been previously described.15,18 All animal procedures were performed in accordance with the National Institutes of Health guidelines for the use and care of live animals and were approved by the Institutional Animal Care and Use Committee of Yale University.
Mice were killed via carbon dioxide asphyxiation, blood was collected via cardiac puncture, and tissues were fixed in either 10% neutral buffered formalin or Bouin's fixative (Ricca Chemical Corporation). Tissues were trimmed, processed, embedded, and sectioned and stained for hematoxylin and eosin by routine methods. Mice underwent necropsy, and tissues were examined in a manner blind to experimental genotype. For Oil Red O staining, frozen tissue sections were fixed in formalin and then stained in an Oil Red O solution as described previously.8,19 Tissues were counterstained with hematoxylin for microscopy.
Peripheral Blood Analysis
Hematology assays (Advia 120 Hematology Analyzer, Bayer Diagnostic Systems) were performed according to standard methods at Antech Diagnostics.
Macrophage Preparation
Mice received a daily intraperitoneal injection of 4 mg/mL Brewer Thioglycollate (Sigma Aldrich) solution at a rate of 1 mL/mouse for 3 consecutive days. After mice were killed while under anesthesia, intraperitoneal macrophages were collected by injecting 10 mL cold PBS into the intraperitoneal cavity.
Immunohistochemical Analysis
Immunohistochemical analysis was performed on tissue sections mounted on charged slides (Colormark plus slides, Thermo Scientific). Briefly, the slides were deparaffinized in xylene and rehydrated through graded ethanol to distilled water. Antigen retrieval for Ki67 was performed by steam treatment in a food steamer (Oster 5715) using a 10‐mmol/L citrate buffer for 20 minutes and then cooled to room temperature. For anti–factor VIII staining, sections were treated with proteinase K for 5 minutes at room temperature. Slides were rinsed in distilled water and placed in Tris‐buffered saline (TBS) and then immersed in 3% hydrogen peroxide (H2O2) and distilled water for 5 minutes to block endogenous peroxidase activity. Following a TBS rinse, the primary antibodies anti–von Willebrand factor (1:2500, Dako) or anti‐Ki67 (1:200, Biocare Medical) were applied and incubated for 30 minutes in a humidified chamber at room temperature. After a TBS rinse, secondary detection was performed using the Envision Kit (Dako) with the chromogen diaminobenzedine tetrahydrochloride (DAB; Dako). The slides were then rinsed in distilled water and counterstained with hematoxylin. Finally, they were dehydrated, cleared in xylene, and coverslipped with a resinous mounting media. Apoptosis was analyzed by terminal deoxynucleotidyl transferase dUTP nick end labeling staining (Millipore). All immunohistochemical procedures were performed at the Research Histology Laboratory in the Department of Pathology, Yale School of Medicine.
Gene Expression Analysis Using cDNA Microarrays
RNA was isolated from interscapular fat pads using the TriZOL Reagent according to the manufacturer's protocols (Invitrogen). The quality of total RNA (A260/A280 ≥1.9) was validated by using electrophoresis with the Agilent Bioanalyzer. Gene expression was analyzed using the Affymetrix Mouse Gene 1.0 ST Array at the Yale Center for Genomic Analysis. Genes were considered to be upregulated or downregulated if the relative expression was changed 2‐fold or greater above the WT control. Rigorous statistical analyses to identify differentially regulated genes were performed at the Keck Bioinformatics Resource. A statistically significant difference was declared when the false discovery rate–adjusted value of P<0.05.
RT‐PCR
RNA was isolated using the Trizol Reagent according to the manufacturer's protocols (Invitrogen). DNase I–treated RNA was used for first‐strand cDNA synthesis using the High Capacity cDNA Reverse Transcription Kit (Applied Biosystems). Real‐time PCR was performed on StepOne Plus (Applied Biosystems) using either Power SYBR Green PCR Master Mix or TaqMan Gene Expression Master Mix (Applied Biosystems). The primer and probe sets used to amplify specific target genes can be found in Tables 1 and 2.
Table 1.
Primers for SYBR Green PCRs
| Gene | RefSeq | Primers |
|---|---|---|
| Adm | NM_009627 | Forward: CACCCTGATGTTATTGGGTTCA Reverse: TTAGCGCCCACTTATTCCACT |
| Angptl3 | NM_013913 | Forward: GCCCTCCCAGAGCACACAGAC Reverse: TCCACCACCAGCCACCTGAGT |
| Apoa5 | NM_080434 | Forward: GACTACTTCAGCCAAAACAGTTGGA Reverse: AAGCTGCCTTTCAGGTTCTCCT |
| Apoc4 | NM_007385 | Forward: TGTCTACAGAAAGCCTGAGCCCCAReverse: CTCCAGGGCCCCAGAACCACT |
| Apom | NM_018816 | Forward: CCATCCGCACGAAAAGTGGGGTReverse: TGTCTGGGCGCCCTTCAGTTCT |
| Ccl2 | NM_011333 | Forward: GCCAGCTCTCTCTTCCTCCACCAReverse: GGGCGTTAACTGCATCTGGCTGA |
| Ccl3 | NM_011337 | Forward: ATGGAGCTGACACCCCGACTGCReverse: TCAGGAAAATGACACCTGGCTGGGA |
| Ccl7 | NM_013654 | Forward: CAACCAGATGGGCCCAATGCATCCReverse: AGCTTCCCAGGGACACCGACT |
| Ccl8 | NM_021443 | Forward: TGGGCCAGATAAGGCTCCAGTCAReverse: AACCACAGCTTCCATGGGGCACT |
| Col1a1 | NM_007742 | Forward: AGGCTTCAGTGGTTTGGATGReverse: CACCAACAGCACCATCGTTA |
| Ctgf | NM_010217 | Forward: CAAAGCAGCTGCAAATACCAReverse: GGCCAAATGTGTCTTCCAGT |
| Egln3 | NM_028133 | Forward: AGGCAATGGTGGCTTGCTATCReverse: GCGTCCCAATTCTTATTCAGGT |
| Fgf10 | NM_008002 | Forward: TTTGGTGTCTTCGTTCCCTGTReverse: TAGCTCCGCACATGCCTTC |
| Gpd2 | NM_010274 | Forward: GAAGGGGACTATTCTTGTGGGTReverse: GGATGTCAAATTCGGGTGTGT |
| Glut3 | NM_011401 | Forward: ATGGGGACAACGAAGGTGACReverse: GTCTCAGGTGCATTGATGACTC |
| Gyk | NM_008194 | Forward: GGGTTGGTGTGTGGAGTCTTGReverse: GATTTCGCTTTCTTCAGCATTGA |
| Hmox1 | NM_010442 | Forward: GCCACCAAGGAGGTACACATReverse: GCTTGTTGCGCTCTATCTCC |
| Hprt | NM_013556 | Forward: AGTGTTGGATACAGGCCAGACReverse: CGTGATTCAAATCCCTGAAGT |
| Ifi27l2a | NM_029803 | Forward: CAGCTGCCTCCATAGCAGCCAAGReverse: GGAGAGTCCAAGGACCCCTGCT |
| Lep | NM_008493 | Forward: GGGCTTCACCCCATTCTGAReverse: AGGCTGGTGAGGACCTGTTG |
| Myh6 | NM_010856 | Forward: AAGGCAAGGCCAAGAACGCCReverse: AGCTCAGCCTTGGCCTCCAT |
| Myh7 | NM_080728 | Forward: ATGAGCAAGCCCTGGGCAGTReverse: AGAGCGCAGCTTCTCCACCT |
| Nppa | NM_008725 | Forward: AACTGAGGGCTCTGCTCGCTReverse: TTCGGTACCGGAAGCTGTTGC |
| Nfatc1 | NM_016791 | Forward: TCGAGTGTTCCCAGCGGTCAReverse: GCACAGGTCCCGGTCAGTCT |
| Nfatc2 | NM_010899 | Forward: ATCCGCGTGCCCGTGAAAGReverse: TCTTGATGGCAGGGACTGGGT |
| Nfatc3 | NM_010901 | Forward: GAGTGCTCTCAGCGATCTGCTCReverse: TCCTTCAGCCTCCCAATGAGGTC |
| Nfatc4 | NM_023699.3 | Forward: CACCCTGGAGGAAGTGAGTGAGATCReverse: GGGGCTTCGGGGACCACTAC |
| Osf2 | NM_015784 | Forward: CTGGTATCAAGGTGCTATCTGCReverse: AAACATGGTCAATAGGCATCACT |
| Plgf | NM_008827 | Forward: TCTGCTGGGAACAACTCAACAReverse: GTGAGACACCTCATCAGGGTAT |
| Ppargc1a | NM_008904 | Forward: GGACAGTCTCCCCGTGGATReverse: TCCATCTGTCAGTGCATCAAATG |
| Rcan1‐1 | NM_001081549 | Forward: GAGGAGGTGGATCTGCAGGACCTReverse: CACAGGCCGTCCACGAACACG |
| Rcan1‐4 | NM_019466 | Forward: TCGTTAAGCGTCTGCCCCGTGReverse: GCCACACAAGCAATCAGGGAGCT |
| Serpine1 | NM_008871 | Forward: TGCAACCCTGGCCGACTTCAReverse: CGGGCTGAGATGACAAAGGCTGT |
| Thbs1 | NM_011580 | Forward: GGGGAGATAACGGTGTGTTTGReverse: CGGGGATCAGGTTGGCATT |
| Vcam1 | NM_011693 | Forward: TGCCGAGCTAAATTACACATTGReverse: CCTTGTGGAGGGATGTACAGA |
| Vegfd | NM_010216 | Forward: TTGAGCGATCATCCCGGTCReverse: GCGTGAGTCCATACTGGCAAG |
| 18S rRNA | NR_003278 | Forward: CGGACAGGATTGACAGATTGReverse: CAAATCGCTCCACCAACTAA |
| Nd2 | Genomic, mitochondrial | Forward: CCCATTCCACTTCTGATTACCReverse: ATGATAGTAGAGTTGAGTAGCG |
| PolB | Genomic, nuclear | Forward: CCCTCTTCCTCTTCATTATATCTCCReverse: CCTCAACTCCACCACAACAC |
Specificity of the primers was validated using NCBI Primer‐BLAST.
Table 2.
Primers for TaqMan‐Based PCRs From Applied Biosystems
| Gene | Assay ID | RefSeq |
|---|---|---|
| Emr1 | Mm01233103_m1 | NM_010130.4 |
| Hif1a | Mm00468869_m1 | NM_010431.2 |
| Hif2a | Mm00438717_m1 | NM_010137.3 |
| Il1b | Mm00434228_m1 | NM_008361.3 |
| Il6 | Mm00446190_m1 | NM_031168.1 |
| Mif | Mm01611157_gH | NM_010798.2 |
| Mmp9 | Mm00442991_m1 | NM_013599.2 |
| Tgfb | Mm00441724_m1 | NM_011577.1 |
| Tnf | Mm00443258_m1 | NM_013693.2 |
| Vegfa | Mm01281449_m1 | NM_001025250 |
| 18S rRNA | 4319413E | X03205.1 |
Western Blot Analysis
Protein extracts were prepared from freshly harvested tissues in RIPA buffer containing protease inhibitors. Primary antibodies for Western blot analysis included polyclonal rabbit anti‐HIF‐1α (R&D Systems), mouse monoclonal anti‐HIF2α (Santa Cruz Biotechnology), rabbit anti‐NF‐κB p105/p50 (Santa Cruz Biotechnology), rabbit anti–NF‐κB p65 (Santa Cruz Biotechnology), rabbit anti‐GAPDH (Cell Signaling), and mouse monoclonal anti–β‐actin (Sigma Aldrich). Protein bands were visualized by using enhanced chemiluminescence (Perkin Elmer).
Quantitative Multiplexed Cytokine Assay
Mouse blood was drawn via cardiac puncture. Cytokines in sera were analyzed by the CytoPlex‐Multiplex Core Facility of Yale School of Medicine using the Bio‐Plex Pro Mouse Cytokine 15‐plex Assay (Bio‐Rad) for interleukin (IL)‐1α, IL‐1β, IL‐6, IL‐10, IL‐12p40, IL‐12‐p70, granulocyte colony‐stimulating factor, granulocyte‐macrophage colony‐stimulating factor, interferon‐γ (IFNγ), KC (keratinocyte‐derived chemokine or CXCL1), monocyte chemotactic protein‐1 (MCP‐1), macrophage inflammatory protein (MIP)‐1α, MIP‐1β, regulated upon activation normal T cell expressed and presumably secreted (RANTES), and tumor necrosis factor (TNF)‐α. Concentration standards were fitted to Brendan's 5‐parameter logistic curve.
Metabolic Characterization
For glucose tolerance tests, mice were fasted overnight for 14 to 16 hours and then received an intraperitoneal injection of glucose at 2 mg/kg body weight. Blood glucose levels were measured using a glucose meter (OneTouch Ultra) before and at 15, 30, 60, and 120 minutes after glucose injection. For insulin tolerance tests, postprandial mice received an intraperitoneal injection of insulin at 0.75 U/kg body weight. Blood glucose levels were measured using a glucose meter before and at 15, 30, 60, and 120 minutes after insulin injection. Triglyceride Determination Kit (Sigma Aldrich) was used to determine serum glycerol and triglyceride concentrations from nonfasting mice (male and female), as well as plasma‐free fatty acid concentrations from fasting female mice according the manufacturer‐recommended protocols.
Analysis of Cardiomyocyte Sizes
Cross sections (7 μm) of mouse heart were cut from frozen OCT‐embedded blocks and fixed in cold acetone. After blocking in PBS containing 3% BSA, tissue sections were incubated for 1 hour at room temperature with 50 μg/mL FITC‐conjugated lectin (Sigma Aldrich) that preferentially binds glycoproteins. Cross‐sectional areas of individual cardiomyocytes were measured using NIH ImageJ (National Institutes of Health).
Transmission Electron Microscopy
Mouse heart was perfused with 2.5% gluteraldehyde in 0.1 mol/L HEPES, pH 7.2. Trimmed left ventricle tissues were fixed in 2.5% gluteraldehyde in 0.1 mol/L sodium cacodylate. After being rinsed in sodium cacodylate, heart tissues were incubated in 1% osmium tetroxide for 1 hour, en bloc stained in 2% uranyl acetate in maleate buffer pH 5.2 for an additional hour, and then rinsed, dehydrated in an ethanol series and infiltrated with resin (Embed812 EMS), and baked overnight at 60°C. Hardened blocks were cut using a Leica UltraCut UCT. Sixty‐nanometer sections were collected on grids and stained using uranyl acetate and lead citrate. Samples were viewed on FEI Tencai Biotwin TEM at 80 kV (CCD and iTEM software; Olympus). Sample preparation and transmission electron microscopy were performed at the EM Core Facility of Yale School of Medicine.
Cardioechography
Mice were anesthetized with 1% isoflurane in oxygen and then placed on a heated procedure board with temperature maintained at 37°C. During the procedure, mice were kept anesthetized with 1% isoflurane supplied by a nose cone connected to an isoflurane vaporizer. Stable sonographic images and data (both B and M mode) were acquired and analyzed using Vevo 770 (VisualSonics). Systolic and diastolic left ventricle wall thicknesses and chamber dimensions were measured using M‐mode images. Ejection fraction (EF in %) and fractional shortening (FS in %) were calculated using the included software.
Pressure–Volume Analysis
Mice were anesthetized with an intraperitoneal injection of ketamine (100 mg/kg body weight) and xylazine (5 mg/kg) and placed on a heated pad to maintain body temperature at 37°C. The trachea was orally intubated and connected to a volume‐controlled ventilator at a respiratory rate of 100 breaths/min with room air. A 1.2‐French conductance pressure–volume catheter (Scisense) was inserted via the right carotid artery to measure left ventricular (LV) function. LV pressure and volume signals were continuously monitored and digitally recorded at 1000 Hz (Sciences Inc). Baseline hemodynamic parameters were recorded for 10 minutes following 10‐minute stabilization after surgical preparation. Mean blood pressure, LV peak pressure, and high‐fidelity positive and negative dP/dt (dP/dtmax and dP/dtmin) values were calculated using the analysis software LabScribe2 (iWorx, CB Sciences Inc)
Statistical Analysis
Ordinary 1‐way ANOVA was used for comparison among 3 or more groups, and post hoc Dunnett's multiple comparison test was performed where applicable. For data with non‐Gaussian distribution (see later, Figure 11F and 11G), Kruskal–Wallis 1‐way ANOVA was used with post hoc Dunn's multiple‐comparison test. The unpaired Student's t‐test was used for comparison between 2 groups. Data were shown as mean±SEM. The log‐rank test was used for analyzing survival data. A value of P<0.05 was considered statistically significant. All statistical analyses were performed using Prism 6 (GraphPad Software, Inc)
Results
Adipocyte‐Specific HIF Activation Results in Lethal Cardiomegaly
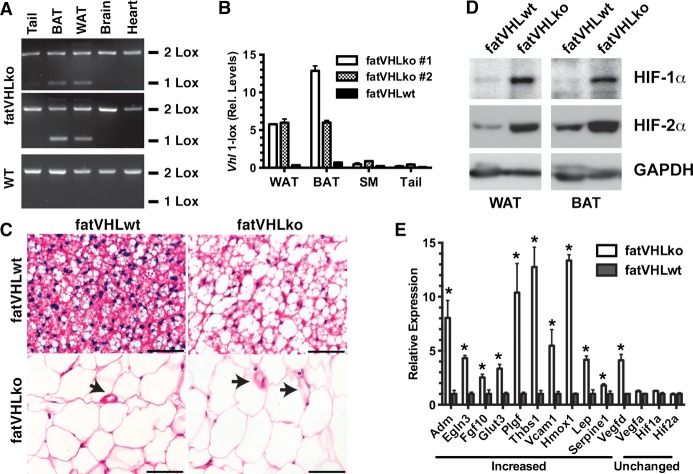
Loss of pVHL leads to HIF activation,11 which provides a genetic approach to mimic hypoxia signal transduction. We therefore created a genetic mouse model (fatVHLko, Figure 1) with adipocyte‐specific inactivation of Vhl by crossing the Vhlf/f mice with the transgenic mice carrying the cre recombinase driven by the adipocyte‐specific aP2/Fabp4 promoter developed by Dr Barbara Kahn.18 The cre‐mediated recombination occurred specifically in both interscapular brown (BAT) and perigonadal white (WAT) adipose tissue with no detectable cre‐mediated recombination in other tissues, including heart, brain, liver, macrophages, and skeletal muscle (Figures 1A and 1B and 2A and 2B). Consistently, other groups have also reported highly adipocyte‐specific recombination in this particular aP2/Fabp4‐cre transgenic mouse strain.18,20–22
Figure 1.
Generation of the mouse model with adipocyte‐specific Vhl deletion. A, End point PCR confirms the specific Vhl recombination (1‐Lox) in perigonadal white (WAT) and interscapular brown (BAT) fat of fatVHLko mice with fatVHLwt littermates as the wild‐type (WT) control. B, Quantitative real‐time PCR shows robust increases of the recombined Vhl allele (1‐Lox) in WAT, BAT, skeletal muscle (SM), and tail of fatVHLko mice. C, Histochemical (H&E, scale=50 μm) analysis shows enlarged WAT and BAT cells from fatVHLko mice. Arrows indicate blood vessels. D, Western blots show strong accumulation of HIF‐1α and HIF‐2α proteins in WAT and BAT of fatVHLko mice. E, Expression of selective hypoxia‐inducible genes in interscapular fat pad is analyzed by qRT‐PCR (n=3, *P<0.05 vs fatVHLwt, t‐test). Adm indicates adrenomedullin; BAT, brown adipose tissue; Egln3, EGL nine homolog 3; H&E, hematoxylin and eosin; HIF, hypoxia‐inducible factor; Hmox1, heme oxygenase 1; Lep, leptin; qRT‐PCR, quantitative real‐time polymerase chain reaction; Thbs1, thrombospondin 1; VHL, von Hippel–Lindau; WAT, white adipose tissue.
Figure 2.
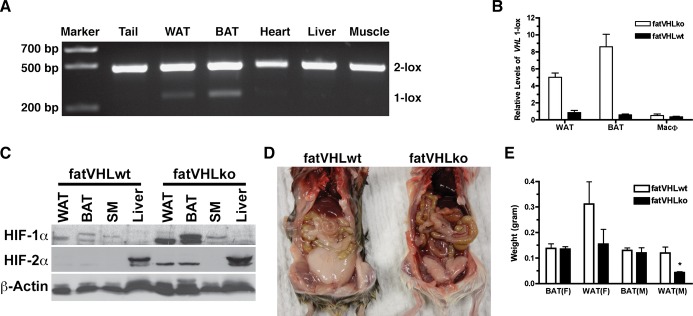
Specificity of aP2‐cre–mediated Vhl recombination in adipocytes. A, No significant Vhl recombination was found in heart, liver, and skeletal muscle. DNA was made from indicated tissues. The floxed Vhl alleles before (2‐Lox) and after (1‐Lox) recombination were detected by PCR as described in Methods. B, No significant Vhl recombination was found in macrophages. Genomic DNA was prepared from interscapular fat pad (BAT), perigonadal fat pad (WAT), or thioglycollate‐induced peritoneal macrophages. The recombination product (Vhl 1‐lox) was measured by quantitative PCR. C, Specific accumulation of HIF‐1α and HIF‐2α proteins in both WAT and BAT of fatVHLko mice was confirmed by Western blotting. No accumulation of HIF‐1α was observed in skeletal muscle and liver. No accumulation of HIF‐2α was observed in skeletal muscle. Note that HIF‐2α was constitutively expressed in liver. D and E, Visceral adiposity (WAT) in fatVHLko mice was generally reduced in comparison to their wild‐type littermates, whereas weight of interscapular fat (BAT) did not change significantly (6 to 10 weeks old). *P<0.05 (t‐test) compared with fatVHLwt, n=3 (male), n=5 (female). BAT indicates brown adipose tissue; HIF, hypoxia‐inducible factor; KO, knockout; PCR, polymerase chain reaction; VHL, von Hippel‐Lindau; WAT, white adipose tissue; WT, wild type.
Morphologically, the majority of BAT and WAT adipocytes of the homozygous fatVHLko mice were enlarged (Figure 1C), likely due to increased glucose uptake and intracellular lipid accumulation resulting from HIF activation,10,12,15,23 which also indicates highly efficient cre‐mediated recombination in adipocytes. Western blots showed robust accumulation of HIF‐1α and HIF‐2α proteins in both BAT and WAT of fatVHLko mice (Figures 1D and 2C), further confirming HIF activation in fatVHLko adipose tissue.
Homozygous fatVHLko mice were born with an expected Mendelian ratio and showed no gross developmental defects at birth. Both male and female mice appeared to have normal development of interscapular fat. However, visceral fat was generally reduced (Figure 2D and 2E), suggesting a depot‐dependent effect of HIF activation on adipose development. Because the gross development of the interscapular fat pad was similar in both female and male fatVHLko mice, we reasoned that biological changes induced by Vhl‐deletion in interscapular fat would be underscored by common mechanisms in a sex‐independent manner. By gene expression analysis, we found that many of the known HIF targets24 were significantly upregulated in fatVHLko fat (Figure 1E and Table 3). Importantly, among the upregulated genes, Hmox1, Lep, Serpine1/Pai1, and Vegfd/Figf are also increased in obese mice and humans.6,25 However, Vegfa was not significantly changed in fatVHLko mice, similar to observations in ob/ob mice.6 Collectively, these data demonstrate that adipocyte‐specific Vhl deletion leads to activation of the HIF pathway and increased expression of several key obesity‐associated genes.
Table 3.
A Selective List of Hypoxia‐Inducible Genes Differentially Regulated in fatVHLko Adipose Tissue (n=3)
| Gene Symbol | Gene Name | NCBI Accession | FDR Adjusted P Value | Fold‐Change (KO vs WT) |
|---|---|---|---|---|
| Hmox1 | Heme oxygenase 1 | NM_010442 | 0.0064 | 5.54 |
| Thbs1 | Thrombospondin 1 | NM_011580 | 0.0039 | 4.86 |
| Serpine1 | Plasminogen activator inhibitor‐1 (PAI‐1) | NM_008871 | 0.0067 | 4.70 |
| Adm | Adrenomedullin | NM_009627 | 0.0059 | 3.80 |
| Aldh3b2 | Aldehyde dehydrogenase 3B2 | NM_001177438 | 0.0110 | 3.73 |
| Slc2a3 | Solute carrier family 2 (facilitated glucose transporter) member 3 or Glut3 | NM_011401 | 0.0069 | 3.26 |
| Lep | Leptin | NM_008493 | 0.0471 | 3.08 |
| Egln3 | EGL (egg‐laying abnormal) 9 homolog 3 (Caenorhabditis elegans) or PHD3 (prolyl hydroxylase domain‐containing 3) | NM_028133 | 0.0041 | 2.76 |
| Upp1 | Uridine phosphorylase 1 | NM_009477 | 0.0109 | 2.27 |
| Pgf | Placental growth factor | NM_008827 | 0.0380 | 2.03 |
FDR indicates false discovery rate; KO, knockout; NCBI, National Center for Biotechnology Information; WT, wild type.
Postnatally, fatVHLko mice developed cardiomegaly within the first week of life, which coincides with the rapid postnatal development of adipose tissue.26 Compared with WT littermates, the homozygous KO mice did not vary in body weight (Figure 3A), and most organs appeared grossly normal at necropsy except for significant cardiomegaly with enlarged ventricular sizes and wall thicknesses (Figure 4; later, see Figure 7) in every single KO mouse examined. Immunohistochemical von Willebrand factor staining showed dramatically increased cardiac angiogenesis (Figure 4C and 4D). Increased angiogenesis was also found in other tissues (data not shown), suggesting elevated secretion of proangiogenic cytokines by fatVHLko adipocytes. However, fatVHLko mice showed normal hematocrit, hemoglobin concentration, and red blood cell counts (Figure 3B through 3D), suggesting that deletion of Vhl in adipocytes does not alter erythropoiesis. The sizes of fatVHLko cardiomyocytes were significantly increased compared with WT cells (Figure 4E). There were also significantly higher numbers of Ki67+ cells but not appreciable changes in apoptosis, as shown by terminal deoxynucleotidyl transferase dUTP nick end labeling staining, in the heart of fatVHLko mice compared with their WT littermates (Figure 4F and 4G). However, it is possible that the Ki67+ cells may also contain other cell types (fibroblasts, endothelial cells, and/or immune cells). Nonetheless, these results suggest that cardiomegaly likely results from both hypertrophy and hyperplasia of cardiomyocytes. The median survival time of fatVHLko mice is 10 weeks (Figure 4H). In contrast, Vhl heterozygous mice showed no pathological symptoms.
Figure 3.
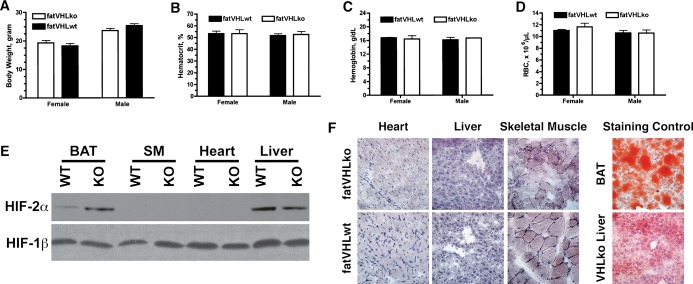
Gross phenotypes and hematological parameters of fatVHLko mice. A, Body weight comparison of 6‐ to 8‐week‐old mice, n=7 to 9 per group. Hematocrit (B), hemoglobin concentrations (C), and red blood cell (RBC) counts (D) of the peripheral blood of fatVHLko mice and wild‐type littermates (n=3 each, 6‐ to 8‐week‐old). No significant statistical differences were found. (E) Increased accumulation of HIF‐2α was found in adipose tissue only by Western blot using tissue homogenates from fatVHLko (KO) and wild‐type littermate controls (WT) with HIF‐1β as loading control. Results were validated in 3 pairs of KO and WT mice. F, Lack of fat accumulation (Oil Red O staining) in frozen sections of heart, liver, and skeletal muscle from fatVHLko and wild‐type mice. BAT and liver from a hepatocyte‐specific Vhl knockout mouse were used as positive controls. BAT indicates brown adipose tissue; HIF, hypoxia‐inducible factor; SM, skeletal muscle; VHL, von Hippel–Lindau.
Figure 4.
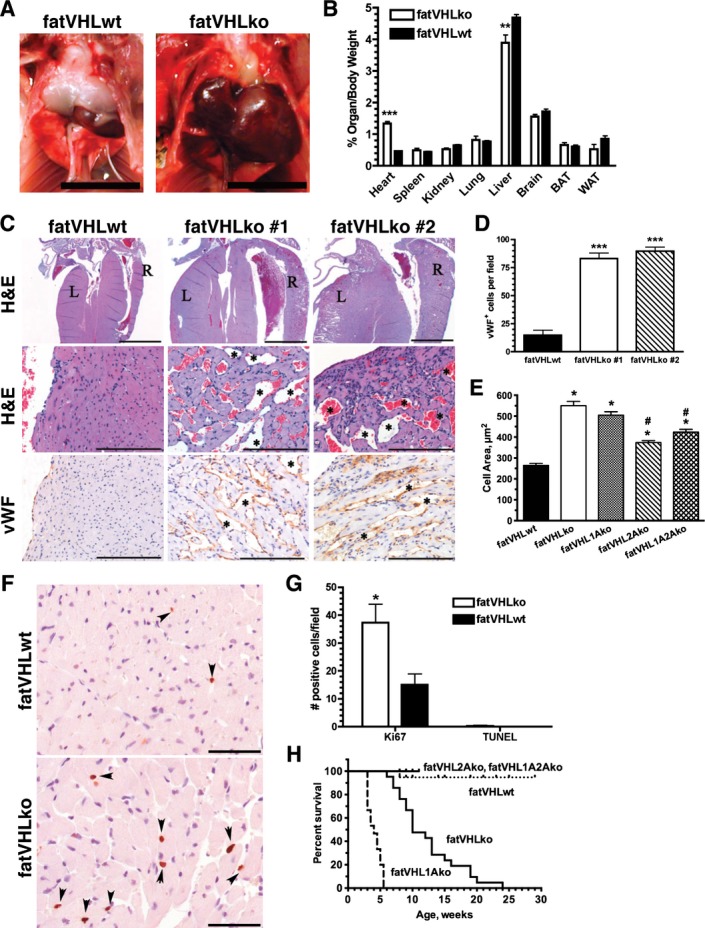
Loss of Vhl in adipocytes results in defective cardiac development. A, Marked cardiomegaly in fatVHLko mice compared with wild‐type littermates. Scale=1 cm. B, Organ‐to‐body weight comparison (female and male combined) was performed using Student's t‐test. ***P<0.0001, **P<0.002, fatVHLko (n=8) vs fatVHLwt (n=17). C, Histopathology of the heart indicates ventricular hypertrophy in fatVHLko mice compared with fatVHLwt mice. Left (L) and right (R) ventricles are labeled (Top, H&E). Blood‐filled vascular spaces are marked by * (middle, H&E). Blood vessels are visualized by IHC using anti–von Willebrand factor (vWF, bottom). Scales=2000 μm (top) and 100 μm (middle and bottom). D, Numbers of vWF+ cells per microscopic field were counted (n=3, ***P<0.001 vs fatVHLwt, respectively, t‐test). E, Cross‐sectional areas of cardiomyocytes (n=80, P<0.0001 1‐way ANOVA; * indicates significance vs fatVHLwt; # indicates significance vs fatVHLko or fatVHL1Ako, Dunnett's multiple comparison test) measured from lectin‐stained heart tissue sections. F, Ki67 IHC (DAB, hematoxylin; scale=50 μm) in left ventricular papillary muscle (arrowheads). G, Cell counts for Ki67+ (n=3) or TUNEL+ (n = 4) cells in the heart per microscopic field. *P<0.05 vs fatVHLwt (t‐test). H, Cumulative survival of fatVHLwt (n=19), fatVHLko mice (n=20), fatVHL1Ako (n=15), fatVHL2Ako (n=15), and fatVHL1A2Ako (n=12). P<0.0001 (log‐rank test). Median survival (weeks): fatVHL1Ako=4, fatVHLko=10. Both female and male mice are included. DAB indicates diaminobenzedine; H&E, hematoxylin and eosin; IHC, immunohistochemistry; KO, knockout; TUNEL, terminal deoxynucleotidyl transferase dUTP nick end labeling; VHL, von Hippel–Lindau; WT, wild type.
Several mouse models27 have been generated with conditional Vhl deletion in hepatocytes, endothelial cells, and myeloid cells (including macrophages), respectively, but none of them have developed cardiac defects. Previously, we found that mice with conditional Vhl deletion in cardiomyocytes developed cardiac defects by 5 months of age.23 In contrast, our fatVHLko mice in this study exhibited cardiomegaly by postnatal day 7. Furthermore, consistent with other reports,18,20–22 no significant recombination of Vhl alleles, nor accumulation of HIF‐α protein, was observed in the heart (Figures 2A and 3E). There was also no intracellular lipid accumulation in cardiomyocytes or hepatocytes (Figure 3F), a prominent phenotype of Vhl deletion in these tissues.15,23 Consistently, electron microscopic examination also did not show abnormal fat accumulation in cardiomyocytes (Figure 5E). Therefore, our fatVHLko mice developed the pathological cardiac hypertrophy likely resulting from adipocyte‐specific Vhl deletion. In conclusion, this is the first genetic model that has clearly established adipocyte HIF activation as a significant cause of pathological cardiomegaly.
Figure 5.
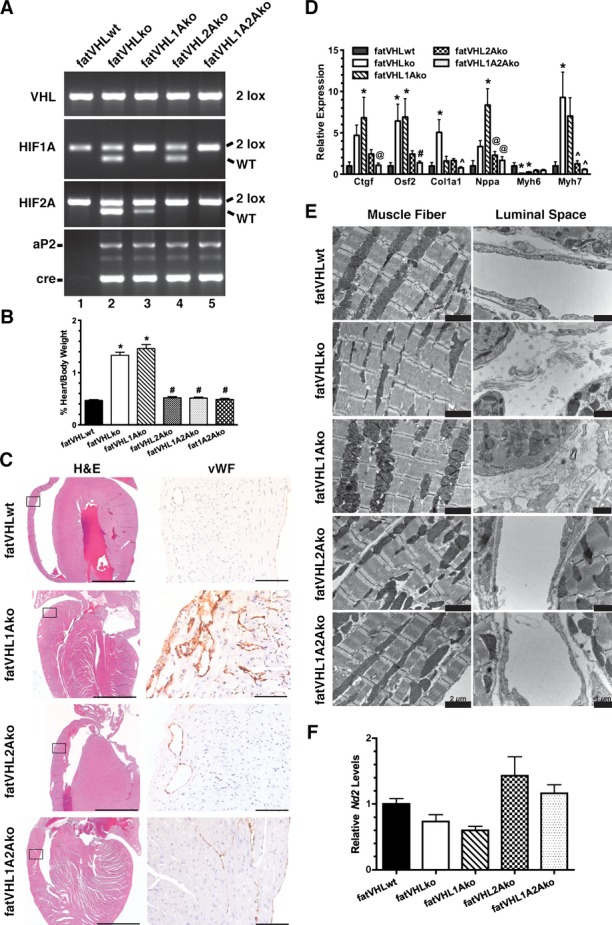
Hif2a deletion rescues the cardiac phenotype in fatVHLko mice. A, Generation of Vhl single KO (fatVHLko), Vhl/Hif1a double KO (fatVHL1Ako), Vhl/Hif2a double KO (fatVHL2Ako), and Vhl/Hif1a/Hif2a triple KO (fatVHL1A2Ako) mice, as shown by tail genotyping. Littermates without aP2‐cre were used as WT controls (fatVHLwt). B, Heart‐to‐body weight ratios (%). fatVHLwt: n=17; fatVHLko: n=9; fatVHL1Ako: n=6; fatVHL2Ako: n=5; fatVHL1A2Ako: n=7. P<0.0001 (1‐way ANOVA); *P<0.05 vs fatVHLwt; #P<0.05 vs fatVHLko or fatVHL1Ako (Dunnett's multiple‐comparison test). C, Histopathology of the heart indicates correction of cardiomegaly (H&E) and angiogenesis (anti‐vWF) in fatVHL2Ako and fatVHL1A2Ako, but not in fatVHL1Ako mice. Scales: 2000 μm (H&E) and 100 μm (anti‐vWF). D, Hif2a deletion reduces expression of hypertrophic cardiomyopathy‐associated genes in the heart, as shown by quantitative RT‐PCR. For each gene category, P<0.02 (1‐way ANOVA, fatVHLwt: n=6 to 7; fatVHLko: n=6 to 7; fatVHL1Ako: n=6 to 10; fatVHL2Ako: n=5; fatVHL1A2Ako: n=7 to 8). Significant differences (P<0.05) within each gene category: * vs WT, # vs fatVHLko or fatVHL1Ako, ^ vs fatVHLko. @ vs fatVHL1Ako (Dunnett's multiple‐comparison test). E, Electron microscopic analysis of left ventricular muscle shows increased fibrous deposits in fatVHLko and fatVHL1Ako hearts (right panel). F, Real‐time PCR quantification of the mitochondrial NADH dehydrogenase 2 (Nd2) in hearts of transgenic mice. Nd2 levels were normalized to the nucleus‐encoded DNA polymerase β. P=0.014 (1‐way ANOVA) with n=6 (fatVHLwt), 5 (fatVHLko), 6 (fatVHL1Ako), 7 (fatVHL2Ako), and 7 (fatVHL1A2Ako). HIF indicates hypoxia‐inducible factor; KO, knockout; VHL, von Hippel–Lindau; vWF, von Willebrand factor; WT, wild type.
Adipocyte HIF‐2 Is Required for the Development of Cardiomegaly
The hypoxia‐signaling pathway bifurcates to HIF‐1 and HIF‐2. We investigated whether HIF‐1α and HIF‐2α are differentially involved in the development of pathological cardiomegaly using a series of adipocyte‐specific double‐ or triple‐KO models (Figure 5A). Not only did concomitant Hif1a deletion fail to rescue the fatVHLko phenotype (Figure 5), but the median survival time for fatVHL1Ako mice was only 4 weeks (Figure 4H). Unexpectedly, adipocyte‐specific Hif2a deletion completely rescued the fatVHLko phenotypes including pathological cardiomegaly (Figure 5) and adipose tissue development (Figure 6A and 6B). Both fatVHL2Ako and fatVHL1A2Ako mice developed normally and were healthy (Figure 4H). These data clearly indicate that activation of HIF‐2α, but not HIF‐1α, in adipocytes causes severe pathological changes in mice. Consistent with our findings, a previous study showed that transgenic mice with adipocyte‐specific expression of a constitutively active HIF‐1α did not exhibit significant cardiac abnormalities.7
Figure 6.
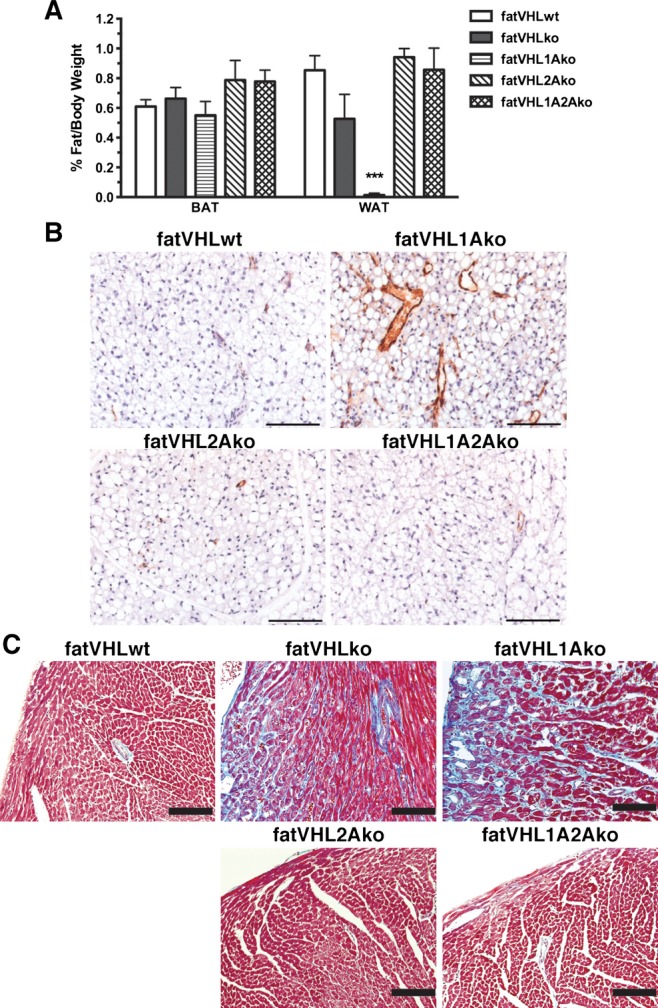
Hif2a deletion rescues the adipose tissue development and cardiac fibrosis in fatVHLko mice. A, Ratios of fat pad‐to‐body weight were analyzed using 1‐way ANOVA and post hoc Dunnett's multiple comparison test (n=17 for fatVHLwt, 8 for fatVHLko, 5 for fatVHL1Ako, 5 for fatVHL2Ako, and 7 for fatVHL1A2Ako). The white fat group (WAT) showed significant differences (P<0.001) especially with significant reduction of WAT in fatVHL1Ako mice compared with fatVHLwt. No differences were found in the BAT (interscapular fat) group. B, Angiogenesis was normalized in fatVHL2Ako and fatVHL1A2Ako, but not in fatVHL1Ako fat pads in comparison to fatVHLwt. B, Parafin‐embeded interscapular brown fat pads were stained with anti‐vWF and counterstained with hematoxylin. C, Cardiac fibrosis was analyzed using Masson's trichrome staining. Gross fibrosis (blue stain) was found in both fatVHLko and fatVHL1Ako hearts. Adipocyte deletion of Hif2a (fatVHL2A and fatVHL1A2A) was sufficient to rescue cardiac fibrosis. Scale bars=100 μm. BAT indicates brown adipose tissue; HIF, hypoxia‐inducible factor; KO, knockout; VHL, von Hippel–Lindau; vWF, von Willebrand factor; WAT, white adipose tissue; WT, wild type.
Deletion of Vhl and double deletion of Vhl and Hif1a in adipocytes strongly induced expression of several hypertrophic cardiomyopathy–associated genes (Figure 5D) including connective tissue growth factor (Ctgf), atrial natriuretic factor (Nppa), and myosin heavy‐chain β (β‐MHC or Myh7). In contrast, concomitant Hif2a deletion by and large rescued the abnormal expression of these cardiomyopathy‐associated genes resulting from the genetic deletion of Vhl±Hif1a in adipocytes. Using electron microscopy (Figure 5E), we found that the cardiomyofiber formation appeared to be normal in all KO models despite decreased ratios of α‐MHC (Myh6):β‐MHC (Myh7) in fatVHLko and fatVHL1Ako hearts (Figure 5D). Nonetheless, both fatVHLko and fatVHL1Ako hearts had pronounced fibrosis, whereas fatVHL2Ako and fatVHL1A2Ako hearts showed no fibrous deposits. Cardiac fibrosis in the hearts of fatVHLko and fatVHL1Ako mice was further confirmed by Masson's trichrome staining (Figure 6C) and was consistent with high levels of Ctgf and Osf2/Postn (Figure 5D), markers of cardiac fibrosis.28 In contrast, increased expression of collagen Iα1 (Col1a1) was found in fatVHLko hearts only (Figure 5D), suggesting both HIF‐1α and HIF‐2α are required for producing adipocyte‐derived factors necessary for driving Col1a1 expression in the heart. Nonetheless, these data clearly demonstrate that activation of HIF‐2 in adipocytes is also responsible for cardiac fibrosis.
As shown by transmission electron microscopy examination, mitochondria structures in fatVHLko cardiomyocytes did not significantly differ from those in WT or Hif2a‐KO cardiomyocytes (Figure 5E). In addition, cardiac mitochondrial biogenesis, as shown by the levels of mitochondrial NADH dehydrogenase 2 (Nd2) gene, in fatVHLko mice was not significantly changed in these KO mice (Figure 5F). These results suggest that cardiomyocyte mitochondrial formation and functions are not strongly affected by HIF activation in adipocytes and are not likely involved in the development of pathological cardiomegaly under these conditions. However, fatVHL1Ako heart did show mitochondrial fragmentation (Figure 5E) and much reduced mitochondrial biogenesis (≈40% reduction of Nd2 compared with fatVHLwt), which might contribute to the more severely compromised heart conditions and shorter life spans of fatVHL1Ako mice.
Activation of Adipocyte HIF‐2 Impairs Cardiac Structure and Function
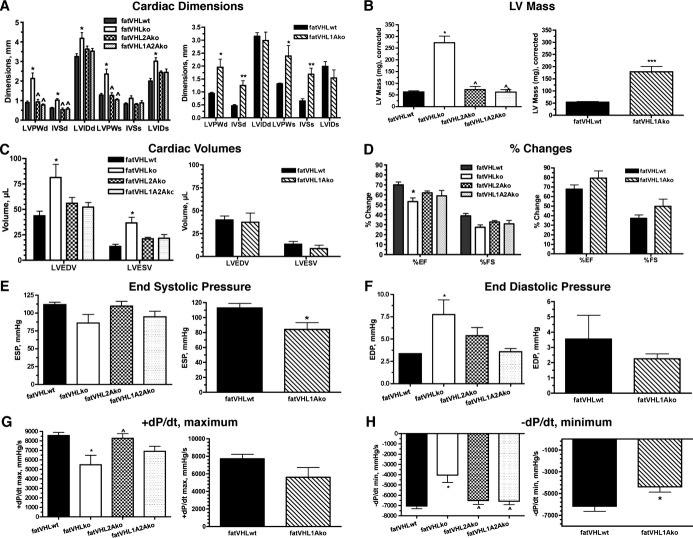
Echocardiography and hemodynamic (catheter) assays were performed on mice at 8 weeks of age, except that fatVHL1Ako mice were 4 weeks old because of their short life span. All mice appeared healthy at the time of examination. Consistent with the morphological and histological analyses, dimensions of the LV and septum, as well as LV mass, were significantly increased in both fatVHLko and fatVHL1Ako mice (Figure 7A and 7B). Again, cardiomegaly was fully rescued on Hif2a deletion in fatVHL2Ako and fatVHL1A2Ako mice (Figure 7A and 7B). Consistent with these results, Hif2a deletion significantly reduced cardiomyocyte hypertrophy compared with both fatVHLko and fatVHL1Ako cardiomyocytes (Figure 4E). Because there were no significant differences in heart rates and mean blood pressures among all groups of mice under assay conditions (Figure 8), these results suggest that HIF activation in adipocytes results in lethal cardiac hypertrophy independently of hypertension.
Figure 7.
Echographic and in vivo hemodynamic analyses reveal cardiac dysfunction in fatVHLko and fatVHL1Ako mice. Procedures were performed on lightly anesthetized mice at ≈8 weeks of age, except that fatVHL1Ako and their WT littermates were at 4 weeks of age. For statistical analysis of multiple data groups (left panels), 1‐way ANOVA was used with post hoc Dunnett'e multiple comparison test. Student's t‐test was used for 2‐group comparison (right panels). Echocardiography is shown in A through D with n=9 for fatVHLwt, n=7 for fatVHLko, n=4 each for fatVHL2Ako and fatVHL1A2Ako. For fatVHL1Ako comparison, n=5 each for fatVHL1Ako and fatVHLwt. A, Cardiac dimensions: LVPW, left ventricle posterior wall; IVS, interventricular septum; LVID, left ventricle internal dimension; d, diastolic; s, systolic. Left panel: P<0.02 (1‐way ANOVA) for each group except IVSs, *P<0.05 vs fatVHLwt and ^ vs fatVHLko. Right panel: *P<0.05 and **P<0.01 for fatVHL1Ako vs fatVHLwt. B, Left ventricle (LV) mass. For the left panel, P<0.0001 (1‐way ANOVA) with significant difference vs fatVHLwt (*) or vs fatVHLko (^). For the right panel comparing fatVHL1Ako to fatVHLwt, ***P<0.001 (t‐test). C, Cardiac volumes (LVEDV, LV end diastole volume and LVESV, LV end systole volume). For the left panel, P<0.02 (1‐way ANOVA). D, Changes in ejection fraction (EF) and fractional shortening (FS). For the left panel, P<0.01 (%EF, 1‐way ANOVA) and *P<0.05 vs fatVHLwt. Hemodynamic analysis (catheter) is shown in E through H with n=8 for fatVHLwt, n=6 for fatVHLko, n=9 for fatVHL2Ako, n=6 for fatVHL1A2Ako, n=4 for fatVHL1Ako, and n=5 for fatVHLwt. E, End systolic pressure (ESP). For the left panel, P=0.065 (1‐way ANOVA). For the right panel comparing fatVHL1Ako to fatVHLwt, ***P<0.05 (t‐test). F, End diastolic pressure (EDP). For the left panel, P=0.01 (1‐way ANOVA) and *P<0.05 vs fatVHLwt. G, Positive pressure changes during heart cycles (+dP/dt maximum). For the left panel, P<0.005 (1‐way ANOVA), *P<0.05 vs fatVHLwt and ^P<0.05 vs fatVHLko. H, Negative pressure changes (−dP/dt minimum). For the left panel, P<0.001 (1‐way ANOVA), *P<0.05 vs fatVHLwt and ^P<0.05 vs fatVHLko. For the right panel comparing fatVHL1Ako to fatVHLwt, *P<0.05 (t‐test). KO indicates knockout; VHL, von Hippel–Lindau; WT, wild type.
Figure 8.
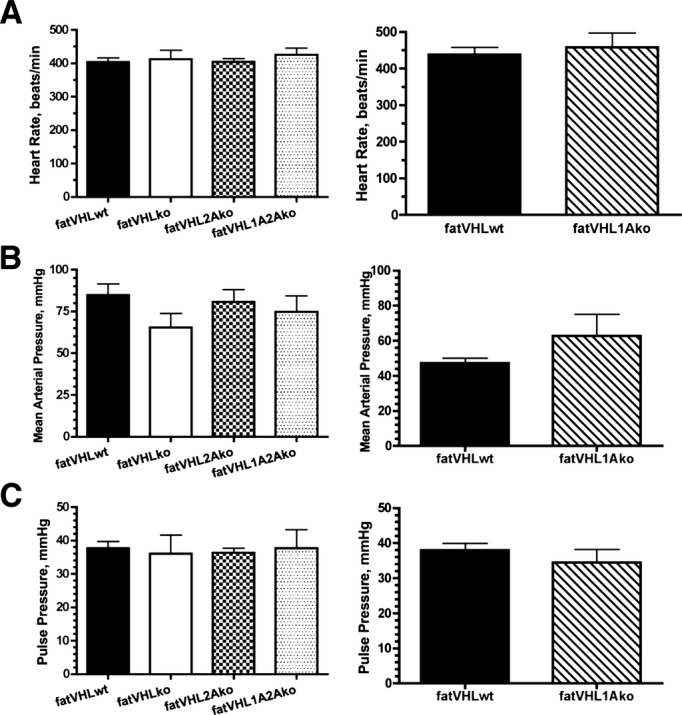
Heart rates and blood pressures of transgenic mice. Heart rates (A) and blood pressures (B and C) were measured using a catheter after bilateral vagus nerves were severed. Mice were 8 weeks old except that the fatVHL1Ako and their wild‐type littermates were 4 weeks old at the time of examination. n=8 for fatVHLwt, 6 for fatVHLko, 9 for fatVHL2Ako, 6 for fatVHL1A2Ako, 4 for fatVHL1Ako, and 5 for fatVHLwt. No significant differences were found between fatVHLwt and each of the transgenic groups. KO indicates knockout; VHL, von Hippel‐Lindau; WT, wild type.
The fatVHLko and fatVHL1Ako hearts appeared to exhibit variable functional defects. Although fatVHLko mice exhibited higher LV volumes (LV end‐diastolic and ‐systolic volumes) but lower EFs (Figure 7C and 7D), fatVHL1Ako mice did not show much change compared with their WT littermates (Figure 7C and 7D), suggesting that Hif1a deletion can correct LV volumes and stroke functions in fatVHLko mice. From the hemodynamic perspective, fatVHLko and fatVHL1Ako mice showed relatively small decreases in end‐systolic pressure (Figure 7E) and in the rate of pressure increase (+dP/dtmax, Figure 7G), although only fatVHLko mice showed moderately higher end‐diastolic pressure compared with fatVHLwt (Figure 7F). Nonetheless, both fatVHLko and fatVHL1Ako mice exhibited significantly lower −dP/dt minimum (Figure 7H). Concomitant deletion of adipocyte Hif2a was able to normalize −dP/dt minimum (Figure 7H). By and large, these KO mice did not develop severely defective heart functions, which may reflect the relatively healthy state of the mice at the time of investigation. It is nonetheless possible that the prolonged pathological cardiomegaly sustained by fatVHLko and fatVHL1Ako mice might lead to their death, perhaps due to acute cardiac failure. Interestingly, reports have shown that obese persons exhibit diastolic dysfunction without hypertension29 and that they develop ventricular hypertrophy and congestive heart failure without other types of heart disease.2,30
Adipocyte HIF Activation Results in Abnormal Lipid Metabolism
Glucose intolerance, insulin resistance, and dyslipidemia are key obesity‐associated risk factors for cardiovascular diseases. We found that both fasting and nonfasting blood glucose levels were lower in both male and female fatVHLko mice (Figure 9A and 9B). Consistent with these findings, Matsuura et al have also shown that genetic deletion of prolyl hydroxylase 2 (Phd2), a negative regulator of HIF‐α, in adipocytes improves glucose tolerance and homeostasis.31 Nonetheless, the relative rates of change in blood glucose concentrations in response to glucose or insulin challenge were comparable between fatVHLko mice and WT littermates (Figure 10A and 10B). Although hyperglycemia and insulin resistance have been considered risk factors for cardiovascular disease, our observations demonstrate, rather surprisingly, that HIF activation in adipocytes can cause pathological cardiomegaly independent of insulin resistance and glucose intolerance.
Figure 9.
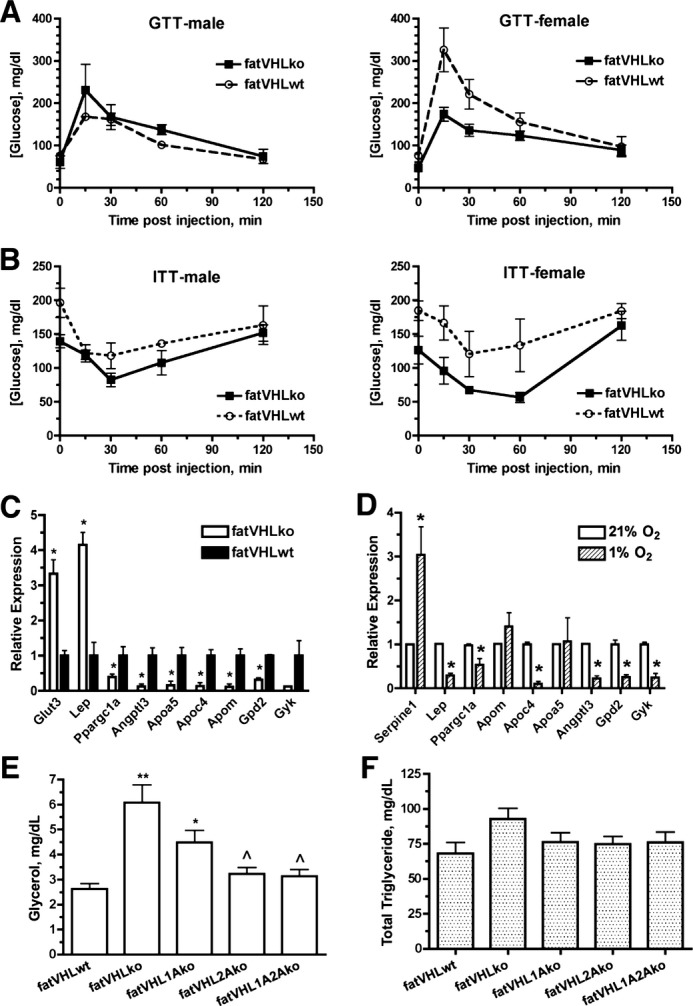
Effects of Vhl deletion in adipocytes on glucose and lipid metabolism. A, Glucose tolerance tests (GTTs) were performed after 14 to 16 hours overnight fasting (n=3 each group, except n=4 for female fatVHLko mice). B, Insulin tolerance tests (ITTs) were performed on postprandial mice (n=5 for female and 4 for male mice). C, Quantitative analysis of selective metabolism genes in adipose tissue (n=3 mice) and (D) in vitro hypoxia‐treated adipocytes (n=3 experiments) by real‐time RT‐PCR. *P<0.05 (t‐test). E, Serum glycerol and (F) total triglycerides were measured in non‐fasted mice (n=16 to 27). In E, P<0.0001, 1‐way ANOVA with significant difference between fatVHLko (**) or fatVHL1Ako (*) vs fatVHLwt, and significance (^) between fatVHLko vs fatVHL2A or fatVHL1A2A (Dunnett's multiple comparison). In F, P=0.16 (1‐way ANOVA). Angptl3 indicates angiopoietin‐like 3; Apoa5, apolipoprotein A‐V; Apoc4, apolipoprotein C‐IV; Apom, apolipoprotein M; Gpd2, glycerol phosphate dehydrogenase 2; Gyk, glycerol kinase; KO, knockout; Lep, leptin; Ppargc1a, peroxisome proliferative activated receptor γ coactivator 1a; VHL, von Hippel–Lindau; WT, wild type.
Figure 10.
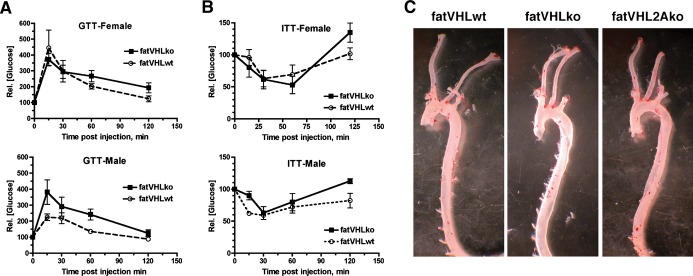
Metabolic and aortic phenotypes of transgenic mice. A, Glucose tolerance tests (GTTs) were performed after 14 to 16 hours overnight fasting (n=3 each group, except n=4 for female fatVHLko mice). B, Insulin tolerance tests (ITTs) were performed on postprandial mice (n=5 for female and 4 for male mice). Changes in glucose concentrations were shown as relatvie values with respective starting glucose value as 100. C, Genetic deletion of Vhl in adipocytes does not lead to intra‐aortic lipid deposition (an atherosclerotic lesion). Aortas were isolated from mice of indicated genotypes and fixed in 4% paraformaldehyde. Periaortic fat tissue was removed under a dissecting microscope. Aortas were opened lengthwise and then stained in an Oil Red O staining solution for 1 hour. Microscopic inspection found no presence of lipid deposits or atherosclerotic lesions on the inner surface of aortas. The red stain in the micrographs came from residual periaortic fat tissue. KO indicates knockout; VHL, von Hippel–Lindau; WT, wild type.
Using cDNA microarrays, we found that several apolipoproteins (Apoa5, Apoc4, and Apom) and lipoprotein lipase inhibitor Angptl3 were significantly downregulated in fatVHLko adipose tissue (Table 4), suggesting compromised lipid transport and metabolism in adipocytes. Reduced expression of Ppargc1a (peroxisome proliferator‐activated receptor‐γ coactivator 1α) and Ucp1 (uncoupling protein 1) suggests repressed mitochondrial function and thus decreased lipid oxidation. Furthermore, decreased expression of glycerol phosphate dehydrogenase 2 (Gpd2) and glycerol kinase (Gyk) suggests compromised glycerol and lipid metabolism in adipocytes (Table 4). Expression of several representative genes was further validated by qRT‐PCR (Figure 9C). Using in vitro‐derived adipocytes, we found that Apoc4, Angptl3, Gpd2, and Gyk were strongly downregulated by hypoxia, whereas Apoa5 and Apom were not significantly affected (Figure 9D), indicating that hypoxia alone can repress expression of lipid metabolism genes in adipocytes. Furthermore, circulating levels of glycerol were increased in both fatVHLko and fatVHL1Ako mice but were nearly normalized in fatVHL2Ako and fatVHL1A2Ako mice (Figure 9E). However, serum triglyceride levels were not changed significantly in these KO mice (Figure 9F). The latter finding was consistent with the lack of lipid deposition either in the aortas (Figure 10C) or in the heart, liver, and skeletal muscle from fatVHLko mice (Figure 3F). These results suggest that HIF activation in adipocytes can lead to the development of pathological cardiac hypertrophy independent of hyperlipidemia and atherosclerotic lesions.
Table 4.
Metabolism Genes Differentially Regulated in fatVHLko Adipose Tissue (n=3)
| Gene | NCBI Accession | FDR Adjusted P Value | Fold‐Change (KO vs WT) |
|---|---|---|---|
| Aldh3b2 (aldehyde dehydrogenase) | NM_001177438 | 0.011 | 3.73 |
| Slc2a3 (solute carrier family 2, member 3 or Glut3) | NM_011401 | 0.007 | 3.26 |
| Slc25a10 (mitochondrial carrier, dicarb) | NM_013770 | 0.021 | 3.23 |
| Slc27a1 (fatty acid transporter) | NM_011977 | 0.004 | 3.22 |
| Lep (leptin) | NM_008493 | 0.047 | 3.08 |
| Fads3 (fatty acid desaturase 3) | NM_021890 | 0.029 | 2.80 |
| Aldh1 l1 (aldehyde dehydrogenase 1 family, member L1) | NM_027406 | 0.007 | 2.52 |
| Abcd2 (ATP‐binding cassette, subfamily D, member 2 or Aldl1 or Aldrp) | NM_011994 | 0.034 | 2.28 |
| Fmo2 (flavin containing monooxygenase) | NM_018881 | 0.025 | 2.22 |
| Cbr3 (carbonyl reductase) | NM_173047 | 0.018 | 2.20 |
| Gpx8 (glutathione peroxidase) | NM_027127 | 0.004 | 2.09 |
| Fads1 (fatty acid desaturase 1) | NM_146094 | 0.025 | 2.08 |
| Pxmp2 (peroxisomal membrane protein) | NM_008993 | 0.006 | 2.01 |
| Ndufa4l2 (NADH dehydrogenase [ubiquinone] 1a subcomplex) | NM_001098789 | 0.007 | 2.01 |
| Gpd2 (glycerol phosphate dehydrogenase) | NM_010274 | 0.006 | −2.01 |
| Pgam2 (phosphoglycerate mutase) | NM_018870 | 0.038 | −2.01 |
| Pfkl (phosphofructokinase) | NM_008826 | 0.004 | −2.07 |
| Fabp3 (fatty acid binding protein 3) | NM_010174 | 0.020 | −2.08 |
| Acsm1 (acyl‐CoA synthetase medium‐chain family) | NM_054094 | 0.035 | −2.16 |
| Ppargc1a (peroxisome proliferative activated receptor g coactivator 1a) | NM_008904 | 0.018 | −2.21 |
| Ptger3 (prostaglandin E receptor) | NM_011196 | 0.015 | −2.23 |
| Acsl5 (acyl‐CoA synthetase long‐chain family) | NM_027976 | 0.004 | −2.46 |
| Apoa5 (apolipoprotein A‐V) | NM_080434 | 0.017 | −2.54 |
| Ahcy (S‐adenosylhomocysteine hydrolase) | NM_016661 | 0.016 | −2.64 |
| Slc3a1 (solute carrier family 3, member 1) | NM_009205 | 0.036 | −2.64 |
| Slc27a5 (solute carrier family 27 [fatty acid transporter], member 5) | NM_009512 | 0.031 | −2.81 |
| Akr1c14 (aldo‐keto reductase family) | NM_134072 | 0.031 | −2.84 |
| Apom (apolipoprotein M) | NM_018816 | 0.038 | −3.01 |
| Me3 (malic enzyme) | NM_181407 | 0.006 | −3.38 |
| Upp2 (uridine phosphorylase) | NM_029692 | 0.038 | −3.42 |
| Gyk (glycerol kinase) | NM_212444 | 0.022 | −3.43 |
| Aldh8a1 (aldehyde dehydrogenase 8 family, member A1) | NM_178713 | 0.038 | −3.56 |
| Apoc4 (apolipoprotein C‐IV) | NM_007385 | 0.033 | −3.57 |
| Ugt3a1 (UDP glycosyltransferase 3a1) | NM_207216 | 0.047 | −3.95 |
| G6pc (glucose‐6‐phosphatase) | NM_008061 | 0.032 | −4.03 |
| Angptl3 (angiopoietin‐like 3) | NM_013913 | 0.042 | −4.06 |
| Aass (aminoadipate‐semialdehyde synthase) | NM_013930 | 0.030 | −4.64 |
| Elovl2 (elongation of very long chain fatty acids) | NM_019423 | 0.027 | −4.64 |
| Ugt3a2 (UDP glycosyltransferase 3a2) | NM_144845 | 0.040 | −5.50 |
| Ugt2a3 (UDP glycosyltransferase 3a2) | NM_028094 | 0.026 | −6.20 |
| Akr1c6 (aldo‐keto reductase family) | NM_030611 | 0.040 | −8.05 |
| Ucp1 (uncoupling protein) | NM_009463 | 0.004 | −13.10 |
FDR indicates false discovery rate; KO, knockout; NCBI, National Center for Biotechnology Information; WT, wild type.
Activation of the Adipocyte HIF‐2 Pathway Results in Adipose Inflammation
Obesity often leads to chronic inflammation in adipose tissue with increased production of inflammatory cytokines including IL‐1, IL‐6, and TNF‐α.5–6 The HIF pathway plays an important role in inflammatory responses. First, HIF‐1 regulates the transcription of several important inflammatory genes,32–33 including inducible nitric oxide synthase (Nos2), macrophage migration inhibitory factor (Mif), and transforming growth factor (Tgfb). Second, several types of inflammatory cytokines can increase HIF‐1α expression and its transcription activities.34 Among them, IL‐1, IL‐6, TNF‐α, and transforming growth factor‐β are robustly increased in adipose tissue with obesity and in hypoxia‐treated adipocytes.6 These observations strongly suggest existence of a positive feedback loop between HIF and inflammatory cytokines.
The fatVHLko mice showed higher numbers of circulating lymphocytes and monocytes (Figure 11A and 11B), suggesting an inflammatory state. Compared with the WT controls, immunoglobulin genes were the most increased genes in fatVHLko adipose tissue (>5‐fold, Table 5), suggesting significant infiltration of leukocytes that likely resulted from increased expression of a large number of chemokines including MCPs (Ccl2, Ccl7, and Ccl8) and MIP‐1α (Ccl3) in fatVHLko fat (Table 5 and Figure 11C). We also found that Il1b, Il6, Mmp9, and Tnf were significantly upregulated in fatVHLko fat (Figure 11C). Interestingly, these inflammation‐related genes are also strongly increased in fat tissues of obese humans and/or mice.6,25 Furthermore, elevated expression of Emr1 (F4/80) suggests increased macrophage infiltration in adipose tissue (Figure 11C). Using in vitro‐derived adipocytes, we found that hypoxia significantly increased the expression of Il6, Mmp9, Tnf, and Ccl genes (Figure 11D). Again, concomitant deletion of Hif2a but not Hif1a in adipocytes led to reduced expression of key inflammatory genes, especially Tnfa and Pai1 (plasminogen activator inhibitor 1), in adipose tissue (Figure 11E). These observations strongly suggest that adipocyte HIF‐2α plays a dominant role in mediating adipocyte‐dependent inflammatory responses.
Figure 11.
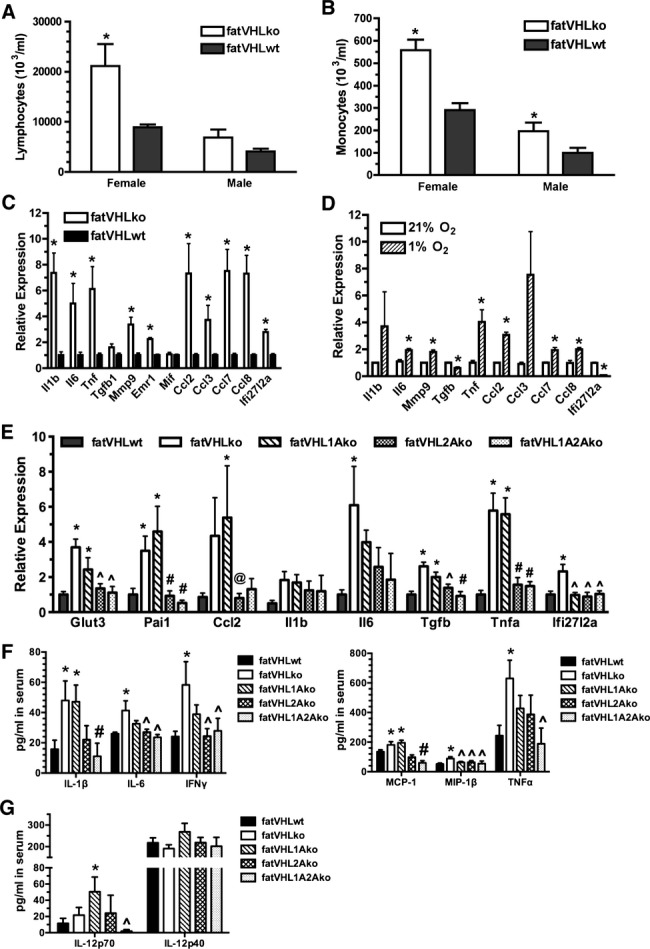
Activation of the adipocyte HIF‐2 pathway increases inflammatory cytokine expression. Analysis of circulating lymphocytes (A) and monocytes (B). *P<0.05 vs WT (t‐test). n=3 (female KO), 5 (female WT), 4 (male KO), and 6 (male WT), respectively. Quantitative analysis of selective inflammatory cytokines in (C) adipose tissue (n=3 mice) and (D) in vitro hypoxia‐treated adipocytes by real‐time RT‐PCR, n=3 experiments, *P<0.05 vs 21% O2 (t‐test). E, Concomitant Hif2a deletion in adipocytes reduces the expression of inflammatory cytokines in adipose tissue. Total RNA was prepared from interscapular fat pads and was subjected to quantitative RT‐PCR. P<0.025 (1‐way ANOVA) for each gene category except Il1b (P=0.26); fatVHLwt: n=13; fatVHLko: n=5; fatVHL1Ako: n=5; fatVHL2Ako: n=7; fatVHL1A2Ako: n=5. Significance within each gene category: * vs fatVHLwt; # vs fatVHLko or fatVHL1Ako; ^ vs fatVHLko, and @ vs fatVHL1Ako (Dunnett's multiple comparison). F and G, Quantitative multiplexed cytokine assay (n=12 per genotype). For the IL‐1β, IL‐6, IFNγ, and MCP‐1 group, P<0.05 (1‐way ANOVA with Fisher's LSD test for multiple comparison). For the MIP‐1β, TNFα, and IL‐12p70 group, P<0.05 (Kruskal–Wallis test with Dunn's multiple‐comparison test). Significant pairwise differences within each cytokine category: * vs fatVHLwt; # vs fatVHLko or fatVHL1Ako; and ^ vs fatVHLko. No significant differences were found in the IL‐12p40 group (P=0.35, 1‐way ANOVA). Ccl2 indicates chemokine (C‐C motif) ligand 2; HIF, hypoxia‐inducible factor; IFNγ, interferon γ; IL, interleukin; KO, knockout; TGF, transforming growth factor; TNFα, tumor necrosis factor α; VHL, von Hippel–Lindau; WT, wild type.
Table 5.
Inflammatory/Immune Genes Differentially Regulated in fatVHLko Adipose Tissue (n=3)
| Gene Symbol | Gene Name | NCBI Accession | FDR Adjusted P Value | Fold‐Change (KO vs WT) |
|---|---|---|---|---|
| Igk‐V1 | Z95477 | 0.0019 | 20.42 | |
| Igk | BC128281 | 0.0052 | 11.92 | |
| Igk‐V28 | DQ078272 | 0.0042 | 8.88 | |
| Igkv4‐71 | NC_000072 | 0.0039 | 8.77 | |
| Igj | NM_152839 | 0.0056 | 7.29 | |
| Igh | BC092065 | 0.0236 | 7.19 | |
| Igk‐V19‐14 | U59155 | 0.0065 | 6.48 | |
| Igl‐V2 | NC_000082 | 0.0025 | 3.05 | |
| Ccl8 (MCP‐2) | Chemokine (C‐C motif) ligand 8 | NM_021443 | 0.0160 | 3.65 |
| Ccl7 (MCP‐3) | Chemokine (C‐C motif) ligand 7 | NM_013654 | 0.0177 | 2.73 |
| Ccl3 (MIP‐1a) | Chemokine (C‐C motif) ligand 3 | NM_011337 | 0.0309 | 2.46 |
| Ccl2 (MCP‐1) | Chemokine (C‐C motif) ligand 2 | NM_011333 | 0.0267 | 2.32 |
| Ccl24 (MPIF‐2) | Chemokine (C‐C motif) ligand 24 | NM_019577 | 0.0041 | 2.25 |
| Ccl6 (MRP‐1) | Chemokine (C‐C motif) ligand 6 | NM_009139 | 0.0115 | 2.01 |
| Cxcl9 (Mig) | Chemokine (C‐X‐C motif) ligand 9 | NM_008599 | 0.0285 | 2.00 |
| Ifi27l2a | Interferon α–inducible protein 27 like 2A | NM_029803 | 0.0255 | 2.54 |
| Vcam1 | Vascular cell adhesion molecule 1 | NM_011693 | 0.0086 | 2.30 |
| Cd53 | CD53 antigen | NM_007651 | 0.0076 | 2.25 |
| Cd93 (Ly68) | CD93 antigen | NM_010740 | 0.0083 | 2.10 |
| Ly86 (MD1) | Lymphocyte antigen 86 | NM_010745 | 0.0055 | 2.09 |
FDR indicates false discovery rate; KO, knockout; NCBI, National Center for Biotechnology Information; WT, wild type.
It is likely that circulating factors secreted either directly by adipose or indirectly by other tissues are key contributors to the development of pathological cardiac hypertrophy in fatVHLko and fatVHL1Ako mice. Hence, we determined the serum concentrations of relevant inflammatory cytokines using a quantitative multiplexed cytokine assay (Bio‐Plex, Bio‐Rad). From a panel of 15 representative cytokines (see Methods for details), those with significant changes are shown in Figure 11F and 11G. Notably, the circulating levels of IL‐1β and MCP‐1 were significantly increased in both fatVHLko and fatVHL1Ako mice (Figure 11F), correlating well with gross cardiomegaly. Interestingly, deletion of adipocyte Hif2a reduced the serum levels of IL‐1β and MCP‐1/chemokine (C‐C motif) ligand 2 (CCL2) to those in fatVHLwt mice (Figure 11F), consistent with the normal heart phenotype found in fatVHL2A and fatVHL1A2Ako mice. These data strongly suggest that IL‐1β and MCP‐1/CCL2 have the potential to facilitate the development of pathological cardiac hypertrophy. On the other hand, IL‐6, IFNγ, MIP‐1β, and TNF‐α are not likely to be key factors of cardiomegaly because their serum levels in fatVHL1Ako mice are not significantly different from those of the WT controls as well as the asymptomatic fatVHL2Ako and fatVHL1A2Ako mice (Figure 11F). Nevertheless, these data demonstrate that expression of IL‐6, IFNγ, and TNF‐α is likely dependent on the transcription activities of both HIF‐1 and HIF‐2 in adipocytes.
It is very interesting that serum concentrations of the biologically active IL‐12‐p70 (IL‐12αβ heterodimer) in fatVHL1Ako mice were significantly higher than the WT control and moderately higher than fatVHLko (Figure 11G). In contrast, serum concentrations of the inactive IL‐12‐p40 (IL‐12β) did not change much among these mice. These observations suggest that IL‐12p70, a proinflammatory cytokine secreted by B cells, dentritic cells, and macrophages, may potentially exacerbate hypertrophic heart conditions in fatVHL1Ako mice. However, it is possible that other yet unidentified cytokines, chemokines, and/or adipokines are also involved in the development of hypertrophic cardiac dysfunctions in the mice with HIF‐2 activation in adipocytes.
NF‐κB and NFAT Pathways Are Activated in the Heart
Studies have shown that NF‐κB activation significantly contributes to the development of cardiac hypertrophy.35–36 Consistent with the increased expression of proinflammatory genes in adipose tissue and higher levels of circulating cytokines, we found strongly elevated protein levels of p50 NF‐κB and its p105 precursor in fatVHLko and fatVHL1Ako hearts (Figure 12A), indicating NF‐κB activation. Interestingly, levels of p50 and p105 in both fatVHL2Ako and fatVHL1A2Ako hearts were reduced by and large to those found in the WT controls. On the other hand, levels of p65 RelA appeared to be regulated by both HIF‐dependent and ‐independent mechanisms because deletion of both Hif1a and Hif2a failed to fully normalize p65 levels in the fatVHL1A2Ako heart (Figure 12A).
Figure 12.
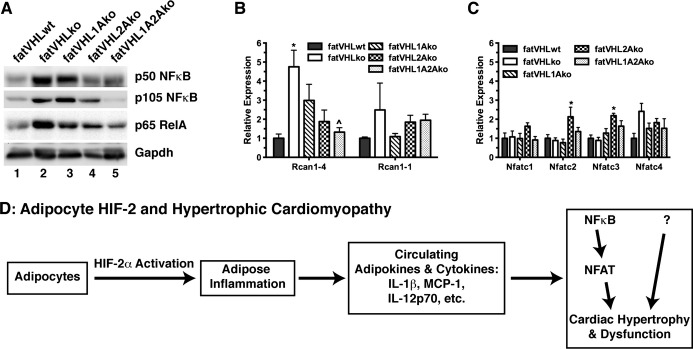
Activation of the NF‐κB and NFAT pathways in the heart is associated with cardiac hypertrophy. A, Heart tissue extracts from indicated genotypes were subjected to Western blot analyses. Similar results were obtained in 4 independent sets of experiments. B and C, Total RNA was prepared from heart (n=6 to 8 mice) and was subjected to quantitative RT‐PCR using gene‐specific primers as indicated. One‐way ANOVA: P≤0.01 for Rcan1‐4, Nfatc2, and Nfatc3, but no statistical significances found for Rcan1‐1, Nfatc1, and Nfatc4. Significant pairwise differences within each gene category, * vs fatVHLwt and ^ vs fatVHLko (Dunnett's multiple‐comparison test). D, A potential mechanism underlying the development of pathological cardiohypertrophy caused by HIF‐2α activation in adipose tissue. HIF indicates hypoxia‐inducible factor; IL, interleukin; KO, knockout; NF‐κB, nuclear factor–κB; NFAT, nuclear factor of activated T cells; Rcan, regulator of calcineurin; RelA, avian reticuloendotheliosis viral oncogene (v‐rel) homolog A; VHL, von Hippel–Lindau; WT, wild type.
The NFAT pathway plays a prominent role in the development of pathological cardiac hypertrophy.37 Regulator of calcineurin 1‐4 (Rcan1‐4), but not Rcan1‐1, is one of the key NFAT target genes.38 We found that Rcan1‐4 expression was increased >3‐fold in the heart of fatVHLko and fatVHL1Ako mice (Figure 12B). Again, Hif2a deletion in adipocytes strongly reduced Rcan1‐4 expression in the heart, although adipocyte HIF‐1α also appeared to be involved in the upregulation of cardiac Rcan1‐4 (Figure 12B). On the other hand, expression of Rcan1‐1 and Nfatc1‐Nfatc4 was only moderately (≤2‐fold) affected (Figure 12B and 12C). Our results are consistent with the recent finding that NF‐κB interacts with and activates NFAT to promote cardiac hypertrophy.36
Based on these observations, we propose a multistage mechanism (Figure 12D). (1) Sustained activation of HIF‐2 transcription factor pathway in adipocytes results in disregulated expression of adipocyte‐derived genes. (2) These adipocyte‐produced factors induce local inflammation via recruitment of macrophages and other leukocytes. (3) The inflamed adipose tissue secretes adipokines and other proinflammatory cytokines/chemokines into the circulation. (4) These circulating factors then induce the pathological cardiac hypertrophy in part via activation of the NF‐κB–NFAT pathway. However, we cannot rule out the possibility that NF‐κB activation is downstream of cardiomyocyte hypertrophy.39 Other mechanisms are also likely to be involved due to the wide ranges of target genes that can be induced directly or indirectly by the HIF‐2 transcription factor pathway in adipocytes.
Discussion
Our findings presented herein have uncovered a previously unappreciated transcription factor pathway, mediated by HIF‐2 in adipocytes, that plays a critical role in the regulation of adipocyte functions. Chronic activation of HIF‐2, but not HIF‐1, in adipocytes leads to adipose inflammation and pathological hypertrophy in the heart. The hypertrophic heart conditions presented by our mouse models are reminiscent of the cardiac hypertrophy observed in severely obese persons.2 Our solid genetic evidence strongly suggests that adipose hypoxia, observed under the condition of pathological obesity,5–7 may facilitate the development of obesity‐related cardiac hypertrophy via sustained activation of HIF‐2 in adipocytes.
Our findings demonstrate that HIF activation in adipocytes exerts its cardiac effects in a manner distinct from other purported mechanisms linked to obesity‐associated cardiomyopathy. The pathological cardiomegaly observed herein occurs in the absence of lipid accumulation in blood vessels, atherosclerosis, coronary occlusion, insulin resistance, and glucose intolerance. Despite gross cardiomegaly, fatVHLko and fatVHL1Ako mice do not present severely compromised heart functions except reduced diastolic −dP/dt values, which is consistent with the report that obese persons exhibit diastolic dysfunction even without hypertension,29 as well as the finding that obese persons develop ventricular hypertrophy and congestive heart failure without other types of heart disease.2,30 Our findings are also consistent with the clinical and epidemiological observations that obesity is significantly correlated with LV dysfunction and heart failure independent of other established risk factors including diabetes, hypertension, and coronary artery disease.1 Furthermore, a recent clinical study has found that LV mass continues to decline in bariatric surgery patients long after weight loss and systemic metabolism have plateaued,40 suggesting a potential involvement of adipocyte‐derived factors in the development of LV hypertrophy independent of metabolic disorders.
Several mechanisms have been proposed to explain the association between obesity and cardiac dysfunction, including cardiac lipotoxicity secondary to abnormalities in lipid metabolism, hypertrophy due to a chronically increased cardiac output or obesity‐associated hypertension, and the effects of hypoventilation, metabolic shifts, and coronary disease associated with obesity.1 Other studies have shown that obesity‐induced changes in adipose tissue biology, particularly the induction of chronic inflammation and altered metabolism, may play a critical role in the development of cardiovascular disease.3 Indeed, it has been established that adipose tissue inflammation is a prominent clinical feature of obesity,5–7 although the mechanisms driving adipose inflammation as well as those underlying the pathological effects of adipose‐derived proinflammatory factors in other organs remain to be fully elucidated. The exact mechanism underlying adipocyte HIF‐driven hypertrophic heart disease is likely to be complex and may involve multiple adipose tissue–derived factors, as well as secondary effects by other tissues under the influence of the altered adipose tissue functions. Nonetheless, our findings suggest a new model wherein HIF‐2 activation in adipocytes leads to increased expression and secretion of multiple proinflammatory cytokines and chemokines that activate the NF‐κB and NFAT pathways in the myocardium to facilitate the development of pathological cardiac hypertrophy.
In support of this model, we find that deletion of Vhl in adipocytes increases the expression of a wide range of inflammatory cytokines and chemokines, including Il1b, Il6, Tnf, MCPs (Ccl2, Ccl7, Ccl8), and MIP‐1α (Ccl3). Expression of these genes is also significantly increased in fat tissues of obese humans and/or mice.6,25 We also find that the elevated serum concentrations of IL‐1β, MCP‐1/CCL2, and IL‐12p70 strongly correlate with the pathological cardiac hypertrophy in fatVHLko and fatVHL1Ako mice. Consistent with our findings, significantly elevated serum MCP‐1/CCL2 levels were found in both obese children41 and obese adults,42 as well as in obese ob/ob mice.43 Increased serum IL‐12 levels are also found in obese adults.44 Furthermore, expression of Il1b and Ccl2/Mcp1 is strongly increased in hypertrophied rat heart,45 and significantly higher IL1b expression is also reported in heart biopsy from patients with dilated cardiomyopathy.46 It is also reported that IL‐1β can induce hypertrophic response in cardiomyocytes.47 In addition, our data show that fatVHL1Ako mice have the highest serum levels of the biologically active IL‐12p70, suggesting a potentially important role of IL‐12p70 in exacerbating the pathological conditions induced by adipocyte HIF activation. It is, however, worth noting that, although being associated with inflammatory heart diseases,48 elevated serum levels of IL‐6, IFNγγ, and TNFα are not critically involved in the development of fatal cardiac hypertrophy and dysfunction in fatVHL1Ako mice. Our findings do suggest that multiple circulating cytokines and chemokines, including IL‐1β, MCP‐1/CCL2, IL‐12‐p70, and those yet to be identified, are involved in induction of hypertrophic myocardial dysfunctions resulting from the activated HIF‐2 pathway in adipocytes.
We also find that fatVHLko mice have significantly increased adipose expression of Hmox1, Lep, Vegfd/Figf, and Serpine1/Pai1, whose expression is commonly found in adipose tissue of obese mice and humans.6,25 It is worth noting that adipose expression of adiponectin (Adipoq) is not significantly affected by Vhl deletion according to cDNA microarray analysis. Interestingly, Lep and Serpine1/Pai1 have been established as independent risk factors for heart disease.49 The fatVHLko and fatVHL1Ako mice also have increased angiogenesis in multiple tissues including heart and fat, likely due to increased expression of several proangiogenic genes including Lep, Plgf, and Vegfd/Figf (but not Vegfa) in adipose tissue. It is interesting that angiogenesis is reportedly sufficient to induce myocardial hypertrophy in the absence of other cardiac stresses,50 thus raising the question of whether this mechanism contributes to the cardiac hypertrophy observed in obesity. It is also possible that the increased cardiac vascularity noted in this study is compensatory, rather than causative, to cardiac hypertrophy primarily induced by circulating proinflammatory cytokines. However, the effects of both proangiogenic factors and proinflammatory cytokines are likely responsible for the pathological cardiac hypertrophy observed in fatVHLko and fatVHL1Ako mice.
In summary, our data have revealed previously unrecognized roles of HIF‐1α and HIF‐2α in mediating the effects of Vhl deletion in adipocytes. Specifically, the HIF‐2 transcription factor pathway constitutes a critical stress–response mechanism in adipocytes, and chronic HIF‐2 activation in adipocytes may play a dominant role in the development of pathological cardiac hypertrophy associated with severe obesity.
Disclosure
None.
Sources of Funding
This work is in part supported by a Grant‐in‐Aid from the American Heart Association (11GRNT7970029, Z. Yun).......
Acknowledgments
We thank Dr Barbara Kahn (supported by National Institute of Diabetes and Digestive and Kidney Diseases grants R37 DK43051, P30 DK57521, and R01 DK098002) of Beth Israel Deaconess Medical Center and Harvard Medical School for providing the aP2‐cre mice. We also thank Ms Lisa Cabral for editorial assistance.
References
- 1.Wong C, Marwick TH. Obesity cardiomyopathy: pathogenesis and pathophysiology. Nat Clin Pract Cardiovasc Med. 2007; 4:436-443 [DOI] [PubMed] [Google Scholar]
- 2.Amad KH, Brennan JC, Alexander JK. The cardiac pathology of chronic exogenous obesity. Circulation. 1965; 32:740-745 [DOI] [PubMed] [Google Scholar]
- 3.Hotamisligil GS. Inflammation and metabolic disorders. Nature. 2006; 444:860-867 [DOI] [PubMed] [Google Scholar]
- 4.Walsh K. Adipokines, myokines and cardiovascular disease. Circ J. 2009; 73:13-18 [DOI] [PubMed] [Google Scholar]
- 5.Pasarica M, Sereda OR, Redman LM, Albarado DC, Hymel DT, Roan LE, Rood JC, Burk DH, Smith SR. Reduced adipose tissue oxygenation in human obesity: evidence for rarefaction, macrophage chemotaxis, and inflammation without an angiogenic response. Diabetes. 2009; 58:718-725 [DOI] [PMC free article] [PubMed] [Google Scholar]
- 6.Ye J, Gao Z, Yin J, He Q. Hypoxia is a potential risk factor for chronic inflammation and adiponectin reduction in adipose tissue of ob/ob and dietary obese mice. Am J Physiol Endocrinol Metab. 2007; 293:E1118-E1128 [DOI] [PubMed] [Google Scholar]
- 7.Halberg N, Khan T, Trujillo ME, Wernstedt‐Asterholm I, Attie AD, Sherwani S, Wang ZV, Landskroner‐Eiger S, Dineen S, Magalang UJ, Brekken RA, Scherer PE. Hypoxia‐inducible factor 1α induces fibrosis and insulin resistance in white adipose tissue. Mol Cell Biol. 2009; 29:4467-4483 [DOI] [PMC free article] [PubMed] [Google Scholar]
- 8.Lin Q, Lee YJ, Yun Z. Differentiation arrest by hypoxia. J Biol Chem. 2006; 281:30678-30683 [DOI] [PubMed] [Google Scholar]
- 9.Yun Z, Maecker HL, Johnson RS, Giaccia AJ. Inhibition of PPARγ2 gene expression by the HIF‐1‐regulated gene DEC1/Stra13: a mechanism for regulation of adipogenesis by hypoxia. Dev Cell. 2002; 2:331-341 [DOI] [PubMed] [Google Scholar]
- 10.Semenza GL. Regulation of mammalian O2 homeostasis by hypoxia‐inducible factor 1. Annu Rev Cell Dev Biol. 1999; 15:551-578 [DOI] [PubMed] [Google Scholar]
- 11.Kim W, Kaelin WG., Jr The von Hippel‐Lindau tumor suppressor protein: new insights into oxygen sensing and cancer. Curr Opin Genet Dev. 2003; 13:55-60 [DOI] [PubMed] [Google Scholar]
- 12.Aragones J, Fraisl P, Baes M, Carmeliet P. Oxygen sensors at the crossroad of metabolism. Cell Metab. 2009; 9:11-22 [DOI] [PubMed] [Google Scholar]
- 13.Girgis CM, Cheng K, Scott CH, Gunton JE. Novel links between HIFs, type 2 diabetes, and metabolic syndrome. Trends Endocrinol Metab. 2012; 23:372-380 [DOI] [PubMed] [Google Scholar]
- 14.Shimba S, Wada T, Hara S, Tezuka M. EPAS1 promotes adipose differentiation in 3T3‐L1 cells. J Biol Chem. 2004; 279:40946-40953 [DOI] [PubMed] [Google Scholar]
- 15.Haase VH, Glickman JN, Socolovsky M, Jaenisch R. Vascular tumors in livers with targeted inactivation of the von Hippel‐Lindau tumor suppressor. Proc Natl Acad Sci USA. 2001; 98:1583-1588 [DOI] [PMC free article] [PubMed] [Google Scholar]
- 16.Ryan HE, Lo J, Johnson RS. HIF‐1α is required for solid tumor formation and embryonic vascularization. EMBO J. 1998; 17:3005-3015 [DOI] [PMC free article] [PubMed] [Google Scholar]
- 17.Gruber M, Hu CJ, Johnson RS, Brown EJ, Keith B, Simon MC. Acute postnatal ablation of HIF‐2α results in anemia. Proc Natl Acad Sci USA. 2007; 104:2301-2306 [DOI] [PMC free article] [PubMed] [Google Scholar]
- 18.Abel ED, Peroni O, Kim JK, Kim YB, Boss O, Hadro E, Minnemann T, Shulman GI, Kahn BB. Adipose‐selective targeting of the GLUT4 gene impairs insulin action in muscle and liver. Nature. 2001; 409:729-733 [DOI] [PubMed] [Google Scholar]
- 19.Koopman R, Schaart G, Hesselink MK. Optimisation of oil red O staining permits combination with immunofluorescence and automated quantification of lipids. Histochem Cell Biol. 2001; 116:63-68 [DOI] [PubMed] [Google Scholar]
- 20.Jones JR, Barrick C, Kim KA, Lindner J, Blondeau B, Fujimoto Y, Shiota M, Kesterson RA, Kahn BB, Magnuson MA. Deletion of PPARγ in adipose tissues of mice protects against high fat diet‐induced obesity and insulin resistance. Proc Natl Acad Sci USA. 2005; 102:6207-6212 [DOI] [PMC free article] [PubMed] [Google Scholar]
- 21.Martens K, Bottelbergs A, Baes M. Ectopic recombination in the central and peripheral nervous system by aP2/FABP4‐Cre mice: implications for metabolism research. FEBS Lett. 2010; 584:1054-1058 [DOI] [PubMed] [Google Scholar]
- 22.Morroni M, Giordano A, Zingaretti MC, Boiani R, De Matteis R, Kahn BB, Nisoli E, Tonello C, Pisoschi C, Luchetti MM, Marelli M, Cinti S. Reversible transdifferentiation of secretory epithelial cells into adipocytes in the mammary gland. Proc Natl Acad Sci USA. 2004; 101:16801-16806 [DOI] [PMC free article] [PubMed] [Google Scholar]
- 23.Lei L, Mason S, Liu D, Huang Y, Marks C, Hickey R, Jovin IS, Pypaert M, Johnson RS, Giordano FJ. Hypoxia‐inducible factor‐dependent degeneration, failure, and malignant transformation of the heart in the absence of the von Hippel‐Lindau protein. Mol Cell Biol. 2008; 28:3790-3803 [DOI] [PMC free article] [PubMed] [Google Scholar]
- 24.Wenger RH, Stiehl DP, Camenisch G. Integration of oxygen signaling at the consensus HRE. Sci STKE. 2005; 2005:re12. [DOI] [PubMed] [Google Scholar]
- 25.Kim Y, Park T. DNA microarrays to define and search for genes associated with obesity. Biotechnol J. 2010; 5:99-112 [DOI] [PubMed] [Google Scholar]
- 26.Greenwood MR, Hirsch J. Postnatal development of adipocyte cellularity in the normal rat. J Lipid Res. 1974; 15:474-483 [PubMed] [Google Scholar]
- 27.Kapitsinou PP, Haase VH. The VHL tumor suppressor and HIF: insights from genetic studies in mice. Cell Death Differ. 2008; 15:650-659 [DOI] [PMC free article] [PubMed] [Google Scholar]
- 28.Daniels A, van Bilsen M, Goldschmeding R, van der Vusse GJ, van Nieuwenhoven FA. Connective tissue growth factor and cardiac fibrosis. Acta Physiol (Oxf). 2009; 195:321-338 [DOI] [PubMed] [Google Scholar]
- 29.Pilz B, Brasen JH, Schneider W, Luft FC. Obesity and hypertension‐induced restrictive cardiomyopathy: a harbinger of things to come. Hypertension. 2004; 43:911-917 [DOI] [PubMed] [Google Scholar]
- 30.Smith HL, Willius FA. Adiposity of the heart: a clinical and pathologic study of one hundred and thirty‐six obese patients. Arch Intern Med (Chic). 1933; 52:911-931 [Google Scholar]
- 31.Matsuura H, Ichiki T, Inoue E, Nomura M, Miyazaki R, Hashimoto T, Ikeda J, Takayanagi R, Fong GH, Sunagawa K. Prolyl hydroxylase domain protein 2 plays a critical role in diet‐induced obesity and glucose intolerance. Circulation. 2013; 127:2078-2087 [DOI] [PubMed] [Google Scholar]
- 32.Melillo G, Musso T, Sica A, Taylor LS, Cox GW, Varesio L. A hypoxia‐responsive element mediates a novel pathway of activation of the inducible nitric oxide synthase promoter. J Exp Med. 1995; 182:1683-1693 [DOI] [PMC free article] [PubMed] [Google Scholar]
- 33.Trayhurn P, Wang B, Wood IS. Hypoxia in adipose tissue: a basis for the dysregulation of tissue function in obesity? Br J Nutr. 2008; 100:227-235 [DOI] [PubMed] [Google Scholar]
- 34.Frede S, Berchner‐Pfannschmidt U, Fandrey J. Regulation of hypoxia‐inducible factors during inflammation. Methods Enzymol. 2007; 435:405-419 [DOI] [PubMed] [Google Scholar]
- 35.Li T, Wang Y, Liu C, Hu Y, Wu M, Li J, Guo L, Chen L, Chen Q, Ha T, Li C, Li Y. Myd88‐dependent nuclear factor‐kappab activation is involved in fibrinogen‐induced hypertrophic response of cardiomyocytes. J Hypertens. 2009; 27:1084-1093 [DOI] [PubMed] [Google Scholar]
- 36.Liu Q, Chen Y, Auger‐Messier M, Molkentin JD. Interaction between NFkappaB and NFAT coordinates cardiac hypertrophy and pathological remodeling. Circ Res. 2012; 110:1077-1086 [DOI] [PMC free article] [PubMed] [Google Scholar]
- 37.Barry SP, Townsend PA. What causes a broken heart—molecular insights into heart failure. Int Rev Cell Mol Biol. 2010; 284:113-179 [DOI] [PubMed] [Google Scholar]
- 38.Bian ZY, Huang H, Jiang H, Shen DF, Yan L, Zhu LH, Wang L, Cao F, Liu C, Tang QZ, Li H. LIM and cysteine‐rich domains 1 regulates cardiac hypertrophy by targeting calcineurin/nuclear factor of activated T cells signaling. Hypertension. 2010; 55:257-263 [DOI] [PubMed] [Google Scholar]
- 39.Leychenko A, Konorev E, Jijiwa M, Matter ML. Stretch‐induced hypertrophy activates NFκB‐mediated VEGF secretion in adult cardiomyocytes. PLoS ONE. 2011; 6:e29055. [DOI] [PMC free article] [PubMed] [Google Scholar]
- 40.Algahim MF, Lux TR, Leichman JG, Boyer AF, Miller CC, III, Laing ST, Wilson EB, Scarborough T, Yu S, Snyder B, Wolin‐Riklin C, Kyle UG, Taegtmeyer H. Progressive regression of left ventricular hypertrophy two years after bariatric surgery. Am J Med. 2011; 123:549-555 [DOI] [PMC free article] [PubMed] [Google Scholar]
- 41.Breslin WL, Johnston CA, Strohacker K, Carpenter KC, Davidson TR, Moreno JP, Foreyt JP, McFarlin BK. Obese Mexican American children have elevated MCP‐1, TNF‐alpha, monocyte concentration, and dyslipidemia. Pediatrics. 2012; 129:e1180-e1186 [DOI] [PubMed] [Google Scholar]
- 42.Kim CS, Park HS, Kawada T, Kim JH, Lim D, Hubbard NE, Kwon BS, Erickson KL, Yu R. Circulating levels of MCP‐1 and IL‐8 are elevated in human obese subjects and associated with obesity‐related parameters. Int J Obes (Lond). 2006; 30:1347-1355 [DOI] [PubMed] [Google Scholar]
- 43.Sartipy P, Loskutoff DJ. Monocyte chemoattractant protein 1 in obesity and insulin resistance. Proc Natl Acad Sci USA. 2003; 100:7265-7270 [DOI] [PMC free article] [PubMed] [Google Scholar]
- 44.Suarez‐Alvarez K, Solis‐Lozano L, Leon‐Cabrera S, Gonzalez‐Chavez A, Gomez‐Hernandez G, Quinones‐Alvarez MS, Serralde‐Zuniga AE, Hernandez‐Ruiz J, Ramirez‐Velasquez J, Galindo‐Gonzalez FJ, Zavala‐Castillo JC, De Leon‐Nava MA, Robles‐Diaz G, Escobedo G. Serum IL‐12 is increased in Mexican obese subjects and associated with low‐grade inflammation and obesity‐related parameters. Mediators Inflamm. 2013; 2013:967067. [DOI] [PMC free article] [PubMed] [Google Scholar]
- 45.Shioi T, Matsumori A, Kihara Y, Inoko M, Ono K, Iwanaga Y, Yamada T, Iwasaki A, Matsushima K, Sasayama S. Increased expression of interleukin‐1 beta and monocyte chemotactic and activating factor/monocyte chemoattractant protein‐1 in the hypertrophied and failing heart with pressure overload. Circ Res. 1997; 81:664-671 [DOI] [PubMed] [Google Scholar]
- 46.Vanderheyden M, Paulus WJ, Voss M, Knuefermann P, Sivasubramanian N, Mann D, Baumgarten G. Myocardial cytokine gene expression is higher in aortic stenosis than in idiopathic dilated cardiomyopathy. Heart. 2005; 91:926-931 [DOI] [PMC free article] [PubMed] [Google Scholar]
- 47.Hu Y, Li T, Wang Y, Li J, Guo L, Wu M, Shan X, Que L, Ha T, Chen Q, Kelley J, Li Y. Tollip attenuated the hypertrophic response of cardiomyocytes induced by IL‐1beta. Front Biosci. 2009; 14:2747-2756 [DOI] [PubMed] [Google Scholar]
- 48.Bozkurt B, Mann DL, Deswal A. Biomarkers of inflammation in heart failure. Heart Fail Rev. 2010; 15:331-341 [DOI] [PubMed] [Google Scholar]
- 49.Fruhbeck G. The adipose tissue as a source of vasoactive factors. Curr Med Chem Cardiovasc Hematol Agents. 2004; 2:197-208 [DOI] [PubMed] [Google Scholar]
- 50.Tirziu D, Chorianopoulos E, Moodie KL, Palac RT, Zhuang ZW, Tjwa M, Roncal C, Eriksson U, Fu Q, Elfenbein A, Hall AE, Carmeliet P, Moons L, Simons M. Myocardial hypertrophy in the absence of external stimuli is induced by angiogenesis in mice. J Clin Invest. 2007; 117:3188-3197 [DOI] [PMC free article] [PubMed] [Google Scholar]


