

Abstract
Background
Few proteomic studies have examined human cardiac tissue following acute lethal infarction. Here, we applied a novel proteomic approach to formalin‐fixed, paraffin‐embedded human tissue and aimed to reveal the molecular changes in the very early phase of acute myocardial infarction.
Methods and Results
Heart tissue samples were collected from 5 patients who died within 7 hours of myocardial infarction and from 5 age‐ and sex‐matched control cases. Infarcted and control myocardia were histopathologically diagnosed and captured using laser microdissection. Proteins were extracted using an originally established method and analyzed using liquid chromatography–tandem mass spectrometry. The label‐free quantification demonstrated that the levels of 21 proteins differed significantly between patients and controls. In addition to known biomarkers, the sarcoplasmic protein sorbin and SH3 domain‐containing protein 2 (SORBS2) was greatly reduced in infarcted myocardia. Immunohistochemical analysis of cardiac tissues confirmed the decrease, and Western blot analysis showed a significant increase in serum sorbin and SH3 domain‐containing protein 2 in acute myocardial infarction patients (n=10) compared with control cases (n=11).
Conclusions
Our advanced comprehensive analysis using patient tissues and serums indicated that sarcoplasmic sorbin and SH3 domain‐containing protein 2 is released from damaged cardiac tissue into the bloodstream upon lethal acute myocardial infarction. The proteomic strategy presented here is based on precise microscopic findings and is quite useful for candidate biomarker discovery using human tissue samples stored in depositories.
Keywords: myocardial infarction, proteomics, SORBS2, tissue
Introduction
Many animal experiments have been performed to date to elucidate the mechanism of cardiac ischemic injury,1–2 and these studies have enhanced our understanding of cardiac remodeling following hypoxic stress. Clinical studies using samples from admitted patients have also been conducted to discover diagnostic or prognostic biomarkers for acute myocardial infarction (AMI).3–4 Some cardiac proteins are in practical use for early diagnosis of AMI, including troponins5 and heart‐type fatty acid–binding protein (H‐FABP).6 However, ischemic heart failure is still a major cause of sudden death,7–9 and lethal AMI occurring before hospitalization has not been sufficiently investigated.
It is often difficult to define the ischemic lesion at autopsy because sudden death results in few anatomical changes to the heart. Microscopic alterations appear within 30 minutes after infarction, whereas macroscopic changes appear >4 hours later.10–12 Although some AMI model experiments have attempted to determine the molecular profile alterations associated with short‐term ischemia, elucidation of the acute proteomic changes is challenging if tissues are collected macroscopically.13–14
Formalin fixation and paraffin embedding are essential steps for accurate microscopic tissue sampling. Formaldehyde cross‐links the side chains of amino acids, which stabilizes cellular morphology and prevents decomposition.15–16 However, intermolecular bridging is considered problematic for extracting biomolecules for proteomic research. Recently, commercial kits enabling efficient protein extraction from formalin‐fixed and paraffin‐embedded (FFPE) samples have emerged.17–19 We also developed an original method to reduce the interference associated with formalin fixation and thus to provide sufficient mass spectrum intensity from human FFPE tissues.20 In this study, we microdissected the ischemic lesions from FFPE heart tissue and applied the modified extraction procedure. Subsequent analysis of the protein samples using label‐free mass spectrometry resulted in identification of 21 proteins displaying differential expression in AMI. This research is the first attempt to discern the proteomic changes occurring in the very early phase of infarction using microscopically dissected myocardia from FFPE human heart tissue.
Methods
Patients
Heart tissues and blood samples were obtained from forensic autopsies performed at the Kyoto University Graduate School of Medicine between February 2010 and November 2012. The clinical histories and autopsy findings were retrospectively reviewed, and the stored samples were analyzed for the present study under anonymity. This project was approved by the Ethics Committee of Medicine at Kyoto University.
AMI was diagnosed on the basis of clinical episode and autopsy findings21: (1) patients died within 7 hours of the onset of symptoms without any angioplasty or thrombolytic therapy; (2) serum was positive for H‐FABP, as determined using a commercial ELISA kit (Rapicheck; DS Pharm Biomedical, Osaka, Japan)22; and (3) contraction bands or wavy fibers were observed in the free wall of the left ventricle on histopathology. Control cases were selected using the following criteria: (1) serum was negative for H‐FABP, as determined by Rapicheck ELISA; (2) no pathological features of myocardial infarction, cardiomyopathy, myocarditis, or congenital heart abnormalities were observed; and (3) coronary atherosclerosis was not obvious.
For cardiac proteomic analysis, we selected 5 AMI patients and 5 age‐ and sex‐matched control cases. For serum immunoblotting, we collected blood from 10 AMI patients and 11 controls.
Heart Tissue and Serum Samples
Hearts were immediately fixed in 10% buffered formalin after removal from the body at autopsy. After fixation, the free wall of each left ventricle was embedded in paraffin. The blocks were continuously cut into 4‐μm sections for microscopic observation and 5‐μm sections for proteomic analysis. For accurate diagnosis, 4‐μm specimens were stained with hematoxylin and eosin and phosphotungstic acid–hematoxylin. Patient serum was stored at −40°C until further analysis.
Histopathology
Longitudinal sections of myocardia were observed microscopically, where the cardiac linear structure is more evident than in cross‐sectioned muscle fibers.23 Prominent neutrophilic infiltration was not sampled because it occurs >12 hours after infarction.10–12 In each ischemic area of the left ventricle in AMI hearts, we defined 2 regions: area I contained distinctive contraction bands or wavy fibers, and area II showed other minor irregular patterns, such as fragmented myocytes. The free wall of the left ventricle was also sampled from each control case Figure 1.
Figure 1.

Hematoxylin and eosin (H&E) and phosphotungstic acid–hematoxylin (PTAH) staining of cardiac tissues. Two sampling areas were microscopically selected from the left ventricular free wall of each infarcted heart: area I and area II. Area I contains distinctive contraction bands (left) and wavy fibers (right). Area II is surrounded by area I and shows minor irregularities such as fragmented myocardia. From each control, cardiac tissue was taken from the left ventricular free wall. Magnification ×400. Scale bar=50 μm.
Laser Capture Microdissection
Serial sections of diagnostic slides were mounted on Frame Slides (Micro Dissect GmbH, Herborn, Germany) and stained with Mayer's hematoxylin. Stained slides were air‐dried. Laser caption microdissection was performed using an LMD 6500 (Leica Microsystems, Wetzlar, Germany) instrument to capture microscopically defined areas. Cardiac tissues of 10 mm2 in total were collected into a 500‐μL cap from each sampling. Large capillaries and areas of fibrosis were excluded. A flowchart of the subsequent proteomic approach is shown in Figure 2.
Figure 2.
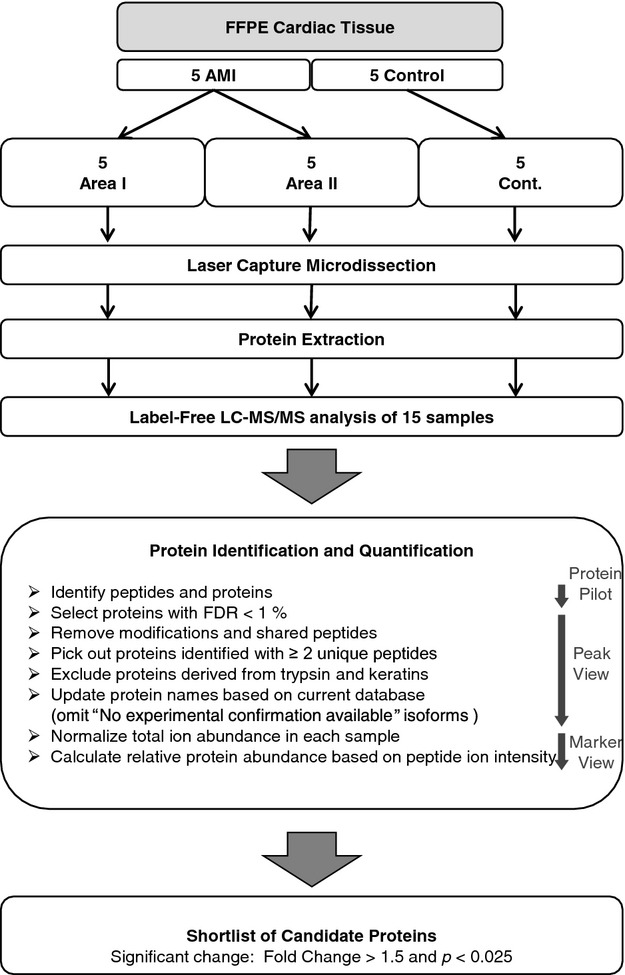
Flow diagram of proteomic analysis. AMI indicates acute myocardial infarction; FDR, false discovery rate; FFPE, formalin‐fixed, paraffin‐embedded; LC‐MS/MS, liquid chromatography–tandem mass spectrometry.
Protein Extraction
After dissection, cardiac proteins were extracted using a previously described method, with modifications.20 Acetonitrile (CH3CN) and dithiothreitol were purchased from Nacalai Tesque (Kyoto, Japan). Ammonium bicarbonate (NH4HCO3) and trifluoroacetic acid were purchased from Sigma‐Aldrich (St. Louis, MO). Each microdissected sample was suspended in 20 μL of 0.1 mol/L NH4HCO3 containing 30% (v/v) CH3CN and centrifuged at 10 000g for 1 minute. Tubes were heated at 95°C for 90 minutes with shaking every 20 minutes to avoid condensation of the buffer in the cap. After retrieval, the samples were centrifuged at 10 000g for 1 minute, cooled on ice, and then 1 μL of a 1 μg/μL trypsin (Sequencing Grade Modified Trypsin; Promega, Madison, WI) solution was added to each tube for protein digestion. The samples were incubated at 37°C overnight. Protein content was estimated using the bicinchoninic acid method (Micro BCA Assay; Termo Scientific, Cramlington, UK) with bovine albumin as the standard. Next, 10 mmol/L dithiothreitol was added to each tissue digest, and the tube was heated at 95°C for 5 minutes to deactivate the trypsin. After drying, samples were resuspended in 0.1% trifluoroacetic acid with 2% CH3CN, resulting in a final protein concentration of 0.2 μg/μL. The proteins extracted from 3 histopathological types (area I, area II, and control) were used directly in the subsequent proteomic analysis (15 samples in total).
Peptide Separation and Mass Spectrometry
All liquid chromatography (LC) solvents were LC‐mass spectrometry (MS) grade and purchased from Wako Pure Chemical Industries, Ltd (Osaka, Japan). A 5‐μL aliquot of each trypsinized sample was separated using nanoflow reverse‐phase LC (NanoLC‐Ultra System; Eksigent, Dublin, CA) with a cHiP‐based platform (cHiPLC‐Nanoflex System; Eksigent, Dublin, CA) using the trap‐and‐elute method. An aliquot of each sample (5 μL) was automatically injected onto a trap column (Nano cHiPLC Trap column, 200 μm×0.5 mm; ChromXP C18‐CL, 3 μm, 120 Å; Eksigent, Dublin, CA) and washed for 10 minutes using 0.1% formic acid as the loading solvent. The trap column was then switched online with the analytical column (Nano cHiPLC column, 75 μm×15 cm; ChromXP C18‐CL, 3 μm, 120 Å; Eksigent, Dublin, CA), and peptides were eluted with the following binary gradient: initial composition 2% solvent B (98% solvent A), then changed from 2% solvent B to 40% solvent B over 125 minutes, from 60% solvent B to 90% solvent B over 1 minutes, maintained at 90% solvent B for 5 minutes, then switch back to the initial composition [2% solvent B]). Solvent A consisted of 2% CH3CN and 0.1% formic acid, and solvent B consisted of 80% CH3CN and 0.1% formic acid. The column flow rate was set to 300 nL/min. Eluted peptides were analyzed using a quadrupole‐time‐of‐flight hybrid mass spectrometer (Triple TOF 5600 system; AB SCIEX, Framingham, MA) equipped with an electrospray ionization source optimized for nanoflow (NanoSpray, AB SCIEX). The ion spray voltage floating was +2.3 kV, and the interface heater temperature (IHT) was set at 150°C. The MS was carried out in a data‐dependent acquisition method, in which the 10 most abundant ions detected in each 0.25‐second time‐of‐flight mass spectrometer survey scan were automatically subjected to MS/MS scans for an accumulation time of 100 ms. Time‐of‐flight mass spectrometer scans were performed over the m/z range of 400 to 1250 with 50‐mDa tolerance, excluding former target ions for 10 seconds. Tandem MS (MS/MS) scans were performed with a collision energy of 35 kV with UNIT‐resolution in the m/z range of 100 to 1600 with 50‐mDa tolerance, excluding former target ions for 10 seconds.
Identification and Quantification of Peptides/Proteins
Peptides and proteins were identified using the Paragon algorithm provided with Protein Pilot 4.5 beta (AB SCIEX) and using the combined database of Uniprot‐Swissprot (version 2010‐6, Homo sapiens) and sequences for known contaminants (AB SCIEX). False discovery rate (FDR) analysis was performed after peptide/protein identification using Proteomic System Performance Evaluation Pipeline (PSPEP) software (AB SCIEX). The results of FDR analyses for each sample (ie, number of peptides/proteins with the global FDR from Fit [<1%] and local FDR [<5%]) are described in the Results section).
Label‐free quantification of peptides was performed using the Protein Quantitation 1.0 MicroApp (PQMA), which is part of Peak View 1.1.1 (AB SCIEX). First, liquid chromatography–tandem mass spectrometry (LC‐MS/MS) data sets for all samples (15 samples) were analyzed at the same time using Protein Pilot 4.5 beta to produce a single group file that included the entire list of identified peptides/proteins throughout the samples and conditions. Second, the template group file was imported to the Peak View 1.1.1 platform using PQMA to construct the list of peaks for all detected unique peptides (template peptides/proteins list). Third, individual LC‐MS/MS data sets (wiff files) were imported to the Peak View 1.1.1 platform and analyzed by PQMA to quantitate each peptide/protein appearing in the template peptide/protein list. The results of PQMA were exported to Marker View 1.2.1 (AB SCIEX).
Peptides with a confidence >0.95 were selected for exportation. Shared peptides, peptides for keratins, trypsins, bovine serum albumin, and decoy sequences generated for FDR (reversed sequences) were not exported. Ambiguous proteins identified on the basis of only 1 peptide were excluded. The current status of each protein was referred to the UniProt database website. “No experimental confirmation available” isoforms were also omitted from our list.
Protein abundance was calculated with Marker View 1.2.1 from the sum of the peak areas of detected peptides that originated from the same protein. Each abundance value was normalized against the total area sum of the individual sample. The reliability of the protein identification was validated by analyzing 3 replicates of each sample by LC‐MS/MS and repeating postseparation software analysis. The analytical replication of the representative samples yielded basically the same results. The deviation of the number of detected proteins and peptides with a reliability of >99% (ie, with a global FDR score from Fit of >1%) was in the range of ±0.62% and ±1.79%, respectively.
Immunohistochemistry
Deparaffinized and rehydrated FFPE heart sections were subjected to antigen retrieval with Proteinase K (Dako, Glostrup, Denmark) at room temperature for 10 minutes and then heated in 10 mmol/L sodium citrate buffer at 120°C for 20 minutes. Blocking was performed with 1% bovine serum albumin and 0.1% cold‐water fish gelatin at room temperature for 30 minutes. Specimens were immunostained with rabbit polyclonal antibody against sorbin and SH3 domain‐containing protein 2 (SORBS2; 2.5 μg/mL; Abcam, Cambridge, UK) at 4°C overnight. EnVision G|2 System/AP, Rabbit/Mouse (Dako) was used for detection. We selected permanent red as the chromogen instead of 3,3′‐diaminobenzidine because cardiac myocytes in subjects older than middle‐aged contain abundant lipofuscin, a brown pigment easily confused with 3,3′‐diaminobenzidine. Counterstaining was performed with Mayer's hematoxylin. Negative controls were stained using normal rabbit serum (ImmunoBioScience, Mukilteo, WA) instead of the primary antibody.
Western Blot Analyses
Ten microliters of serum was collected from each subject. Albumin and gamma globulin were removed using an Albumin/IgG Removal kit (Thermo Scientific) because serum analysis is complicated by high concentrations of these proteins, which can constitute >70% of total serum protein. After albumin and gamma globulin removal, the protein concentration was estimated using the bicinchoninic acid method (BCA Assay; Thermo Scientific). Dried protein (40 μg) was dissolved in sample buffer containing 1% SDS and 10% 2‐mercaptoethanol and subjected to SDS‐PAGE on a 4% to 15% TGX gel (Bio‐Rad, Hercules, CA). After electrophoresis, proteins were transferred onto a polyvinylidene difluoride membrane (Bio‐Rad). The membrane was incubated with anti‐SORBS2 (2.5 μg/mL; Abcam) and rabbit polyclonal antibody against transferrin (1.0 μg/mL; Abcam). Immunoreactive bands were visualized using a chemiluminescence substrate (Thermo Scientific), and images were captured using a LAS‐4000 mini (Fujifilm, Tokyo, Japan). Densitometric image analysis was performed using Image J software (http://rsb.info.nih.gov/ij/). Each densitometric level of SORBS2 was normalized against that of transferrin.24
Statistical Analysis
The nonparametric, Mann–Whitney U test was used for comparison of the patients' ages, cardiac MS intensities, and serum immunoblotting densities. In this analysis, we set the significance level α to 0.05. In cardiac MS screening, as double comparisons were performed (area I versus control and area II versus control) for each protein, we considered P<0.025 (0.05/2) as significant after Bonferroni's correction. Briefly, fold‐change values >1.5 and P<0.025 were considered significant in heart tissue screening, and P<0.05 was considered significant for patient age and serum immunoblotting. All calculations were performed using R statistical software (version 3.0.1; http://www.r-project.org/).
Results
Patient Characteristics
For MS screening of the cardiac tissue, tissues from 5 AMI patients (mean age±SD, 59±12 years) and 5 controls (57±14 years) were examined. For serum immunoblotting verification, samples from 10 AMI patients (60±13 years) and 11 controls (60±17 years) were examined (Table 1). No significant age difference was observed among AMI patients and controls, both in the screening and in the validation analysis (P=0.84 and P=1.00, respectively). All cases enrolled in this study are of Asian origin.
Table 1.
Patient Characteristics
| Cause of Death | Sex | Age (y) | PMI (day) | Heart (g) | Coronary Findings at Autopsy | Cardioversion |
|---|---|---|---|---|---|---|
| AMI Patients | ||||||
| AMI* | M | 54 | 1.7 | 432 | Thrombus in LCX | + |
| AMI* | M | 40 | 1.3 | 454 | Thrombus in LAD | + |
| AMI* | M | 61 | 1.5 | 360 | − | + |
| AMI* | M | 62 | 0.9 | 389 | Thrombus in LAD | + |
| AMI* | F | 78 | 0.4 | 314 | − | + |
| AMI | M | 48 | 1.2 | 476 | Plaque erosion in LAD | + |
| AMI | M | 65 | 3.3 | 418 | − | − |
| AMI | M | 57 | 1.4 | 441 | − | + |
| AMI | F | 83 | 2.0 | 395 | − | + |
| AMI | M | 48 | 1.4 | 456 | Plaque erosion in LAD | + |
| Control Subjects | ||||||
| Drowning* | M | 61 | 1.7 | 433 | − | + |
| Hypothermia* | M | 61 | 3.0 | 380 | − | − |
| Pancreatic cancer* | F | 80 | 2.8 | 266 | − | − |
| Drowning* | M | 39 | 1.8 | 283 | − | − |
| Blood loss* | M | 45 | 1.3 | 370 | − | + |
| Blood loss | M | 73 | 2.5 | 378 | − | − |
| Asphyxia | M | 41 | 1.5 | 446 | − | − |
| Hypothermia | F | 88 | 2.7 | 403 | − | − |
| SAH | F | 69 | 1.2 | 285 | − | + |
| SAH | M | 64 | 2.5 | 387 | − | + |
| Drowning | F | 35 | 1.2 | 228 | − | + |
Serums of all 21 patients listed here were used for Western blotting. AMI indicates acute myocardial infarction; F, female; LAD, left anterior descending artery; LCX, left circumflex artery; M, male; MS, mass spectrometry; PMI, postmortem interval; SAH, subarachnoid hemorrhage.
Heart tissues of 10 patients were used for MS analysis.
Protein Identification and Quantification
LC‐MS was performed on 10 tissue samples (5 from area I and 5 from area II) collected from 5 AMI patients and on 5 tissue samples collected from 5 control subjects (Figure 2). From 243 551 spectra, 10 396 peptides and 734 proteins were identified, with a false‐discovery rate of <1% (Table 2). All proteins identified in this study are listed in Table S1. With stringent filtration criteria (Figure 2), we selected 4564 peptides (Table S2) and 485 proteins (Table S3) for label‐free quantification.
Table 2.
Summary of FFPE Cardiac MS Analysis
| Data Level | FDR | ID Yield |
|---|---|---|
| Protein | 1% | 734 |
| 5% | 833 | |
| 10% | 913 | |
| Peptide | 1% | 10 396 |
| 5% | 13 006 | |
| 10% | 14 536 | |
| Spectral | 1% | 243 551 |
| 5% | 281 051 | |
| 10% | 296 651 |
FDR indicates false discovery rate; FFPE, formalin‐fixed, paraffin‐embedded; MS, mass spectrometry.
The distribution of all 485 proteins is illustrated in a volcano plot (Figure 3). The intensity levels of 21 proteins differed significantly between AMI patients and control subjects. The levels of 12 proteins were higher and of 9 proteins were lower in AMI tissue. The identity and primary intra‐ or extracellular localization of these proteins according to Gene Ontology (http://www.geneontology.org/) analysis are listed in Table 3, which shows that 7 proteins localized in the cytoplasm, 6 in mitochondria, 1 in the nucleus, and 7 in the extramyocardial space. We focused on the sarcoplasmic proteins like troponin T and H‐FABP, which are traditional AMI biomarkers.25–26
Figure 3.
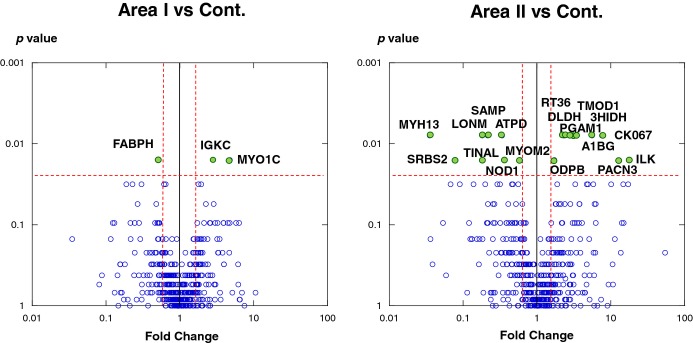
Differential levels of protein in acute myocardial infarction (AMI) and control tissues. Protein expression was compared between area I and control (left) and area II and control (right). Each point represents an individual protein. Vertical line represents 1.5‐fold change, and horizontal line denotes P=0.025 (Mann–Whitney U test followed by Bonferroni's correction). The most prominent proteins (P<0.025 and negative fold‐change <−1.5 or 1.5 <positive fold‐change) are labeled with their UniProt entry name. 3HIDH indicates 3‐hydroxyisobutyrate dehydrogenase; A1BG, alpha‐1B‐glycoprotein; ATPD ATP synthase subunit delta; DLDH, dihydrolipoyl dehydrogenase; FABPH, fatty acid–binding protein, heart (H‐FABP); IGKC, Ig kappa chain C region; ILK, integrin‐linked protein kinase; LONM, Lon protease homologue; MYH13, myosin heavy‐chain 13; MYO1C, myosin 1; MYOM2, myomesin‐2; ODPB, pyruvate dehydrogenase E1 component subunit beta; PACN3, protein kinase C and casein kinase substrate in neurons protein 3; PGAM1, phosphoglycerate mutase 1; SAMP, serum amyloid P‐component; SRBS2, sorbin and SH3 domain‐containing protein 2 (SORBS2); TINAL, tubulointerstitial nephritis antigen‐like; TMOD1, tropomodulin‐1.
Table 3.
Cardiac Proteins Detected Differentially in the Very Early Phase of AMI
| UniProt Accession | Protein Name | Cellular Component | Area I vs Control | Area II vs Control | ||
|---|---|---|---|---|---|---|
| Fold‐Change | P Value | Fold‐Change | P Value | |||
| P05413_FABPH | Fatty acid–binding protein, heart (H‐FABP) | Cytoplasm | −2.0 | 0.016 | −1.4 | 0.310 |
| O94875_SRBS2 | Sorbin and SH3 domain‐containing protein 2 (SORBS2) | Cytoplasm | −1.2 | 0.690 | −12.8 | 0.016 |
| P54296_MYOM2 | Myomesin‐2 | Cytoplasm | −1.1 | 0.690 | −1.7 | 0.016 |
| Q9UKX3_MYH13 | Myosin heavy‐chain 13 | Cytoplasm | 1.1 | 0.548 | −28.3 | 0.008 |
| P18669_PGAM1 | Phosphoglycerate mutase 1 | Cytoplasm | 1.6 | 0.841 | 2.9 | 0.008 |
| Q9UKS6_PACN3 | Protein kinase C and casein kinase substrate in neurons protein 3 | Cytoplasm | 2.6 | 0.095 | 12.8 | 0.016 |
| Q13418_ILK | Integrin‐linked protein kinase | Cytoplasm | 2.1 | 0.690 | 18.2 | 0.016 |
| P11177_ODPB | Pyruvate dehydrogenase E1 component subunit beta | Mitochondrion | 1.2 | 0.690 | 1.7 | 0.016 |
| P09622_DLDH | Dihydrolipoyl dehydrogenase | Mitochondrion | 1.3 | 1.000 | 2.4 | 0.008 |
| P31937_3HIDH | 3‐hydroxyisobutyrate dehydrogenase | Mitochondrion | 2.0 | 0.310 | 3.4 | 0.008 |
| P82909_RT36 | 28S ribosomal protein S36, mitochondrial | Mitochondrion | 1.7 | 0.421 | 2.3 | 0.008 |
| P30049_ATPD | ATP synthase subunit delta | Mitochondrion | 1.1 | 0.690 | −3.0 | 0.008 |
| P36776_LONM | Lon protease homologue | Mitochondrion | −4.4 | 0.032 | −5.5 | 0.008 |
| O00159_MYO1C | Nuclear myosin 1 (NM1) | Nucleus | 4.8 | 0.016 | 2.5 | 1.000 |
| P28289_TMOD1 | Tropomodulin‐1 | Erythrocyte cytoplasm | 1.7 | 0.548 | 3.2 | 0.008 |
| Q9H7C9_CK067 | Mth938 domain‐containing protein | Adipocyte cytoplasm | 4.0 | 0.310 | 7.6 | 0.008 |
| P02743_SAMP | Serum amyloid P‐component | Extracellular space | −1.1 | 0..151 | −4.6 | 0.008 |
| P04217_A1BG | Alpha‐1B‐glycoprotein | Extracellular space | 2.6 | 0.421 | 5.6 | 0.008 |
| P14543_NID1 | Nidogen‐1 | Extracellular space | −1.6 | 0.222 | −2.7 | 0.016 |
| Q9GZM7_TINAL | Tubulointerstitial nephritis antigen‐like | Extracellular space | −2.2 | 0.222 | −5.3 | 0.016 |
| P01834_IGKC | Ig kappa chain C region | Extracellular space | 2.8 | 0.016 | 2.2 | 0.095 |
Difference >1.5‐fold change and P<0.025 (Mann–Whitney U test followed by Bonferroni's correction) was considered significant. Fold‐change values indicate higher (+) and lower (−) intensity levels in AMI samples compared with controls. AMI indicates acute myocardial infarction.
Immunohistochemistry
SORBS2 was observed in uniform alignment along the Z‐band in the myocardial cytoskeleton and was prominent in the intercalated disk in control heart tissue (Figure 4A). In contraction bands in area I (Figure 4B), the regularity of the Z‐band collapsed, and blurry immunostaining was observed in accordance with morphological changes, whereas the staining of the intercalated disk was maintained as a dense line. In wavy fibers in area I (Figure 4C), some myocytes showed an unstained cytoplasm, and adjacent myocardial cytoplasm was weakly stained with anti‐SORBS2. In irregular myocytes in area II (Figure 4D), immunostaining signals clearly disappeared from the Z‐lines, and some of the stained intercalated disks appeared ruptured, with loss of tight adherence between myocytes. Rupture of the intercalated disk was rare in area I (Figure 4B and 4C). In general, myocardial staining of SORBS2 was lower in AMI tissue than in control tissue.
Figure 4.
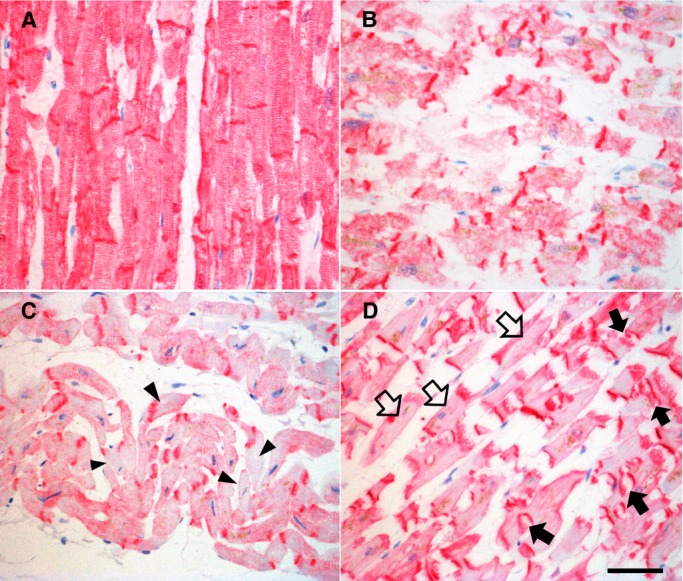
Immunostaining of SORBS2 in human heart tissues. A, SORBS2 regularly localizes along the Z‐line in the myocardial cytoplasm and is densely expressed in the intercalated disk in control heart tissue. B, In AMI tissue, the alignment of SORBS2 in the Z‐bands is disordered at the contraction bands in area I. C, Some wavy fibers show low staining in the Z‐lines (arrowheads) in area I. D, Sarcomeric arrays of SORBS2 disappear from cardiac myocytes (open arrows) in area II. Some intercalated disks appear to have burst (arrows). Magnification ×400. Scale bar=50 μm. AMI indicates acute myocardial infarction; SORBS2, sorbin and SH3 domain‐containing protein 2.
Serum Analyses
All 10 AMI cases in this study showed a positive level of serum H‐FABP by a commercial ELISA kit, and 11 control cases showed a negative level (Figure 5A). Although individual differences were observed in serum Western blotting against SORBS2 (Figure 5B), the densitometric level of SORBS2 was significantly higher in AMI patients than in controls (Figure 5C). The level of SORBS2 in serum was 2.8‐fold higher in AMI patients (P=0.020).
Figure 5.

Serum analyses. A, Representative serum ELISA against H‐FABP. In the commercial ELISA kit, “C” denotes positive control and “T” denotes true positive. AMI cases showed positive results, and control cases showed negative results. B, Representative Western blots against SORBS2 and transferrin. For each lane, 40 μg of serum protein was applied C, Relative intensity level of SORBS2 normalized to that of transferrin. AMI cases (n=10) and controls (n=11) were compared. Each bar represents mean±SEM. *P<0.05 (Mann–Whitney U test). AMI indicates acute myocardial infarction; H‐FABP, fatty acid–binding protein, heart; SEM, standard error of the mean; SORBS2, sorbin and SH3 domain‐containing protein 2.
Discussion
This study examined cases of sudden death occurring within 7 hours after myocardial infarction. Analysis of FFPE patient tissue using a novel proteomic approach identified 485 proteins and revealed that the levels of 21 proteins differed between AMI and control tissues (Table 3).
Known Sarcoplasmic Proteins
Some sarcoplasmic proteins have been reported as deviation components that are released from myocardia when the heart is severely damaged. H‐FABP was established as an early biomarker because it leaks from cardiac cells following ischemic injury.26–27 Compared with troponin T or myoglobin, H‐FABP is distinctively useful for diagnosis of ischemic injury within the first 4 hours of symptom appearance.6,28 In our research, we examined AMI patients whose serum was positive for H‐FABP by Rapicheck ELISA. Subsequent proteomic analysis confirmed a lower level of H‐FABP in heart tissue of AMI patients than that of control subjects.
Myomesin is a modular protein that cross‐links the thick filaments in the M‐band of striated muscle.29 It has been reported that myomesin levels decrease on acute ischemia30 and in chronic heart failure.31 The reduction in myomesin expression detected at the proteomic level in this study agrees with previous reports. Levels of some other known biomarkers, such as cardiac myosin‐binding protein C32–33 and cardiac troponin I34–35 were also shown to decrease in AMI tissue (Table S3), but these proteins were not listed in Table 2 because of the strict limits used regarding detection: (≥2 peptides), probability (P<0.025 in the Mann–Whitney U test followed by Bonferroni's correction), and ±1.5‐fold change.
Sarcoplasmic SORBS2
SORBS2 is an adapter protein that functions in cytoskeletal organization, cell adhesion, and signaling pathways.36 Northern blot analyses showed that the highest levels of SORBS2 occur in the heart, where it is expressed at much higher levels than in other tissues, and that very little is detected in skeletal muscle.37 In cultured cardiomyocytes, SORBS2 is observed in the Z‐band and intercalated disk.38 The Z‐band is a septal segment of striated muscle at the end of the sarcomere, and α‐actinin is the major component. The intercalated disk is a specialized type of Z‐band found at the junctions of cardiomyocytes. Although SORBS2 is also observed at focal adhesions in fibroblasts and tight junctions in epithelial cells,39 immunohistochemical visualization in human heart tissue or proteomic analyses of changes in SORBS2 in AMI patients have not been reported to date.
Using an advanced proteomic method, in this study we first demonstrated high expression of SORBS2 in human heart tissue and a significant decrease in SORBS2 level on lethal cardiac infarction. Immunohistochemical analyses also showed remarkable alterations in SORBS2 localization in AMI cardiac tissue. Alignment of SORBS2 at the Z‐lines in the sarcoplasm disappeared upon AMI, and the dense deposits of SORBS2 were stripped from the intercalated disks in area II. Although MS analysis did not indicate a significant reduction in SORBS2 level in area I, immunohistochemical signals decreased in the cytoplasm of contraction bands and wavy fibers. In contrast, Western blot analysis showed a significant increase in SORBS2 level in the serum of AMI patients. These results indicate SORBS2 is released from the heart into the bloodstream upon severe ischemic heart injury.
The structural features of the Z‐band also suggest SORBS2 rapidly leaks from the myocardia soon after infarction. At the Z‐band, the extracellular space invaginates into the sarcolemma and forms a transverse tubular system. SORBS2 is supposed to link the T‐tubule membrane to the Z‐band and contributes to signal transduction in response to extracellular stimuli.38 Such linkage to the sarcolemmic membrane may facilitate speedy release of SORBS2 upon severe cardiac ischemia.
SORBS2 also functions as a docking site for other Z‐band proteins, such as α‐actinin and Abl family kinases.40 On a dramatic decrease in the level of SORBS2 in cardiac myocytes, cytoskeletal organization and cell signaling pathways become disconnected, and ultimately the ventricular muscle becomes in danger of losing its contractile function as a syncytial organ. The decrease in SORBS2 level in the myocardium itself possibly causes cardiac contractile deficiency. The typically high level of SORBS2 in the heart under normal conditions and the remarkable decrease on infarction imply that the degree of increase in the serum level of SORBS2 is strongly correlated with the severity of ischemic heart damage.
Other Proteins
In the present proteomic survey, many metabolic proteins were also detected at different levels in the heart tissue of AMI patients and control subjects. Pyruvate dehydrogenase E1 component subunit beta is an element of the pyruvate dehydrogenase complex, which catalyzes the oxidative decarboxylation of pyruvate to form acetyl CoA.41 This reaction constitutes the bridge between anaerobic and aerobic energy metabolism. An increase in pyruvate dehydrogenase E1 component subunit beta indicates increased energy demand and acceleration of glycolysis in myocytes. Dihydrolipoyl dehydrogenase is also an essential element of the pyruvate dehydrogenase complex (E3 component) and other mitochondrial multienzyme complexes, such as alpha‐ketoglutarate dehydrogenase, branched‐chain alpha‐ketoacid dehydrogenase, and the glycine cleavage system.42–43 Dihydrolipoyl dehydrogenase generates ATP from major energy substrates. 3‐Hydroxyisobutyrate dehydrogenase catalyzes degradation of the glucogenic amino acid valine to produce the metabolic intermediate succinyl‐CoA44–45 and is involved in satisfying increasing energy demand. Overexpression of 28S ribosomal protein S36 (RT36) delays cell‐cycle progression, thereby lowering energy consumption.46 In the early stage of AMI, area II showed a significant decline in 28S ribosomal protein S36 level, which may be a response to severe stress.
Study Limitations
First, most of the patients involved in this study experienced chemical or electrical cardioversion at the hospital. Such emergency treatments may damage cardiac muscle. We cannot deny the possibility that our observations were not only based on ischemic injury but also treatment‐related damage. Second, 2 isoforms of SORBS2 were identified in our research (Table S2). MS analysis indicated a large amount of isoform 3 and a significant decrease in infarcted tissue. Although a small amount of isoform 2 was also detected, this isoform was excluded from the selected protein list because it was found to be a “no experimental confirmation available” isoform at the time of data processing (Figure 2).
Conclusions
A novel method for extracting proteins from FFPE tissue enabled the proteomic analysis of human cardiac tissue obtained from cases of sudden death due to AMI. Label‐free LC‐MS accompanied by precise microscopic sampling revealed in vivo proteomic alterations corresponding with histopathological findings. Among the significant proteomic changes observed, the level of SORBS2 was found to be markedly lower in AMI tissue compared with control tissue and was detected at strikingly high levels in the serum of AMI patients. These observations suggest that SORBS2 is released from cardiac myocytes on acute lethal infarction. Although further clinical research using AMI serum is necessary for clarification of the usefulness of SORBS2 in the early diagnosis, this sarcoplasmic protein could be contributing to the assessment of ischemic severity on cardiac tissue.
Sources of Funding
.This work was partially supported by a Grant‐in‐Aid from the Ministry of Education, Culture, Science and Technology of Japan, and Advanced Scientific Technology & Management Research Institute of Kyoto. These funding agents had no role in the study design, data collection, analysis, decision to publish, or preparation of the manuscript.
Disclosures
None.
Acknowledgments
We are very thankful to Sho Manabe for kindly providing professional statistical advice and Dr. Shinji Sumiyoshi for histological staining technology.
References
- 1.Theilmeier G, Schmidt C, Herrmann J, Keul P, Schafers M, Herrgott I, Mersmann J, Larmann J, Hermann S, Stypmann J, Schober O, Hildebrand R, Schulz R, Heusch G, Haude M, von Wnuck Lipinski K, Herzog C, Schmitz M, Erbel R, Chun J, Levkau B. High‐density lipoproteins and their constituent, sphingosine‐1‐phosphate, directly protect the heart against ischemia/reperfusion injury in vivo via the S1P3 lysophospholipid receptor. Circulation. 2006; 114:1403-1409 [DOI] [PubMed] [Google Scholar]
- 2.Barallobre‐Barreiro J, Didangelos A, Schoendube FA, Drozdov I, Yin X, Fernandez‐Caggiano M, Willeit P, Puntmann VO, Aldama‐Lopez G, Shah AM, Domenech N, Mayr M. Proteomics analysis of cardiac extracellular matrix remodeling in a porcine model of ischemia/reperfusion injury. Circulation. 2012; 125:789-802 [DOI] [PubMed] [Google Scholar]
- 3.Berton G, Cordiano R, Palmieri R, Cavuto F, Buttazzi P, Palatini P. Comparison of C‐reactive protein and albumin excretion as prognostic markers for 10‐year mortality after myocardial infarction. Clin Cardiol. 2010; 33:508-515 [DOI] [PMC free article] [PubMed] [Google Scholar]
- 4.Meune C, Twerenbold R, Drexler B, Balmelli C, Wolf C, Haaf P, Reichlin T, Irfan A, Reiter M, Zellweger C, Meissner J, Stelzig C, Freese M, Capodarve I, Mueller C. Midregional pro‐A‐type natriuretic peptide for diagnosis and prognosis in patients with suspected acute myocardial infarction. Am J Cardiol. 2012; 109:1117-1123 [DOI] [PubMed] [Google Scholar]
- 5.Tiwari RP, Jain A, Khan Z, Kohli V, Bharmal RN, Kartikeyan S, Bisen PS. Cardiac troponins I and T: molecular markers for early diagnosis, prognosis, and accurate triaging of patients with acute myocardial infarction. Mol Diagn Ther. 2012; 16:371-381 [DOI] [PubMed] [Google Scholar]
- 6.Haltern G, Peiniger S, Bufe A, Reiss G, Gulker H, Scheffold T. Comparison of usefulness of heart‐type fatty acid binding protein versus cardiac troponin T for diagnosis of acute myocardial infarction. Am J Cardiol. 2010; 105:1-9 [DOI] [PubMed] [Google Scholar]
- 7.Downes MR, Thorne J, Tengku Khalid TN, Hassan HA, Leader M. Profile of sudden death in an adult population (1999–2008). Ir Med J. 2010; 103:183-184 [PubMed] [Google Scholar]
- 8.Subirana MT, Juan‐Babot JO, Puig T, Lucena J, Rico A, Salguero M, Borondo JC, Ordonez J, Arimany J, Vazquez R, Badimon L, Thiene G, de Luna AB. Specific characteristics of sudden death in a mediterranean Spanish population. Am J Cardiol. 2011; 107:622-627 [DOI] [PubMed] [Google Scholar]
- 9.Tiemensma M, Burger EH. Sudden and unexpected deaths in an adult population, Cape Town, South Africa, 2001–2005. S Afr Med J. 2012; 102:90-94 [DOI] [PubMed] [Google Scholar]
- 10.Jennings RB, Steenbergen C. In: Rubin E, Farber JL. (eds.). Ischemic heart disease. Pathology. 1999Philadelphia; Lippincott‐Raven Publishers; 557-559 [Google Scholar]
- 11.Schoen F, Mitchell RN. In: Kumar V, Abbas AK, Fausto N, Aster JC. (eds.). Myocardial infarction. Robbins and Cotran Pathologic Basis of Disease. 2009Philadelphia Saunders; 547-558 [Google Scholar]
- 12.Burke A, Tavora F. Myocardial infarction. Practical Cardiovascular Pathology. 2010Philadelphia: Wolters Kluwer Health Lippincott Williams & Wilkins; 86-95 [Google Scholar]
- 13.Warren CM, Geenen DL, Helseth DL, Jr, Xu H, Solaro RJ. Sub‐proteomic fractionation, iTRAQ, and OFFGEL‐LC‐MS/MS approaches to cardiac proteomics. J Proteomics. 2010; 73:1551-1561 [DOI] [PMC free article] [PubMed] [Google Scholar]
- 14.Liu Y, Liang WB, Zhang LS, Gao LB, Chen TY, Wang YY, Zhang L. Expression of basigin in the early phase of acute myocardial ischemia in rats. Mol Med Rep. 2013; 7:1494-1500 [DOI] [PubMed] [Google Scholar]
- 15.Fox CH, Johnson FB, Whiting J, Roller PP. Formaldehyde fixation. J Histochem Cytochem. 1985; 33:845-853 [DOI] [PubMed] [Google Scholar]
- 16.Metz B, Kersten GF, Hoogerhout P, Brugghe HF, Timmermans HA, de Jong A, Meiring H, ten Hove J, Hennink WE, Crommelin DJ, Jiskoot W. Identification of formaldehyde‐induced modifications in proteins: reactions with model peptides. J Biol Chem. 2004; 279:6235-6243 [DOI] [PubMed] [Google Scholar]
- 17.Patel V, Hood BL, Molinolo AA, Lee NH, Conrads TP, Braisted JC, Krizman DB, Veenstra TD, Gutkind JS. Proteomic analysis of laser‐captured paraffin‐embedded tissues: a molecular portrait of head and neck cancer progression. Clin Cancer Res. 2008; 14:1002-1014 [DOI] [PubMed] [Google Scholar]
- 18.Xiao Z, Li G, Chen Y, Li M, Peng F, Li C, Li F, Yu Y, Ouyang Y, Chen Z. Quantitative proteomic analysis of formalin‐fixed and paraffin‐embedded nasopharyngeal carcinoma using iTRAQ labeling, two‐dimensional liquid chromatography, and tandem mass spectrometry. J Histochem Cytochem. 2010; 58:517-527 [DOI] [PMC free article] [PubMed] [Google Scholar]
- 19.Nirmalan NJ, Hughes C, Peng J, McKenna T, Langridge J, Cairns DA, Harnden P, Selby PJ, Banks RE. Initial development and validation of a novel extraction method for quantitative mining of the formalin‐fixed, paraffin‐embedded tissue proteome for biomarker investigations. J Proteome Res. 2011; 10:896-906 [DOI] [PMC free article] [PubMed] [Google Scholar]
- 20.Kakimoto Y, Tsuruyama T, Yamamoto T, Furuta M, Kotani H, Ozeki M, Yoshizawa A, Haga H, Tamaki K. Novel in situ pretreatment method for significantly enhancing the signal in MALDI‐TOF MS of formalin‐fixed paraffin‐embedded tissue sections. PLoS One. 2012; 7:e41607. [DOI] [PMC free article] [PubMed] [Google Scholar]
- 21.Thygesen K, Alpert JS, Jaffe AS, Simoons ML, Chaitman BR, White HD, Katus HA, Lindahl B, Morrow DA, Clemmensen PM, Johanson P, Hod H, Underwood R, Bax JJ, Bonow RO, Pinto F, Gibbons RJ, Fox KA, Atar D, Newby LK, Galvani M, Hamm CW, Uretsky BF, Steg PG, Wijns W, Bassand JP, Menasche P, Ravkilde J, Ohman EM, Antman EM, Wallentin LC, Armstrong PW, Januzzi JL, Nieminen MS, Gheorghiade M, Filippatos G, Luepker RV, Fortmann SP, Rosamond WD, Levy D, Wood D, Smith SC, Hu D, Lopez‐Sendon JL, Robertson RM, Weaver D, Tendera M, Bove AA, Parkhomenko AN, Vasilieva EJ, Mendis S. Third universal definition of myocardial infarction. Circulation. 2012; 126:2020-2035 [DOI] [PubMed] [Google Scholar]
- 22.Meng X, Ming M, Wang E. Heart fatty acid binding protein as a marker for postmortem detection of early myocardial damage. Forensic Sci Int. 2006; 160:11-16 [DOI] [PubMed] [Google Scholar]
- 23.Ross MH, Pawlina W. Muscle tissue. Histology a Text and Atlas. 2011Philadelphia: Wolters Kluwer Health Lippincott Williams & Wilkins; 310-351 [Google Scholar]
- 24.Minagawa I, Fukuda M, Ishige H, Kohriki H, Shibata M, Park EY, Kawarasaki T, Kohsaka T. Relaxin‐like factor (RLF)/insulin‐like peptide 3 (INSL3) is secreted from testicular Leydig cells as a monomeric protein comprising three domains B‐C‐A with full biological activity in boars. Biochem J. 2012; 441:265-273 [DOI] [PMC free article] [PubMed] [Google Scholar]
- 25.Burlina A, Zaninotto M, Secchiero S, Rubin D, Accorsi F. Troponin T as a marker of ischemic myocardial injury. Clin Biochem. 1994; 27:113-121 [DOI] [PubMed] [Google Scholar]
- 26.Kleine AH, Glatz JF, Van Nieuwenhoven FA, Van der Vusse GJ. Release of heart fatty acid‐binding protein into plasma after acute myocardial infarction in man. Mol Cell Biochem. 1992; 116:155-162 [DOI] [PubMed] [Google Scholar]
- 27.Tanaka T, Hirota Y, Sohmiya K, Nishimura S, Kawamura K. Serum and urinary human heart fatty acid‐binding protein in acute myocardial infarction. Clin Biochem. 1991; 24:195-201 [DOI] [PubMed] [Google Scholar]
- 28.Seino Y, Ogata K, Takano T, Ishii J, Hishida H, Morita H, Takeshita H, Takagi Y, Sugiyama H, Tanaka T, Kitaura Y. Use of a whole blood rapid panel test for heart‐type fatty acid‐binding protein in patients with acute chest pain: comparison with rapid troponin T and myoglobin tests. Am J Med. 2003; 115:185-190 [DOI] [PubMed] [Google Scholar]
- 29.Lange S, Agarkova I, Perriard JC, Ehler E. The sarcomeric M‐band during development and in disease. J Muscle Res Cell Motil. 2005; 26:375-379 [DOI] [PubMed] [Google Scholar]
- 30.Hein S, Scheffold T, Schaper J. Ischemia induces early changes to cytoskeletal and contractile proteins in diseased human myocardium. J Thorac Cardiovasc Surg. 1995; 110:89-98 [DOI] [PubMed] [Google Scholar]
- 31.Hein S, Kostin S, Heling A, Maeno Y, Schaper J. The role of the cytoskeleton in heart failure. Cardiovasc Res. 2000; 45:273-278 [DOI] [PubMed] [Google Scholar]
- 32.Jacquet S, Yin X, Sicard P, Clark J, Kanaganayagam GS, Mayr M, Marber MS. Identification of cardiac myosin‐binding protein C as a candidate biomarker of myocardial infarction by proteomics analysis. Mol Cell Proteomics. 2009; 8:2687-2699 [DOI] [PMC free article] [PubMed] [Google Scholar]
- 33.Govindan S, McElligott A, Muthusamy S, Nair N, Barefield D, Martin JL, Gongora E, Greis KD, Luther PK, Winegrad S, Henderson KK, Sadayappan S. Cardiac myosin binding protein‐C is a potential diagnostic biomarker for myocardial infarction. J Mol Cell Cardiol. 2012; 52:154-164 [DOI] [PMC free article] [PubMed] [Google Scholar]
- 34.Larue C, Calzolari C, Bertinchant JP, Leclercq F, Grolleau R, Pau B. Cardiac‐specific immunoenzymometric assay of troponin I in the early phase of acute myocardial infarction. Clin Chem. 1993; 39:972-979 [PubMed] [Google Scholar]
- 35.Pervaiz S, Anderson FP, Lohmann TP, Lawson CJ, Feng YJ, Waskiewicz D, Contois JH, Wu AH. Comparative analysis of cardiac troponin I and creatine kinase‐MB as markers of acute myocardial infarction. Clin Cardiol. 1997; 20:269-271 [DOI] [PMC free article] [PubMed] [Google Scholar]
- 36.Kioka N, Ueda K, Amachi T. Vinexin, CAP/ponsin, ArgBP2: a novel adaptor protein family regulating cytoskeletal organization and signal transduction. Cell Struct Funct. 2002; 27:1-7 [DOI] [PubMed] [Google Scholar]
- 37.Wang B, Golemis EA, Kruh GD. ArgBP2, a multiple Src homology 3 domain‐containing, Arg/Abl‐interacting protein, is phosphorylated in v‐Abl‐transformed cells and localized in stress fibers and cardiocyte Z‐disks. J Biol Chem. 1997; 272:17542-17550 [DOI] [PubMed] [Google Scholar]
- 38.Sanger JM, Wang J, Gleason LM, Chowrashi P, Dube DK, Mittal B, Zhukareva V, Sanger JW. Arg/Abl‐binding protein, a Z‐body and Z‐band protein, binds sarcomeric, costameric, and signaling molecules. Cytoskeleton (Hoboken). 2010; 67:808-823 [DOI] [PMC free article] [PubMed] [Google Scholar]
- 39.Murase K, Ito H, Kanoh H, Sudo K, Iwamoto I, Morishita R, Soubeyran P, Seishima M, Nagata K. Cell biological characterization of a multidomain adaptor protein, ArgBP2, in epithelial NMuMG cells, and identification of a novel short isoform. Med Mol Morphol. 2012; 45:22-28 [DOI] [PubMed] [Google Scholar]
- 40.Ronty M, Taivainen A, Moza M, Kruh GD, Ehler E, Carpen O. Involvement of palladin and alpha‐actinin in targeting of the Abl/Arg kinase adaptor ArgBP2 to the actin cytoskeleton. Exp Cell Res. 2005; 310:88-98 [DOI] [PubMed] [Google Scholar]
- 41.Martin E, Rosenthal RE, Fiskum G. Pyruvate dehydrogenase complex: metabolic link to ischemic brain injury and target of oxidative stress. J Neurosci Res. 2005; 79:240-247 [DOI] [PMC free article] [PubMed] [Google Scholar]
- 42.Johnson MT, Yang HS, Magnuson T, Patel MS. Targeted disruption of the murine dihydrolipoamide dehydrogenase gene (Dld) results in perigastrulation lethality. Proc Natl Acad Sci USA. 1997; 94:14512-14517 [DOI] [PMC free article] [PubMed] [Google Scholar]
- 43.Johnson M, Vang P, Filipovits J, Gardner D. Maternal enzyme masks the phenotype of mouse embryos lacking dihydrolipoamide dehydrogenase. Reprod Biomed Online. 2009; 19:79-88 [DOI] [PMC free article] [PubMed] [Google Scholar]
- 44.Murin R, Schaer A, Kowtharapu BS, Verleysdonk S, Hamprecht B. Expression of 3‐hydroxyisobutyrate dehydrogenase in cultured neural cells. J Neurochem. 2008; 105:1176-1186 [DOI] [PubMed] [Google Scholar]
- 45.Mullen E, Ohlendieck K. Proteomic profiling of non‐obese type 2 diabetic skeletal muscle. Int J Mol Med. 2010; 25:445-458 [DOI] [PubMed] [Google Scholar]
- 46.Chen YC, Chang MY, Shiau AL, Yo YT, Wu CL. Mitochondrial ribosomal protein S36 delays cell cycle progression in association with p53 modification and p21(WAF1/CIP1) expression. J Cell Biochem. 2007; 100:981-990 [DOI] [PubMed] [Google Scholar]