

Abstract
Background
Inflammation is induced in the heart during the development of cardiac hypertrophy. The initiating mechanisms and the role of inflammation in cardiac hypertrophy, however, remain unclear. Toll‐like receptor‐2 (TLR2) recognizes endogenous molecules that induce noninfectious inflammation. Here, we examined the role of TLR2‐mediated inflammation in cardiac hypertrophy.
Methods and Results
At 2 weeks after transverse aortic constriction, Tlr2−/− mice showed reduced cardiac hypertrophy and fibrosis with greater left ventricular dilatation and impaired systolic function compared with wild‐type mice, which indicated impaired cardiac adaptation in Tlr2−/− mice. Bone marrow transplantation experiment revealed that TLR2 expressed in the heart, but not in bone marrow–derived cells, is important for cardiac adaptive response to pressure overload. In vitro experiments demonstrated that TLR2 signaling can induce cardiomyocyte hypertrophy and fibroblast and vascular endothelial cell proliferation through nuclear factor–κB activation and interleukin‐1β upregulation. Systemic administration of a nuclear factor–κB inhibitor or anti–interleukin‐1β antibodies to wild‐type mice resulted in impaired adaptive cardiac hypertrophy after transverse aortic constriction. We also found that heat shock protein 70, which was increased in murine plasma after transverse aortic constriction, can activate TLR2 signaling in vitro and in vivo. Systemic administration of anti–heat shock protein 70 antibodies to wild‐type mice impaired adaptive cardiac hypertrophy after transverse aortic constriction.
Conclusions
Our results demonstrate that TLR2‐mediated inflammation induced by extracellularly released heat shock protein 70 is essential for adaptive cardiac hypertrophy in response to pressure overload. Thus, modulation of TLR2 signaling in the heart may provide a novel strategy for treating heart failure due to inadequate adaptation to hemodynamic stress.
Keywords: heart failure, hypertrophy, inflammation, interleukins, signal transduction
Introduction
Cardiac hypertrophy is an abnormal increase in the volume of the heart muscle resulting from cardiomyocyte hypertrophy and proliferation of noncardiomyocyte cells such as fibroblasts and vascular endothelial cells in response to increased workload. This process is initially an adaptive response to maintain cardiac function through reduction in wall stress and energy expenditure,1–2 and impairment of the adaptive mechanisms leads to heart failure.3–4 Up to now, the molecular mechanisms contributing to the initiation of cardiac hypertrophy in response to hemodynamic stress are incompletely understood.
Recently, noninfectious inflammation has been implicated in the pathophysiology of various diseases including cancers and lifestyle‐related diseases.5–9 It has also been reported that inflammation is induced in the heart during the development of cardiac hypertrophy despite the fact that there is no evidence of infection with microorganisms.10–11 In addition, proinflammatory cytokines such as interleukin‐1β (IL‐1β), IL‐6, and tumor necrosis factor‐α (TNF‐α) have been shown to be related to the pathophysiology of cardiac hypertrophy and heart failure.12–15 However, the initiating mechanisms and the precise role of inflammation in cardiac hypertrophy remain unclear.
It has been postulated that noninfectious inflammation is induced by the interaction between pathogen receptors and endogenous molecules termed damage‐associated molecular patterns (DAMPs), which are released from the cells under pathological conditions.5–6 Toll‐like receptors (TLRs) are a class of proteins that play an important role in the innate immune system as pathogen receptors.5 TLRs recognize not only foreign substances but also endogenous molecules, which induce noninfectious inflammation.5–8 TLR2 is a member of the TLR family and is expressed not only on immune cells but also on nonimmune cells, including cardiomyocytes, fibroblasts, and vascular endothelial cells.16 There are various reports indicating that TLR2 is involved in stress responses under pathological conditions.17–18 Here we show that TLR2‐mediated inflammation induced by extracellularly released heat shock protein 70 (HSP70) is critically involved in adaptive cardiac hypertrophy during pressure overload.
Methods
Animal Study
All experiments were approved by the University of Tokyo Ethics Committee for Animal Experiments and strictly adhered to the guidelines for animal experiments of the University of Tokyo. Eight‐ to 12‐week‐old male mice were used unless indicated. Wild‐type C57BL/6 mice were purchased from Takasugi Experimental Animal Supply. Tlr2−/− and Tlr4−/− mice were purchased from OrientalBioService. Pressure overload was induced by transverse aortic constriction (TAC) as described previously.19 Briefly, mice were anesthetized by intraperitoneal injection of sodium pentobarbital (50 mg/kg of body weight). A 24‐gauge polyethylene tube was inserted into the trachea, and mechanical ventilation was provided with use of a rodent ventilator (Model SN‐480‐7; Shinano Manufacturing Co.). The chest was opened via the second left intercostal incision, and the transverse aortic arch was exposed. The transverse aorta was banded between the brachiocephalic and the left common carotid arteries to the diameter of a 25‐gauge needle using 7‐0 nylon suture. This procedure increased systolic blood pressure in the ascending aorta by 36.2±0.7 mm Hg (n=3), which was measured with micro pressure transducers cannulated from the right carotid artery during the procedure. This procedure was used as a model for pressure overload unless otherwise indicated. For more severe pressure overload, a 27‐gauge needle was used for the banding of the transverse aorta, which increased systolic blood pressure in the ascending aorta by 74.0±2.7 mm Hg (n=3). Sham animals were prepared identically without undergoing banding of the transverse aorta.
A nuclear factor (NF)‐κB inhibitor, BAY 11‐7082 (5 mg per mouse, Enzo Life Sciences), was injected intraperitoneally every other day after the operation. Anti–IL‐1β antibodies or control IgG (100 μg per mouse, R&D Systems) was injected intravenously immediately after the operation. Anti‐HSP70 antibodies (200 μg/kg, Santa Cruz Biotechnology) or control IgG was administered intraperitoneally every other day after the operation. Human recombinant HSP70 (low endotoxin, 10 μg per mouse; Enzo Life Sciences) was injected intraperitoneally.
Bone Marrow Transplantation Experiment
Eight‐week‐old male Tlr2+/+ and Tlr2−/− mice were subjected to irradiation with a total dose of 9 Gy followed by bone marrow reconstitution by tail vein injection with 1.0×10⁷ bone marrow cells isolated from donor femurs and tibias. Four weeks after bone marrow transplantation, mice were subjected to TAC or sham operation.
To verify the reconstitution of bone marrow after transplantation by this protocol, we used green fluorescent protein (GFP) mice as the donors. Flow cytometry analysis showed that at 4 weeks after bone marrow transplantation, peripheral blood cells consisted of >95% GFP+ cells.
Echocardiographic and Hemodynamic Measurements
Transthoracic echocardiographic study was performed under anesthesia with sodium pentobarbital with a dynamically focused 15‐MHz linear‐array transducer (EnVisor M2540A; Philips Medical System) with a depth setting of 1.5 cm. M‐mode tracings were recorded from the short‐axis view at the papillary muscle level of the left ventricle (LV). For hemodynamic measurement, the right carotid artery was cannulated by the micro pressure transducers with an outer diameter of 0.42 mm (Samba 201 and Samba Preclin 420 LP; Samba Sensors AB), which was then advanced into the LV. Pressure signals were recorded using a MacLab data acquisition system (Model 400 with chart v4.2 software; AD Instruments) with a sampling rate of 5000 Hz. Heart rate was kept at ≈250 to 350 beats per minute to minimize data deviation.
Histological Analysis
Hearts were weighed and fixed in methanol. Samples were embedded in paraffin and sectioned at 5‐μm thickness. Specimens were stained with hematoxylin and eosin (H&E) or Sirius Red dyes as described previously.19 Myocyte cross‐sectional area (CSA) and collagen volume fraction (CVF) were determined by quantitative morphometry of specimens with H&E and Sirius Red staining, respectively. Twenty cardiomyocytes per slide were measured for myocyte CSA calculation. Five random fields were examined for CVF analysis (magnification, ×200).
Immunohistochemical staining was performed with anti‐CD31 antibody (MEC13.3; BD Pharmingen) and anti–Mac‐3 antibody (M3/84; BD Pharmingen). Antibody distribution was visualized by use of the avidin‐biotin complex technique and Vector Red substrate (Vector Laboratories). Quantitative assessment of the number of vessels per cardiomyocyte was performed in specimens with anti‐CD31 staining. The number of vessels per cardiomyocyte was counted in 50 cardiomyocytes. Macrophage density was assessed in specimens with anti–Mac‐3 antibody, and 5 random fields were examined (magnification, ×400). Density was expressed as the number per square millimeter.
RNA Extraction and RT‐PCR Analysis
Total RNA was isolated from the myocardial tissues and cultured cells with TRIzol Reagent (Invitrogen Corp) and RNA Isolation Kit (Agilent Technologies), respectively. Reverse transcription was performed with 1 μg of total RNA, random hexamer primers, and MMLV reverse transcriptase (ReverTraAce‐α; TOYOBO). For quantitative assessment of gene expression levels, quantitative real‐time PCR analysis was performed. Specific mRNAs were quantified by SYBR Green real‐time PCR Master Mix (TOYOBO) in the StepOnePlus Real‐Time PCR System (Applied Biosystems, Foster City, CA) under standard manufacturer's conditions. Data are expressed in arbitrary units that were normalized by correction for the signal obtained in the same cDNA preparation for glyceraldehyde‐3‐phosphate dehydrogenase (GAPDH) mRNA. The primers for real‐time PCR were shown in the Table.
Table 1.
Sequences of Primers for Real‐Time PCR
| Primer | Forward | Reverse | Product Length |
|---|---|---|---|
| Mouse | |||
| TLR2 | GGGGCTTCACTTCTCTGCTT | AGCATCCTCTGAGATTTGACG | 112 |
| ANF | GGGTAGGATTGACAGGATTGGA | CGACTGCCTTTTCCTCCTTG | 91 |
| β‐MHC | CAAGGTCAATACTCTGACCAAGG | CCATGCGCACTTTCTTCTC | 95 |
| COL1A1 | CCGAACCCCAAGGAAAAGA | GTGGACATTAGGCGCAGGA | 134 |
| COL3A1 | TCCCCTGGAATCTGTGAATC | TGAGTCGAATTGGGGAGAAT | 63 |
| TGF‐β1 | GCCTGAGTGGCTGTCTTTTG | CGTGGAGTTTGTTATCTTTGCTGT | 125 |
| VEGFA | AAAAACGAAAGCGCAAGAAA | TTTCTCCGCTCTGAACAAGG | 73 |
| MMP2 | CCCCATGAAGCCTTGTTTACC | TTGTAGGAGGTGCCCTGGAA | 82 |
| MMP9 | AGACCAAGGGTACAGCCTGTTC | GGCACGCTGGAATGATCTAAG | 77 |
| MCP‐1 | CCACTCACCTGCTGCTACTCAT | TGGTGATCCTCTTGTAGCTCTCC | 76 |
| IL‐1β | TGAAGTTGACGGACCCCAAA | TGATGTGCTGCTGTGAGATT | 101 |
| IL‐6 | ACAACCACGGCCTTCCCTACTT | CACGATTTCCCAGAGAACATGTG | 129 |
| TNF‐α | TCCCAGGTTCTCTTCAAGGGA | GGTGAGGAGCACGTAGTCGG | 51 |
| IGF‐1 | AGCAGCCTTCCAACTCAATTAT | TGAAGACGACATGATGTGTATCTTTAT | 78 |
| GAPDH | ATGACAACTTTGTCAAGCTCATTT | GGTCCACCACCCTGTTGCT | 69 |
| Rat | |||
| ANF | CACAGATCTGATGGATTTCAAGA | CGCTTCATCGGTCTGCTC | 109 |
| β‐MHC | CACCAACAACCCCTACGATT | AGCACATCAAAGGCGCTAC | 108 |
| IL‐1β | TGTGATGAAAGACGGCACAC | CTTCTTCTTTGGGTATTGTTTGG | 70 |
| IL‐6 | CCCTTCAGGAACAGCTATGAA | ACAACATCAGTCCCAAGAAGG | 74 |
| TNF‐α | TGAACTTCGGGGTGATCG | GGGCTTGTCACTCGAGTTTT | 122 |
| GAPDH | AGCTGGTCATCAATGGGAAA | ATTTGATGTTAGCGGGATCG | 63 |
| Human | |||
| IL‐1β | TACCTGTCCTGCGTGTTGAA | TCTTTGGGTAATTTTTGGGATCT | 76 |
| IL‐6 | CAGGAGCCCAGCTATGAACT | GAAGGCAGCAGGCAACAC | 91 |
| TNF‐α | CAGCCTCTTCTCCTTCCTGAT | GCCAGAGGGCTGATTAGAGA | 123 |
| GAPDH | CGCTCTCTGCTCCTCCTGTT | AAATCCGTTGACTCCGACCTT | 110 |
ANF indicates atrial natriuretic factor; COL1A1, collagen type 1 α1; COL3A1, collagen type 3 α1; GAPDH, glyceraldehyde‐3‐phosphate dehydrogenase; IGF‐1, insulin‐like growth factor‐1; IL, interleukin; MCP‐1, monocyte chemotactic protein‐1; β‐MHC, β‐myosin heavy chain; MMP, matrix metalloproteinase; PCR, polymerase chain reaction; TGF‐β1, transforming growth factor‐β1; TLR2, Toll‐like receptor‐2; TNF‐α, tumor necrosis factor‐α; VEGFA, vascular endothelial growth factor A.
Western Blot Analysis
Proteins were extracted from the myocardial tissues homogenized in an RIPA Lysis and Extraction Buffer (G‐Biosciences) with a protease inhibitor cocktail (Sigma‐Aldrich) and a phosphatase inhibitor cocktail (Wako). Protein samples (20 μg) were separated by SDS‐PAGE and transferred to a polyvinylidene fluoride membrane (Hybond‐P; GE Healthcare). The membrane was incubated with anti‐Akt1 antibody (1:1000; Santa Cruz Biotechnology), anti–phospho‐Akt1 (1:1000; Sigma), and anti–β‐actin antibody (1:5000; AC‐15; Sigma‐Aldrich), followed by incubation with horseradish peroxidase–conjugated secondary antibody. The enhanced chemiluminescence system (ECL Plus; GE Healthcare) was used for detection. The densitometric values of bands were measured using the densitometry software (Multi Gauge Ver3.0; FUJIFILM).
Measurement of NF‐κB Activity in Murine Heart
For assessment of NF‐κB activity in murine heart, free p65 in the nucleus of the heart tissue was measured by using NF‐κB/p65 ActivELISA Kit (IMGENEX) according to the manufacturer's recommendation. Values were normalized to protein levels.
Measurement of HSP70 Concentration in Murine Plasma and Cell Culture Medium
HSP70 concentration was measured in the plasma of TAC or sham‐operated mice and in the medium in which cardiomyocytes, fibroblasts, and vascular endothelial cells were cultured with 30 μmol/L H2O2 or distilled water for 24 hours by using the HSP70 high‐sensitivity EIA kit (Enzo Life Sciences) according to the manufacturer's recommendation.
Cell Cultures
Human microvascular endothelial cells from the heart (HMVEC‐Cs) were purchased from Lonza. HMVEC‐Cs were cultured in EGM‐2 medium (Lonza) at 37°C in a mixture of 95% air–5% CO2.
Cardiomyocytes and fibroblasts were prepared from neonatal rats and cultured as described previously.19 Neonatal Wistar rats were purchased from Takasugi Experimental Animal Supply. Neonatal ventricles from 1‐day‐old Wistar rats were separated and minced in ice‐cold balanced salt solution. For isolation of cardiac cells, the tissues were incubated in a balanced salt solution containing 0.2% collagenase type 2 (Worthington Biochemical) for 7 minutes at 37°C with agitation. The digestion buffer was replaced 7 times. The dispersed cells were incubated in 100‐mm culture dishes for 90 minutes to remove nonmyocytes. The unattached viable cells, which were rich in cardiomyocytes, were cultured on collagen type I–coated dishes at 37°C in DMEM supplemented with 10% fetal bovine serum (FBS). Nonmyocyte cells that attached to the dishes were cultured in DMEM supplemented with 10% FBS and allowed to grow to confluence. Then, they were trypsinized and passaged. Cell cultures yielded by this procedure were used as cardiac fibroblasts.20.
In Vitro Experiments
Isolated cardiomyocytes, cardiac fibroblasts, and HMVEC‐Cs were stimulated by a specific synthetic ligand for TLR2, Pam3CSK4 (300 ng/mL; InvivoGen),21 and control, or human recombinant HSP70 (5 μg/mL) and vehicle. Treatment of anti–IL‐1β antibodies and control IgG (5 μg/mL for cardiomyocytes and cardiac fibroblasts; 2.5 μg/mL for HMVEC‐Cs; R&D Systems), anti–IL‐6 antibodies and control IgG (20 μg/mL for cardiomyocytes and cardiac fibroblasts; 500 ng/mL for HMVEC‐Cs; R&D Systems), anti–TNF‐α antibodies and control IgG (60 μg/mL for cardiomyocytes and cardiac fibroblasts; 12 μg/mL for HMVEC‐Cs; R&D Systems), or anti‐TLR2 antibodies and isotype control antibodies (15 μg/mL, BioLegend) was performed 1 hour before the stimulation. BAY 11‐7082 (1 μmol/L), and dimethyl sulfoxide or the NF‐κB essential modulator (NEMO)‐binding domain (NBD) peptide and the control peptide (5 μmol/L; IMGENEX) were pretreated 30 minutes before the stimulation.
Cardiomyocyte hypertrophy was assessed after 48‐hour stimulation by cardiomyocyte sizes and expression levels of hypertrophic marker genes. The expression levels of proinflammatory cytokine mRNAs were measured after 48‐hour stimulation by real‐time PCR. Cardiomyocyte size was determined by measuring the cell surface areas of sarcomeric α‐actinin–positive cells identified through immunocytochemical examination.19 Briefly, cardiomyocytes were fixed in 2% paraformaldehyde and permeabilized for 10 minutes with 0.2% Triton‐X (Sigma‐Aldrich) in PBS. After blocking with PBS containing 2% FBS for 10 minutes, they were then incubated with anti‐sarcomeric α‐actinin antibodies (Sigma‐Aldrich), followed by treatment with Alexa Fluor 488–conjugated secondary antibodies.
Proliferation of cardiac fibroblasts and HMVEC‐Cs was assessed after 24‐hour stimulation with Pam3CSK4 and control or with human recombinant HSP70 and vehicle by means of dimethylthiazol‐carboxymethoxyphenyl‐sulfophenyl‐tetrazolium (MTS) assay (Promega) and expressed as the percentage of the absorbance to the well with cells treated by vehicle and control antibodies.22 The expression levels of proinflammatory cytokine mRNAs were also measured 24 hours after the stimulation by real‐time PCR.
Statistical Analysis
Data are shown as mean±SEM. Normality was tested with the Shapiro–Wilk test. Differences in means between 2 groups were analyzed by unpaired Student's t test because a normal distribution was confirmed in all the groups. When data were normally distributed, multiple group comparison was performed by 1‐way ANOVA followed by Student–Newman–Keuls post hoc test. When the number of samples was different among groups, Schéffe's test was used as the post hoc test. When a normal distribution was not confirmed, multiple group comparison was performed by the Kruskal–Wallis test followed by post hoc Steel–Dwass multiple‐comparison test. Kaplan–Meier method and the log‐rank test were used for comparison of survival. Values of P<0.05 were considered statistically significant.
Results
Genetic Disruption of TLR2 Impairs Adaptive Cardiac Hypertrophy in Response to Pressure Overload
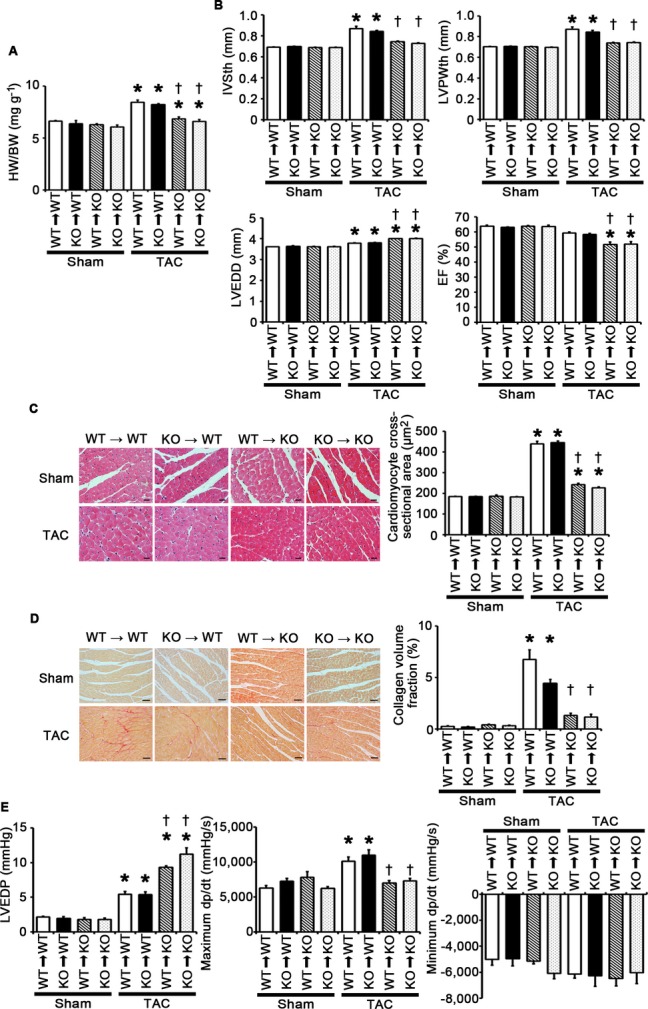
To examine the role of TLR2 in cardiac hypertrophy, we induced pressure overload by TAC in Tlr2+/+ and Tlr2−/− mice. In the absence of pressure overload, cardiac function and morphology did not differ between Tlr2+/+ and Tlr2−/− mice. In Tlr2+/+ mice, TLR2 mRNA expression level was increased after 2 weeks of pressure overload compared with sham‐operated mice (Figure 1A). The survival rate up to 2 weeks after TAC was significantly lower in Tlr2−/− mice than in Tlr2+/+ mice (Tlr2−/− mice, 73.3%, n=15, versus Tlr2+/+ mice, 100%, n=15, P=0.035) (Figure 1B), whereas all sham‐operated Tlr2+/+ and Tlr2−/− mice survived until 2 weeks after the operation (n=10 for each group). Tlr2−/− hearts showed attenuated cardiac hypertrophy but greater left ventricular dilatation with decreased ejection fraction compared with Tlr2+/+ hearts after TAC (Figure 1C through 1E). Hemodynamic measurement revealed higher LV end‐diastolic pressure (LVEDP) and smaller absolute values of maximum and minimum dP/dt in TAC‐operated Tlr2−/− hearts than in TAC‐operated Tlr2+/+ hearts (Figure 1F). Histological assessment demonstrated significantly smaller cardiomyocytes and reduced cardiac fibrosis in TAC‐operated Tlr2−/− hearts compared with those in TAC‐operated Tlr2+/+ hearts (Figure 2A and 2B). Consistently, expression levels of hypertrophic marker genes and fibrosis‐related genes were lower in TAC‐operated Tlr2−/− hearts than in TAC‐operated Tlr2+/+ hearts (Figure 2C and 2D). Tlr2−/− hearts showed the smaller number of vessels per cardiomyocyte with lower mRNA expression levels of vascular endothelial growth factor A than did Tlr2+/+ hearts after TAC (Figure 2E and 2F). In addition, mRNA expression levels of matrix metalloproteinases 2 and 9 were reduced in Tlr2−/− hearts compared with Tlr2+/+ hearts after TAC (Figure 2G). These results indicate that TLR2 is essential for cardiac adaptive response to pressure overload. In fact, more severe pressure overload produced with a 27‐gauge needle resulted in 100% mortality within 2 weeks in Tlr2−/− mice, whereas the survival rate of Tlr2+/+ mice was 60% (Figure 3).
Figure 1.
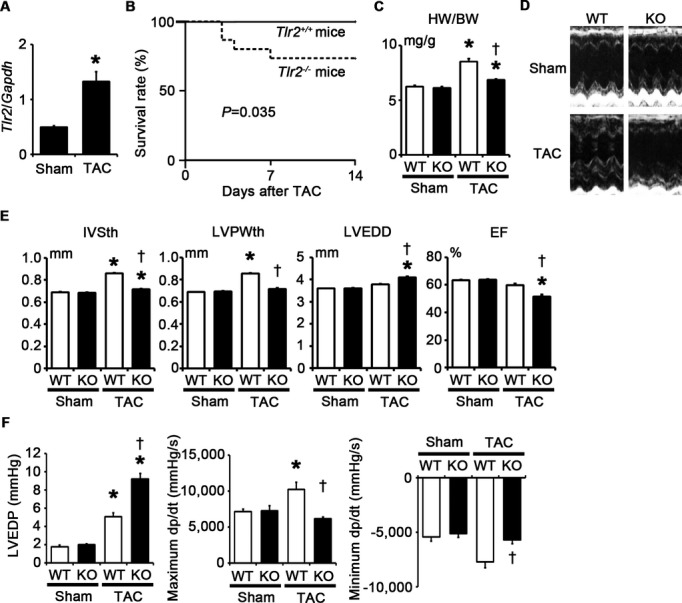
TLR2 is essential for adaptive cardiac hypertrophy in response to pressure overload. A through F, Mice were analyzed at 2 weeks after TAC or sham operation. A, Expression levels of TLR2 (Tlr2) mRNA (n=4). Expression levels were normalized to those of GAPDH (Gapdh). B, Survival curve of Tlr2+/+ and Tlr2−/− mice at 2 weeks after TAC. Continuous line, Tlr2+/+ mice (n=15); dotted line, Tlr2−/− mice (n=15). P=0.035 for the log‐rank test. C, Heart weight (HW)–to–body weight (BW) ratios (n=5 to 10). D, Echocardiographic images. E, Echocardiographic parameters (n=5 to 10). F, Hemodynamic data (n=5). Hemodynamic measurement was performed by cannulating the micro–pressure transducers into the left ventricle through the right carotid artery. WT, Tlr2+/+ mice; KO, Tlr2−/− mice. *P<0.05 vs sham; †P<0.05 vs Tlr2+/+ mice. EF indicates ejection fraction; GAPDH, glyceraldehyde‐3‐phosphate dehydrogenase; KO, knockout; IVSth, interventricular septum thickness; LVEDD, left ventricular end‐diastolic diameter; LVEDP, left ventricular end‐diastolic pressure; LVPWth, left ventricular posterior wall thickness; TAC, transverse aortic constriction; TLR, Toll‐like receptor; WT, wild‐type.
Figure 2.
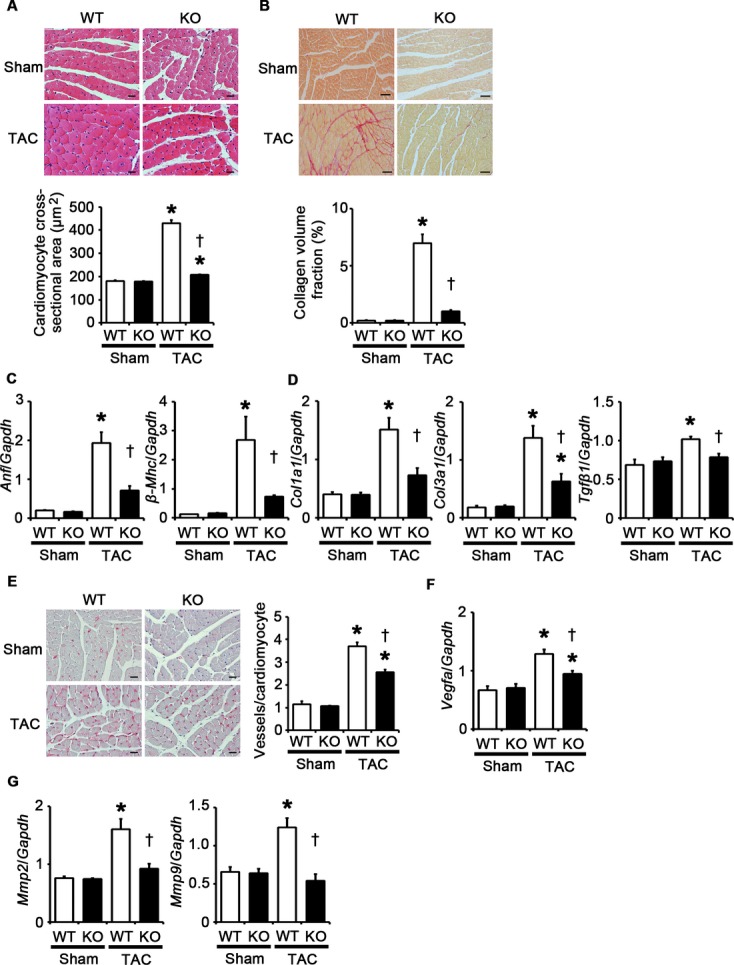
Genetic disruption of TLR2 suppresses cardiomyocyte hypertrophy, interstitial fibrosis, angiogenesis, and expression of matrix metalloproteinases at 2 weeks after TAC. A, Hematoxylin and eosin–stained heart sections. Cardiomyocyte cross‐sectional area was measured in 20 cardiomyocytes (n=4). Scale bars=20 μm. B, Sirius Red–stained heart sections. Collagen volume fraction was calculated in 5 random fields (n=4). Scale bars=50 μm. C, Expression levels of hypertrophic marker genes. Expression levels of atrial natriuretic factor (Anf) and β‐myosin heavy chain (β‐Mhc) mRNAs were assessed (n=4). D, Expression levels of fibrosis‐related genes. Expression levels of collagen type 1 α1 (Col1a1), collagen type 3 α1 (Col3a1), and transforming growth factor‐β1 (Tgfβ1) mRNAs were assessed (n=4). E, Immunohistochemistry using antibodies to CD31. The number of vessels per cardiomyocyte was counted in 50 cardiomyocytes (n=4). Scale bars=20 μm. F, Expression levels of vascular endothelial growth factor A (Vegfa) mRNA (n=4). G, Expression levels of matrix metalloproteinases 2 (Mmp2) and 9 (Mmp9) mRNAs (n=4). Expression levels of each gene were normalized to those of GAPDH (Gapdh). WT, Tlr2+/+ mice; KO, Tlr2−/− mice. *P<0.05 vs sham; †P<0.05 vs Tlr2+/+ mice. TAC indicates transverse aortic constriction; GAPDH, glyceraldehyde‐3‐phosphate dehydrogenase; KO, knockout; TLR, Toll‐like receptor; WT, wild‐type.
Figure 3.
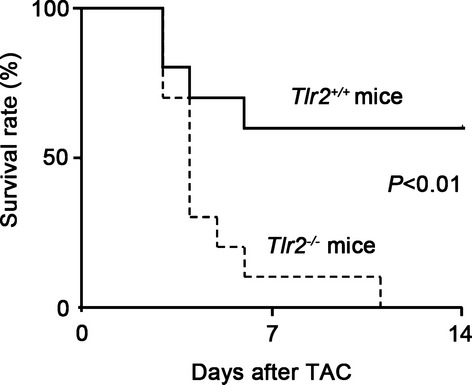
Survival curve of Tlr2+/+ and Tlr2−/− mice after TAC produced with a 27‐gauge needle. Continuous line, Tlr2+/+ mice (n=10); dotted line, Tlr2−/− mice (n=10). P<0.01 for the log‐rank test. TAC indicates transverse aortic constriction; TLR, Toll‐like receptor.
We also assessed the role of TLR2 in the later phase of pressure overload–induced cardiac hypertrophy. Although the survival rate after TAC was significantly higher in Tlr2+/+ mice than in Tlr2−/− mice at 28 days after TAC, no additional deaths were observed in both Tlr2+/+ and Tlr2−/− mice between 14 days and 28 days after TAC (Figure 4A). At 28 days after TAC, Tlr2+/+ mice showed LV dilatation and cardiac dysfunction, indicating the transition from adaptive cardiac hypertrophy to heart failure (Figure 4B). LV dilatation and cardiac dysfunction remained more severe in Tlr2−/− mice compared with those in Tlr2+/+ mice at 28 days after TAC (Figure 4B and 4C). The heart weight–to–body weight ratios were significantly smaller in Tlr2−/− mice than in Tlr2+/+ mice, even at 28 days after TAC (Figure 4D). Thus, cardiac maladaptation to pressure overload due to the loss of TLR2 is not a transient phenomenon in the early phase of pressure overload but leads to progressive cardiac dysfunction even in the later phase of pressure overload.
Figure 4.
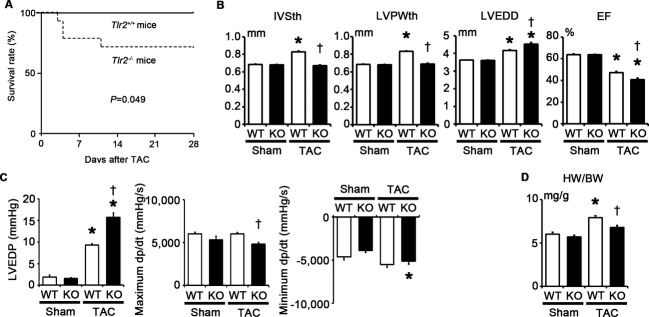
Impact of TLR2 deficiency on pressure overload–induced cardiac hypertrophy at 28 days after TAC. A, Survival curve of Tlr2+/+ and Tlr2−/− mice after TAC produced with a 25‐gauge needle. Continuous line, Tlr2+/+ mice (n=12); dotted line, Tlr2−/− mice (n=14). P=0.049 for the log‐rank test. B, Echocardiographic parameters (n=6). C, Hemodynamic data (n=5). Hemodynamic measurement was performed by cannulating the micro–pressure transducers into the left ventricle through the right carotid artery. D, Heart weight (HW) –to–body weight (BW) ratios (n=6). WT, Tlr2+/+ mice; KO, Tlr2−/− mice. *P<0.05 vs sham; †P<0.05 vs Tlr2+/+ mice. EF indicates ejection fraction; IVSth, interventricular septum thickness; LVEDD, left ventricular end‐diastolic diameter; LVEDP, left ventricular end‐diastolic pressure; LVPWth, left ventricular posterior wall thickness; TAC, transverse aortic constriction; TLR, Toll‐like receptor; WT, wild‐type.
TLR2 Expressed in the Heart Tissue, but Not in Bone Marrow–Derived Cells, Plays an Important Role in Adaptive Cardiac Hypertrophy in Response to Pressure Overload
TLR2 is expressed in various cells including leukocytes, cardiomyocytes, fibroblasts, and vascular endothelial cells. To distinguish the impact of TLR2 expression in the heart tissue from that in bone marrow–derived cells on cardiac hypertrophy, Tlr2+/+ and Tlr2−/− mice were transplanted with Tlr2+/+ and Tlr2−/− bone marrow, respectively, and pressure overload was induced in bone marrow–transplanted mice. The survival rate at 2 weeks after TAC was 100% (5/5) in Tlr2+/+>Tlr2+/+ mice, 100% (5/5) in Tlr2−/−>Tlr2+/+ mice, 80% (4/5) in Tlr2+/+>Tlr2−/− mice, and 80% (4/5) in Tlr2−/−>Tlr2−/− mice (P=NS), whereas all sham‐operated mice survived until 2 weeks after the operation (n=4 for each group). After 2 weeks of pressure overload, Tlr2+/+>Tlr2−/− and Tlr2−/−>Tlr2−/− chimeras showed reduced cardiac hypertrophy and interstitial fibrosis with greater LV dilatation, reduced systolic function, and higher LVEDP compared with Tlr2+/+>Tlr2+/+ and Tlr2−/−>Tlr2+/+ animals (Figure 5A through 5E). No significant differences were found in the phenotype after TAC between Tlr2+/+>Tlr2−/− and Tlr2−/−>Tlr2−/− chimeras or between Tlr2+/+>Tlr2+/+ and Tlr2−/−>Tlr2+/+ animals. These results indicate that TLR2 expressed in the heart, but not in bone marrow–derived cells, plays an important role in cardiac adaptive response to pressure overload.
Figure 5.
TLR2 expressed in the heart tissue, but not in bone marrow–derived cells, plays an important role in adaptive cardiac hypertrophy in response to pressure overload. A through E, Bone marrow–transplanted mice were subjected to TAC and analyzed at 2 weeks after the operation. A, Heart weight (HW) –to–body weight (BW) ratios (n=3 to 4). B, Echocardiographic parameters (n=3 to 4). C, Hematoxylin and eosin–stained heart sections. Cardiomyocyte cross‐sectional area was measured in 20 cardiomyocytes (n=3 to 4). Scale bars=20 μm. D, Sirius Red–stained heart sections. Collagen volume fraction was calculated in 5 random fields (n=3 to 4). Scale bars=50 μm. E, Hemodynamic data (n=4). Hemodynamic measurement was performed by cannulating the micro–pressure transducers into the left ventricle through the right carotid artery. WT, Tlr2+/+ mice; KO, Tlr2−/− mice. *P<0.05 vs sham; †P<0.05 vs Tlr2+/+ recipient mice transplanted with the bone marrow of the same genotype. EF indicates ejection fraction; IVSth, interventricular septum thickness; LVEDD, left ventricular end‐diastolic diameter; LVEDP, left ventricular end‐diastolic pressure; LVPWth, left ventricular posterior wall thickness; TAC, transverse aortic constriction; TLR, Toll‐like receptor; WT, wild‐type.
TLR2 Mediates Inflammation in the Heart During Pressure Overload
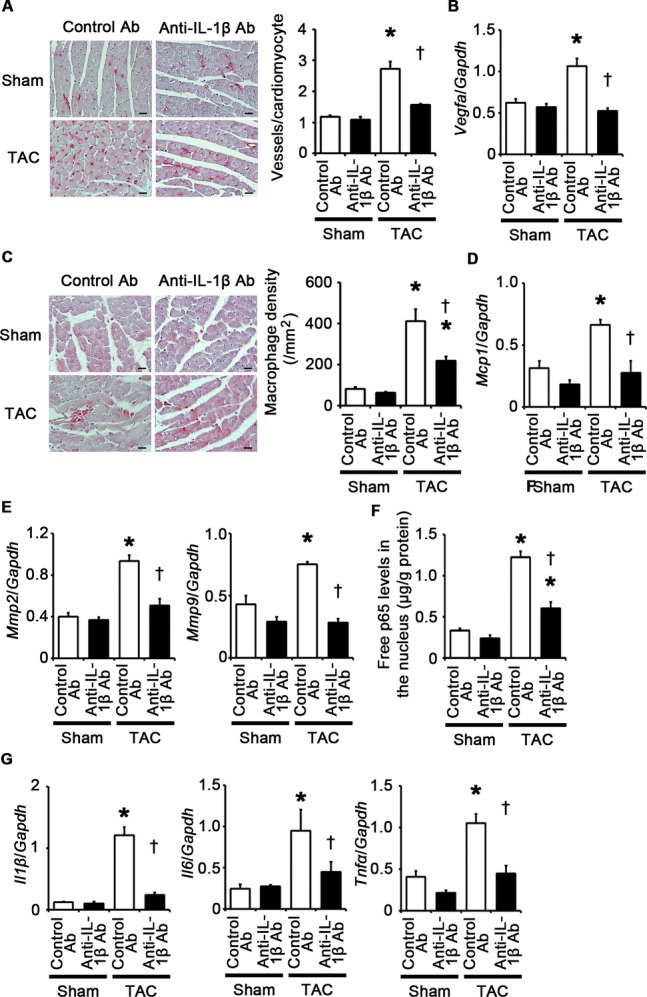
TLR2 signaling has been shown to induce proinflammatory cytokine expression via NF‐κB activation.5 We therefore measured NF‐κB activity and expression levels of proinflammatory cytokines such as IL‐1β, IL‐6, and TNF‐α in TAC‐operated Tlr2+/+ and Tlr2−/− hearts. At 2 weeks after the operation, NF‐κB activity and expression levels of proinflammatory cytokine genes were increased in TAC‐operated Tlr2+/+ hearts compared with sham‐operated Tlr2+/+ hearts (Figure 6A and 6B). Compared with TAC‐operated Tlr2+/+ hearts, TAC‐operated Tlr2−/− hearts showed reduced NF‐κB activity and gene expression of IL‐1β and TNF‐α, although the expression levels of IL‐6 mRNA were not significantly different between TAC‐operated Tlr2+/+ and Tlr2−/− hearts. Immunohistochemical analysis of the hearts showed increased infiltration of macrophages in both TAC‐operated Tlr2+/+ and Tlr2−/− hearts (Figure 6C). However, macrophage density in TAC‐operated Tlr2−/− hearts was smaller than that in TAC‐operated Tlr2+/+ hearts (Figure 6C), which was consistent with reduced mRNA expression levels of monocyte chemotactic protein‐1 in TAC‐operated Tlr2−/− hearts compared with those in TAC‐operated Tlr2+/+ hearts (Figure 6D). These results indicate that TLR2 is important for inflammatory responses in the heart during pressure overload.
Figure 6.
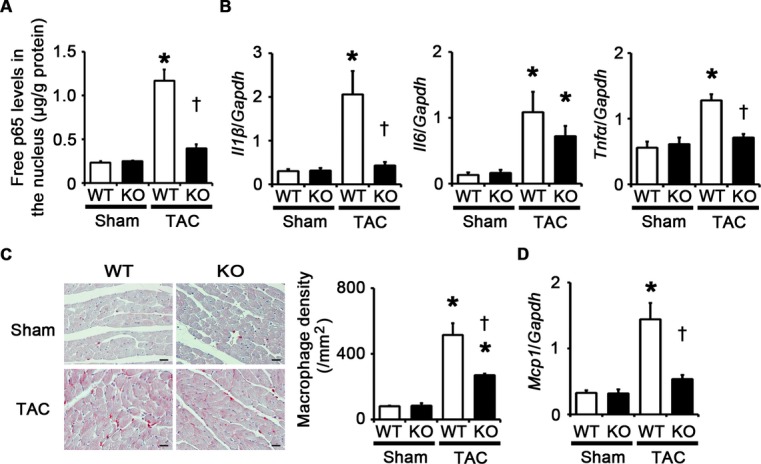
TLR2 is important for inflammatory responses in the heart during pressure overload. A through D, Mice were analyzed at 2 weeks after TAC or sham operation. A, NF‐κB activity in the heart (n=4). Free p65 levels in the nucleus were measured. Values were normalized to protein levels. B, mRNA expression levels of IL‐1β (Il1β), IL‐6 (Il6) and TNF‐α (Tnfα) in the heart (n=4). Expression levels of each gene were normalized to those of GAPDH (Gapdh). C, Macrophage infiltration. Macrophage density was assessed in heart sections with anti–Mac‐3 staining (n=4). Scale bars=20 μm. D, Monocyte chemotactic protein‐1 (Mcp1) mRNA expression (n=4). Expression levels of Mcp1 mRNA were normalized to those of GAPDH (Gapdh) mRNA. *P<0.05 vs sham; †P<0.05 vs Tlr2+/+ mice. IL indicates interleukin; GAPDH, glyceraldehyde‐3‐phosphate dehydrogenase; NF, nuclear factor; TAC, transverse aortic constriction; TLR, Toll‐like receptor; TNF, tumor necrosis factor; WT, wild‐type.
TLR2 Signaling Induces Cardiomyocyte Hypertrophy and Proliferation of Fibroblasts and Vascular Endothelial Cells Through NF‐κB Activation and IL‐1β Upregulation
The major cellular components in the heart include cardiomyocytes, fibroblasts, and vascular endothelial cells. Cardiomyocyte hypertrophy and proliferation of fibroblasts and vascular endothelial cells are important processes in cardiac adaptive response to pressure overload.3–4,23 To investigate the role of TLR2 signaling in these processes, we performed in vitro experiments by using isolated cardiomyocytes and fibroblasts and using HMVEC‐Cs. Pam3CSK4, a specific synthetic ligand for TLR2,21 induced cardiomyocyte hypertrophy (Figure 7A), which was supported by upregulation of atrial natriuretic factor and β‐myosin heavy chain mRNA expression levels (Figure 7B). Pam3CSK4 stimulation also induced fibroblast and vascular endothelial cell proliferation (Figure 7C and 7D). Expression levels of proinflammatory cytokine mRNAs were upregulated in these cells by Pam3CSK4 treatment (Figure 8A through 8C).
Figure 7.

TLR2 signaling induces cardiomyocyte hypertrophy and proliferation of fibroblasts and vascular endothelial cells via NF‐κB activation. A, Cell surface areas of cardiomyocytes after 48‐hour stimulation by Pam3CSK4, a specific synthetic ligand for TLR2, or control under treatment of an NF‐κB inhibitor, BAY 11‐7082 (BAY), or vehicle. Cell surface areas of 25 cardiomyocytes were measured in specimens with anti‐sarcomeric α‐actinin staining in each group. Scale bars=20 μm. B, Expression levels of atrial natriuretic factor (Anf) and β‐myosin heavy chain (β‐Mhc) in cardiomyocytes after 48‐hour stimulation by Pam3CSK4 or control under treatment of BAY 11‐7082 or vehicle. Three samples were obtained from cells cultured in 6‐well plates in each group. Expression levels of each gene were normalized to those of GAPDH (Gapdh). C and D, Proliferation of fibroblasts (C) and vascular endothelial cells (D) after 24‐hour stimulation by Pam3CSK4 or control under treatment of BAY 11‐7082 or vehicle. Cell proliferation was assessed by means of dimethylthiazol‐carboxymethoxyphenyl‐sulfophenyl‐tetrazolium assay and was expressed as the percentage of the absorbance to the well with cells treated by control and vehicle. Data were obtained from 9 independent experiments in fibroblasts and 5 independent experiments in vascular endothelial cells. *P<0.05 vs control; †P<0.05 vs vehicle. NF indicates nuclear factor; GAPDH, glyceraldehyde‐3‐phosphate dehydrogenase; TLR, Toll‐like receptor.
Figure 8.
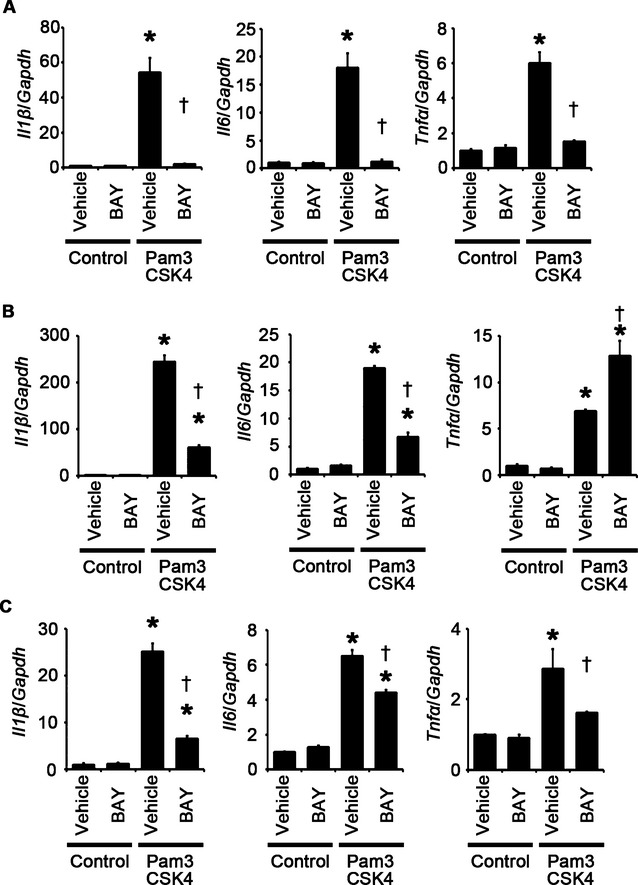
TLR2 signaling induces proinflammatory cytokine expression in cardiomyocytes, fibroblasts, and vascular endothelial cells via NF‐κB activation. A through C, Expression levels of IL‐1β (Il1β), IL‐6 (Il6), and TNF‐α (Tnfα) mRNAs in response to Pam3CSK4, a specific synthetic ligand for TLR2, under treatment of an NF‐κB inhibitor, BAY 11‐7082 (BAY), or vehicle were assessed after 48‐hour stimulation in cardiomyocytes (A) and after 24‐hour stimulation in cardiac fibroblasts (B) and vascular endothelial cells (C). Three samples were obtained from cells cultured in 6‐well plates in each group. Expression levels of each gene were normalized to those of GAPDH (Gapdh). *P<0.05 vs control; †P<0.05 vs vehicle. IL indicates interleukin; GAPDH, glyceraldehyde‐3‐phosphate dehydrogenase; NF, nuclear factor; TLR, Toll‐like receptor; TNF, tumor necrosis factor.
To investigate the causative roles of the proinflammatory signaling pathway in cellular responses to TLR2 stimulation, we first examined the impact of NF‐κB activation on these processes by using NF‐κB inhibitors such as BAY 11‐7082 and the NBD peptide.24–26 Inhibition of NF‐κB activity suppressed Pam3CSK4‐induced cardiomyocyte hypertrophy and proliferation of fibroblasts and vascular endothelial cells (Figures 7A through 7D and 9A through 9C). Expression levels of proinflammatory cytokine mRNAs were also suppressed by NF‐κB inhibitors in Pam3CSK4‐treated cardiomyocytes, fibroblasts, and vascular endothelial cells except for expression levels of TNF‐α mRNA in fibroblasts (Figures 8A through 8C and 9D through 9F). These results indicate that NF‐κB activation is important for cellular responses to TLR2 stimulation.
Figure 9.
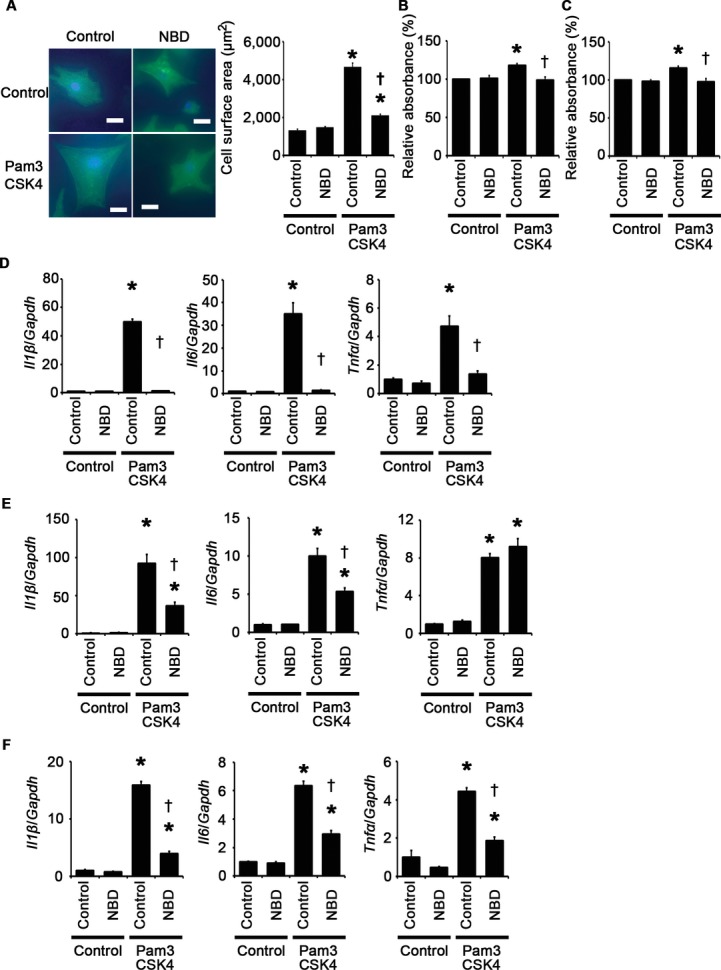
Impact of the NBD peptide on cellular responses to TLR2 signaling. A through F, Cellular responses to Pam3CSK4, a specific synthetic ligand for TLR2, under treatment of the NBD peptide or the control peptide were assessed after 48‐hour stimulation in cardiomyocytes (A and D) and after 24‐hour stimulation in cardiac fibroblasts (B and E) and vascular endothelial cells (C and F). A, Cell surface areas of cardiomyocytes. Cell surface areas of 25 cardiomyocytes were measured in specimens with anti‐sarcomeric α‐actinin staining in each group. Scale bars=20 μm. B and C, Proliferation of fibroblasts (B) and vascular endothelial cells (C). Cell proliferation was assessed by means of dimethylthiazol‐carboxymethoxyphenyl‐sulfophenyl‐tetrazolium assay and was expressed as the percentage of the absorbance to the well with cells treated by control and the control peptide. Data were obtained from 7 independent experiments in fibroblasts and 6 independent experiments in vascular endothelial cells. D through F, Expression levels of IL‐1β (Il1β), IL‐6 (Il6), and TNF‐α (Tnfα) mRNAs were measured in cardiomyocytes (D), cardiac fibroblasts (E), and vascular endothelial cells (F). Three samples were obtained from cells cultured in 6‐well plates in each group. Expression levels of each gene were normalized to those of GAPDH (Gapdh). *P<0.05 vs control; †P<0.05 vs the control peptide. IL indicates interleukin; GAPDH, glyceraldehyde‐3‐phosphate dehydrogenase; NBD, NEMO‐binding domain; NF, nuclear factor; TLR, Toll‐like receptor; TNF, tumor necrosis factor.
Next, we assessed the role of proinflammatory cytokines in cellular responses to TLR2 stimulation. We focused on IL‐1β because IL‐1β expression was consistently associated with cellular responses to TLR2 signaling in vitro and in vivo. Treatment with anti–IL‐1β antibodies suppressed Pam3CSK4‐induced cardiomyocyte hypertrophy and proliferation of fibroblasts and vascular endothelial cells (Figure 10A through 10D). Expression levels of IL‐1β mRNA were reduced by anti–IL‐1β antibodies in Pam3CSK4‐treated cells (Figure 11A through 11C). Expression levels of IL‐6 and TNF‐α mRNAs were also suppressed by IL‐1β neutralization in Pam3CSK4‐treated cells except for expression levels of TNF‐α mRNA in fibroblasts (Figure 11A through 11C). These results suggest that IL‐1β contributes to cellular responses to TLR2 signaling with a positive feedback regulation in cardiomyocytes, fibroblasts, and vascular endothelial cells.
Figure 10.
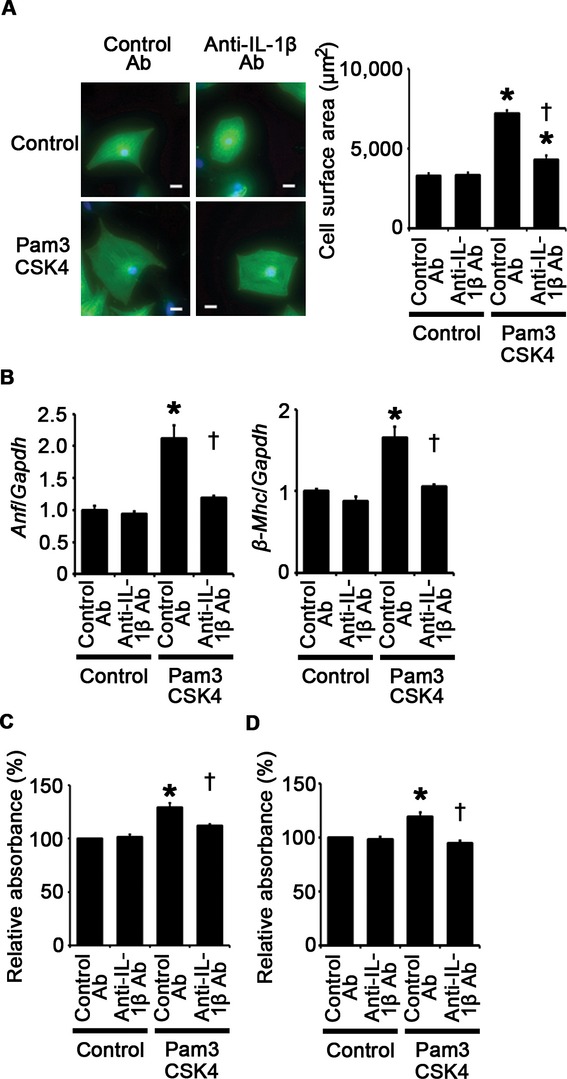
TLR2 signaling induces cardiomyocyte hypertrophy and proliferation of fibroblasts and vascular endothelial cells through IL‐1β upregulation. A, Cell surface area cardiomyocytes after 48‐hour stimulation by Pam3CSK4 or control under treatment of anti–IL‐1β antibodies (Ab) or control antibodies. Cell surface areas of 25 cardiomyocytes were measured in specimens with anti‐sarcomeric α‐actinin staining in each group. Scale bars=20 μm. B, Expression levels of atrial natriuretic factor (Anf) and β‐myosin heavy chain (β‐Mhc) in cardiomyocytes after 48‐hour stimulation by Pam3CSK4 or control under treatment of anti–IL‐1β antibodies or control antibodies. Three samples were obtained from cells cultured in 6‐well plates in each group. Expression levels of each gene were normalized to those of GAPDH (Gapdh). C and D, Proliferation of fibroblasts (C) and vascular endothelial cells (D) after 24‐hour stimulation by Pam3CSK4 or control under treatment of anti–IL‐1β antibodies or control antibodies. Cell proliferation was assessed by means of dimethylthiazol‐carboxymethoxyphenyl‐sulfophenyl‐tetrazolium assay and was expressed as the percentage of the absorbance to the well with cells treated by control and control antibodies. Data were obtained from 6 independent experiments in fibroblasts and 5 independent experiments in vascular endothelial cells. *P<0.05 vs control; †P<0.05 vs control antibodies. IL indicates interleukin; TLR, Toll‐like receptor.
Figure 11.
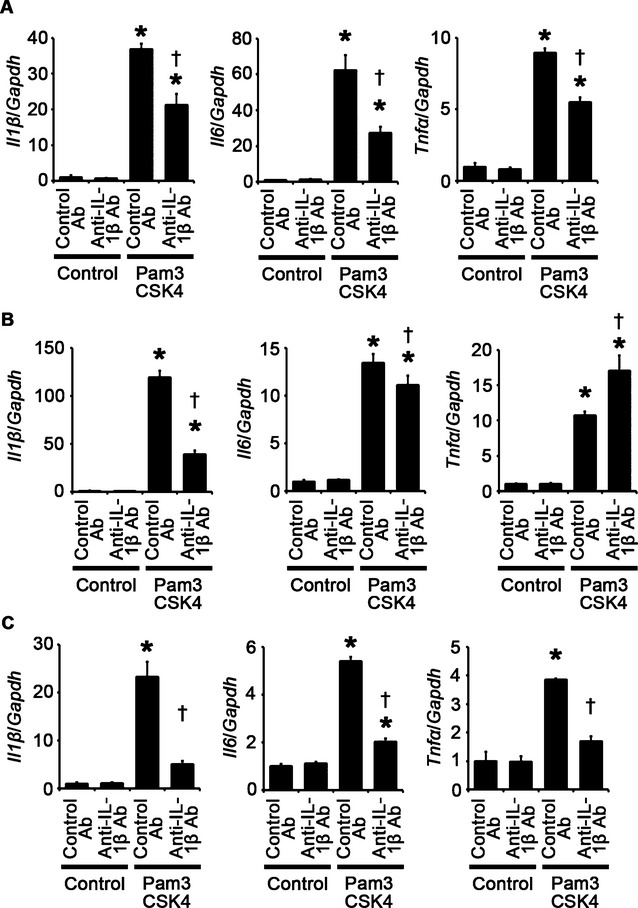
IL‐1β neutralization suppresses TLR2‐mediated proinflammatory cytokine expression in cardiomyocytes, fibroblasts, and vascular endothelial cells. A through C, Expression levels of IL‐1β (Il1β), IL‐6 (Il6), and TNF‐α (Tnfα) mRNAs in response to Pam3CSK4, a specific synthetic ligand for TLR2, under treatment of anti–IL‐1β antibodies (Ab) or control antibodies were assessed after 48‐hour stimulation in cardiomyocytes (A) and after 24‐hour stimulation in cardiac fibroblasts (B) and vascular endothelial cells (C). Three samples were obtained from cells cultured in 6‐well plates in each group. Expression levels of each gene were normalized to those of GAPDH (Gapdh). *P<0.05 vs control; †P<0.05 vs control antibodies. IL indicates interleukin; TLR, Toll‐like receptor; TNF, tumor necrosis factor.
We also performed IL‐6 and TNF‐α neutralization experiments by using anti–IL‐6 and anti–TNF‐α antibodies, respectively. We found that treatment with anti–IL‐6 antibodies resulted in suppression of cardiac fibroblast proliferation induced by Pam3CSK4, whereas Pam3CSK4‐induced cardiomyocyte hypertrophy and vascular endothelial cell proliferation were not affected by anti–IL‐6 neutralizing antibodies (Figure 12A through 12C). Anti–TNF‐α antibody treatment led to suppression of Pam3CSK4‐induced vascular endothelial cell proliferation, whereas this treatment did not suppress cardiomyocyte hypertrophy and cardiac fibroblast proliferation induced by Pam3CSK4 (Figure 12D through 12F). These results indicate that IL‐6 and TNF‐α may partly contribute to cellular responses to TLR2 signaling. However, as the expression levels of IL‐6 and TNF‐α were suppressed by IL‐1β neutralization, the effects of IL‐6 and TNF‐α may also be regulated by IL‐1β. Thus, IL‐1β may be the main proinflammatory cytokine that plays an essential role in cellular responses to TLR2 signaling.
Figure 12.
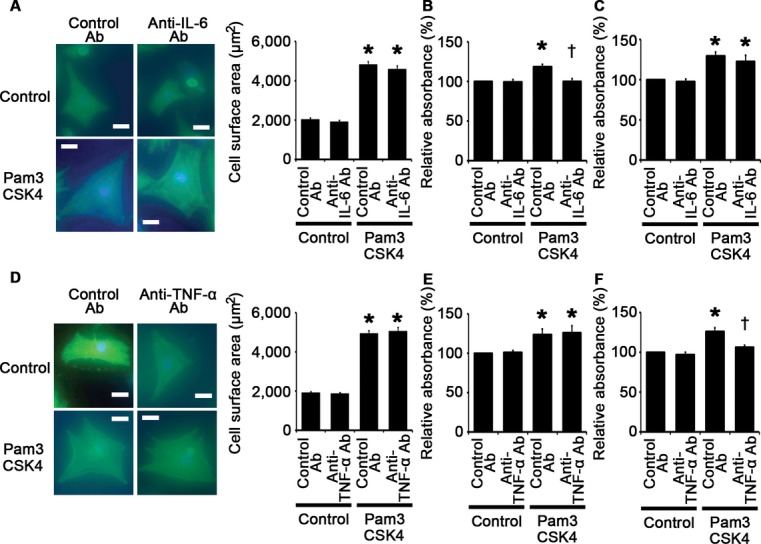
Role of IL‐6 and TNF‐α in cellular responses to TLR2 stimulation. A through C, Cellular responses to Pam3CSK4, a specific synthetic ligand for TLR2, under treatment of anti–IL‐6 antibodies (Ab) or control antibodies were assessed after 48‐hour stimulation in cardiomyocytes (A) and after 24‐hour stimulation in cardiac fibroblasts (B) and vascular endothelial cells (C). A, Cell surface areas of cardiomyocytes. Cell surface areas of 25 cardiomyocytes were measured in specimens with anti‐sarcomeric α‐actinin staining in each group. Scale bars=20 μm. B and C, Proliferation of fibroblasts (B) and vascular endothelial cells (C). Cell proliferation was assessed by means of dimethylthiazol‐carboxymethoxyphenyl‐sulfophenyl‐tetrazolium (MTS) assay and was expressed as the percentage of the absorbance to the well with cells treated by control and control antibodies. Data were obtained from 6 independent experiments in fibroblasts and 7 independent experiments in vascular endothelial cells. *P<0.05 vs control; †P<0.05 vs control antibodies. D through F, Cellular responses to Pam3CSK4, a specific synthetic ligand for TLR2, under treatment of anti–TNF‐α antibodies or control antibodies were assessed after 48‐hour stimulation in cardiomyocytes (D) and after 24‐hour stimulation in cardiac fibroblasts (E) and vascular endothelial cells (F). D, Cell surface areas of cardiomyocytes. Cell surface areas of 25 cardiomyocytes were measured in specimens with anti‐sarcomeric α‐actinin staining in each group. Scale bars=20 μm. E and F, Proliferation of fibroblasts (E) and vascular endothelial cells (F). Cell proliferation was assessed by means of MTS assay and was expressed as the percentage of the absorbance to the well with cells treated by control and control antibodies. Data were obtained from 4 independent experiments in fibroblasts and 6 independent experiments in vascular endothelial cells. *P<0.05 vs control; †P<0.05 vs control antibodies. IL indicates interleukin; TLR, Toll‐like receptor; TNF, tumor necrosis factor.
NF‐κB Activation and IL‐1β Upregulation Contribute to Adaptive Cardiac Hypertrophy in Response to Pressure Overload
Having established that NF‐κB and IL‐1β play an important role in cellular responses to TLR2 signaling, we examined the role of NF‐κB and IL‐1β in pressure overload–induced cardiac hypertrophy. First, we injected an NF‐κB inhibitor, BAY 11‐7082, to wild‐type mice subjected to TAC. NF‐κB activity was effectively suppressed by BAY 11‐7082 administration in TAC‐operated hearts (Figure 13A). All TAC‐operated and sham‐operated mice survived until 2 weeks after the operation (n=7 for each group). Inhibition of NF‐κB activity resulted in attenuated cardiac hypertrophy and interstitial fibrosis with greater ventricular dilatation, reduced ejection fraction, higher LVEDP, and lower maximum dP/dt after 2 weeks of TAC compared with vehicle treatment (Figures 13B through 13E and 14A through 14D). NF‐κB inhibition also suppressed angiogenesis, macrophage infiltration, and matrix metalloproteinase expression in TAC‐operated hearts (Figure 15A through 15E). Gene expression levels of proinflammatory cytokines were reduced by NF‐κB inhibition in TAC‐operated hearts (Figure 15F). These results indicate that NF‐κB activation contributes to cardiac adaptive response to pressure overload.
Figure 13.
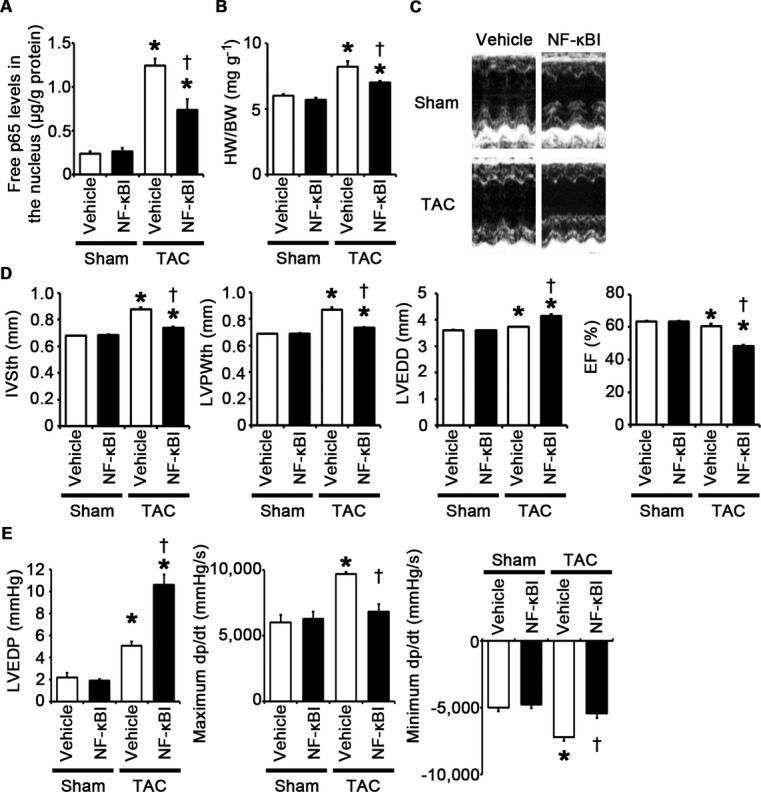
NF‐κB activation is important for adaptive cardiac hypertrophy in response to pressure overload. A through E, Mice were analyzed at 2 weeks after TAC or sham operation under treatment of an NF‐κB inhibitor (NF‐κBI) or vehicle. A, NF‐κB activity in the heart (n=3). Free p65 levels in the nucleus were measured. Values were normalized to protein levels. B, Heart weight (HW)–to–body weight (BW) ratios (n=7). C, Echocardiographic images. D, Echocardiographic parameters (n=7). E, Hemodynamic data (n=5 to 6). *P<0.05 vs sham; †P<0.05 vs vehicle. EF indicates ejection fraction; IVSth, interventricular septum thickness; LVEDD, left ventricular end‐diastolic diameter; LVEDP, left ventricular end‐diastolic pressure; LVPWth, left ventricular posterior wall thickness; NF, nuclear factor; TAC, transverse aortic constriction.
Figure 14.
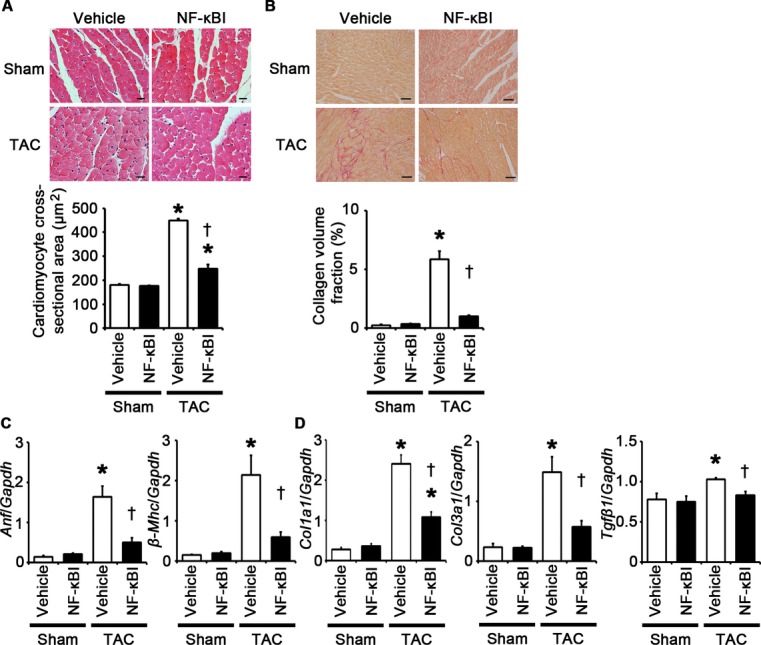
NF‐κB inhibition attenuates cardiomyocyte hypertrophy and interstitial fibrosis at 2 weeks after TAC. A through D, Mice were analyzed at 2 weeks after TAC or sham operation under treatment of an NF‐κB inhibitor (NF‐κBI) or vehicle. A, Hematoxylin and eosin–stained heart sections. Cardiomyocyte cross‐sectional area was measured in 20 cardiomyocytes (n=3). Scale bars=20 μm. B, Sirius Red–stained heart sections. Collagen volume fraction was calculated in 5 random fields (n=3). Scale bars=50 μm. C, Expression of hypertrophic marker genes. Expression levels of atrial natriuretic factor (Anf) and β‐myosin heavy chain (β‐Mhc) mRNAs were measured (n=3). D, Expression of fibrosis‐related genes. Expression levels of collagen type 1 α1 (Col1a1), collagen type 3 α1 (Col3a1), and transforming growth factor‐β1 (Tgfβ1) mRNAs were measured (n=3). Expression levels of each gene were normalized to those of GAPDH (Gapdh). *P<0.05 vs sham; †P<0.05 vs vehicle. NF indicates nuclear factor; GAPDH, glyceraldehyde‐3‐phosphate dehydrogenase; TAC, transverse aortic constriction.
Figure 15.
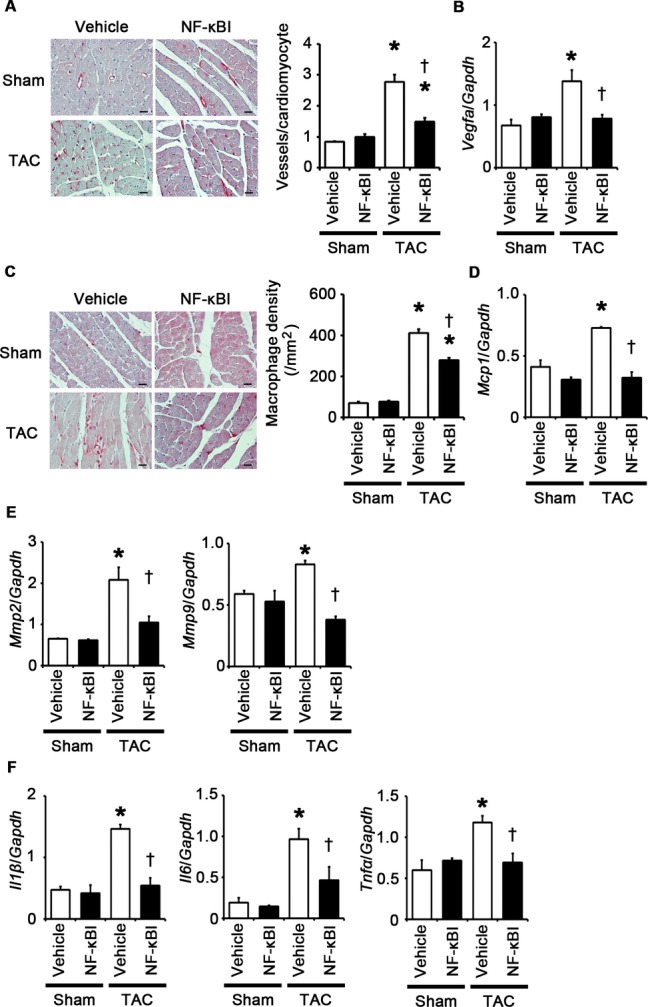
NF‐κB inhibition suppresses angiogenesis, macrophage infiltration, and expression of matrix metalloproteinases and proinflammatory cytokines at 2 weeks after TAC. A through F, Mice were analyzed at 2 weeks after TAC or sham operation under treatment of an NF‐κB inhibitor (NF‐κBI) or vehicle. A, Immunohistochemistry using antibodies to CD31. The number of vessels per cardiomyocyte was counted in 50 cardiomyocytes (n=3). Scale bars=20 μm. B, Expression levels of vascular endothelial growth factor A (Vegfa) mRNA (n=3). C, Macrophage infiltration. Macrophage density was assessed in heart sections with anti–Mac‐3 staining (n=3). Scale bars=20 μm. D, Expression levels of monocyte chemotactic protein‐1 (Mcp1) mRNA (n=3). E, mRNA expression of matrix metalloproteinases 2 (Mmp2) and 9 (Mmp9) (n=3). F, mRNA expression levels of IL‐1β (Il1β), IL‐6 (Il6), and TNF‐α (Tnfα) in the heart (n=3). Expression levels of each gene were normalized to those of GAPDH (Gapdh). *P<0.05 vs sham; †P<0.05 vs vehicle. IL indicates interleukin; GAPDH, glyceraldehyde‐3‐phosphate dehydrogenase; NF, nuclear factor; TAC, transverse aortic constriction; TNF, tumor necrosis factor.
Next, to examine the impact of IL‐1β upregulation on pressure overload–induced cardiac hypertrophy, we administered anti–IL‐1β antibodies to wild‐type mice subjected to TAC. The survival rate at 2 weeks after TAC was 100% (7/7) in wild‐type mice treated with control antibodies and 77.8% (7/9) in wild‐type mice treated with anti–IL‐1β antibodies (P=NS), whereas all sham‐operated mice survived until 2 weeks after the operation (n=7 for each group). Neutralization of IL‐1β suppressed cardiac hypertrophy and interstitial fibrosis but led to greater ventricular dilatation and reduced systolic function with higher LVEDP after 2 weeks of TAC compared with treatment with control antibodies (Figures 16A through 16D and 17A through 17D). IL‐1β neutralization also inhibited angiogenesis, macrophage infiltration, and matrix metalloproteinase expression in TAC‐operated hearts (Figure 18A through 18E). NF‐κB activity and the expression levels of IL‐1β mRNA in TAC‐operated hearts were reduced by treatment with anti–IL‐1β antibodies (Figure 18F and 18G). Expression levels of IL‐6 and TNF‐α mRNAs were also suppressed by IL‐1β neutralization in TAC‐operated hearts (Figure 18G). These results indicate that IL‐1β plays a pivotal role in cardiac adaptive response to pressure overload. In addition, our results suggest that NF‐κB activity and IL‐1β expressions are regulated by a positive feedback loop in vivo.
Figure 16.
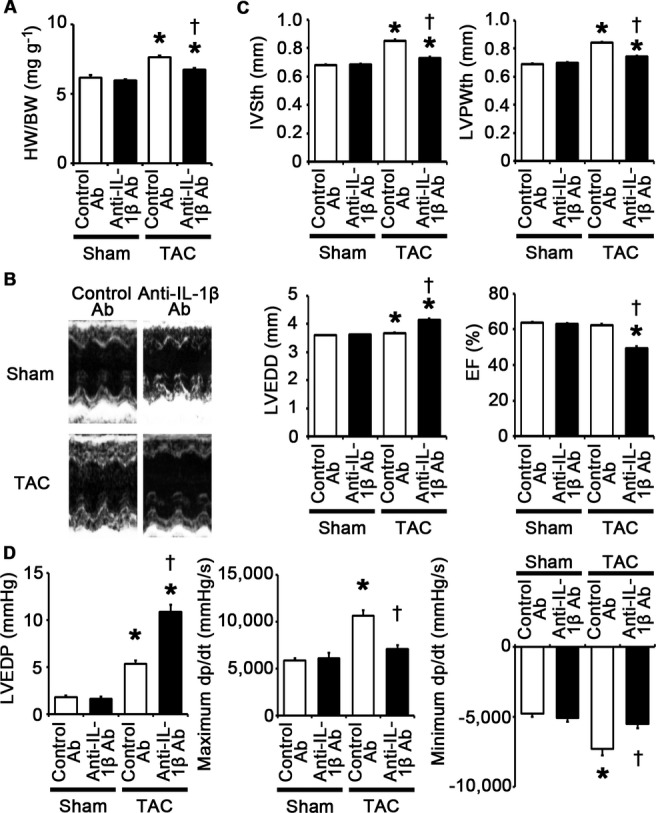
IL‐1β plays a pivotal role in adaptive cardiac hypertrophy in response to pressure overload. A through D, Mice were analyzed at 2 weeks after TAC or sham operation under treatment of anti–IL‐1β antibodies (Ab) or control antibodies. A, Heart weight (HW)–to–body weight (BW) ratios (n=7). B, Echocardiographic images. C, Echocardiographic parameters (n=7). D, Hemodynamic data (n=5). *P<0.05 vs sham; †P<0.05 vs control antibodies. EF indicates ejection fraction; IL, interleukin; IVSth, interventricular septum thickness; LVEDD, left ventricular end‐diastolic diameter; LVEDP, left ventricular end‐diastolic pressure; LVPWth, left ventricular posterior wall thickness; TAC, transverse aortic constriction.
Figure 17.
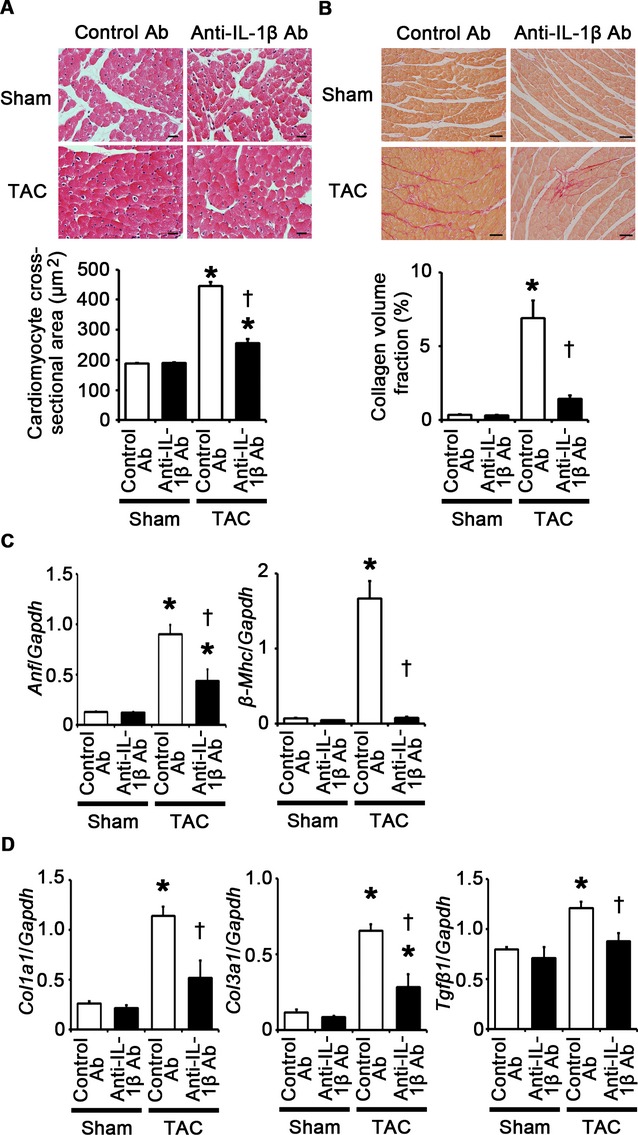
IL‐1β neutralization attenuates cardiomyocyte hypertrophy and interstitial fibrosis at 2 weeks after TAC. A through D, Mice were analyzed at 2 weeks after TAC or sham operation under treatment of anti–IL‐1β antibodies (Ab) or control antibodies. A, Hematoxylin and eosin–stained heart sections. Cardiomyocyte cross‐sectional area was measured in 20 cardiomyocytes (n=3). Scale bars=20 μm. B, Sirius Red–stained heart sections. Collagen volume fraction was calculated in 5 random fields (n=3). Scale bars=50 μm. C, Expression of hypertrophic marker genes. Expression levels of atrial natriuretic factor (Anf) and β‐myosin heavy chain (β‐Mhc) mRNAs were measured (n=3). D, Expression of fibrosis‐related genes. Expression levels of collagen type 1 α1 (Col1a1), collagen type 3 α1 (Col3a1), and transforming growth factor‐β1 (Tgfβ1) mRNAs were measured (n=3). Expression levels of each gene were normalized to those of GAPDH (Gapdh). *P<0.05 vs sham; †P<0.05 vs control antibodies. IL indicates interleukin; GAPDH, glyceraldehyde‐3‐phosphate dehydrogenase; TAC, transverse aortic constriction.
Figure 18.
IL‐1β neutralization suppresses angiogenesis, inflammatory responses and expression of matrix metalloproteinases in the heart at 2 weeks after TAC. A through G, Mice were analyzed at 2 weeks after TAC or sham operation under treatment of anti‐IL‐1β antibodies (Ab) or control antibodies. A, Immunohistochemistry using antibodies to CD31. The number of vessels per cardiomyocyte was measured in 50 cardiomyocytes (n=3). Scale bars=20 μm. B, Expression levels of vascular endothelial growth factor A (Vegfa) mRNA (n=3). C, Macrophage infiltration. Macrophage density was assessed in heart sections with anti–Mac‐3 staining (n=3). Scale bars=20 μm. D, Expression levels of monocyte chemotactic protein‐1 (Mcp1) mRNA (n=3). E, mRNA expression of matrix metalloproteinases 2 (Mmp2) and 9 (Mmp9) (n=3). F, NF‐κB activity in the heart (n=3). Free p65 levels in the nucleus were measured. Values were normalized to protein levels. G, mRNA expression levels of IL‐1β (Il1β), IL‐6 (Il6), and TNF‐α (Tnfα) in the heart (n=3). Expression levels of each gene were normalized to those of GAPDH (Gapdh). *P<0.05 vs sham; †P<0.05 vs control antibodies. IL indicates interleukin; GAPDH, glyceraldehyde‐3‐phosphate dehydrogenase; TAC, transverse aortic constriction; TNF, transforming growth factor.
TLR2/IL‐1β Signaling Is Important for Activation of the IGF‐1/Akt Pathway in the Heart During Pressure Overload
It has been reported that Akt activation plays an important role in adaptive cardiac hypertrophy.27 Thus, we assessed phosphorylation levels of Akt in the heart tissue during pressure overload. We observed higher phosphorylation levels of Akt in TAC‐operated Tlr2+/+ hearts than those in sham‐operated Tlr2+/+ hearts (Figure 19A). In TAC‐operated Tlr2−/− hearts, phosphorylation of Akt was suppressed compared with that in TAC‐operated Tlr2+/+ hearts (Figure 19A). We also found that treatment of anti–IL‐1β antibodies resulted in suppressed phosphorylation levels of Akt in the heart tissues of wild‐type mice after TAC (Figure 19B). Collectively, these results suggest that TLR2/IL‐1β signaling may be important for Akt activation in the heart during pressure overload.
Figure 19.

TLR2/IL‐1β signaling is important for activation of the IGF‐1/Akt pathway in the heart during pressure overload. A and B, Phosphorylation levels of Akt1 in the heart at 2 weeks after TAC or sham operation in Tlr2+/+ and Tlr2−/− mice (A) or in mice under treatment of anti–IL‐1β antibodies (Ab) and control antibodies (B) (n=4). Western blot analysis was performed. The relative expression levels of phospho‐Akt‐1 were measured by densitometric analysis. C and D, mRNA expression levels of IGF‐1 (Igf‐1) in the heart at 2 weeks after TAC or sham operation in Tlr2+/+ and Tlr2−/− mice (C) or in mice under treatment of anti‐IL‐1β antibodies and control antibodies (D) (n=4). Expression levels of each gene were normalized to those of GAPDH (Gapdh). *P<0.05 vs sham; †P<0.05 vs Tlr2+/+ mice or control antibodies. IGF indicates insulin‐like growth factor; GAPDH, glyceraldehyde‐3‐phosphate dehydrogenase; IL, interleukin; TAC, transverse aortic constriction; TLR, Toll‐like receptor; WT, wild‐type.
It was reported that IL‐1β induces insulin‐like growth factor‐1 (IGF‐1) expression.13 IGF‐1 has been shown to activate the phosphatidylinositol 3‐kinase/Akt cascade and contribute to adaptive cardiac hypertrophy in response to pressure overload.20 Thus, we examined the expression levels of IGF‐1 in the heart after TAC. In wild‐type mice, expression levels of IGF‐1 mRNA in the heart were upregulated after TAC (Figure 19C and 19D). However, genetic disruption of TLR2 or treatment with anti–IL‐1β antibodies suppressed IGF‐1 mRNA expression in the heart after TAC (Figure 19C and 19D). These results suggest that TLR2/IL‐1β signaling may activate the phosphatidylinositol 3‐kinase/Akt cascade, possibly in part, through IGF‐1 upregulation, which induces adaptive cardiac hypertrophy during pressure overload.
Extracellular HSP70 Activates TLR2 Signaling and Induces Cardiomyocyte Hypertrophy and Proliferation of Fibroblasts and Vascular Endothelial Cells
Endogenous DAMP molecules are released from the cells via necrosis or active transport under pathological stimuli.5–6 HSP70 is one of DAMP molecules and is released immediately after stimulation from viable cells.28–29 Whereas intracellular HSP70 functions as a chaperone protein involved with protein folding and transport,30–31 it was reported that extracellular HSP70 can induce inflammatory responses via TLRs.28,32 We found that HSP70 concentrations in plasma were increased in TAC‐operated mice compared with those in sham‐operated mice (Figure 20A). In addition, oxidative stress, which is induced in the heart during pressure overload,33 stimulated extracellular secretion of HSP70 in cardiomyocytes, fibroblasts, and vascular endothelial cells (Figure 20B through 20D). Thus, we hypothesized that HSP70 released from the heart tissue may be involved in activation of TLR2 signaling pathway during pressure overload and contribute to adaptive cardiac hypertrophy.
Figure 20.
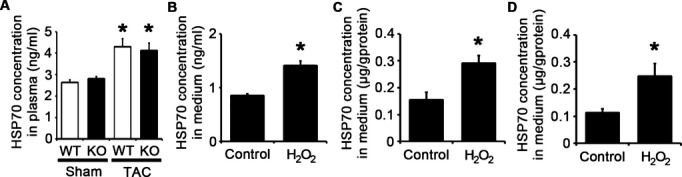
HSP70 is extracellularly released under pathological stimuli in vitro and in vivo. A, HSP70 concentration in murine plasma at 2 weeks after TAC or sham operation (n=4). WT, Tlr2+/+ mice; KO, Tlr2−/− mice. *P<0.05 vs sham. B through D, HSP70 levels in the media of cardiomyocytes (B), cardiac fibroblasts (C) and vascular endothelial cells (D) after 24‐hour exposure to 30 μmol/L hydrogen peroxide (H2O2) or distilled water (control) (n=3). HSP70 levels in the media of cardiac fibroblasts and vascular endothelial cells were normalized to protein levels. *P<0.05 vs control. HSP indicates heat shock protein; GAPDH, glyceraldehyde‐3‐phosphate dehydrogenase; TAC, transverse aortic constriction; WT, wild‐type.
To investigate the effects of extracellular HSP70 on cardiomyocytes, fibroblasts, and vascular endothelial cells, we stimulated these cells with human recombinant HSP70. Human recombinant HSP70 induced cardiomyocyte hypertrophy and fibroblast and vascular endothelial cell proliferation, which was suppressed by treatment with anti‐TLR2 antibodies (Figure 21A through 21D). Expression levels of proinflammatory cytokine mRNAs in these cells were increased by treatment with human recombinant HSP70 except for IL‐6 mRNA expression in cardiomyocytes and TNF‐α mRNA expression in vascular endothelial cells (Figure 22A through 22C). However, treatment of anti‐TLR2 antibodies suppressed upregulation of proinflammatory cytokine mRNAs in HSP70‐treated cells (Figure 22A through 22C). These results indicate that HSP70 can activate TLR2 signaling pathway in cardiomyocytes, fibroblasts, and vascular endothelial cells and induce cellular responses observed in cardiac hypertrophy.
Figure 21.
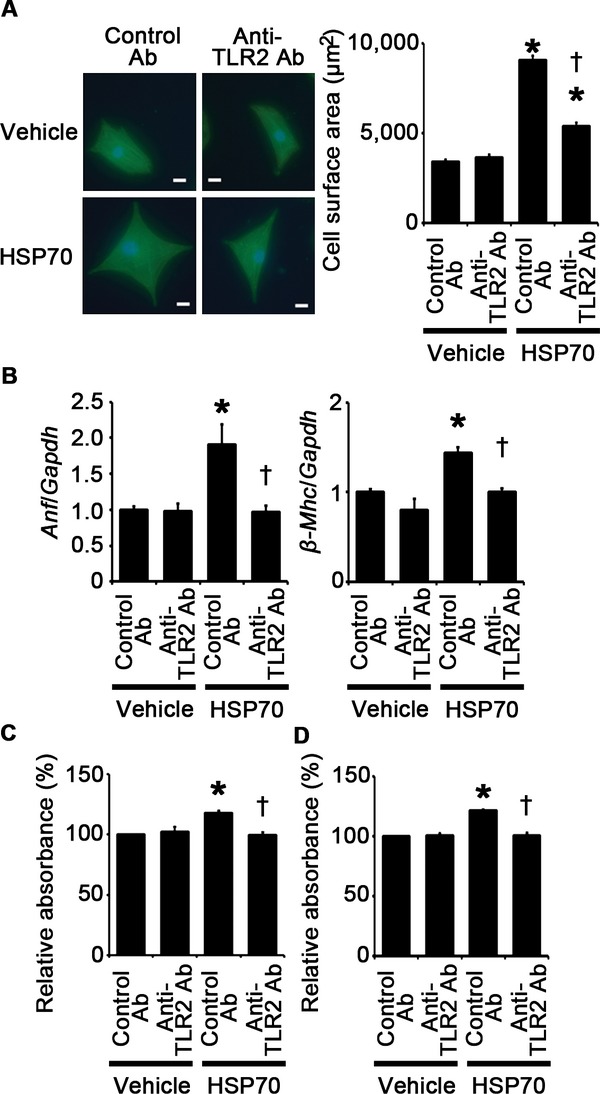
HSP70 can induce cardiomyocyte hypertrophy and proliferation of fibroblasts and vascular endothelial cells via TLR2. A, Cell surface areas of cardiomyocytes after 48‐hour stimulation by human recombinant HSP70 or vehicle under treatment of anti–TLR2 antibodies (Ab) or control antibodies. Cell surface areas of 25 cardiomyocytes were measured in specimens with anti‐sarcomeric α‐actinin staining in each group. Scale bars=20 μm. B, Expression levels of atrial natriuretic factor (Anf) and β‐myosin heavy chain (β‐Mhc) in cardiomyocytes after 48‐hour stimulation by human recombinant HSP70 or vehicle under treatment of anti‐TLR2 antibodies or control antibodies. Three samples were obtained from cells cultured in 6‐well plates in each group. Expression levels of each gene were normalized to those of GAPDH (Gapdh). C and D, Proliferation of fibroblasts (C) and vascular endothelial cells (D) after 24‐hour stimulation by human recombinant HSP70 or vehicle under treatment of anti‐TLR2 antibodies or control antibodies. Cell proliferation was assessed by means of dimethylthiazol‐carboxymethoxyphenyl‐sulfophenyl‐tetrazolium assay and was expressed as the percentage of the absorbance to the well with cells treated by vehicle and control antibodies. Data were obtained from 5 independent experiments. *P<0.05 vs vehicle; †P<0.05 vs control antibodies. HSP indicates heat shock protein; GAPDH, glyceraldehyde‐3‐phosphate dehydrogenase; TLR, Toll‐like receptor.
Figure 22.
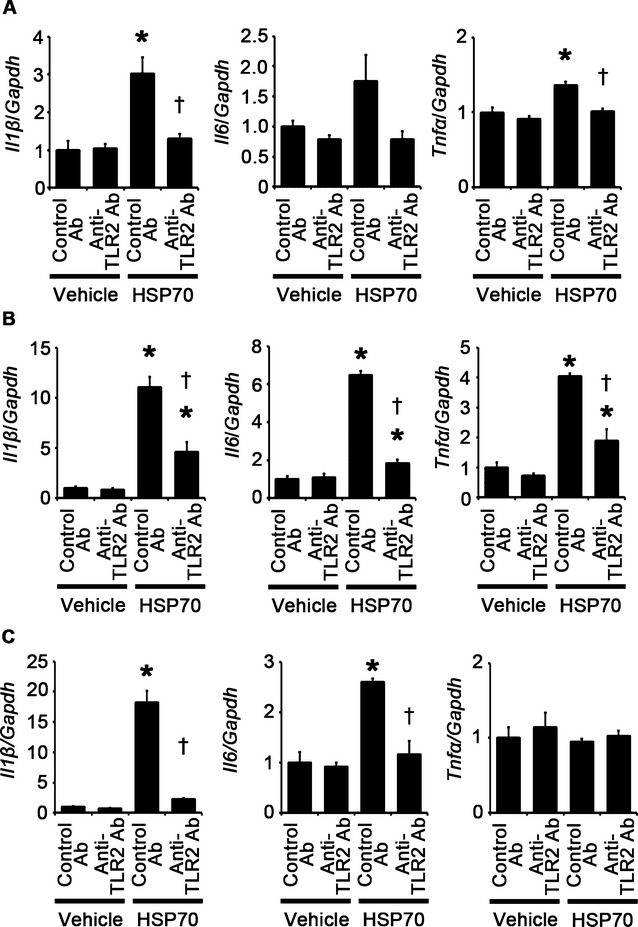
HSP70 can induce proinflammatory cytokine expression in cardiomyocytes, fibroblasts, and vascular endothelial cells via TLR2. A through C, Expression levels of IL‐1β (Il1β), IL‐6 (Il6) and TNF‐α (Tnfα) mRNAs in response to HSP70 under treatment of anti‐TLR2 antibodies (Ab) or control antibodies were assessed after 48‐hour stimulation in cardiomyocytes (A) and after 24‐hour stimulation in cardiac fibroblasts (B) and vascular endothelial cells (C). Three samples were obtained from cells cultured in 6‐well plates in each group. Expression levels of each gene were normalized to those of GAPDH (Gapdh). *P<0.05 vs vehicle; †P<0.05 vs control antibodies. HSP indicates heat shock protein; IL, interleukin; TLR, Toll‐like receptor; GAPDH, glyceraldehyde‐3‐phosphate dehydrogenase; TNF, tumor necrosis factor.
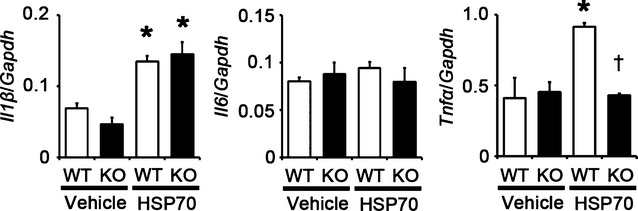
To examine the effects of extracellular HSP70 in vivo, we injected human recombinant HSP70 to Tlr2+/+ and Tlr2−/− mice. At 24 hours after the administration, NF‐κB activity and mRNA expression levels of proinflammatory cytokines except for IL‐6 were increased in Tlr2+/+ hearts but not in Tlr2−/− hearts (Figure 23A and 23B), indicating that extracellular HSP70 induces inflammatory responses in the heart tissue via TLR2.
Figure 23.

HSP70 can activate TLR2 signaling in vivo. A and B, NF‐κB activity (A) and gene expression levels of IL‐1β (Il1β), IL‐6 (Il6), and TNF‐α (Tnfα) (B) at 24 hours after intravenous injection of human recombinant HSP70 or vehicle in Tlr2+/+ and Tlr2−/− hearts (n=3). Free p65 levels in the nucleus were normalized to protein levels. Expression levels of each gene were normalized to those of GAPDH (Gapdh). WT, Tlr2+/+ mice; KO, Tlr2−/− mice. *P<0.05 vs vehicle; †P<0.05 vs Tlr2+/+ mice. HSP indicates heat shock protein; IL, interleukin; GAPDH, glyceraldehyde‐3‐phosphate dehydrogenase; NF, nuclear factor; TLR, Toll‐like receptor; TNF, tumor necrosis factor; WT, wild‐type.
Because it was reported that HSP70 can also activate TLR4 signaling,6 we examined the contribution of TLR4 in HSP70‐induced inflammation in the heart. When we injected human recombinant HSP70 to Tlr4+/+ and Tlr4−/− mice, expression levels of IL‐1β and IL‐6 mRNAs did not differ between Tlr4+/+ and Tlr4−/− mice, whereas expression levels of TNF‐α mRNA were suppressed in Tlr4−/− mice compared with Tlr4+/+ mice (Figure 24). Our findings indicate that HSP70‐induced IL‐1β upregulation is mediated by TLR2, but not by TLR4, whereas the TLR2 and the TLR4 signaling pathways exert synergistic regulation of HSP70‐induced TNF‐α expression. Because our IL‐1β neutralization experiments suggested that IL‐1β regulates TNF‐α expression, TLR2 signaling may be the main signaling pathway in HSP70‐induced inflammation in the heart.
Figure 24.
Impact of extracellular HSP70 on TLR4 signaling in vivo. Gene expression levels of IL‐1β (Il1β), IL‐6 (Il6), and TNF‐α (Tnfα) at 24 hours after intravenous injection of human recombinant HSP70 or vehicle in Tlr4+/+ and Tlr4−/− hearts (n=4). Expression levels of each gene were normalized to those of GAPDH (Gapdh). WT, Tlr4+/+ mice; KO, Tlr4−/− mice. *P<0.05 vs vehicle; †P<0.05 vs Tlr4+/+ mice. HSP indicates heat shock protein; IL, interleukin; GAPDH, glyceraldehyde‐3‐phosphate dehydrogenase; TLR, Toll‐like receptor; TNF, tumor necrosis factor; WT, wild‐type.
Extracellular HSP70 Contributes to Adaptive Cardiac Hypertrophy in Response to Pressure Overload
To investigate the role of extracellular HSP70 in pressure overload–induced cardiac hypertrophy, we administered anti‐HSP70 antibodies to wild‐type mice subjected to TAC. The survival rate at 2 weeks after TAC was 100% (7/7) in wild‐type mice treated with control antibodies and 87.5% (7/8) in wild‐type mice treated with anti‐HSP70 antibodies (P=NS), whereas all sham‐operated mice survived until 2 weeks after the operation (n=7 for each group). This treatment resulted in attenuated cardiac hypertrophy and interstitial fibrosis with more LV dilatation, reduced ejection fraction, higher LVEDP, and smaller maximum dP/dt compared with treatment with control antibodies after 2 weeks of TAC (Figures 25A through 25D and 26A through 26D). Angiogenesis, macrophage infiltration, and matrix metalloproteinase expression were reduced by anti‐HSP70 antibodies in TAC‐operated hearts (Figure 27A through 27E). HSP70 neutralization suppressed NF‐κB activation and upregulation of proinflammatory cytokine mRNAs during pressure overload (Figure 27F and 27G). These results indicate that extracellular HSP70 is involved in noninfectious inflammation in the heart during pressure overload and contributes to adaptive cardiac hypertrophy.
Figure 25.
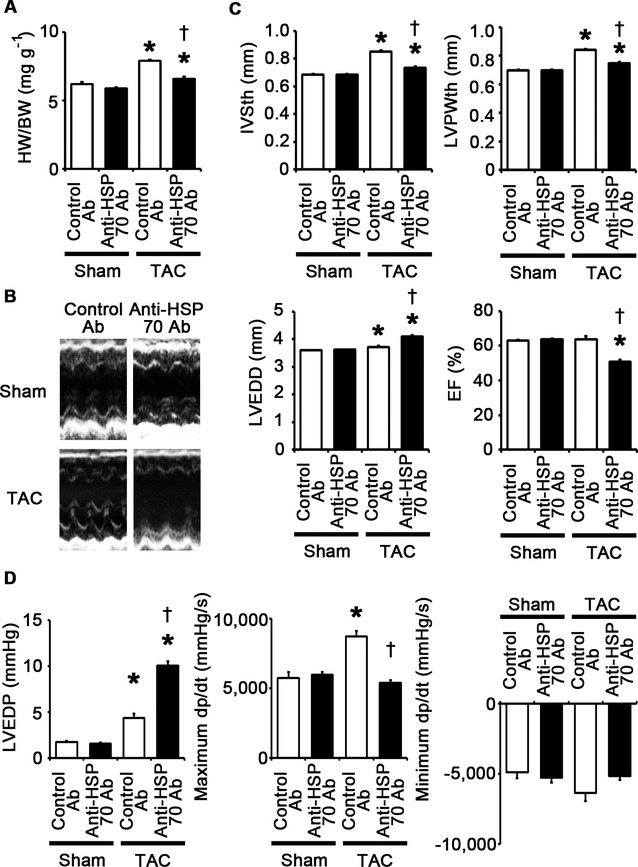
Extracellular HSP70 is critically involved in adaptive cardiac hypertrophy. A through D, Mice were analyzed at 2 weeks after TAC or sham operation under treatment of anti‐HSP70 antibodies (Ab) or control antibodies. A, Heart weight (HW)–to–body weight (BW) ratios (n=7). B, Echocardiographic images. C, Echocardiographic parameters (n=7). D, Hemodynamic data (n=5 to 6). *P<0.05 vs sham; †P<0.05 vs control antibodies. EF indicates ejection fraction; HSP, heat shock protein; IVSth, interventricular septum thickness; LVEDD, left ventricular end‐diastolic diameter; LVEDP, left ventricular end‐diastolic pressure; LVPWth, left ventricular posterior wall thickness; TAC, transverse aortic constriction.
Figure 26.
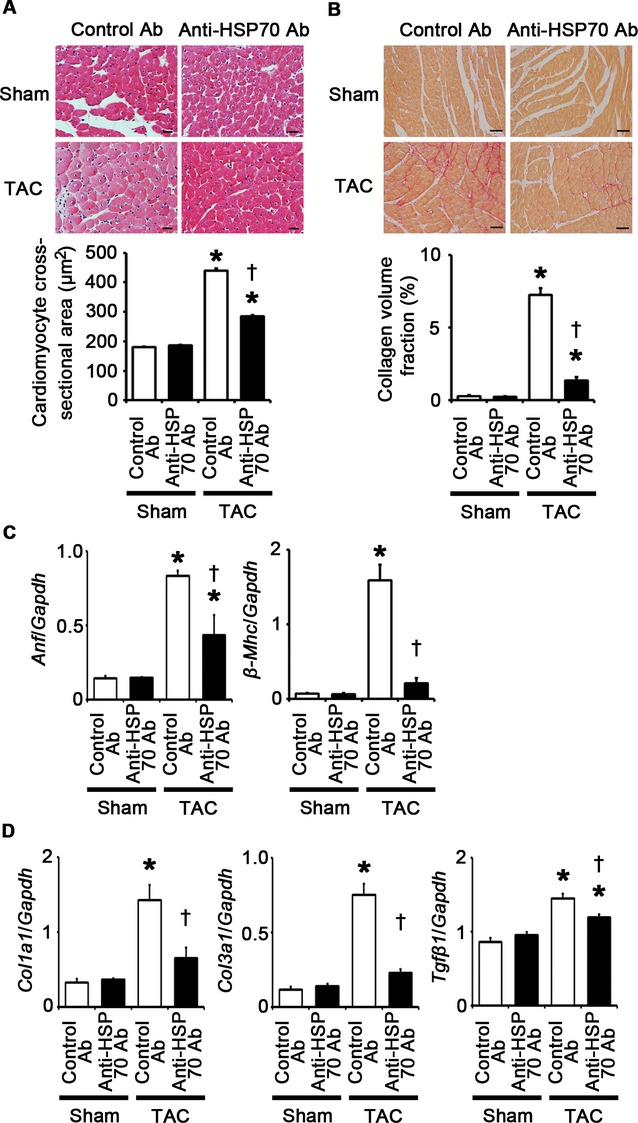
HSP70 neutralization attenuates cardiomyocyte hypertrophy and interstitial fibrosis at 2 weeks after TAC. A through D, Mice were analyzed at 2 weeks after TAC or sham operation under treatment of anti‐HSP70 antibodies (Ab) or control antibodies. A, Hematoxylin and eosin–stained heart sections. Cardiomyocyte cross‐sectional area was measured in 20 cardiomyocytes (n=3). Scale bars=20 μm. B, Sirius Red–stained heart sections. Collagen volume fraction was calculated in 5 random fields (n=3). Scale bars=50 μm. C, Expression of hypertrophic marker genes. Expression levels of atrial natriuretic factor (Anf) and β‐myosin heavy chain (β‐Mhc) mRNAs were measured (n=3). D, Expression of fibrosis‐related genes. Expression levels of collagen type 1 α1 (Col1a1), collagen type 3 α1 (Col3a1), and transforming growth factor‐β1 (Tgfβ1) mRNAs were measured (n=3). Expression levels of each gene were normalized to those of GAPDH (Gapdh). *P<0.05 vs sham; †P<0.05 vs control antibodies. HSP indicates heat shock protein; GAPDH, glyceraldehyde‐3‐phosphate dehydrogenase; TAC, transverse aortic constriction.
Figure 27.
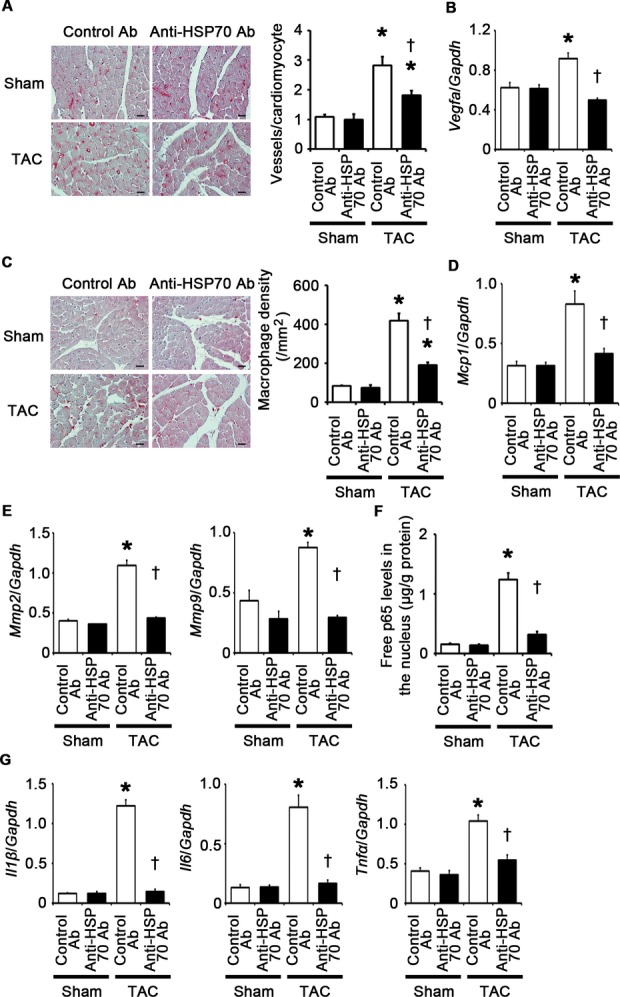
HSP70 neutralization suppresses angiogenesis, inflammatory responses, and expression of matrix metalloproteinases in the heart at 2 weeks after TAC. A through G, Mice were analyzed at 2 weeks after TAC or sham operation under treatment of anti‐HSP70 antibodies (Ab) or control antibodies. A, Immunohistochemistry using antibodies to CD31. The number of vessels per cardiomyocyte was measured in 50 cardiomyocytes (n=3). Scale bars=20 μm. B, Expression levels of vascular endothelial growth factor A (Vegfa) mRNA (n=3). C, Macrophage infiltration. Macrophage density was assessed in heart sections with anti–Mac‐3 staining (n=3). Scale bars=20 μm. D, Expression levels of monocyte chemotactic protein‐1 (Mcp1) mRNA (n=3). E, mRNA expression of matrix metalloproteinases 2 (Mmp2) and 9 (Mmp9) (n=3). F, NF‐κB activity in the heart (n=3). Free p65 levels in the nucleus were measured. Values were normalized to protein levels. G, mRNA expression levels of IL‐1β (Il1β), IL‐6 (Il6), and TNF‐α (Tnfα) in the heart (n=3). Expression levels of each gene were normalized to those of GAPDH (Gapdh). *P<0.05 vs sham; †P<0.05 vs control antibodies. HSP indicates heat shock protein; GAPDH, glyceraldehyde‐3‐phosphate dehydrogenase; IL, interleukin; NF, nuclear factor; TAC, transverse aortic constriction; TNF, tumor necrosis factor.
Discussion
In this study, we show that TLR2‐mediated noninfectious inflammation induced by extracellularly released HSP70 is essential for adaptive cardiac hypertrophy in response to pressure overload (Figure 28). In addition, our findings suggest that IL‐1β upregulation via NF‐κB activation plays a causative role in this mechanism. Furthermore, our results indicate that NF‐κB activity and IL‐1β expression may be regulated by a positive feedback loop. TLR2 expressed in bone marrow–derived cells does not contribute to this process. Thus, TLR2 works as a local stress sensor of the heart, which is indispensable for an adaptive response to pathological stimuli.
Figure 28.
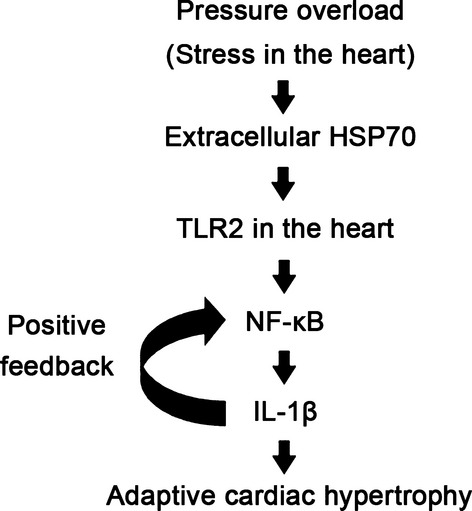
TLR2‐mediated inflammation induced by extracellularly released heat shock protein 70 (HSP70) is critically involved in adaptive cardiac hypertrophy during pressure overload through IL‐1β upregulation via NF‐κB activation. IL indicates, interleukin; NF, nuclear factor; TLR, Toll‐like receptor.
Recently, inflammation has been implicated in the pathophysiology of cardiovascular diseases.34–38 However, the role and the initiating mechanisms of inflammation in the heart diseases are incompletely understood. Recent studies have demonstrated that endogenous molecules induced under pathological conditions, called DAMPs, can stimulate pathogen receptors such as TLRs and cause noninfectious inflammation.5–6 In the present study, we demonstrated that this mechanism works in the heart during pressure overload and contributes to adaptive cardiac hypertrophy. However, chronic inflammation has been implicated in the pathogenesis of heart failure.12 In fact, Oka et al39 reported that mitochondrial DNA that escapes from autophagy induces inflammation via TLR9 and causes heart failure during pressure overload. Collectively, noninfectious inflammation may play an important role in both adaptive and maladaptive cardiac remodeling during pressure overload. Thus, it is important to clarify the difference between the features of inflammatory responses in adaptive and maladaptive cardiac remodeling during pressure overload.
In our study, IL‐1β was important for cardiac adaptive response to pressure overload, whereas in the study by Oka et al,39 IL‐6 was predominantly expressed in the failing heart. In the previous report, Yamamoto et al40 demonstrated that TLR‐mediated responses are regulated in a 2‐step mechanism. They revealed that the transcriptional regulator IκBζ induction in the first step response, in which IL‐1β and TNF‐α are also induced, is required for the second step response in which IL‐6 is induced. Collectively, these findings suggest that IL‐1β‐dominant inflammation caused by the first step response of TLR signaling may contribute to cardiac adaptation to pressure overload, whereas sustained pressure overload and resultant prolonged inflammatory responses may induce a shift to the second step response and IL‐6–dominant inflammation, which may cause adverse cardiac remodeling and heart failure. Various DAMP molecules may be induced at different phases during pressure overload as initiating or amplifying factors of inflammatory responses according to the intensity and the duration of pathological stress and may modulate the feature of inflammation in the heart.
TLR‐mediated inflammation is regulated by NF‐κB.5 In the present study, we found that TLR2 is important for NF‐κB activation in the heart during pressure overload. In the previous studies, NF‐κB activation in the heart has been shown to induce cardiac hypertrophy.34,41–42 Consistently, our in vivo experiment using an NF‐κB inhibitor demonstrated that NF‐κB activation is important for adaptive cardiac hypertrophy during pressure overload. Together with the results of our in vitro experiments, the TLR2/NF‐κB pathway may play a pivotal role in cardiac adaptive response to pressure overload. NF‐κB activation was associated with proinflammatory cytokine expression in vitro and in vivo. We also found that IL‐1β is important for cellular responses to TLR2 signaling. Thus, NF‐κB may exert its effects on pressure overload–induced cardiac hypertrophy through the upregulation of IL‐1β, which may work in an autocrine or a paracrine manner. It was reported that NF‐κB directly induces transcriptional activators of cardiac hypertrophy.43 NF‐κB also induces the transcriptional activation of anti‐apoptotic molecules.44 Thus, NF‐κB activation may enhance cardiac adaptive response to pressure overload partly through its direct transcriptional regulation of hypertrophic and antiapoptotic signals. However, because the positive feedback regulation was observed between NF‐κB activity and IL‐1β expression, IL‐1β may play an important role also in this mechanism.
It has been well established that IL‐1β induces cardiac hypertrophy.35 In the previous study, it was reported that IL‐1β induces IGF‐1 upregulation and Akt activation,13 which play important roles in adaptive cardiac hypertrophy.27 In this study, we found that TLR2 signaling is important for IGF‐1 upregulation and Akt activation in the heart during pressure overload. We also found IL‐1β neutralization suppresses IGF‐1 expression and Akt activation in TAC‐operated hearts, which is consistent with the previous study.13 Thus, IL‐1β upregulation may be a key process in TLR2‐mediated cardiac adaptive response to pressure overload, although the mechanisms in which the TLR2/IL‐1β axis induces IGF‐1 upregulation and Akt activation remain nonelucidated. Interestingly, in Chagasic cardiomyopathy, it was reported that TLR2 regulates IL‐1β–dependent cardiomyocyte hypertrophy triggered by Trypanosoma cruzi.45 Thus, TLR2‐mediated IL‐1β induction is involved in the pathogenesis of both infectious and noninfectious heart diseases. In the generation of IL‐1β, pro–IL‐1β, an inactive precursor, needs to undergo proteolysis by the converting enzyme caspase‐1. Recently, the Nod‐like receptor (NLR) family, such as the nucleotide‐binding domain, leucine‐rich–containing family, pyrin domain–containing‐3 (NLRP3) inflammasome, has been implicated in caspase‐1 activation by sensing the non–microbial‐originated DAMPs and to play an important role in the pathophysiology of various diseases.46–47 Thus, the NLRP3 inflammasome, the other pathogen sensor, may also be involved in cardiac adaptive response to pressure overload by modulating TLR2 signaling pathway.
Although it was reported that HSP70 may be a ligand for TLR2,48–49 it remains controversial because later works suggested that the previously reported cytokine function of HSP70 via TLRs might be a resultant of contaminants such as lipopolysaccharide.50 Cytokine functions of HSP70 have been extensively investigated in the immune system, but highly purified HSP70 is incapable of inducing cytokine effects on immune cells. However, because TLR2 is expressed not only on immune cells but also on nonimmune cells,16 it has been suggested that HSP70 may have cytokine effects on non‐immune cells. In fact, we showed that highly purified HSP70 exerts cytokine effects via TLR2 on cardiomyocytes, cardiac fibroblasts, and vascular endothelial cells. These findings on the difference in the effects of HSP70 between immune cells and nonimmune cells are consistent with the results of our bone marrow transplantation experiment in which TLR2 expressed in the heart tissue, but not in bone marrow–derived cells, is involved in cardiac adaptive response to pressure overload. Thus, TLR2 signaling may be differently regulated depending on cell types.
There are several limitations in this study. In our in vivo experiments, we analyzed only surviving mice after TAC, which might cause selection bias. However, the results of our in vitro experiments support the findings of in vivo experiments. Our study lacks direct evidence which indicates that the effects of TLR2 signaling in pressure overload–induced cardiac hypertrophy are mediated through NF‐κB activation and IL‐1β upregulation. Therefore, there is a possibility that TLR2 signaling may contribute to adaptive cardiac hypertrophy via the NF‐κB– and IL‐1β–independent pathways. Although the rescue experiments in Tlr2−/− mice may clarify the roles of NF‐κB and IL‐1β in TLR2 signaling during pressure overload, this strategy may be practically difficult because excessive NF‐κB activation or IL‐1β administration may be harmful due to the induction of excessive inflammatory responses and, thus, the very delicate modulation may be required. In the present study, BAY 11‐7082 was used for NF‐κB inhibition in vivo. However, BAY 11‐7082 is not a specific inhibitor for NF‐κB. Thus, BAY 11‐7082 might impair adaptive cardiac hypertrophy during pressure overload through the NF‐κB–independent mechanisms, although in vitro experiments demonstrated that the effects of BAY 11‐7082 on cellular responses to TLR2 signaling were similar to those of the NBD peptide, which is a more specific inhibitor for NF‐κB.25–26 In this study, it remains unclear whether HSP70 is a genuine ligand for TLR2 or a modulator of TLR2 ligands. To address this question, structural analysis is required, which is beyond the scope of this study.
Conclusions
This study demonstrates that TLR2‐mediated inflammation contributes to adaptive cardiac hypertrophy in response to pressure overload. Thus, modulation of TLR2 signaling in the heart may provide a novel strategy for treating heart failure due to inadequate adaptation to hemodynamic stress. In addition, although chronic inflammation has been shown to be involved in adverse cardiac remodeling,12 our findings suggest that anti‐inflammatory therapies may lead to the loss of beneficial effects of proinflammatory cytokines, which may result in worsening heart failure. Thus, further analysis that clarifies the difference between beneficial and harmful inflammation in cardiac remodeling will be necessary to provide safe and novel anti‐inflammatory strategies for prevention and treatment of adverse cardiac remodeling.
Sources of Funding
Dr Higashikuni is supported by a Japan Heart Foundation/Novartis Grant for Research Award on Molecular and Cellular Cardiology, a research grant from Japan Foundation for Applied Enzymology, a research grant from Takeda Science Foundation, a grant‐in‐aid of the Cardiovascular Research Fund, and a Grant‐in‐Aid for Young Scientists (B) from the Ministry of Education, Culture, Sports, Science and Technology of Japan. Dr Sata is supported by the Program for Promotion of Basic and Applied Researches for Innovations in Bio‐oriented Industry, a grant from the Ministry of Health, Labor and Welfare of Japan, and a Grant‐in‐Aid for Scientific Research (B) from the Ministry of Education, Culture, Sports, Science and Technology of Japan.
Disclosures
None.
References
- 1.Hunter JJ, Chien KR. Signaling pathways for cardiac hypertrophy and failure. N Engl J Med. 1999; 341:1276-1283 [DOI] [PubMed] [Google Scholar]
- 2.Lorell BH, Carabello BA. Left ventricular hypertrophy: pathogenesis, detection, and prognosis. Circulation. 2000; 102:470-479 [DOI] [PubMed] [Google Scholar]
- 3.Sano M, Minamino T, Toko H, Miyauchi H, Orimo M, Qin Y, Akazawa H, Tateno K, Kayama Y, Harada M, Shimizu I, Asahara T, Hamada H, Tomita S, Molkentin JD, Zou Y, Komuro I. p53‐induced inhibition of Hif‐1 causes cardiac dysfunction during pressure overload. Nature. 2007; 446:444-448 [DOI] [PubMed] [Google Scholar]
- 4.Heineke J, Molkentin JD. Regulation of cardiac hypertrophy by intracellular signalling pathways. Nat Rev Mol Cell Biol. 2006; 7:589-600 [DOI] [PubMed] [Google Scholar]
- 5.Kawai T, Akira S. The role of pattern‐recognition receptors in innate immunity: update on Toll‐like receptors. Nat Immunol. 2010; 11:373-384 [DOI] [PubMed] [Google Scholar]
- 6.Kanzler H, Barrat FJ, Hessel EM, Coffman RL. Therapeutic targeting of innate immunity with Toll‐like receptor agonists and antagonists. Nat Med. 2007; 13:552-559 [DOI] [PubMed] [Google Scholar]
- 7.Kim S, Takahashi H, Lin WW, Descargues P, Grivennikov S, Kim Y, Luo JL, Karin M. Carcinoma‐produced factors activate myeloid cells through TLR2 to stimulate metastasis. Nature. 2009; 457:102-106 [DOI] [PMC free article] [PubMed] [Google Scholar]
- 8.Marshak‐Rothstein A. Toll‐like receptors in systemic autoimmune disease. Nat Rev Immunol. 2006; 6:823-835 [DOI] [PMC free article] [PubMed] [Google Scholar]
- 9.Vandanmagsar B, Youm YH, Ravussin A, Galgani JE, Stadler K, Mynatt RL, Ravussin E, Stephens JM, Dixit VD. The NLRP3 inflammasome instigates obesity‐induced inflammation and insulin resistance. Nat Med. 2011; 17:179-188 [DOI] [PMC free article] [PubMed] [Google Scholar]
- 10.Baumgarten G, Knuefermann P, Kalra D, Gao F, Taffet GE, Michael L, Blackshear PJ, Carballo E, Sivasubramanian N, Mann DL. Load‐dependent and ‐independent regulation of proinflammatory cytokine and cytokine receptor gene expression in the adult mammalian heart. Circulation. 2002; 105:2192-2197 [DOI] [PubMed] [Google Scholar]
- 11.Vanderheyden M, Paulus WJ, Voss M, Knuefermann P, Sivasubramanian N, Mann D, Baumgarten G. Myocardial cytokine gene expression is higher in aortic stenosis than in idiopathic dilated cardiomyopathy. Heart. 2005; 91:926-931 [DOI] [PMC free article] [PubMed] [Google Scholar]
- 12.Mann DL. Inflammatory mediators and the failing heart: past, present, and the foreseeable future. Circ Res. 2002; 91:988-998 [DOI] [PubMed] [Google Scholar]
- 13.Honsho S, Nishikawa S, Amano K, Zen K, Adachi Y, Kishita E, Matsui A, Katsume A, Yamaguchi S, Nishikawa K, Isoda K, Riches DW, Matoba S, Okigaki M, Matsubara H. Pressure‐mediated hypertrophy and mechanical stretch induces IL‐1 release and subsequent IGF‐1 generation to maintain compensative hypertrophy by affecting Akt and JNK pathways. Circ Res. 2009; 105:1149-1158 [DOI] [PubMed] [Google Scholar]
- 14.Palmer JN, Hartogensis WE, Patten M, Fortuin FD, Long CS. Interleukin‐1 beta induces cardiac myocyte growth but inhibits cardiac fibroblast proliferation in culture. J Clin Invest. 1995; 95:2555-2564 [DOI] [PMC free article] [PubMed] [Google Scholar]
- 15.Wilson EM, Diwan A, Spinale FG, Mann DL. Duality of innate stress responses in cardiac injury, repair, and remodeling. J Mol Cell Cardiol. 2004; 37:801-811 [DOI] [PubMed] [Google Scholar]
- 16.Arumugam TV, Okun E, Tang SC, Thundyil J, Taylor SM, Woodruff TM. Toll‐like receptors in ischemia‐reperfusion injury. Shock. 2009; 32:4-16 [DOI] [PubMed] [Google Scholar]
- 17.West XZ, Malinin NL, Merkulova AA, Tischenko M, Kerr BA, Borden EC, Podrez EA, Salomon RG, Byzova TV. Oxidative stress induces angiogenesis by activating TLR2 with novel endogenous ligands. Nature. 2010; 467:972-976 [DOI] [PMC free article] [PubMed] [Google Scholar]
- 18.Kadl A, Sharma PR, Chen W, Agrawal R, Meher AK, Rudraiah S, Grubbs N, Sharma R, Leitinger N. Oxidized phospholipid‐induced inflammation is mediated by Toll‐like receptor 2. Free Radic Biol Med. 2011; 51:1903-1909 [DOI] [PMC free article] [PubMed] [Google Scholar]
- 19.Higashikuni Y, Sainz J, Nakamura K, Takaoka M, Enomoto S, Iwata H, Tanaka K, Sahara M, Hirata Y, Nagai R, Sata M. The ATP‐binding cassette transporter ABCG2 protects against pressure overload‐induced cardiac hypertrophy and heart failure by promoting angiogenesis and antioxidant response. Arterioscler Thromb Vasc Biol. 2012; 32:654-661 [DOI] [PubMed] [Google Scholar]
- 20.Takeda N, Manabe I, Uchino Y, Eguchi K, Matsumoto S, Nishimura S, Shindo T, Sano M, Otsu K, Snider P, Conway SJ, Nagai R. Cardiac fibroblasts are essential for the adaptive response of the murine heart to pressure overload. J Clin Invest. 2010; 120:254-265 [DOI] [PMC free article] [PubMed] [Google Scholar]
- 21.Aliprantis AO, Yang RB, Mark MR, Suggett S, Devaux B, Radolf JD, Klimpel GR, Godowski P, Zychlinsky A. Cell activation and apoptosis by bacterial lipoproteins through Toll‐like receptor‐2. Science. 1999; 285:736-739 [DOI] [PubMed] [Google Scholar]
- 22.Higashikuni Y, Sainz J, Nakamura K, Takaoka M, Enomoto S, Iwata H, Sahara M, Tanaka K, Koibuchi N, Ito S, Kusuhara H, Sugiyama Y, Hirata Y, Nagai R, Sata M. The ATP‐binding cassette transporter BCRP1/ABCG2 plays a pivotal role in cardiac repair after myocardial infarction via modulation of microvascular endothelial cell survival and function. Arterioscler Thromb Vasc Biol. 2010; 30:2128-2135 [DOI] [PubMed] [Google Scholar]
- 23.Berk BC, Fujiwara K, Lehoux S. ECM remodeling in hypertensive heart disease. J Clin Invest. 2007; 117:568-575 [DOI] [PMC free article] [PubMed] [Google Scholar]
- 24.Shimizu I, Yoshida Y, Katsuno T, Tateno K, Okada S, Moriya J, Yokoyama M, Nojima A, Ito T, Zechner R, Komuro I, Kobayashi Y, Minamino T. p53‐induced adipose tissue inflammation is critically involved in the development of insulin resistance in heart failure. Cell Metab. 2012; 15:51-64 [DOI] [PubMed] [Google Scholar]
- 25.May MJ, D'Acquisto F, Madge LA, Glockner J, Pober JS, Ghosh S. Selective inhibition of NF‐kappaB activation by a peptide that blocks the interaction of NEMO with the IkappaB kinase complex. Science. 2000; 289:1550-1554 [DOI] [PubMed] [Google Scholar]
- 26.Jimi E, Aoki K, Saito H, D'Acquisto F, May MJ, Nakamura I, Sudo T, Kojima T, Okamoto F, Fukushima H, Okabe K, Ohya K, Ghosh S. Selective inhibition of NF‐kappa B blocks osteoclastogenesis and prevents inflammatory bone destruction in vivo. Nat Med. 2004; 10:617-624 [DOI] [PubMed] [Google Scholar]
- 27.Selvetella G, Hirsch E, Notte A, Tarone G, Lembo G. Adaptive and maladaptive hypertrophic pathways: points of convergence and divergence. Cardiovasc Res. 2004; 63:373-380 [DOI] [PubMed] [Google Scholar]
- 28.Williams JH, Ireland HE. Sensing danger—Hsp72 and HMGB1 as candidate signals. J Leukoc Biol. 2008; 83:489-492 [DOI] [PubMed] [Google Scholar]
- 29.De Maio A. Extracellular heat shock proteins, cellular export vesicles, and the Stress Observation System: a form of communication during injury, infection, and cell damage. It is never known how far a controversial finding will go! Dedicated to Ferruccio Ritossa. Cell Stress Chaperones. 2011; 16:235-249 [DOI] [PMC free article] [PubMed] [Google Scholar]
- 30.Ohtsuka K, Hata M. Molecular chaperone function of mammalian Hsp70 and Hsp40—a review. Int J Hyperthermia. 2000; 16:231-245 [DOI] [PubMed] [Google Scholar]
- 31.Benjamin IJ, McMillan DR. Stress (heat shock) proteins: molecular chaperones in cardiovascular biology and disease. Circ Res. 1998; 83:117-132 [DOI] [PubMed] [Google Scholar]
- 32.Schmitt E, Gehrmann M, Brunet M, Multhoff G, Garrido C. Intracellular and extracellular functions of heat shock proteins: repercussions in cancer therapy. J Leukoc Biol. 2007; 81:15-27 [DOI] [PubMed] [Google Scholar]
- 33.Sawyer DB, Siwik DA, Xiao L, Pimentel DR, Singh K, Colucci WS. Role of oxidative stress in myocardial hypertrophy and failure. J Mol Cell Cardiol. 2002; 34:379-388 [DOI] [PubMed] [Google Scholar]
- 34.Hikoso S, Yamaguchi O, Nakano Y, Takeda T, Omiya S, Mizote I, Taneike M, Oka T, Tamai T, Oyabu J, Uno Y, Matsumura Y, Nishida K, Suzuki K, Kogo M, Hori M, Otsu K. The I{kappa}B kinase {beta}/nuclear factor {kappa}B signaling pathway protects the heart from hemodynamic stress mediated by the regulation of manganese superoxide dismutase expression. Circ Res. 2009; 105:70-79 [DOI] [PubMed] [Google Scholar]
- 35.Bujak M, Frangogiannis NG. The role of IL‐1 in the pathogenesis of heart disease. Arch Immunol Ther Exp (Warsz). 2009; 57:165-176 [DOI] [PMC free article] [PubMed] [Google Scholar]
- 36.Hwang MW, Matsumori A, Furukawa Y, Ono K, Okada M, Iwasaki A, Hara M, Miyamoto T, Touma M, Sasayama S. Neutralization of interleukin‐1beta in the acute phase of myocardial infarction promotes the progression of left ventricular remodeling. J Am Coll Cardiol. 2001; 38:1546-1553 [DOI] [PubMed] [Google Scholar]
- 37.Lee Y, Schulte DJ, Shimada K, Chen S, Crother TR, Chiba N, Fishbein MC, Lehman TJ, Arditi M. Interleukin‐1beta is crucial for the induction of coronary artery inflammation in a mouse model of Kawasaki disease. Circulation. 2012; 125:1542-1550 [DOI] [PMC free article] [PubMed] [Google Scholar]
- 38.Fredj S, Bescond J, Louault C, Delwail A, Lecron JC, Potreau D. Role of interleukin‐6 in cardiomyocyte/cardiac fibroblast interactions during myocyte hypertrophy and fibroblast proliferation. J Cell Physiol. 2005; 204:428-436 [DOI] [PubMed] [Google Scholar]
- 39.Oka T, Hikoso S, Yamaguchi O, Taneike M, Takeda T, Tamai T, Oyabu J, Murakawa T, Nakayama H, Nishida K, Akira S, Yamamoto A, Komuro I, Otsu K. Mitochondrial DNA that escapes from autophagy causes inflammation and heart failure. Nature. 2012; 485:251-255 [DOI] [PMC free article] [PubMed] [Google Scholar]
- 40.Yamamoto M, Yamazaki S, Uematsu S, Sato S, Hemmi H, Hoshino K, Kaisho T, Kuwata H, Takeuchi O, Takeshige K, Saitoh T, Yamaoka S, Yamamoto N, Yamamoto S, Muta T, Takeda K, Akira S. Regulation of Toll/IL‐1‐receptor‐mediated gene expression by the inducible nuclear protein IkappaBzeta. Nature. 2004; 430:218-222 [DOI] [PubMed] [Google Scholar]
- 41.Zelarayan L, Renger A, Noack C, Zafiriou MP, Gehrke C, van der Nagel R, Dietz R, de Windt L, Bergmann MW. NF‐kappaB activation is required for adaptive cardiac hypertrophy. Cardiovasc Res. 2009; 84:416-424 [DOI] [PubMed] [Google Scholar]
- 42.Li Y, Ha T, Gao X, Kelley J, Williams DL, Browder IW, Kao RL, Li C. NF‐kappaB activation is required for the development of cardiac hypertrophy in vivo. Am J Physiol Heart Circ Physiol. 2004; 287:H1712-H1720 [DOI] [PubMed] [Google Scholar]
- 43.Gaspar‐Pereira S, Fullard N, Townsend PA, Banks PS, Ellis EL, Fox C, Maxwell AG, Murphy LB, Kirk A, Bauer R, Caamano JH, Figg N, Foo RS, Mann J, Mann DA, Oakley F. The NF‐kappaB subunit c‐Rel stimulates cardiac hypertrophy and fibrosis. Am J Pathol. 2012; 180:929-939 [DOI] [PMC free article] [PubMed] [Google Scholar]
- 44.Dutta J, Fan Y, Gupta N, Fan G, Gelinas C. Current insights into the regulation of programmed cell death by NF‐kappaB. Oncogene. 2006; 25:6800-6816 [DOI] [PubMed] [Google Scholar]
- 45.Petersen CA, Krumholz KA, Burleigh BA. Toll‐like receptor 2 regulates interleukin‐1beta‐dependent cardiomyocyte hypertrophy triggered by Trypanosoma cruzi. Infect Immun. 2005; 73:6974-6980 [DOI] [PMC free article] [PubMed] [Google Scholar]
- 46.Tschopp J, Schroder K. NLRP3 inflammasome activation: the convergence of multiple signalling pathways on ROS production? Nat Rev Immunol. 2010; 10:210-215 [DOI] [PubMed] [Google Scholar]
- 47.Franchi L, Eigenbrod T, Munoz‐Planillo R, Nunez G. The inflammasome: a caspase‐1‐activation platform that regulates immune responses and disease pathogenesis. Nat Immunol. 2009; 10:241-247 [DOI] [PMC free article] [PubMed] [Google Scholar]
- 48.Asea A, Rehli M, Kabingu E, Boch JA, Bare O, Auron PE, Stevenson MA, Calderwood SK. Novel signal transduction pathway utilized by extracellular HSP70: role of Toll‐like receptor (TLR) 2 and TLR4. J Biol Chem. 2002; 277:15028-15034 [DOI] [PubMed] [Google Scholar]
- 49.Vabulas RM, Ahmad‐Nejad P, Ghose S, Kirschning CJ, Issels RD, Wagner H. HSP70 as endogenous stimulus of the Toll/interleukin‐1 receptor signal pathway. J Biol Chem. 2002; 277:15107-15112 [DOI] [PubMed] [Google Scholar]
- 50.Gao B, Tsan MF. Endotoxin contamination in recombinant human heat shock protein 70 (Hsp70) preparation is responsible for the induction of tumor necrosis factor alpha release by murine macrophages. J Biol Chem. 2003; 278:174-179 [DOI] [PubMed] [Google Scholar]