

Abstract
Background
Patients with peripheral arterial disease often experience treatment failure from restenosis at the site of a prior peripheral endovascular intervention (PVI) or lower extremity bypass (LEB). The impact of these treatment failures on the utilization and outcomes of secondary interventions is poorly understood.
Methods and Results
In our regional vascular quality improvement collaborative, we compared 2350 patients undergoing primary infrainguinal LEB with 1154 patients undergoing secondary infrainguinal LEB (LEB performed after previous revascularization in the index limb) between 2003 and 2011. The proportion of patients undergoing secondary LEB increased by 72% during the study period (22% of all LEBs in 2003 to 38% in 2011, P<0.001). In‐hospital outcomes, such as myocardial infarction, death, and amputation, were similar between primary and secondary LEB groups. However, in both crude and propensity‐weighted analyses, secondary LEB was associated with significantly inferior 1‐year outcomes, including major adverse limb event‐free survival (composite of death, new bypass graft, surgical bypass graft revision, thrombectomy/thrombolysis, or above‐ankle amputation; Secondary LEB MALE‐free survival = 61.6% vs primary LEB MALE‐free survival = 67.5%, P=0.002) and reintervention or amputation‐free survival (composite of death, reintervention, or above‐ankle amputation; Secondary LEB RAO‐free survival = 58.9% vs Primary LEB RAO‐free survival 64.1%, P=0.003). Inferior outcomes for secondary LEB were observed regardless of the prior failed treatment type (PVI or LEB).
Conclusions
In an era of increasing utilization of PVI, a growing proportion of patients undergo LEB in the setting of a prior failed PVI or surgical bypass. When caring for patients with peripheral arterial disease, physicians should recognize that first treatment failure (PVI or LEB) affects the success of subsequent revascularizations.
Keywords: angioplasty, bypass, peripheral vascular disease, restenosis, revascularization, stents
Introduction
The treatment of peripheral arterial disease (PAD) has changed dramatically in recent years, as the use of peripheral endovascular interventions (PVIs) has increased and the use of lower extremity bypass (LEB) surgery has decreased.1–3 In fact, the increase in PVIs has outpaced the decline in LEB by a factor of >3:1,4 suggesting either a shift in treatment threshold, a rising rate of repeat treatments for a single patient, or some combination thereof. As a result, the total number of procedures being performed for PAD has increased, a trend associated with markedly increased costs.1,4
When considering potential reasons for the increasing cost and complexity of caring for patients with PAD, many have expressed concern about a rising incidence of restenosis.4–6 Repeat procedures, necessitated by initial treatment failure, may be responsible for the rising number of revascularizations being performed for PAD. Why might more secondary revascularizations be occurring in recent years? It is well known that physicians and patients commonly consider tradeoffs between the relative durability and the relative morbidity of competing treatments. For example, while the short‐term failure rate for tibial angioplasty is high, it is much less invasive than that of surgical bypass and therefore has been adopted by many specialists as an initial strategy.7 Part of this rationale is also predicated on the notion that failure of endovascular interventions can still be salvaged by either repeat PVI or bypass surgery, the validity of which has increasingly come into question.8–10 It remains unclear how these shifting practice patterns have influenced the patient population undergoing LEB in recent years and whether “downstream effects” of prior failed interventions have an impact on the outcomes of bypass surgery.
The primary objectives of this study were to gain a better understanding of whether the characteristics of patients requiring surgical bypass for PAD have changed as practice patterns have evolved and to address whether prior treatments have downstream effects on the outcomes of surgical bypass. To address these goals, we analyzed all patients undergoing LEB in the Vascular Study Group of New England (VSGNE), a large regional dataset of patients with vascular disease. We used crude and inverse propensity‐weighted analyses to compare the incidence and outcomes of primary LEB with those of LEB performed in the setting of a prior ipsilateral PVI or bypass (secondary LEB).
Methods
Database and Cohort Assembly
Patients undergoing LEB at 1 of the 26 community and academic centers in the Vascular Study Group of New England (VSGNE) between 2003 and 2011 were included in our study. While 6 centers participated in the VSGNE in 2003, 20 additional centers were added during the study period. Data from all 26 centers are presented here, but our overall findings were similar in size and effect when the analysis was limited to data from only the original 6 centers. Details regarding the VSGNE have previously been published11 and are available online at http://www.vsgne.com. In this dataset, >70 preoperative, intraoperative, and postoperative variables are collected, as well as 1‐year follow‐up outcomes.5,8 A claims‐based audit system is used and has demonstrated 99% accuracy in capturing consecutive procedures performed at each center.5
Our main exposure variable was the occurrence of a secondary bypass at the time of entry into the dataset. A secondary bypass was defined as a bypass performed in a patient with a history of a prior ipsilateral PVI, a prior ipsilateral LEB, or both. Primary LEB patients were those who had no history of prior ipsilateral PVI or LEB recorded in the database. Differences in patient characteristics were compared across primary and secondary LEB patients using existing data elements in the VSGNE, using the first procedure per patient as the unit of analysis. Patients were excluded from this study if they had aneurysmal disease as the indication for their procedure, if no indication was specified, or if other variables were missing data. As a result, ≈12% of patients undergoing LEB during the study period were excluded, a majority of whom were missing an indication. Among preoperative variables, indication for LEB was classified as either intermittent claudication or critical limb ischemia (CLI; defined as tissue loss or ischemic rest pain). Only the first LEB procedure was considered for each patient in the VSGNE dataset, and only infrainguinal LEB procedures were included. This procedure was defined as the index LEB. If a patient had an LEB within the VSGNE and required a subsequent ipsilateral LEB, these events were counted as treatment failures (not as a new LEB).
Outcome Measures
Our primary outcome measures were chosen to target safety and efficacy of LEB using end points endorsed in the Society for Vascular Surgery's Objective Performance Goals.12 To evaluate the safety and short‐term efficacy of LEB, we analyzed in‐hospital outcomes, including mortality, myocardial infarction, and major amputation. We also examined outcomes at 1 year postoperatively, including overall survival and amputation‐free survival. Additional efficacy outcomes included reintervention or amputation (RAO) and major adverse limb event (MALE), defined as follows: RAO‐free survival is freedom from death, any reintervention, or above‐ankle amputation of index limb, and MALE‐free survival is freedom from death, major reintervention (new bypass graft, a jump or interposition graft placed during a revision, or thrombectomy/thrombolysis), or above ankle‐amputation of index limb.12 While summarizing outcomes using RAO and MALE as endpoints allows insight into the overall need for, and magnitude of, reinterventions, we also individually report their component outcomes.
Statistical Analysis
Patient demographics were compared between groups using a Wilcoxon rank sum test for continuous variables and χ2 test for categorical or dichotomous variables. The effects of primary or secondary LEB on the time‐to‐event end points (amputation‐free survival, RAO‐free survival, MALE‐free survival, and overall survival) were estimated and contrasted using Kaplan–Meier curves and log‐rank tests for significance in conjunction with inverse propensity weighting. This weighting approach corrects for imbalance due to measured confounders by weighting subjects in each treatment group in such a way that the weighted sample for each group represents the entire sample of subjects. Weighted Kaplan–Meier survival estimates were then calculated based on the inverse of the probability that each patient would receive a specific treatment (primary versus secondary LEB).13–16 Where inverse propensity‐weighted survival estimates were calculated, a Cox model was used to determine significance of differences. Using this strategy, inverse propensity weighting addresses issues of confounding, and because patients in our database could not have been conceivably exposed to either primary or secondary LEB, it serves as a sensitivity analysis for consistency with our Cox models.
The propensity model for primary versus secondary LEB was generated using a multivariable logistic regression model. Backward stepwise logistic regression was used to determine which preoperative patient characteristics and operative details were most closely associated with secondary LEB at the time of index bypass surgery. Following inverse propensity weighting, patient characteristics were compared using Wilcoxon rank‐sum test or χ2 test, where appropriate, to examine the success of this technique in creating similar cohorts for analysis. Outcomes were then analyzed in a similar fashion as with the unweighted cohort. Data were analyzed using STATA version 11 (StataCorp) and SAS version 9.2 (SAS Institute).
Results
Secular Changes in Secondary LEB
Between 2003 and 2011, the proportion of patients who underwent secondary LEB within the VSGNE increased significantly, from 22% to 38% of all index LEBs performed (P<0.001) (Figure 1). This increase was evident among patients undergoing LEB for both claudication (23% to 33%, P<0.001) and CLI (22% to 38%, P<0.001). When examining the data by indication and nature of the prior intervention, the greatest increases were seen in the frequency of prior PVI (Figure 2). For example, we found that a history of prior PVI increased from 13% to 22% for patients undergoing surgical treatment for claudication (P=0.002), and similar increases were evident for patients with CLI (12% to 25%, P<0.001). We observed a smaller increase in the proportion of patients with a history of LEB undergoing treatment for CLI (13% versus 19%; P=0.022) and no significant change in the proportion of patients with a history of LEB undergoing treatment for claudication (P=0.323).
Figure 1.
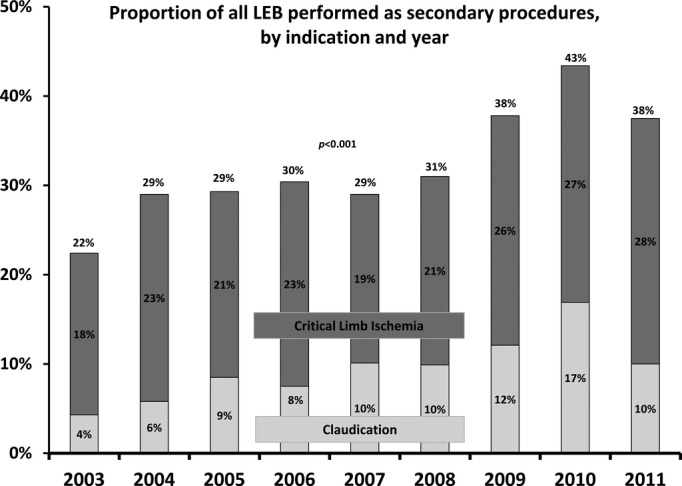
Annual trends in secondary lower extremity bypass (LEB), as a proportion of total LEBs performed per year 2003–2011, stratified by indication.
Figure 2.

Annual trends in secondary LEB, as a proportion of total LEBs performed per year 2003–2011, stratified by indication and type of intervention. CLI indicates critical limb ischemia; LEB, lower extremity bypass; PVI, peripheral endovascular intervention.
Patient Characteristics and Operative Details in Primary Versus Secondary LEB
Between 2003 and 2011, a total of 3504 patients underwent an index LEB procedure in the VSGNE database. Of these, 1154 (32.9%) were secondary LEBs, and 2350 (67.1%) were primary LEBs. Secondary LEB followed prior ipsilateral PVI in 552 of 1154 cases (48%), prior ipsilateral LEB in 437 of 1154 cases (38%), and both LEB and PVI in 165 of 1154 cases (14%). Overall, the indication for LEB was claudication in 29.7% (1039/3504) and CLI in 70.3% (2465/3504). These indications were similar in primary and secondary LEB groups (Table 1). However, patients undergoing a secondary LEB were more likely to be younger (proportion under age 70: 58.5% versus 52.9%, P<0.001) and to have a higher rate of smoking (88.6% versus 81.7%, P<0.001) and were less likely to be receiving dialysis (5.6% versus 8.2%, P=0.004) than were primary LEB patients. Patients undergoing a secondary LEB were also more likely to be receiving aspirin (76.1% versus 72.2%, P=0.014), clopidogrel (19.3% versus 8.3%, P<0.001), or a statin (70.8% versus 63.3%, P<0.001) in the preoperative period. Additional differences in patient characteristics are shown in Table 1.
Table 1.
Complete Demographics and Operative Details of Patients Who Underwent Infrainguinal LEB in the Vascular Study Group of New England From 2003 to 2011, With Univariate Analysis by Primary Versus Secondary LEB
| Characteristic | Unweighted Data | ||
|---|---|---|---|
| Primary LEB, % | Secondary LEB, % | P Value* | |
| No. of patients | 2350 | 1154 | |
| Demographics | |||
| Male sex | 69.6 | 66.6 | 0.078 |
| White race | 96.6 | 96.4 | 0.771 |
| Age, y | |||
| <70 | 52.9 | 58.5 | <0.001 |
| 70 to 79 | 27.8 | 29.4 | |
| ≥80 | 19.3 | 12.1 | |
| Smoking (prior or current) | 81.7 | 88.6 | <0.001 |
| COPD | 25.8 | 28.8 | 0.063 |
| Hypertension | 85.7 | 88.0 | 0.072 |
| Coronary artery disease | 35.6 | 37.6 | 0.236 |
| Prior CABG or coronary intervention | 32.0 | 34.5 | 0.143 |
| Congestive heart failure | 16.5 | 15.5 | 0.466 |
| Diabetes | |||
| No diabetes | 48.5 | 50.3 | 0.581 |
| Non–insulin‐dependent diabetes | 25.8 | 24.4 | |
| Insulin‐dependent diabetes | 25.7 | 25.3 | |
| Creatinine ≥1.8 | 9.1 | 7.2 | 0.076 |
| Dialysis | 8.2 | 5.6 | 0.004 |
| Living nursing home preoperatively | 4.4 | 3.2 | 0.085 |
| Transferred from hospital/rehabilitation unit | 7.6 | 7.6 | 0.973 |
| Independently ambulatory preoperatively | 78.3 | 78.8 | 0.755 |
| BMI, kg/m2 | |||
| <20 | 9.3 | 10.7 | 0.125 |
| 20 to 30 | 62.4 | 61.6 | |
| 30 to 40 | 24.6 | 25.3 | |
| ≥40 | 3.7 | 2.3 | |
| Cardiac stress test | |||
| Not done | 61.7 | 61.6 | 0.803 |
| Normal | 25.6 | 25.0 | |
| Abnormal | 12.6 | 13.4 | |
| Preoperative medication regimen | |||
| Preoperative β‐blockers | 77.4 | 80.1 | 0.076 |
| Preoperative aspirin | 72.2 | 76.1 | 0.014 |
| Preoperative clopidogrel | 8.3 | 19.3 | <0.001 |
| Preoperative statin use | 63.3 | 70.8 | <0.001 |
| Surgical history | |||
| CEA | 9.2 | 12.7 | 0.001 |
| Aneurysm repair | 2.8 | 6.2 | <0.001 |
| Ipsilateral major amputation | 0.0 | 0.4 | 0.025 |
| Ipsilateral minor amputation | 5.8 | 7.8 | 0.023 |
| Indication | |||
| Claudication | 29.5 | 30.1 | 0.705 |
| Critical limb ischemia | 70.6 | 69.9 | |
| Operative details | |||
| Urgency | |||
| Elective | 81.4 | 79.0 | 0.023 |
| Urgent | 18.2 | 19.8 | |
| Emergent | 0.5 | 1.2 | |
| Graft origin—common femoral artery | 66.5 | 73.1 | <0.001 |
| Graft recipient | |||
| Above knee | 28.3 | 29.0 | <0.001 |
| BK popliteal | 31.5 | 35.8 | |
| Tibial | 28.2 | 29.6 | |
| Pedal | 12.0 | 5.7 | |
| Graft type | |||
| Prosthetic | 27.3 | 35.6 | <0.001 |
| Any graft vein type | 75.0 | 66.8 | <0.001 |
| No. of vein segments | |||
| 0 | 26.1 | 33.4 | <0.001 |
| 1 | 69.0 | 59.1 | |
| 2 | 4.6 | 6.7 | |
| ≥3 | 0.3 | 0.8 | |
| Concomitant proximal procedures (ipsilateral) | |||
| PVI | 10.8 | 9.3 | 0.297 |
| Endarterectomy | 49.6 | 43.1 | 0.007 |
| Anesthesia type | |||
| Spinal | 13.8 | 11.0 | 0.006 |
| Epidural | 6.7 | 5.0 | |
| General anesthesia | 79.4 | 84.0 | |
| Right side (origin) | 51.4 | 53.4 | 0.261 |
| Adjuncts | |||
| No vein cuff | 98.2 | 96.6 | 0.003 |
| Vein cuff | 1.8 | 3.5 | |
| No sequential graft | 97.9 | 97.2 | 0.234 |
| Sequential graft | 2.1 | 2.8 | |
| Discharge medications | |||
| Aspirin | 80.7 | 82.9 | 0.123 |
| Clopidogrel | 16.8 | 25.9 | <0.001 |
| Warfarin | 21.4 | 27.7 | <0.001 |
| Statin | 74.0 | 79.5 | 0.002 |
| β‐Blocker | 76.4 | 78.2 | 0.284 |
BK indicates below knee; BMI, body mass index; CABG, coronary artery bypass graft surgery; CEA, carotid endarterectomy; COPD, chronic obstructive pulmonary disease; LEB, lower extremity bypass; PVI, peripheral endovascular intervention.
P value from χ2 test (testing differences between patients without prior PVI or bypass and those with either).
Univariate analyses revealed differences in operative characteristics between the 2 groups (Table 1). Secondary LEB patients were more likely to have undergone the procedure on an urgent or emergent basis (21.0% versus 18.6%, P=0.023), to have prosthetic conduit used for their bypass graft (35.6% versus 27.3%, P<0.001) or to have a spliced vein graft consisting of >1 piece of vein (7.5% versus 4.9%, P<0.001). Finally, secondary LEB patients were more likely to be discharged on clopidogrel (25.9% versus 16.8%, P<0.001), warfarin (27.7% versus 21.4%, P<0.001), and statins (79.5% versus 74.0%, P=0.002) (Table 1).
Multivariable logistic regression analysis of patient demographics and operative details revealed multiple variables associated with secondary LEB (Table 2). Using these differences, inverse propensity weighting was successful in creating 2 cohorts that were appropriate for comparison while accounting for differences in demographics and operative details (Table 3).
Table 2.
Multivariate Analysis of Patient Demographics and Operative Details, by Secondary LEB
| Variable | Odds Ratio | 95% CI | P Value |
|---|---|---|---|
| Male sex | 0.78 | 0.66 to 0.92 | 0.003 |
| Age, y | |||
| <70 | Reference | ||
| 70 to 79 | 0.93 | 0.78 to 1.11 | 0.445 |
| ≥80 | 0.58 | 0.46 to 0.74 | <0.001 |
| BMI, kg/m2 | |||
| <20 | Reference | ||
| 20 to 30 | 0.78 | 0.60 to 1.01 | 0.059 |
| 30 to 40 | 0.75 | 0.56 to 0.99 | 0.043 |
| ≥40 | 0.39 | 0.23 to 0.66 | <0.001 |
| Smoking (prior or current) | 1.53 | 1.21 to 1.94 | <0.001 |
| Previous arterial aneurysm repair | 2.72 | 1.88 to 3.93 | <0.001 |
| Preoperative clopidogrel | 2.57 | 2.06 to 3.21 | <0.001 |
| Preoperative statin use | 1.31 | 1.11 to 1.55 | 0.001 |
| Prior ipsilateral minor amputation | 1.69 | 1.24 to 2.32 | 0.001 |
| Graft recipient | |||
| Above knee | Reference | ||
| BK popliteal | 1.42 | 1.15 to 1.74 | 0.001 |
| Tibial | 1.39 | 1.11 to 1.74 | 0.005 |
| Pedal | 0.64 | 0.46 to 0.91 | 0.013 |
| Any graft vein type | 0.52 | 0.32 to 0.86 | 0.010 |
| No. of vein segments | |||
| 0 | Reference | ||
| 1 | 1.13 | 0.69 to 1.83 | 0.637 |
| 2 | 2.18 | 1.22 to 3.87 | 0.008 |
| ≥3 | 4.18 | 1.21 to 14.48 | 0.024 |
AUC=0.67. AUC indicates area under the curve; BK, below knee; BMI, body mass index; LEB, lower extremity bypass.
Table 3.
Selected Demographics and Operative Details of Patients (N=3504) Who Underwent Infrainguinal LEB in the Vascular Study Group of New England From 2003 to 2011, With Univariate Analysis by Primary Versus Secondary LEB, With Inverse Propensity Weighting
| Characteristic | Unweighted Data | Inverse Propensity‐Weighted Analysis | ||||
|---|---|---|---|---|---|---|
| Primary LEB, % | Secondary LEB, % | P Value* | Primary LEB, % | Secondary LEB, % | P Value* | |
| No. of patients | 2350 | 1154 | 2350 | 1154 | ||
| Demographics | ||||||
| Male sex | 69.6 | 66.6 | 0.078 | 68.1 | 68.4 | 0.874 |
| White race | 96.6 | 96.4 | 0.771 | 96.6 | 96.2 | 0.569 |
| Age, y | ||||||
| <70 | 52.9 | 58.5 | <0.001 | 55.0 | 55.0 | 0.995 |
| 70 to 79 | 27.8 | 29.4 | 28.2 | 28.1 | ||
| ≥80 | 19.3 | 12.1 | 16.8 | 16.9 | ||
| Smoking (prior or current) | 81.7 | 88.6 | <0.001 | 83.9 | 83.2 | 0.592 |
| COPD | 25.8 | 28.8 | 0.063 | 25.9 | 26.5 | 0.721 |
| Hypertension | 85.7 | 88.0 | 0.072 | 85.5 | 88.0 | 0.051 |
| Coronary artery disease | 35.6 | 37.6 | 0.236 | 36.3 | 35.3 | 0.599 |
| Prior CABG or coronary intervention | 32.0 | 34.5 | 0.143 | 33.4 | 33.1 | 0.842 |
| Congestive heart failure | 16.5 | 15.5 | 0.466 | 16.1 | 15.8 | 0.804 |
| Diabetes | ||||||
| No diabetes | 48.5 | 50.3 | 0.581 | 48.3 | 50.2 | 0.400 |
| Non–insulin‐dependent diabetes | 25.8 | 24.4 | 25.7 | 26.0 | ||
| Insulin‐dependent diabetes | 25.7 | 25.3 | 26.0 | 23.9 | ||
| Creatinine ≥1.8% | 9.1 | 7.2 | 0.076 | 8.7 | 7.0 | 0.092 |
| Dialysis | 8.2 | 5.6 | 0.004 | 7.9 | 6.2 | 0.075 |
| Preoperative medication regimen | ||||||
| Preoperative β‐blockers | 77.4 | 80.1 | 0.076 | 77.8 | 79.9 | 0.167 |
| Preoperative aspirin | 72.2 | 76.1 | 0.014 | 72.7 | 73.8 | 0.509 |
| Preoperative clopidogrel | 8.3 | 19.3 | <0.001 | 12.1 | 11.9 | 0.892 |
| Preoperative statin use | 63.3 | 70.8 | <0.001 | 66.5 | 66.7 | 0.914 |
| Surgical history | ||||||
| CEA | 9.2 | 12.7 | 0.001 | 9.9 | 11.4 | 0.203 |
| Aneurysm repair | 2.8 | 6.2 | <0.001 | 3.7 | 3.8 | 0.948 |
| Ipsilateral major amputation | 0.0 | 0.4 | 0.025 | 0.1 | 0.3 | 0.056 |
| Ipsilateral minor amputation | 5.8 | 7.8 | 0.023 | 6.3 | 6.1 | 0.896 |
| Indication | ||||||
| Claudication | 29.5 | 30.1 | 0.705 | 30.3 | 29.4 | 0.594 |
| Critical limb ischemia | 70.6 | 69.9 | 69.7 | 70.6 | ||
| Operative details | ||||||
| Urgency | ||||||
| Elective | 81.4 | 79.0 | 0.023 | 82.4 | 80.6 | 0.137 |
| Urgent | 18.2 | 19.8 | 17.2 | 18.6 | ||
| Emergent | 0.5 | 1.2 | 0.4 | 0.9 | ||
| Graft origin—common femoral artery | 66.5 | 73.1 | <0.001 | 67.9 | 71.8 | 0.021 |
| Graft recipient | ||||||
| Above knee | 28.3 | 29.0 | <0.001 | 29.0 | 29.5 | 0.991 |
| BK popliteal | 31.5 | 35.8 | 33.2 | 33.0 | ||
| Tibial | 28.2 | 29.6 | 28.0 | 27.6 | ||
| Pedal | 12.0 | 5.7 | 9.9 | 9.9 | ||
| Graft type | ||||||
| Prosthetic | 27.3 | 35.6 | <0.001 | 29.8 | 30.2 | 0.791 |
| Any graft vein type | 75.0 | 66.8 | <0.001 | 72.5 | 72.4 | 0.915 |
| No. of vein segments | ||||||
| 0 | 26.1 | 33.4 | <0.001 | 28.3 | 28.4 | 0.984 |
| 1 | 69.0 | 59.1 | 66.0 | 65.8 | ||
| 2 | 4.6 | 6.7 | 5.4 | 5.4 | ||
| ≥3 | 0.3 | 0.8 | 0.3 | 0.4 | ||
| Concomitant proximal procedures (ipsilateral) | ||||||
| PVI | 10.8 | 9.3 | 0.297 | 11.0 | 9.1 | 0.203 |
| Endarterectomy | 49.6 | 43.1 | 0.007 | 49.4 | 44.4 | 0.038 |
| Discharge medications | ||||||
| ASA | 80.7 | 82.9 | 0.123 | 81.1 | 82.1 | 0.492 |
| Clopidogrel | 16.8 | 25.9 | <0.001 | 19.1 | 21.5 | 0.107 |
| Coumadin | 21.4 | 27.7 | <0.001 | 21.3 | 27.0 | <0.001 |
| Statin | 74.0 | 79.5 | 0.002 | 76.1 | 77.8 | 0.328 |
| β‐Blocker | 76.4 | 78.2 | 0.284 | 76.9 | 77.7 | 0.645 |
ASA indicates aspirin; BK, below knee; CABG, coronary artery bypass graft surgery; CEA, carotid endarterectomy; COPD, chronic obstructive pulmonary disease; LEB, lower extremity bypass; OR, operating room; PVI, peripheral endovascular intervention.
P value from χ2 test (testing differences between weighted groups).
P value from χ2 test (testing differences between propensity‐weighted groups).
In‐hospital Outcomes in Primary Versus Secondary LEB, by Indication
Of the 3504 LEBs performed, unweighted postoperative in‐hospital outcomes showed no differences in mortality (1.6% versus 1.5%, P=0.795) or myocardial infarction (4.1% versus 3.9%, P=0.822) (Table 4). Secondary LEB patients were slightly more likely than were primary LEB patients to require a major amputation (below‐knee or above‐knee) during the index hospitalization (0.5% versus 0.1%, P=0.031).
Table 4.
In‐hospital Outcomes and Discharge Characteristics of Patients Who Underwent Infrainguinal LEB, With Univariate Analysis by Primary Versus Secondary LEB and Inverse Propensity Weighting
| Outcome/Discharge Characteristic | Unweighted Data | Inverse Propensity‐Weighted Analysis | ||||
|---|---|---|---|---|---|---|
| Primary LEB, % | Secondary LEB, % | P Value* | Primary LEB, % | Secondary LEB, % | P Value* | |
| No. of patients | 2350 | 1154 | 2350 | 1154 | ||
| Postoperative complications | ||||||
| Return to OR | ||||||
| Return to OR for bleeding | 1.6 | 1.3 | 0.478 | 1.6 | 1.0 | 0.192 |
| Return to OR for infection | 0.9 | 0.9 | 0.975 | 1.0 | 0.6 | 0.316 |
| Return to OR for thrombosis | 2.2 | 3.3 | 0.061 | 2.3 | 3.6 | 0.036 |
| Graft occlusion at discharge | 1.3 | 2.0 | 0.126 | 1.1 | 2.0 | 0.026 |
| Postoperative length of stay, d* | 4 (0 to 89) | 4 (0 to 154) | 0.384 | 4 (0 to 89) | 4 (0 to 154) | 0.199 |
| In‐hospital mortality | 1.5 | 1.6 | 0.795 | 1.3 | 1.3 | 0.994 |
| In‐hospital MI | 3.9 | 4.1 | 0.822 | 3.9 | 3.7 | 0.738 |
| In‐hospital ipsilateral amputation | 0.1 | 0.5 | 0.031 | 0.2 | 0.4 | 0.122 |
LEB indicates lower extremity bypass; MI, myocardial infarction; OR, operating room.
P value from χ2 test (testing differences between unweighted groups).
P value from χ2 test (testing differences between propensity‐weighted groups).
Median (range), P value from Wilcoxon rank sum test.
After adjustment for intergroup differences with inverse propensity weighting, there were no significant differences in overall rates of in‐hospital mortality, myocardial infarction, or ipsilateral major amputation (Table 4). However, on weighted analysis, patients undergoing secondary LEB were more likely to return to the operating room for graft thrombosis or have graft occlusion at discharge than was the primary LEB cohort (Table 4). Subgroup analyses stratified by symptom type (claudication versus CLI) demonstrated similar results in both the crude and inverse propensity‐weighted cohorts (Table 5).
Table 5.
In‐hospital and 1‐Year Outcomes, by Indication (Unweighted and Propensity Weighted)
| Variable | Unweighted In‐hospital Outcomes Stratified by Indication | Inverse Probability Weighted In‐hospital Outcomes Stratified by Indication | ||||||||||
|---|---|---|---|---|---|---|---|---|---|---|---|---|
| Of 1039 With Claudication | Of 2465 With CLI | Of 1039 With Claudication | Of 2465 With CLI | |||||||||
| Primary LEB (n=692) | Secondary LEB (n=347) | P Value* | Primary LEB (n=1658) | Secondary LEB (n=807) | P Value* | Primary LEB (n=692) | Secondary LEB (n=347) | P Value* | Primary LEB (n=1658) | Secondary LEB (n=807) | P Value* | |
| In‐hospital mortality | 0.4% | 0.0% | 0.219 | 1.9% | 2.2% | 0.547 | 0.6% | 0.0% | 0.165 | 1.6% | 1.9% | 0.672 |
| In‐hospital MI | 1.0% | 0.9% | 0.817 | 5.1% | 5.5% | 0.731 | 1.1% | 1.0% | 0.808 | 5.2% | 4.9% | 0.743 |
| In‐hospital ipsilateral amputation | 0.0% | 0.0% | NA | 0.2% | 0.7% | 0.030 | 0.0% | 0.0% | NA | 0.2% | 0.6% | 0.127 |
| Unweighted 1 Year‐Outcomes Stratified by Indication | Inverse Probability‐Weighted 1‐Year Outcomes Stratified by Indication | |||||||||||
| RAO‐free survival | 77.6% | 73.9% | 0.123 | 59.3% | 53.3% | 0.001 | 77.3% | 72.9% | 0.064 | 60.0% | 53.0% | 0.003 |
| MALE‐free survival | 81.8% | 77.6% | 0.107 | 62.4% | 55.6% | 0.001 | 81.0% | 76.9% | 0.075 | 63.1% | 55.3% | 0.002 |
| Amputation‐free survival | 93.0% | 94.1% | 0.566 | 71.3% | 68.6% | 0.060 | 93.2% | 94.9% | 0.578 | 72.3% | 68.5% | 0.058 |
| Overall survival | 95.9% | 97.6% | 0.865 | 82.8% | 84.3% | 0.080 | 96.0% | 98.1% | 0.870 | 83.7% | 82.2% | 0.933 |
Cox model with the treatment as the covariate for adjusted 1‐year outcomes. CLI indicates critical limb ischemia; LEB, lower extremity bypass; MALE, freedom from death, amputation, or major reintervention; MI, myocardial infarction; RAO, freedom from death, amputation, or any reintervention.
P value from χ2 test for in‐hospital outcomes; log‐rank test of overall distribution functions across strata for unadjusted 1‐year outcomes.
Outcomes at 1‐Year Follow‐up in Primary Versus Secondary LEB, by Indication and Procedure Type
Outcomes at 1 year differed significantly between primary and secondary LEB patients. In crude analyses of all patients at 1 year after LEB, RAO‐free survival and MALE‐free survival were significantly inferior compared with primary LEB patients (Figure 3, Table 5). Individual components of these summary outcomes, such as survival and amputation, are shown in Table 6. Following inverse propensity weighting, secondary LEB was significantly associated with inferior RAO‐free survival (hazard ratio=1.22, 95% CI 1.09 to 1.37, P<0.001) and inferior MALE‐free survival (hazard ratio=1.23, 95% CI 1.10 to 1.38, P<0.001) (Figure 4).
Figure 3.
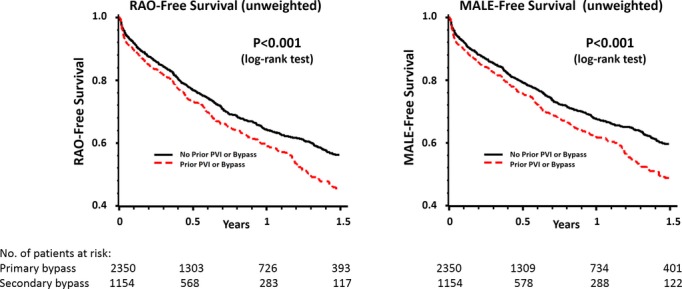
Crude (unweighted) analysis of RAO‐free survival and MALE‐free survival in primary versus secondary LEB. LEB indicates lower extremity bypass; MALE, major adverse limb event; PVI, peripheral endovascular intervention; RAO, reintervention or amputation.
Table 6.
Outcomes at 1‐Year Follow‐up in All Patients, With Univariate Analysis by Primary Versus Secondary LEB and Inverse Propensity Weighting
| Variable | Unweighted Data | Inverse Propensity‐Weighted Analysis | ||||
|---|---|---|---|---|---|---|
| Primary LEB (n=2350) | Secondary LEB (n=1154) | P Value* | Primary LEB (n=2350) | Secondary LEB (n=1154) | P Value* | |
| Overall survival | 86.6% | 88.2% | 0.183 | 87.4% | 86.8% | 0.667 |
| Amputation‐free survival | 77.0% | 75.6% | 0.459 | 78.0% | 75.5% | 0.198 |
| RAO‐free survival | 64.1% | 58.9% | 0.017 | 64.7% | 58.3% | 0.003 |
| Overall survival | 86.6% | 88.2% | 0.183 | 87.4% | 86.8% | 0.667 |
| Freedom from amputation | 91.5% | 88.0% | 0.028 | 91.7% | 89.9% | 0.239 |
| Freedom from any reintervention | 73.5% | 66.1% | 0.001 | 73.6% | 66.3% | 0.002 |
| MALE‐free survival | 67.5% | 61.6% | 0.007 | 67.9% | 61.0% | 0.002 |
| Overall survival | 86.6% | 88.2% | 0.183 | 87.4% | 86.8% | 0.667 |
| Freedom from amputation | 91.5% | 88.0% | 0.028 | 91.7% | 89.9% | 0.239 |
| Freedom from major reintervention* | 78.2% | 69.9% | <0.001 | 78.0% | 70.3% | <0.001 |
LEB indicates lower extremity bypass; MALE, freedom from death, amputation, or major reintervention; RAO, freedom from death, amputation, or any reintervention.
P value from asymptotically χ2 test with 1 df at 1 year for unweighted and weighted outcomes.
Major reintervention, new bypass graft, a jump/interposition graft placed during a revision, or thrombectomy/thrombolysis.
Figure 4.
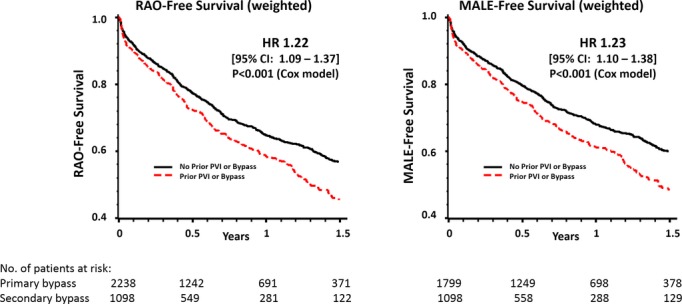
Inverse‐propensity weighted analysis of RAO‐free survival and MALE‐free survival in primary versus secondary LEB. HR indicates hazard ratio; LEB, lower extremity bypass; MALE, major adverse limb event; PVI, peripheral endovascular intervention; RAO, reintervention or amputation.
Subgroup analyses stratified by indication (claudication versus CLI) demonstrated similar results in patients with CLI but not claudicants (Table 5). For patients with CLI, MALE‐free survival at 1 year was inferior among secondary LEB patients (55.3% versus 63.1%, P=0.002), as was RAO‐free survival (53.0% versus 60.0%, P=0.003). Finally, to determine whether the nature of the prior revascularization procedure (PVI, LEB, or both) had a differential effect on the outcomes of secondary LEB, we stratified outcomes based on prior intervention type. We found that, regardless of the nature of the prior intervention (endovascular or surgical), all secondary LEB patients had inferior RAO‐free survival (P=0.005) and MALE‐free survival (P=0.004) outcomes (Figure 5). To further clarify the impact of prior PVI on subsequent LEBs, we compared primary LEBs with only those secondary LEBs performed after PVI and found that differences in RAO‐free survival (P=0.005) and MALE‐free survival (P=0.005) persisted.
Figure 5.
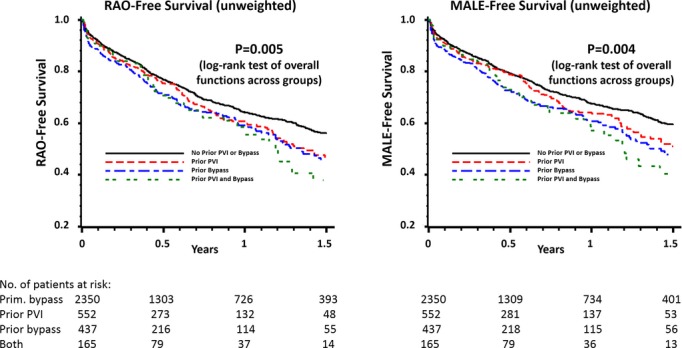
Subgroup analysis of RAO‐free survival and MALE‐free survival, stratified by prior intervention type. MALE indicates major adverse limb event; PVI, peripheral endovascular intervention; RAO, reintervention or amputation.
Discussion
With the continuing evolution of endovascular techniques for the treatment of PAD, several studies have demonstrated dramatic increases in the volume of interventions being performed during the past decade, suggesting a major shift in practice patterns toward a more aggressive use of revascularization.1–3 Our data suggest that, currently, nearly half of the patients undergoing surgical lower extremity revascularization in New England represent a failure of a prior revascularization attempt in that limb, a relative increase of 72% over the study interval. In both crude and weighted analyses, these secondary bypass operations are associated with significantly worse mid‐term outcomes compared with patients undergoing primary bypass, even when adjusting for differences in patient characteristics. Furthermore, primary bypass outcomes were superior to secondary bypass outcomes, regardless of whether the prior failed intervention was endovascular or surgical in nature. Thus, both the incidence and the impact of treatment failure on the treatment of PAD appear to be increasing dramatically in recent years, with treatment failure contributing significantly to the overall burden of PAD on patients and the health care system.
In recent years, many have advocated an “endovascular first” strategy when treating patients with severe PAD.17–19 This shift in approach has occurred concomitantly with the continued evolution and proliferation of catheter‐based technologies and their diffusion across multiple disciplines and venues of care. Among the reasons cited for more aggressive use of endovascular revascularization, many argue that a failed primary endovascular intervention causes little harm, as long as the target for bypass surgery remains available.18 However, our data indicate that LEBs performed in the setting of failed prior interventions are substantially more likely to fail within 1 year, in comparison to primary operations. This was true regardless of whether the prior intervention was endovascular (PVI) or surgical (LEB) in nature. Moreover, the survival curves suggest that the degree of inferiority for secondary LEB continues to increase with time and would likely be substantially greater with additional years of observation.
Although these data describe the effects of evolving treatment paradigms for PAD on patients presenting for surgical bypass, they do not, in any way, address the question of which primary interventions are appropriate and which are not. Obviously, not all patients who undergo an initial endovascular intervention will ultimately require surgical bypass, and we readily agree that for many patients, endovascular intervention is a reasonable, safe, and effective initial option for treatment in PAD. In future work, we plan to use the Vascular Quality Initiative, a recently formed national quality improvement collaborative derived from regional efforts in New England, to examine the need for surgical revascularization among all patients undergoing an initial endovascular intervention, as well as the outcomes beginning with the first PVI or bypass.
Our study was not designed to establish whether primary bypass is a superior strategy to primary endovascular approach with surgical “backup” for failures. Further evidence from randomized trials will be necessary to address this question.9 However, given our findings, we believe physicians who care for patients with vascular disease should consider the significant influence of treatment failure on future events. Downstream effects may not become evident for years; therefore, outcomes reports with limited follow‐up may grossly underestimate the impact of treatment failures in PAD. In this regard, the 1‐year outcomes reported here are also a notable limitation, though the trends suggest that the strength of these findings would only increase with longer observation times.
Importantly, findings from our observational dataset reflect data from existing randomized trials.9 Patients surviving ≥2 years in the Bypass versus Angioplasty in Severe Ischemia of the Limb trial (BASIL) (70% of the cohort) appeared better served by an initial LEB, and LEB procedures that were performed after an initial failed PVI had notably inferior outcomes compared with bypass performed as the initial strategy in BASIL. While a major criticism of BASIL has been whether the protocol‐mandated use of balloon angioplasty alone represents current best endovascular practice, our contemporary study suggests broadly similar implications in the present era of PVI.
Are the regional results reported in our dataset broadly generalizable? We believe the answer is yes. Our study is based on risk‐adjusted, clinically detailed data from real‐world practice, and we used inverse propensity weighting to account for differences in patient characteristics as well as surgical variables such as type of conduit used and distal target. And, given that our study cohort is composed of peripheral vascular operations, many, but not all, of the contributors to our dataset are vascular surgeons. In fact, of those physicians who contribute to the VSGNE and report board certification, >40% are interventional cardiologists, radiologists, or procedure‐based specialists other than vascular surgeons. Specialty issues aside, the optimal manner by which to assess the extended impact of initial treatment selections in patients with advanced PAD would be a randomized trial, comparing the clinical and functional outcomes for differing initial treatment strategies with long‐term follow‐up including secondary interventions. However, given current cost constraints, no such trials are on the immediate horizon.
How, then, should we proceed? Disease‐based registries, used in cooperation across a variety of provider specialties, may provide a practical method to gain insight into this complex problem. Using detailed risk adjustment algorithms, patient‐level risk for adverse outcomes can be assessed for a variety of treatment strategies—conservative care, endovascular first, primary LEB, and secondary interventions (both PVI and LEB). While a disease‐based registry would share several of the limitations inherent to our procedure‐based registry, it would add the benefit of insight from other treatment strategies to detect marginal differences in outcomes across treatment types. Given that procedure‐based registries are becoming more common in the vascular community, construction of disease‐based registries, which include phenotypic information as it becomes widely available, would be a straightforward path to follow.
These findings build on previous work by our group,5,8 in which we examined the adverse effect of a prior failed endovascular intervention on outcomes in subsequent lower extremity bypass and found a rising proportion of LEBs being performed for claudication in recent years. The present analysis adds additional insights to this work. First, we demonstrate that the overall incidence of secondary LEB has dramatically increased during the past decade. In patients with claudication, this provides evidence, albeit indirect, of a “treatment trap.” Patients, who may have foregone open surgery for claudication initially but chose to undergo PVI, are now presenting for bypass surgery in increasing numbers following failure of their PVI.1,5 Although it is generally understood that repeat procedures will have inferior outcomes compared with an index procedure, this study also serves to delineate the real‐world extent of this effect. As a result, clinicians can use these results to counsel patients regarding realistic expectations of outcomes following a secondary LEB, thereby better informing discussions of risks and benefits of intervention. Most important, the current data show that the mid‐term outcomes of LEBs are inferior in the setting of prior treatment failure and that the deleterious effects of restenosis appear to transcend the nature of the initial intervention (surgical or endovascular).
Our study has important limitations. First, while we examined traditional outcomes such as mortality and amputation‐free survival,9,12,20–21 we did not directly examine patient‐centered outcomes, such as symptom recurrence, quality‐adjusted life years, or pain‐free walking distance. Second, our study lacks data on genetic biomarkers, defined hypercoagulable states, and other phenotypic data associated with treatment failure,22–24 and, thus, the impact of these variables is impossible to assess for primary or secondary bypass. Furthermore, unlike randomized controlled trials, the technique of inverse propensity weighting can only account for measured variables, and it is therefore possible that the weighted cohorts differ from each other by an unmeasured factor that is biasing the results of the model. Third, our dataset does not contain cost‐related data. There is an unmet need in understanding how this apparent “epidemic of restenosis” in PAD fits into the national discussion around cost‐effectiveness and cost saving, particularly because the long‐term implications (and costs) of an “endovascular first” strategy are not well understood. Additionally, given the demographics of the hospitals in our region, our dataset contains few nonwhite patients, limiting our generalizability in high‐risk subgroups such as African American patients.16 Our study also underestimates the true overall impact of restenosis on surgical practice, because we only considered 1 limb per subject and only the first LEB that was recorded in the database. Fourth, data within our registry are self‐reported, and while audits of our prior work have yet to reveal systematic underreporting of adverse events, this potential exists.5,25 Finally, given the observational nature of our dataset, we are obviously unable to discern if those patients treated with secondary LEB following a failed PVI would have achieved better outcomes if they were treated initially with LEB. Although we used inverse propensity weighting to account for differences between groups, confounding by indication and anatomic distributions of disease undoubtedly represents a significant limitation to the inferences allowable by our findings.
In conclusion, the rate of secondary bypass operations for infrainguinal PAD has increased dramatically in recent years, as patients with both claudication and CLI are more likely to receive LEB following a failed prior PVI or LEB in that limb. Our data indicate that nearly 1 of 2 LEBs currently performed is in the setting of a prior failed infrainguinal revascularization in the same limb. Patients undergoing secondary LEB have poorer outcomes than patients who undergo LEB as a primary procedure, regardless of the nature of the first intervention. Efforts to reduce this rising burden of restenosis in the periphery should focus on the development of evidence‐based algorithms to guide patient selection for initial treatment, developing new technologies to improve the durability of both endovascular and surgical interventions, and closer examination of the impact of failed revascularizations on functional and quality of life outcomes to improve both the quality and value of PAD care.
Sources of Funding
Dr Goodney was supported by a K‐08 Career Development Award from the National Heart, Lung, and Blood Institute (1K08HL05676‐01) and an American Vascular Association/American College of Surgeons Supplemental Funding Award.
Disclosures
None.
References
- 1.Goodney PP, Beck AW, Nagle J, Welch HG, Zwolak RM. National trends in lower extremity bypass surgery, endovascular interventions, and major amputations. J Vasc Surg. 2009; 50:54-60 [DOI] [PubMed] [Google Scholar]
- 2.Nowygrod R, Egorova N, Greco G, Anderson P, Gelijns A, Moskowitz A, McKinsey J, Morrissey N, Kent KC. Trends, complications, and mortality in peripheral vascular surgery. J Vasc Surg. 2006; 43:205-216 [DOI] [PubMed] [Google Scholar]
- 3.Rowe VL, Lee W, Weaver FA, Etzioni D. Patterns of treatment for peripheral arterial disease in the United States: 1996–2005. J Vasc Surg. 2009; 49:910-917 [DOI] [PubMed] [Google Scholar]
- 4.Sachs T, Pomposelli F, Hamdan A, Wyers M, Schermerhorn M. Trends in the national outcomes and costs for claudication and limb threatening ischemia: angioplasty vs bypass graft. J Vasc Surg. 2011; 54:1021.e1-1031.e1 [DOI] [PubMed] [Google Scholar]
- 5.Simons JP, Schanzer A, Nolan BW, Stone DH, Kalish JA, Cronenwett JL, Goodney PPVascular Study Group of New England Outcomes and practice patterns in patients undergoing lower extremity bypass. J Vasc Surg. 2012; 55:1629-1636 [DOI] [PMC free article] [PubMed] [Google Scholar]
- 6.Gur I, Lee W, Akopian G, Rowe VL, Weaver FA, Katz SG. Clinical outcomes and implications of failed infrainguinal endovascular stents. J Vasc Surg. 2011; 53:658-666 [DOI] [PubMed] [Google Scholar]
- 7.Vogel TR, Dombrovskiy VY, Carson JL, Graham AM. In‐hospital and 30‐day outcomes after tibioperoneal interventions in the US medicare population with critical limb ischemia. J Vasc Surg. 2011; 54:109-115 [DOI] [PubMed] [Google Scholar]
- 8.Nolan BW, De Martino RR, Stone DH, Schanzer A, Goodney PP, Walsh DW, Cronenwett JLVascular Study Group of New England Prior failed ipsilateral percutaneous endovascular intervention in patients with critical limb ischemia predicts poor outcome after lower extremity bypass. J Vasc Surg. 2011; 54:730-735 [DOI] [PMC free article] [PubMed] [Google Scholar]
- 9.Bradbury AW, Adam DJ, Bell J, Forbes JF, Fowkes FG, Gillespie I, Ruckley CV, Raab GMBASIL Trial Participants Bypass versus angioplasty in severe ischaemia of the Leg (BASIL) trial: analysis of amputation free and overall survival by treatment received. J Vasc Surg. 2010; 51:18S-31S [DOI] [PubMed] [Google Scholar]
- 10.Joels CS, York JW, Kalbaugh CA, Cull DL, Langan EM, III, Taylor SM. Surgical implications of early failed endovascular intervention of the superficial femoral artery. J Vasc Surg. 2008; 47:562-565 [DOI] [PubMed] [Google Scholar]
- 11.Cronenwett JL, Likosky DS, Russell MT, Eldrup‐Jorgensen J, Stanley AC, Nolan BWVSGNNE A regional registry for quality assurance and improvement: the Vascular Study Group of Northern New England (VSGNNE). J Vasc Surg. 2007; 46:1093-1101 [DOI] [PubMed] [Google Scholar]
- 12.Conte MS, Geraghty PJ, Bradbury AW, Hevelone ND, Lipsitz SR, Moneta GL, Nehler MR, Powell RJ, Sidawy AN. Suggested objective performance goals and clinical trial design for evaluating catheter‐based treatment of critical limb ischemia. J Vasc Surg. 2009; 50:1461-1473 [DOI] [PubMed] [Google Scholar]
- 13.Curtis LH, Hammill BG, Eisenstein EL, Kramer JM, Anstrom KJ. Using inverse probability‐weighted estimators in comparative effectiveness analyses with observational databases. Med Care. 2007; 45:S103-S107 [DOI] [PubMed] [Google Scholar]
- 14.Cole SR, Hernan MA. Adjusted survival curves with inverse probability weights. Comput Methods Programs Biomed. 2004; 75:45-49 [DOI] [PubMed] [Google Scholar]
- 15.MacKenzie TA, Brown JR, Likosky DS, Wu Y, Grunkemeier GL. Review of case‐mix corrected survival curves. Ann Thorac Surg. 2012; 93:1416-1425 [DOI] [PubMed] [Google Scholar]
- 16.Nguyen LL, Hevelone N, Rogers SO, Bandyk DF, Clowes AW, Moneta GL, Lipsitz S, Conte MS. Disparity in outcomes of surgical revascularization for limb salvage: race and gender are synergistic determinants of vein graft failure and limb loss. Circulation. 2009; 119:123-130 [DOI] [PMC free article] [PubMed] [Google Scholar]
- 17.Conrad MF, Cambria RP, Stone DH, Brewster DC, Kwolek CJ, Watkins MT, Chung TK, LaMuraglia GM. Intermediate results of percutaneous endovascular therapy of femoropopliteal occlusive disease: a contemporary series. J Vasc Surg. 2006; 44:762-769 [DOI] [PubMed] [Google Scholar]
- 18.Ryer EJ, Trocciola SM, DeRubertis B, Lam R, Hynecek RL, Karwowski J, Bush HL, Mureebe L, McKinsey JF, Morrissey NJ, Kent KC, Faries PL. Analysis of outcomes following failed endovascular treatment of chronic limb ischemia. Ann Vasc Surg. 2006; 20:440-446 [DOI] [PubMed] [Google Scholar]
- 19.Meier GH. Current literature for evidence‐based infrainguinal endovascular treatment. Semin Vasc Surg. 2008; 21:210-216 [DOI] [PubMed] [Google Scholar]
- 20.Schanzer A, Mega J, Meadows J, Samson RH, Bandyk DF, Conte MS. Risk stratification in critical limb ischemia: derivation and validation of a model to predict amputation‐free survival using multicenter surgical outcomes data. J Vasc Surg. 2008; 48:1464-1471 [DOI] [PMC free article] [PubMed] [Google Scholar]
- 21.Goodney PP, Nolan BW, Schanzer A, Eldrup‐Jorgensen J, Bertges DJ, Stanley AC, Stone DH, Walsh DB, Powell RJ, Likosky DS, Cronenwett JLVascular Study Group of Northern New England Factors associated with amputation or graft occlusion one year after lower extremity bypass in northern New England. Ann Vasc Surg. 2010; 24:57-68 [DOI] [PubMed] [Google Scholar]
- 22.Owens CD, Ho KJ, Conte MS. Risk factors for failure of lower‐extremity revascularization procedures: are they different for bypass and percutaneous procedures? Semin Vasc Surg. 2008; 21:143-153 [DOI] [PubMed] [Google Scholar]
- 23.Hackam DG, Anand SS. Emerging risk factors for atherosclerotic vascular disease: a critical review of the evidence. JAMA. 2003; 290:932-940 [DOI] [PubMed] [Google Scholar]
- 24.Owens CD, Kim JM, Hevelone ND, Gasper WJ, Belkin M, Creager MA, Conte MS. An integrated biochemical prediction model of all‐cause mortality in patients undergoing lower extremity bypass surgery for advanced peripheral artery disease. J Vasc Surg. 2012; 56:686-695 [DOI] [PMC free article] [PubMed] [Google Scholar]
- 25.Cronenwett JL, Kraiss LW, Cambria RP. The society for vascular surgery vascular quality initiative. J Vasc Surg. 2012; 55:1529-1537 [DOI] [PubMed] [Google Scholar]