

Abstract
Neurons of the Drosophila central brain fall into approximately 100 paired groups, termed lineages. Each lineage is derived from a single asymmetrically-dividing neuroblast. Embryonic neuroblasts produce 1,500 primary neurons (per hemisphere) that make up the larval CNS followed by a second mitotic period in the larva that generates approximately 10,000 secondary, adult-specific neurons. Clonal analyses based on previous works using lineage-specific Gal4 drivers have established that such lineages form highly invariant morphological units. All neurons of a lineage project as one or a few axon tracts (secondary axon tracts, SATs) with characteristic trajectories, thereby representing unique hallmarks. In the neuropil, SATs assemble into larger fiber bundles (fascicles) which interconnect different neuropil compartments. We have analyzed the SATs and fascicles formed by lineages during larval, pupal, and adult stages using antibodies against membrane molecules (Neurotactin/Neuroglian) and synaptic proteins (Bruchpilot/N-Cadherin). The use of these markers allows one to identify fiber bundles of the adult brain and associate them with SATs and fascicles of the larval brain. This work lays the foundation for assigning the lineage identity of GFP-labeled MARCM clones on the basis of their close association with specific SATs and neuropil fascicles, as described in the accompanying paper (Wong et al., 2013. Postembryonic lineages of the Drosophila brain: II. Identification of lineage projection patterns based on MARCM clones. Submitted.).
Keywords: Brain, Lineage, Circuitry, Drosophila, Mapping, Metamorphosis
Introduction
The central brain and ventral ganglion of Drosophila is formed by an estimated 30,000 neurons which are generated from a pool of embryonically-derived stem cells, called neuroblasts, in a fixed lineage mechanism. This means that each neuroblast represents a genetically-distinct cell, characterized by the expression of a specific set of transcription factors (Doe, 1992; Urbach et al., 2003; Urbach and Technau, 2003a, 2003b). Each neuroblast gives rise to a group of neurons that is consistent in type and number across all individuals. Embryonic neuroblasts undergo several (5–10) rounds of asymmetric divisions, generating lineages of primary neurons that differentiate and make up the functional larval CNS (Larsen et al., 2009). After a period of mitotic quiescence that extends from late embryogenesis to the end of the first larval instar, neuroblasts enter a second, longer phase of proliferation which gives rise to adult-specific secondary neurons. Lineages constitute units, not only in terms of development (shared gene expression with the parent neuroblast), but also in terms of morphology. In most cases, all neurons of a given lineage extend their axons as one or two coherent fiber bundles along invariant trajectories in the brain neuropil and innervate a specific set of neuropil compartments (Hartenstein et al., 2008; Ito and Awasaki, 2008). Well-described examples are the four mushroom body lineages (Crittenden et al., 1998; Ito et al., 1997) and the four lineages that interconnect the antennal lobe (olfactory center) with the mushroom body input domain, the calyx (Das et al., 2008, 2013; Lai et al., 2008; Stocker et al., 1990; Yu et al., 2010). The development and anatomical projection of most lineages remains largely unknown; ascertaining this knowledge and using it to generate an accurate map of Drosophila brain circuitry at the level of neuron populations (“macro-circuitry”) is an important project followed by us and others over the past several years.
Previous studies have provided detailed analyses of the lineages of the central brain, ventral ganglion (“ventral nerve cord”), and optic lobe at the embryonic and late larval stage, as well as of specific neural subtypes in the adult CNS (Bausenwein et al., 1992; Fischbach and Dittrich, 1989; Helfrich-Förster et al., 2007; Huser et al., 2012; Kunz et al., 2012; Mao and Davis, 2009; Pereanu and Hartenstein, 2006; Schmidt et al., 1997; Seibert and Urbach, 2010; Shafer et al., 2006; Sprecher et al., 2011; Stocker et al., 1990; Truman et al., 2004). In the embryo, lineages are represented by their parent neuroblasts, which have been mapped with respect to gene expression patterns and several anatomical landmarks (Doe, 1992; Hartenstein and Campos-Ortega, 1984; Urbach et al., 2003; Urbach and Technau, 2003a, 2003b; Younossi-Hartenstein et al., 1996). Systematic dye-labeling of neuroblasts has been used to image primary lineages of the ventral nerve cord at the late embryonic stage (Bossing et al., 1996; Schmid et al., 1999; Schmidt et al., 1997). Detailed knowledge of lineages also exists for the late larval stage, where maps of the secondary lineages of the ventral nerve cord (Truman et al., 2004) and brain (Cardona et al., 2010a; Dumstrei et al., 2003a; Pereanu and Hartenstein, 2006) were generated. At the late larval stage, antibody markers reveal secondary neuronal cell bodies and their characteristic fiber bundles (secondary axon tracts or SATs), most of which have been born by this time. Lineages are defined by several traits: the position at which an SAT enters the neuropil and the pathway it follows, giving each a distinct morphological profile. MARCM labeling (Lee and Luo, 2001) of secondary lineages provided an additional level of detail. Furthermore, for a small number of lineages, identified lacZ and Gal4 reporters (Brand and Perrimon, 1993), which mark single or very few lineages, have been used to follow their development, in some cases, all the way from embryo to adult stages (Kumar et al., 2009a; Pereanu et al., 2010; Spindler and Hartenstein, 2010; Spindler and Hartenstein, 2011). These studies made it clear that individual SATs, or small sets of SATs of neighboring lineages, form the “gross anatomical” fiber bundles (fascicles) of the brain. Fascicles, often accompanied by agglomerations of glial processes, can be recognized in brain confocal sections labeled with antibodies against neuronal membrane molecules and synaptically-localized proteins (Bieber et al., 1989; Hortsch et al., 1990; Iwai et al., 1997; Wagh et al., 2006). In the latter case (e.g. N-Cadherin), fascicles appear as signal-negative spaces, since they exclude synapses. Our group has previously established a map of the most prominent fascicles for the larval and adult brain (Pereanu et al., 2010). In this and the accompanying paper (Wong et al., 2013), extending upon our previous works, we will (1) assign the SATs of all secondary lineages defined in the larva to distinct neuropil fascicles; (2) follow SATs through pupal stages into the adult; and (3) use the SAT map of the adult brain to identify MARCM clones with their corresponding secondary lineages.
A major prerequisite for our project is to recognize SATs and neuropil fascicles throughout metamorphosis. The anatomy of the pupal brain of Drosophila or any other holometabolous insect has so far not been described in great detail. With a focus on individually-labeled cells in the Manduca CNS it was shown several decades ago that primary neurons, including motor neurons and interneurons, undergo a remodeling process whereby most neurite branches are first pruned back during early metamorphosis and then regrow in a new, adult-specific pattern (reviewed in Levine, 1984; Levine and Truman, 1985; Libersat and Duch, 2002; Tissot and Stocker, 2000; Truman and Booker, 1986; Truman and Reiss, 1988; Weeks, 2003). The same process was observed for the Drosophila embryonically-born Kenyon cells or mushroom body neurons (reviewed in Jefferis et al., 2002; Technau and Heisenberg, 1982). Secondary neurons, which represent the vast majority of neurons in the adult brain, begin to differentiate approximately one day after the onset of metamorphosis, sending out branches with terminal fibers and forming synapses (Dumstrei et al., 2003a; reviewed in Hartenstein et al., 2008; Singh and Singh, 1999; Stocker et al., 1997). This process leads to a steady increase of neuropil volume. Volume measurements taken in Drosophila (Power, 1952) and other holometabolans (Nordlander and Edwards, 1969) show that at around 24 h after puparium formation (P24) the neuropil takes up less than 25% of the overall brain volume; around P48 this fraction has raised to almost 50% and at eclosion it is 53%.
Throughout metamorphosis in the pupal brain, secondary axon tracts defining the adult brain lineages remain intact as cohesive fiber bundles and can be visualized using antibody markers against neuronal membrane molecules, such as Neurotactin or Neuroglian (Pereanu et al., 2010). We present in this paper a detailed map of all SATs for the larva, pupa, and adult. The practical importance of this map is two-fold. First, the SAT/neuropil fascicles, together with the neuropil compartments, help to define an anatomical framework to which smaller structural units (individual neurons, synapses), functional phenomena, or mutant phenotypes can be related. Second, SATs represent the hallmarks by which MARCM clones of lineages can be identified. To-date, only a small minority of lineages that continuously express a known Gal4-driver in the brain have been followed throughout development. Several groups (Ito et al., 2013; Yu et al., 2013; Wong et al., 2013) have now generated collections of lineage-specific MARCM clones, induced at the early larval stage, thereby marking all secondary neurons of a particular lineage. In all clones, neuronal cell bodies and their fiber tracts are easily visible, making it possible to assign a given clone to the lineage it represents.
Materials and methods
Fly stocks
Flies were grown at 25 °C using standard fly media unless otherwise noted. For Figs. 8 and 11, 1407-Gal4 (Mz1407; Bloomington #8751), mapping out to the insc locus, was used as a driver line to visualize all secondary lineages at various stages of development ranging from L3 to P48.
Fig. 8.


Larval-to-adult development of lineages of the anterior brain. Panels of each side of this split figure are arranged in three rows and three columns. Each row represents one stage, indicated at the top-left corner (L3, A–B; P12, C–D; P24, E–F; P32, G–H; P48, I–J; Adult, K–L). All panels show z-projections of contiguous confocal sections of a brain hemisphere labeled with BP106 or BP104 and N-Cad, representing brain slices of 15–20 μm thickness. Z-projections of the first and second column (A/A′, C/C′, E/E′, G/G′, I/I′, K/K′) correspond to an anterior level (mushroom body lobes). Both BP104-labeling (secondary neurons, SATs and fascicles; green) and N-Cad labeling (neuropil; red) is shown in left panels; middle panels show BP104 labeling only (white; A′, C′, E′, G′, I′, K′). Panels of the right column (B, D, F, H, J, L) represent a “subanterior” level (ellipsoid body/primordium of ellipsoid body). Compartments visible at the anterior neuropil surface are annotated (white lettering, panels of left column; see Table 2 for complete listing of abbreviations). SATs and HSATs of individual lineages are annotated with a unique numerical identifier (see Table 1). Numbers followed by an asterisk indicate tracts formed by more than one SAT (typically two SATs) which cannot be followed separately. For example, “20*” stands for “20 and 21”. Lower case letters (‘a,’ ‘d,’ ‘i,’ ‘m,’ ‘p,’ or ‘v’) indicate HSATs formed by individual hemilineages within a particular lineage. The red circle in each panel marks the location of the peduncle. The blue arrow in (A), (C), an d (E) marks the entry point for the SATs of BAmv1/2. Scale bar: 50 μm.
Fig. 11.

Larval-to-adult development of lineages of the posterior brain. The composition of this figure follows the same plan explained for Fig. 8, with panels of each side of this split figure arranged in three rows and three columns. Rows represent stages, indicated by at upper-left corner of A, C, E, G, I, and K. Z-projections of the first and second column (A/A′, C/C′, E/E′, G/G′, I/I′, K/K′) correspond to a posterior level (mushroom body calyx; protocerebral bridge) where SATs approach the neuropil surface. Panels of the right column (B, D, F, H, J, L) represent a “subposterior” level (posterior surface of fan-shaped body/primordium of fan-shaped body). Compartments visible at the posterior neuropil surface are annotated (white lettering, panels of left column; see Table 2 for complete listing of abbreviations). SATs and HSAT’s of individual lineages are annotated with a numerical identifier (see Table 1). Scale bar: 50 μm.
Markers
The Bruchpilot (Brp) antibody (Developmental Studies Hybridoma Bank, DSHB; nc82) labels synapses and served as a marker for neuropil. It is a mouse monoclonal antibody from a large library generated against Drosophila head homegenates. The antibody recognizes the active zone protein Brp, which forms protein bands of 190 and 170 kDa in Western blots of homogenized Drosophila heads (Wagh et al., 2006).
The N-Cadherin antibody (DSHB; DN-EX No. 8), another marker for neuropil, is a mouse monoclonal antibody raised against a peptide encoded by Exon 8, amino acid residues 1210–1272 of the Drosophila CadN gene. The antibody detected two major bands of 300-kDa and 200-kDa molecular weights on Western blot of S2 cells only after transfection with a cDNA encoding the N-Cadherin protein (Iwai et al., 1997).
The Neurotactin antibody (DSHB; BP106) is a mouse monoclonal antibody generated in a screen for novel antigens expressed on the surface of developing neurons in the Drosophila embryo (Patel et al., 1987). The antibody was used to screen a 9–12-h embryonic Drosophila phage-gt11 cDNA library (Snow et al., 1987) that identified two phages containing a 435-bp EcoRI fragment that did not include the full open reading frame. A radiolabeled probe derived from this fragment was used to screen the cDNA library and identify a large open reading frame (Hortsch et al., 1990). The deduced amino-terminal sequence of this cDNA (11 amino acids) is identical to protein microsequence data from affinity-purified Neurotactin protein (de la Escalera et al., 1990).
The Neuroglian antibody (DSHB; BP104) labels secondary neurons and axons in the adult brain. It is a mouse monoclonal antibody from a library generated against isolated Drosophila embryonic nerve cords (Bieber et al., 1989).
Immunohistochemistry
Samples were fixed in 4% methanol-free formaldehyde in phosphate buffer saline (PBS, Fisher-Scientific, pH=7.4; Cat No. #BP399-4). Tissues were permeabilized in PBT (PBS with 0.3% Triton X-100, pH=7.4) and immunohistochemistry was performed using standard procedures (Ashburner, 1989). The following antibodies were provided by the Developmental Studies Hybridoma Bank (Iowa City, IA): mouse anti-Neurotactin (BP106, 1:10), rat anti-DN-Cadherin (DN-EX #8, 1:20), mouse anti-Neuroglian (BP104, 1:30), and mouse anti-Bruchpilot (nc82, 1:30). Secondary antibodies, IgG1 (Jackson ImmunoResearch; Molecular Probes) were used at the following dilutions: Alexa 546-conjugated anti-mouse (1:500), DynaLight 649-conjugated anti-rat (1:400), Alexa 568-conjugated anti-mouse (1:500).
Clonal analysis
Clones were generated by Flp-mediated mitotic recombination at homologous FRT sites. Larval neuroblast clones were generated by MARCM (Lee and Luo, 2001; see below) or the Flp-out construct (Zecca et al., 1996; Ito et al., 1997).
Mitotic clone generation by Flp-out
To generate secondary lineage clones in the larva using the Flp-out technique; flies bearing the genotype:
hsflp, elavC155-Gal4/+; UAS-FRT-rCD2, y+, stop-FRT-mCD8::GFP
hsflp; Act5C-FRT-stop, y+-FRT-Gal4, UAS-tauLacZ/UAS-src::EGFP
Briefly, early larva with either of the above genotype were heatshocked at 38 °C for 30–40 min. elavC155-Gal4 is expressed in neurons as well as secondary neuroblasts. Third instar larval and adult brains were dissected and processed for immunohistochemistry (as described above).
Mitotic clone generation by MARCM
Mitotic clones were induced during the late first instar/early second instar stages by heat-shocking at 38 °C for 30 min to 1 h (approximately 12–44 h ALH). GFP-labeled MARCM clones contain the following genotype:
Adult MARCM clones:
hsflp/+; FRTG13, UAS-mCD8GFP/FRTG13, tub-GAL80; tub-Gal4/+ or
FRT19A GAL80, hsflp, UAS-mCD8GFP/elavC155-Gal4, FRT19A; UAS-CD8GFP/+
Larval MARCM clones:
hsflp, elavC155-Gal4, FRTG13, UAS-mCD8GFP/Y or hsflp, elavC155-Gal4, FRTG13, UAS-mCD8GFP/; FRT42D, tub-Gal80/FRT42D.
Confocal microscopy
Staged Drosophila larval and adult brains labeled with suitable markers were viewed as whole-mounts by confocal microscopy [LSM 700 Imager M2 using Zen 2009 (Carl Zeiss Inc.); lenses: 40 × oil (numerical aperture 1.3)]. Complete series of optical sections were taken at 2-μm intervals. Captured images were processed by ImageJ or FIJI (National Institutes of Health, http://rsbweb.nih.gov/ij/ and http://fiji.sc/) and Adobe Photoshop.
2D registration of clones to standard brain
Brains with MARCM clones were labeled with DN-cad and BP104 to image the SAT and projection envelope relative to the BP104-positive fascicles and DN-cad-positive neuropil compartments. Fasciculation of the SAT of a clone with a fascicle allowed for its identification with a lineage, or lineage pair. To generate the figure panels z-projections of the individual MARCM clones were registered digitally with z-projections of a standard brain labeled with DN-cad (“2D registration”). Additional details are provided in the accompanying paper (Wong et al., 2013).
Generation of three-dimensional models
Digitized images of confocal sections were imported into FIJI (Schindelin et al., 2012; http://fiji.sc/). Complete series of optical sections were taken at 2-μm intervals. Since sections were taken from focal planes of one and the same preparation, there was no need for alignment of different sections. Models were generated using the 3-dimensional viewer as part of the FIJI software package. Digitized images of confocal sections were imported using TrakEM2 plugin in FIJI software (Cardona et al., 2012). Surface renderings of larval and adult brains stained with anti-Bruchpilot were generated as volumes in the 3-dimensional viewer in FIJI. Cell body clusters were indicated on surface renderings using TrakEM2. Digital atlas models of cell body clusters and SATs were created by manually labeling each lineage and its approximate cell body cluster location in TrakEM2.
Results
The development of secondary lineages during metamorphosis
At the late larval stage, secondary lineages comprise elongated, radially-oriented clusters of approximately 150 cells that tile the brain cortex. Each cluster produces an axon bundle (secondary axon tract: SAT) whose entry point into the neuropil and pathway followed within the neuropil is distinctive and highly invariant (Fig. 1A and B). Pathways of most SATs can be individually followed within the neuropil; in some cases, two or more lineages form a bundle in which the individual SATs cannot be distinguished (Fig. 1C–E; Table 1). A number of neuroblasts generate lineages which give rise to two dissimilar SATs; these are assumed to be the axon bundles belonging to two hemilineages (HSATs; Fig. 1A–E, Table 1). Finally, the large type II lineages, numbering eight in total (reviewed in Brand and Livesey, 2011), are composed of multiple sublineages, each emitting a separate axon bundle (SSATs; Fig. 1F–J). Only the most conspicuous of these fascicles can be followed and are listed in Table 2.
Fig. 1.

Secondary lineages form SATs during larval development. (A) Schematic representation of a Type I lineage. A single neuroblast (in grey) undergoes several rounds of asymmetric division to produce an intermediate progenitor, the ganglion mother cell (GMC, navy blue). GMCs divide to produce two post-mitotic neurons. Neuronal somata remain in close proximity to the neuroblast and extend axonal fibers as a characteristic bundle (secondary axon tract, SAT) from the outer cortical region of the brain hemisphere to the inner region, the neuropil. On occasion, GMCs generate two sister populations of genetically distinct neurons, termed hemilineages, where each produces its own axon tract, HSAT (shown in red and blue in A). (B) Z-projection of frontal confocal section of a L3 MARCM neuroblast clone of the BAmd1 lineage induced during the larval period. BAmd1 contains two hemilineages where a large cell body cluster emits two fiber bundles, identifiable HSAT’s. The larval neuropil is labeled in purple with N-Cadherin. ((C)–(E)) Three Z-projections, shown at different levels of the same BP106-labeled brain hemispheres. At the level shown in C, the cell body clusters and proximal SATs of three lineages, BAmd1 (#13), DALcm1 (#20) and DALcm2 (#21) are visible. In (D), the SAT of BAmd1 splits to form two HSATs (#13d and #13v). DALcm1 (#20), and DALcm2 (#21) are two neighboring lineages, each with HSATs (#20m/21m, #20l/21l), which come so close that they can no longer be distinguished. (F) Schematic of Type II lineage. A single neuroblast divides to generate multiple intermediate progenitor cells, each capable of undergoing several rounds of asymmetric divisions. Each asymmetrically dividing progenitor cell gives rise to symmetrically dividing GMCs to produce a sub-lineage and corresponding SAT (SSAT). Each SSAT is unique in composition and represented in different colors. ((G)–(J)) The Type II lineage DPMm1 (#53), as shown by a MARCM clone in an L3 brain ((G)); neuropil, in purple, labeled with anti-N-Cadherin and with the global marker BP106 ((H)–(J)). DPMm1 contains multiple SSAT’s, all with different trajectories (note morphology of tracts #53a–c). Scale bars: 25 μm ((B) and (G)) and 10 μm ((C)–(E), (H)–(J)).
Table 1.
List of abbreviations of neuropil fascicles (left), compartments (center), and entry portals of lineage-associated tracts (right).
| Fascicles | Abbr. | Compartments | Abbr. | Entry portals | Abbr. |
|---|---|---|---|---|---|
| Anterior–dorsal commissure | ADC | Antennal lobe | AL | Anterior entry portal of the ML | ptML a |
| Antennal lobe commissure | ALC | Antenno-mechanosensory and motor center | AMMC | Anterior portal of the lateral horn | ptLH a |
| Antennal lobe tract | ALT | Anterior optic tubercle | AOTU | Anterior superior lateral protocerebrum portal | ptSLP a |
| Inner antennal lobe tract | iALT | Anterior periesophageal neuropil | PENPa | Antero-dorsal entry portal of the VLP | ptVLP ad |
| Medial antennal lobe tract | mALT | Bulb | BU | Dorrso-lateral superior ventro-lateral protocerebrum portal | ptVLP dls |
| Outer antennal lobe tract | oALT | Ellipsoid body | EB | Dorsal antennal lobe portal | ptAL d |
| Anterior optic tract | AOT | Fan-shaped body | FB | Dorsal spur portal | ptSP d |
| Anterior superior transverse fascicle | trSA | Inferior protocerebrum | IP | Dorso-lateral entry portal of the ML | ptML dl |
| Central protocerebral descending fascicle | deCP | Anterior IP | IPa | Dorso-lateral inferior ventro-lateral protocerebrum portal | ptVLP dli |
| Cervical Connective | CCT | Lateral IP | IPl | Dorso-lateral portal of protocerebral bridge | ptPB dl |
| Commisure of the lateral accessory lobe | LALC | Medial IP | IPm | Dorso-lateral vertical lobe portal | ptVL dl |
| Dorsal commissure of anterior subesophageal ganglion | DCSA | Posterior IP | IPp | Dorso-medial entry portal of the ML | ptML dm |
| Dorsolateral root of the fan-shaped body | dlrFB | Lateral accessory lobe | LAL | Dorso-medial portal of protocerebral bridge | ptPB dm |
| Fronto-medial commissure | FrMC | Lateral horn | LH | Dorso-medial ventro-lateral protocerebrum portal | ptVLP dm |
| Great commissure | GC | Mushroom body | MB | Dorso-medial vertical lobe portal | ptVL dm |
| Horizontal ventrolateral protocerebral tract | hVLPT | Calyx | CA | Lateral antennal lobe portal | ptAL l |
| Intermediate superior transverse fascicle | trSI | Medial lobe | ML | Lateral portal of calyx | ptCA l |
| Deep bundle of irSI | trSI d | Peduncle | PED/P | Lateral portal of the posterior lateral protocerebrum | ptPLP l |
| Superficial component of trSI | trSI s | Spur | SP | Lateral portal of the superior lateral protocerebrum | ptSLP l |
| Lateral ellipsoid fascicle | LE | Vertical lobe | VL | Medial portal of calyx | ptCA m |
| Anterior LE | LEa | Noduli | NO | Posterior inferior portal of the posterior lateral protocerebrum | ptPLP pi |
| Posterior LE | LEp | Posterior lateral protocerebrum | PLP | Posterior portal of superior lateral protocerebrum | ptSLP p |
| Lateral equatorial fascicle | LEF | Protocerebral bridge | PB | Posterior portal of the lateral horn | ptLH p |
| Anterior LEF | LEFa | Subesophageal ganglion | SEG | Posterior superior portal of the posterior lateral protocerebrum | ptPLP ps |
| Posterior LEF | LEFp | Superior protocerebrum | SP | Posterior ventro-medial cerebrum portal | ptVMCpo |
| Medial equatorial fascicle | MEF | Superior intermediate protocerebrum | SIP | Postero-lateral portal of superior lateral protocerebrum | ptSLP pl |
| Medial root of the fan-shaped body | mrFB | Superior lateral protocerebrum | SLP | Postero-medial portal of superior lateral protocerebrum | ptSLP pm |
| Median bundle | MBDL | Anterior SLP | SLPa | Ventral antennal lobe portal | ptAL v |
| Oblique posterior fascicle | obP | Posterior SLP | SLPp | Ventral entry portal of the VLCi | ptVLCi v |
| Posterior commissure of the posterior lateral protocerebrum | pPLPC | Superior medial protocerebrum | SMP | Ventral portal of calyx | ptCA v |
| Posterior lateral fascicle | PLF | Ventro-lateral cerebrum | VLC | Ventral portal of protocerebral bridge | ptPB v |
| External component of PLF | PLFe | Anterior VLC | VLCa | Ventral spur portal | ptSP v |
| Dorsolateral component of PLF | PLFdl | Inferior VLC | VLCi | Ventro-lateral antennal lobe portal | ptAL vl |
| Dorsomedial component of PLF | PLFdm | Lateral VLC | VLCl | Ventro-lateral inferior ventro-lateral protocerebrum portal | ptVLP vli |
| Ventral component of PLF | PLFv | Ventro-medial cerebrum | VMC | Ventro-lateral portal of calyx | ptCA vl |
| Posterior superior transverse fascicle | trSP | Anterior VMC | VMCa | Ventro-lateral superior ventro-lateral protocerebrum portal | ptVLP vls |
| Lateral trSP | trSPl | Inferior VMC | VMCi | Ventro-lateral vertical lobe portal | ptVL vl |
| Medial trSP | trSPm | Post-commissural VMC | VMCpo | Ventro-medial antennal lobe portal | ptAL vm |
| Sub-ellipsoid commissure | SuEC | Pre-commissural VMC | VMCpr | Ventro-medial ventro-lateral protocerebrum portal | ptVLP vm |
| Subesophageal-protocerebral system | SPS | Superior VMC | VMCs | Ventro-medial vertical lobe portal | ptVL vm |
| Superior arch commissure | SAC | Ventro-lateral protocerebrum | VLP | ||
| Superior commissure of the posterior lateral protocerebrum | sPLPC | Anterior VLP | VLPa | ||
| Superior lateral longitudinal fascicle | loSL | Posterior VLP | VLPp | ||
| Anterior loSL | loSLa | ||||
| Posterior loSL | loSLp | ||||
| Superior medial longitudinal fascicle | loSM | ||||
| Anterior loSM | loSMa | ||||
| Posterior loSM | loSMp | ||||
| Supra-ellipsoid body commissure | SEC | ||||
| Ventral fibrous center | VFC | ||||
| Ventral longitudinal fascicle | loV | ||||
| Intermediate loV | loVIa | ||||
| Lateral loV | loVLa | ||||
| Medial loV | loVMa | ||||
| Posterior–lateral loV | loVP | ||||
| Vertical posterior fascicle | vP | ||||
| Vertical tract of the superior lateral protocerebrum | vSLPT | ||||
| Vertical tract of the ventro-lateral protocerebrum | vVLPT |
Table 2.
List of secondary lineages of the Drosophila brain.
| Lineage name | Lineage SAT number | Gal4 lineage marker | Entry portal | Separation of Hemilineages | Fascicle joined by lineage | Visibility of SAT | Commissure joined by lineage |
|---|---|---|---|---|---|---|---|
| BAla1 | 1 | Per1 | ptAL vl | mlALT | V v T | ||
| BAla2 | 2 | OK3712 | ptAL vl | 0 | V v | ||
| BAla3 | 3 | En1 | ptAL vl | 0 | V V O | ||
| BAla4 | 4 | ||||||
| Balc | 5d | GH1461 | ptAL l | s | mALT | v v T | |
| 5v | ptAL vl | loVI | V V O | GC | |||
| BAlp1 | 6 | ptVLP vm | 0 | V V O | |||
| BAlp2 | 7 | ptVLP vm | loVL | V V v | |||
| BAlp3 | 8 | ptVLP vm | loVL>vP | V V V | |||
| BAlp4 | 9 | ptAL vl | mALT | V V T | |||
| Balv | 10 | ptVLCi v | 0 | V V | |||
| BAmas1 | 11 | ptAL vm | MBDL | V t | |||
| BAmas2 | 12 | Emc3 | ptAL vm | MBDL | |||
| BAmd1 | 13 d | ptVL vm | s | 0 | V O | FrMC | |
| 13 v | ptAL d | 0 | V V | ALC | |||
| BAmd2 | 14 | 0 | O O | ALC | |||
| BAmv1 | 15 d | Per1 | ptAL v | loVM>LEp | V V T | ||
| 15 p | loVM | V V V | |||||
| 15 dn | V | ||||||
| BAmv2 | 16 | ptAL v | loVM | V V T | |||
| BAmv3 | 17 | GH1461 | ptAL d | mALT | O O T | ||
| DALcl1 | 18 d | STAT1 | ptSP d | a | 0 | V T | |
| 18 v | ptSP v | 0 | V V v | SuEC | |||
| 18 vn | MEF | O | |||||
| DALcl2 | 19 d | ptSP d | a | 0 | V T | SuEC | |
| 19 v | ptSP v | LEa | V V T | ||||
| 19 dn | 0 | V | |||||
| DALcm1 | 20/21m | ptVL vm | a | 0 | V O | FrMC | |
| 20/21 v | ptVL vl | deCP | V V v | ||||
| DALcm2 | a | ||||||
| DALd | 22 | ptVL vl | deCP | V V V | |||
| DALl1 | 23 r | ptVLP dm | trSIi | V V O | |||
| 23 v | 0 | V | |||||
| DALl2 | 24 | ptVLP vm | 0 | v v | |||
| DALv1 | 25 | ptSP v | LEFa | V V V | GC | ||
| DALv2 | 26 | Per1 | ptSP v | LEa | V t | ||
| DALv3 | 27 d | En1 | ptSP v | LEa | V t | SEC | |
| 27 v | ptSP v | LEa | V t | SuEC | |||
| DAMd1 | 28 | ptVL dm | ADC | V V | FrMC | ||
| DAMd2 | 29 | ptVL dm | loSMa | V V v | |||
| DAMd3 | 30 | ||||||
| DAMv1 | 31 | ptVL dm | 0 | V V | |||
| DAMv2 | 32 | ||||||
| DPLal1 | 33 | ptSLP l | trSA | V T | |||
| DPLal2 | 34/35 d | ptSLP l | a | trSA | V T | ||
| 34/35 v | 0 | V T | |||||
| DPLal3 | a | ||||||
| DPLam | 36 | En1 | ptSLP a | vSLPT | V V V | ||
| DPLc1 | 37 | ptSLP pm | trSPm | VT | |||
| DPLc2 | 38 | ptSLP pm | trSPm | V T | |||
| DPLc4 | 40 | V T | |||||
| DPLc3 | 39 | ptSLP pm | 0 | V V V | |||
| DPLc5 | 41 a | ptSLP pm | S | trSPm | V T | ||
| 41 p | ptPB v | 0 | O O | ADC | |||
| DPLd | 42m | ptVL dl | s | 0 | V V V | ADC | |
| 42 p | ptVL dl | loSLa>trSId | V V V | ||||
| DPLl1 | 43 | ptSLP pl | trSPl | V t | |||
| DPLl2 | 44 p | ptSLP pl | S | loSLp | V T | ||
| 44 a | ptSLP a | vSLPT | V T | ||||
| DPLl3 | 45 p | ptSLP pl | S | loSLp | V T | ||
| 45 a | ptSLP a | vSLPT | V T | ||||
| DPLm1 | 46 | ptSLP p | 0 | V V | |||
| DPLm2 | 47 | ptSLP p | 0 | V V | |||
| DPLp1 | 48m | ptCA l | obP | V O T | sPLPC | ||
| 48 v | ptSLP pl | v v | |||||
| 48 a | ptSLP pl | 0 | V V | ||||
| DPLp2 | 49 | ||||||
| DPLpv | 50 | ptPLP ps | PLFdl | V V V | |||
| DPMl1 | 51 | ptCA v | DPPT | V O | |||
| DPMm1 | 53 a | 9D114 | ptPB dm | s | loSMp | V O T | |
| 53 b | ptPB dm | mrFB | V V | ||||
| 53 c | ptPB dm | mrFB | V V | ||||
| 53 d | ptPB dm | 0 | V v O | 0 | |||
| DPMm2 | 54 | ptPB dl | 0 | V V O | MBDLchi | ||
| DPMpl1 | 55 | ptCA m | loSMp | V T | MBDLchi | ||
| DPMpl2 | 56 | ptCA m | loSMp | V T | |||
| DPMpl3 | 57 | ptPB v | MEF | V T | GC | ||
| DPMpm1 | 58 a | 9D114 | ptPB dl | a | mALT>MBDL | V O T | |
| 58 b | ptPB dl | dlrFB | V V | ||||
| DPMpm2 | 59 a | 9D114 | ptPB dl | a | loSMp | V T | SEC chi |
| 59 b | ptPB dl | dlrFB | V V | ||||
| CM1 | 60 d | 9D114 | ptPB v | S | MEF | v T | LALC |
| 60 v | ptVMCpo | loVP | v T | ||||
| CM3 | 61 a | 9D114 | ptCA m | s | loSMp | v T | SEC |
| 61 d1 | ptPB v | MEF | v T | ||||
| 61 d2 | ptPB v | MEF | v T | ||||
| 61 v | ptVMCpo | loVP | v T | pPLPC | |||
| CM4 | 62 a | 9D114 | ptPB v | S | loSMp | v T | |
| 62 d | ptPB v | MEF | v T | ||||
| 62 v | ptVMCpo | loVP | v T | pPLPC | |||
| CM5 | 63 | ptPB v | 0 | ||||
| CP1 | 64 d | ptCA vl | obP>loSMp | V T | MBDLchi | ||
| (64 v) | ptCA v | V T | |||||
| CP2 | 65 d | ptCA l | s | obP>loSMp>OE | V T | ||
| 65 v | ptPLP ps | PLFdm | V T | ||||
| CP3 | 66 d | ptCA l | s | obP>loSMp | V T | SEC | |
| 66 v | ptPLP ps | PLFdm | V T | ||||
| CP4 | 67 | ptCA vl | obP>loSMp | V T | SEC | ||
| BLAd1 | 68 | ptSLP l | trSId | V T | |||
| BLAd2 | 69 | ptSLP l | trSId | V T | |||
| 69s | trSIs | V T | |||||
| BLAd3 | 70 | ptSLP l | trSId | V T | |||
| BLAd4 | 71 | ptSLP l | trSIi | V T | |||
| BLAl | 72 d | ptSLP l | S | trSIs | |||
| 72m | ptVLP dm | 0 | |||||
| BLAv1 | 73m | ptVLP dm | S | 0 | V V t | SAC | |
| 73 p | ptVLP dli | 0 | V V O | GC | |||
| 73 pn | 0 | V | |||||
| BLAv2 | 74m | ptVLP dls | s | 0 | V V v | postCCX | |
| 74 p | ptLH a | 0 | V V v | GC | |||
| 74 pn | 0 | v | |||||
| BLAvm | 75m | ptVLP dm | S | 0 | V V | ||
| 75 p | ptVLP dm | 0 | V V v | ||||
| BLD1 | 77 d | ptSLP l | S | trSIs | V T | ||
| 77 p | ptPLP l | 0 | V V V | ||||
| BLD2 | 78 d | ptSLP l | trSIs | V T | |||
| BLD3 | 79 d | ptSLP l | S | trSIs | V T | ||
| 79 vn | 0 | V T | |||||
| 79 a | ptVLP dls | 0 | O | ||||
| BLD4 | 80 d | ptSLP l | trSIs | V T | |||
| 80 v | 0 | v | |||||
| BLD5 | 82 | Ato1 | ptPLP l | 0 | V v | GC | |
| BLD6 | 83 | ptPLP l | 0 | V v | |||
| BLP1 | 84 | ptPLP ps | PLFe | V V | |||
| BLP2 | 85 | PLFe | |||||
| BLP3 | 86 | ptLH p | 0 | V V | |||
| BLP4 | 87 | 0 | |||||
| BLVa1 | 89 | So1 | ptLH a | 0 | v v | ||
| BLVa2 | 90 | So1 | 0 | ||||
| BLVa3 | 91 | ptVLP vli | 0 | V V | |||
| BLVa4 | 92 | 0 | |||||
| BLVp1 | 93 p | ptPLP pi | S | PLFv | V V V | GC | |
| 93 a | ptVLP vls | vVLPT | V V O | ||||
| BLVp2 | 94 p | ptPLP pi | S | PLFv | V V v | SEC | |
| 94 a | ptVLP vls | vVLPT | V V O | SAC |
Column A: Lineage names based on topology (Pereanu and Hartenstein, 2006). Shading indicates paired lineages with common tract. For lineage pairs shaded lightly, different MARCM clones were identified (see accompanying paper by Wong et al., 2013); dark shading indicates pairs for which only a single type of clone was found.
B: Number identifying lineage-associated tracts (SATs) on figures. In lineages with multiple hemilineage tracts or sublineage tracts, these are individually listed (e.g. dorsal hemilineage tract of BAlc is identified as “5d”, ventral hemilineage tract as “5v”).
C: Markers for lineages. References:
reviewed in Spindler and Hartenstein (2010).
D: Entry portal of lineage-associated tracts (for abbreviations, see Table 1).
E: Separation of hemilineages during metamorphosis. Lower case “a” signifies that hemilineage clusters and entry portals remain adjacent; lower case “s” indicates that hemilineage clusters separate; capital “S” stands for extensive shift of one or both hemilineages (separation of clusters >20 μm in adult).
F: Neuropile fascicle joined by lineage-associated tract. For abbreviations of fascicle names, see Table 1. “0” indicates that tract does not form part of any designated fascicle.
G: Traceability of lineage-associated tracts in BP104-labeled adult brain specimens. First letter refers to neuropil entry point; second letter represents proximal tract (<20 μm away from entry point), third letter distal tract. Some tracts branch off another tract (e.g. BAmv1/#15dn branches off #15d); in these cases, letter representing neuropil entry point is omitted. In cases where lineage associated tract is short (e.g. BAlv/#10), third letter indicating distal tract is omitted. “V” stands for “clearly visible”; “v” for “faintly visible”; “O” for “not visible”. “T” signifies that tract forms part off fascicle in which it cannot be distinguished from other components.
H: Commissure joined by lineage associated tract. For abbreviations, see Table 1. In cases where distal tract is not visible in adult brain (e.g. BAlc/#5v), entry into commissure is inferred from earlier, pupal specimens.
Global neuronal markers such as Neuroglian (hereafter referred to as BP104) and, to a lesser extent, Neurotactin (in the following called BP106) remain expressed post-embryonically, making it possible to follow lineages and their SATs from the larval to the adult stage (Fig. 2). The analysis presented in this paper is based on the reconstruction of lineages from BP104- and BP106-labeled brains of staged pupae fixed at close intervals, including P6, P12, P18, P24, P32, P40, P48, and P72. Whereas the relative position of SAT entry points and pathways within the neuropil remains fairly constant, a number of morphogenetic changes can be observed for most lineages. These will be discussed in the following paragraphs, before focusing on individual lineages.
Fig. 2.

Secondary lineages during metamorphosis. (A) Cell body clusters (CC) of lineages evolve from a columnar shape to a flattened shape in the adult due to a thinning of the cortex, but the general morphology of the SAT does not change dramatically. ((B) and (C)) Z-projections of a MARCM clone of the DPLal1 (#33) lineage at the L3 larval stage (B) and the adult stage (C). The SAT of this lineage extends along a crescent-shaped trajectory around the anterior tip of the superior lateral protocerebrum (SLP). In the adult, terminal arbors (TA) of DPLal1 and several other lineages result in a growth of this compartment while the SAT remains relatively unchanged. General changes include movement of the cell cluster (CC) from a more dorsal position to a more lateral position, decreases in cell number (most likely due to cell death), flattening of the CC, and elongation of the SAT crescent to extend around the ventral/anterior surface of the SLP. L3 and adult DPLal1 are represented by MARCM neuroblast clones induced during larval development. (D) Confocal section of adult brain hemisphere (anterior level), double-labeled with N-Cadherin (purple, neuropil) and BP104 (green, cortex), illustrating variances in the diameter of the cortex (co) at different locations. Small arrow points to a dorsal region where the cortex is thin; large arrow points to a region with thick cortex in the crevice formed between the antennal lobe (AL), lateral accessory lobe (LAL); anterior optic tubercle (AOTU); mushroom body (MB), and anterior ventrolateral protocerebrum (VLPa). ((E)–(H)) Z-projections of confocal sections of BP104/BP106-labeled brains (P12, P24, P48, adult) show the cell body clusters of DPLal1 (CC 33). In addition, the distance between DPLal1 and an adjacent lineage, DPLd (#42) increases as a result of the growth of the SLP compartment (compare location of #33 and #42 from (E) to (H)). Scale bars: 10 μm ((E)–(H)) and 25 μm ((B)–(D)).
During the time that secondary neurons differentiate and generate axonal and dendritic branches the neuropil volume increases (eg. growth of the SLP compartment, Fig. 2E–H). At the same time, the number of neuronal cell bodies does not increase; rather, for many lineages, it decreases, due to cell death (Booker and Truman, 1987a; Jiang and Reichert, 2012; Kumar et al., 2009b). As a result, the brain cortex becomes thinner and the clusters formed by individual lineages change in shape from radially-oriented “cylinders” to horizontally-flattened “plates” (Fig. 2A–C, e.g. DPLal1, #33). Depending on their position, some lineages are affected more than others by this flattening process. The cortex of the adult brain varies in diameter: it is thick at some locations where two outward-bulging compartments meet and deep “crevices” filled with neuronal cell bodies are formed (Fig. 2D, large arrow) or it is very thin or absent over the convexity of many different compartments (Fig. 2D, small arrow). A general morphological change is that the increase in neuropil volume causes lineage entry points and SATs to move away from each other (shown for DPLal1, #33; DPLd, #42 in Fig. 2E–H). However, the position of most lineages relative to each other remains constant, which is the prerequisite for following SATs throughout metamorphosis. Two processes, the separation of parts of lineages (presumably hemilineages) and the extension of additional fiber bundles, complicate the issue of identifying SATs during pupal stages for a number of lineages. In the late larva, the cell body clusters of hemilineages and the entry points of their HSATs are directly adjacent. During metamorphosis, hemilineages are drawn apart to a varying extent. In most cases, they remain close; in a few cases, they become far removed from each other (Fig. 3A; e.g. DPLl2/3). The example shown in Fig. 3B–G is the paired lineage DPLl2/3, whose HSATs at the larval and early pupal stages enter together at the dorso-posterior neuropil surface (Fig. 3B and D). During the course of metamorphosis (Fig. 3E and F), one hemilineage remains posteriorly, the other one moves anteriorly, resulting in two separate cell body clusters and two distinct entry points in the adult (Fig. 3C and G). This extreme separation of hemilineages, typically occurring between P12 and P40, affects several other lineages as well (see Table 1).
Fig. 3.

Hemilineage cell clusters and SAT neuropil entry points migrate away from each other during metamorphosis. (A) Cartoon depiction of the behavior seen in secondary lineages containing hemilineages. Hemilineage cell body clusters (CC, shown as spheres) and their corresponding axon tracts initially form adjacent to one another as seen at the late larval stage (L3). By adulthood, many hemilineages completely separate (CCs and HSATs) to form morphologically distinct elements (generically termed as HLα and HLβ, shown in orange and green, respectively). The extent to which hemilineages migrate apart varies between lineages. ((B)–(G)) Metamorphosis of the hemilineages of the DPLl2/3 secondary lineages. (B) and (C) are z-projections of confocal sections of single brain hemispheres containing GFP-labeled DPLl2/3 neuroblast clones, induced in the early larval period and fixed in the late larva (B) or adult (C). Neuropil (in purple) is labeled by N-Cadherin. ((D)–(G)) Z-projections of contiguous confocal sections of BP106/BP104-labeled brains (BP106 in (D)–(E); BP104 in (F) and (G)). Confocal stacks used in (B)–(G) were digitally rotated 90d to show the DPLl2/3 lineages from a lateral view. ((B), (D)) At the L3 and early pupal stage, DPLl2/3 appears as a pair of cell clusters (CC) whose axons come very close to each other and form a single SAT. This SAT splits into a posterior ventral (HSATp) and an anterior–dorsal (HSATa). These hemilineage tracts extend around the dorsal and lateral surfaces of the growing superior lateral protocerebrum (SLP) compartment during metamorphosis. ((E)–(G)) As the SLP grows ((E), P24; (F), P48; (G), adult), the hemilineage clusters HLa and HLp of the DPL2/3 lineage move away from each other. From P48 onward the clusters and HSATs are completely separated. Scale bar: 50 μm ((B)–(G)).
Development of nascent fiber bundles from a main SAT is the second mechanism by which the overall SAT structure of lineages is altered. As a rule, most lineages have fully extended their SAT (or HSATs/SSATs) by the late larval stage. For example, lineages of antennal lobe projection neurons, whose cell bodies are located in the antero-ventral brain close to the antennal lobe, extend their axons far posterior to the calyx (Das et al., 2013; Pereanu and Hartenstein, 2006). During pupal development, terminal arborizations sprout from these fiber bundles and accumulate in the antennal lobe and calyx/lateral horn. However, a number of lineages deviate slightly in that their SATs/HSATs acquire one or more major side branches, typically around 24–48 h of pupal development (P24–P48). This is shown in Fig. 4 for BAmv1, which in the late larva forms a dorsally-directed and a posteriorly-directed HSAT (HSATd and HSATp, Fig. 4B and D). Beginning around P24, the dorsal HSAT emits a laterally-directed branch (SATlate, data not shown for P24). By P32, the aforementioned branching for the BAmv1 becomes more apparent (Fig. 4E), where the SATlate reaches the VLPa compartment. The terminal arborization of SATlate into the VLPa compartment is also observed in the adult stage (Fig. 4C and F). The most likely explanation is that branches added during the pupal period are formed by the axons belonging to a group of late-born neurons. In the late larva, these cells would not yet have extended an axon contributing to the larval SAT. When they extend their axons in the pupa, these fibers might not all follow the pre-existing larval SAT, but establish a novel trajectory (SATlate) instead. Table 1 lists lineages forming prominent SAT branches during metamorphosis.
Fig. 4.

Some secondary lineages acquire additional branches during metamorphosis. (A) Schematic illustrating that a fully extended SAT can produce an off-shoot (SATlate) during metamorphosis, presumably generated by late-born secondary neurons that had not yet produced axonal fibers during larval development. The addition of branches does not affect the overall morphology of the main SAT. ((B) and (C)) Z-projections of confocal sections of brain hemispheres containing BAmv1-MARCM clones (fixed at larval stages in (B); at adult stages in (C)). BAmv1 has two HSATs, a dorsally-directed HSATd and posteriorly-directed HSATp by the L3 stage. In the adult, a third branch, SATlate, is added to HSATd, and extends laterally into the VLPa compartment (neuropil is labeled by anti-DN-cadherin). ((D)–(F)) Z-projections of representative confocal sections of BP106/BP104-labeled pupal brains, highlighting the emergence of the SATlate lateral branch, appearing between st. P24 (data not shown) and P32 (E). Of note, the collateral branch formed during metamorphosis follows a novel trajectory different from other SATs formed by the lineage during larval development. Scale bars: 50 μm ((B)–(G)) and 10 μm ((D)–(F)). Other abbreviations: cell body cluster CC.
The pattern of fiber bundles in the brain neuropil
In the following presentation of lineages, SATs will be assigned to anatomically defined systems of fiber bundles (fascicles) in the brain neuropil. Fascicles are easily distinguished in the context of commonly used synaptic markers (eg. Bruchpilot, nc82; N-Cadherin, NCad; Syntaxin, 8C3) which label most neuropil regions in the brain because they appear as domains of low signal, since synapses are scarce or absent in fascicles. Components of most adult fascicles can also be positively labeled by BP104 (this work). The most prominent fascicles can be generally grouped into longitudinal, transverse, and vertical bundles, which are based on the cardinal axis they travel along. Most of these bundles extend along the surface of the inferior protocerebrum, which is the brain domain surrounding the peduncle and lobes of the mushroom body (Pereanu et al., 2010; Fig. 5). For a more comprehensive description of fascicles and neuropil compartments, visit our website, the Drosophila Brain Lineage Atlas: https://www.mcdb.ucla.edu/Research/Hartenstein/dbla/. Along the boundary between superior and inferior protocerebrum one further distinguishes a lateral and medial longitudinal superior fascicle (loSL and loSM, respectively; Fig. 5A–E; for alphabetical list of abbreviations of fascicles and compartments, see Table 2). The loSM can be subdivided into an anterior component, loSMa (Fig. 5A, B and E) and posterior component, loSMp (Fig. 5C, D and E). Among the transverse fascicles, we distinguish an anterior, intermediate, and posterior superior transverse fascicle (trSA, trSI, and trSP, respectively; Fig. 5B–E). More ventral and anterior is the lateral ellipsoid fascicle (LEa, LEp; Fig. 5A) that passes obliquely underneath the mushroom body medial lobe (Fig. 5A and E) and connects to the central complex. Fiber bundles entering the central complex from posterior form the medial and dorsolateral roots of the fan-shaped body (mrFB, dlrFB), as well as part of the medial equatorial fascicle (MEF; Fig. 5D and E; see below).
Fig. 5.

Major fascicle systems of the adult Drosophila brain. ((A)–(D)) Z-projections of contiguous confocal sections of adult brains labeled with BP104 (green) and N-Cad (purple in right hemisphere; white in left hemisphere). Z-projections represent brain slices of 10–16 μm thickness at four different antero-posteror levels ((A), anterior optic tubercle AOTU and mushroom body lobes MB; (B) ellipsoid body EB; (C) fan-shaped body FB and great commissure GC; (D) lateral bend of antennal lobe tract, posterior to central complex mALT). The left hemisphere is a merged z-projection of BP104 (to label the major fascicles) and N-Cad (to label the neuropil compartments). The major fascicles are annotated on the left half of brain hemispheres containing the merged image. Neuropil compartments are annotated on the right brain hemisphere. For a complete list of abbreviations for compartments and fascicles, see Table 2 ((E)–(F)). Digital three-dimensional models of adult brain hemispheres viewed from dorsally (E) and ventrally (F), showing pattern of major fascicles (modified from Pereanu et al., 2010). Scale bar: 50 μm ((A)–(D); (E) and (F)).
Longitudinal fascicles extending at the ventral surface of the inferior protocerebrum are the medial equatorial fascicle (MEF), lateral equatorial fascicle (LEF), and posterolateral fascicle (PLF; Fig. 5C, D and F). The LEF is subdivided into anteriorly- and posteriorly-directed tracts, LEFa and LEFp (Fig. 5A–C, F and C, D, F, respectively). Further ventral is the ventral longitudinal fascicle (loV). Anteriorly, this massive fiber system has three components: the medial, intermediate, and lateral loV (loVMa, loVIa, loVLa, respectively; Fig. 5A–C and F). All three components converge and form a conspicuous confluence of fibers in the middle of the ventral cerebrum (Fig. 5B and F, white and black arrowheads), the ventral fibrous center (VFC). Beyond this confluence, the ventromedial fascicle continues and passes postero-medially into the cervical connective (CCT) that joins the brain with the thoracic ganglia (Fig. 5D and F). A more laterally-located fascicle, the postero-lateral component of the loV (loVP), moves nearly straight posterior, ending near to the posterior neuropil surface (Fig. 5C, D and F).
The conspicuous fiber systems that connect ventral and dorsal regions of the brain are the medial antennal lobe tract (mALT), the median bundle (MBDL), and the central descending protocerebral tract (deCP). The mALT primarily carries ascending fibers from the antennal lobe, travels dorso-posteriorly along the central complex, and turns laterally towards the calyx and lateral horn (Fig. 5A–E). The MBDL contains numerous ascending and descending fibers connecting the superior medial protocerebrum (SMP) with the subesophageal ganglion (SEG) and tritocerebrum (Fig. 5A). The deCP arises in the superior protocerebrum, passes the peduncle medially, and aims for the ventro-medial cerebrum (VMC) and SEG (Fig. 5B and E).
Bundles of commissural fibers interconnecting the two brain hemispheres are grouped around the central complex. Dorsally, one can distinguish four main commissures, including (from anterior to posterior; for nomenclature see Strausfeld, 1976) the anterior–dorsal commissure (ADC, dorsal of the medial lobe of the mushroom body; Fig. 5A); the fronto-dorsal commissure (in between the medial lobe and ellipsoid body; not shown); the supra-ellipsoid body commissure (SEC, dorsal of the ellipsoid body; Fig. 5A and E); the superior arch commissure (SAC, dorsal of the fan-shaped body; Fig. 5B and E), and the superior commissure of the postero-lateral protocerebrum (sPLPC, dorso-posterior of the fan-shaped body; Fig. 5D and E). Commissures passing ventral of the central complex are (from anterior to posterior) the antennal lobe commissure (ALC, ventral of the medial lobe; Fig. 5A and F), the commissure of the lateral accessory lobe and sub-ellipsoid commissure (LALC and SuEC, ventral of the ellipsoid body; Fig. 5A and F), the great commissure (GC, ventral of the fan-shaped body; Fig. 5C and F), and the posterior commissure of the postero-lateral protocerebrum (pPLPC; Fig. 5D and F).
Several shorter fiber bundles entering the center of neuropil compartments (rather than extending along compartment boundaries) can be distinguished. Used as points of reference in this and the accompanying paper (Wong et al., 2013) are the vertical tract of the superior lateral protocerebrum (vSLPT, penetrates the SLP from antero-dorsal; Fig. 5B), the vertical posterior tract (vP), projecting between the lateral horn and posterior lateral protocerebrum (not shown), the vertical tract of the ventro-lateral protocerebrum (vVLPT, enters the VLPa from ventral; Fig. 5B), and the horizontal tract of the ventrolateral protocerebrum (hVLPT, enters the VLPa from lateral; Fig. 5A).
Classification of lineages
In the previously published map of secondary lineages a nomenclature based on topology was introduced (Cardona et al., 2010a; Dumstrei et al., 2003a; Pereanu and Hartenstein, 2006). Using the easily identifiable mushroom body and antennal lobe as points of reference, twelve groups were defined, including the mushroom body (Fig. 6). Groups BA (basal anterior), DAL (dorsal anterior lateral), and DAM (dorsal anterior medial) have entry points at the anterior brain surface. BA lineages enter in close proximity to the antennal lobe (blue arrow in Fig. 6A; antennal lobe indicated by red “A” in Fig. 6B–G); the DAL lineage group enters anterior and lateral of the mushroom body vertical lobe (purple arrow in Fig. 6A; shown in shades of purple in Fig. 6B–G; tip of vertical lobe indicated by red “V” in Fig. 6B–G); and DAM lineages enter anterior and medial of the mushroom body vertical lobe (yellow arrow in Fig. 6A; shown in shades of yellow in Fig. 6B–G). SAT entry-points of the groups DPL (dorsal posterior lateral) and DPM (dorsal posterior medial) are to be found at the dorsal brain surface. DPL is postero-lateral of the vertical lobe and antero-lateral of mushroom body calyx (DPL; turquoise arrow in Fig. 6A; shown in shades of cyan-turquoise in Fig. 6D–I; calyx indicated by red “C” in Fig. 6D–I); DPM is postero-medial of the vertical lobe and medial of the calyx (DPM; orange arrow in Fig. 6A; shown in shades of orange in 6D–I). The four lineages producing the mushroom body (MB), as well as CP (central posterior) and CM (central medial) lineages, enter at the posterior brain surface; CPs are located ventro-lateral of the mushroom body calyx (maroon arrow in Fig. 6A; maroon in Fig. 6H–I) and CMs ventro-medial of this structure (magenta arrow in Fig. 6A; magenta in Fig. 6H–I). Finally, the BL (basal–lateral) lineages converge on the lateral brain surface, surrounding the broad connection between the optic lobe and central brain (green arrows in 6A; shown in shades of green in 6B–I; optic lobe indicated by red “O” in Fig. 6B–I). BLA lineages enter from anterior (Fig. 6B–G), BLD lineages enter from dorsal (Fig. 6B–I), the BLP group enters from posterior (Fig. 6F–I), and BLV lineages enter from ventral (6D–I). Most of these main groups were further subdivided into smaller units of lineages entering the neuropil closely together, in the case of the BA lineage group, BAla, BAlp, or BAmas (Fig. 6B–G). As evident from Fig. 6, the position of SAT entry-points in relationship to each other and to the neuropil compartments is very similar in the larva and adult, if one takes into account the previously discussed growth of certain compartments, in particular the antennal lobe, optic lobe, and the superior protocerebrum, that occurs during metamorphosis.
Fig. 6.

Topological classification of secondary lineages. (A) Spatial relation between lineage groups and mushroom body. Arrows indicate neuropil entry points of lineages belonging to the group represented by acronyms (BA basal anterior; BLA basal lateral anterior; BLD basal lateral dorsal; BLP basal lateral posterior; BLV basal lateral ventral; CM central medial; CP central posterior; DAL dorsal anterior lateral; DAM dorsal anterior medial; DPL dorsal posterior lateral; DPM dorsal posterior medial). ((B)–(I)) Digital three-dimensional models of larval and adult brain hemispheres, showing position of neuropil entrypoints of lineages (colored spheres) in relationship to neuropil topography (gray). The neuropil surface model was generated by volume-rendering of a series of confocal sections of a brain hemisphere labeled with the synaptic marker nc82 or Brp (see Material and Methods). Four prominent elements of the neuropil surface are indicated in red lettering (A antennal lobe; C calyx; V tip of vertical lobe; O optic lobe). Panels are arranged in four pairs (B/C, D/E, F/G, H/I), with one member of each pair representing the larval brain (B, D, F, H), the other the adult brain (C, E, G, I). The pairs represent different view points (B/C: anterior; D/E: dorsal; F/G: lateral; H/I: posterior). White hatched lines on panels showing larval brains demarcate territories occupied by the different lineage groups that are annotated in white lettering (eg. BA, BLA). The affiliation of individual lineages with a group and subgroup is color-coded (BA blue; BLA yellow–green; BLD dark green; BLP light olive; BLV dark olive; CM magenta; CP maroon; DAL purple; DAM yellow; DPL turquoise; DPM orange). Lineage subgroups are annotated in colored lettering (eg. BAmd, BAmv) and set close to the corresponding colored spheres. Most subgroups are differentiated by different shades of color; in some cases where two subgroups are close to each other, they are represented by the same color, and the acronyms are contracted (e.g. BAla and BAlc is contracted as BAla/c). Neuropil growth between larval and adult stage causes entry points of lineages to move away from each other (see Figs. 2 and 3); entrypoints of lineages of the same subgroups typically stay together, and position of groups/subgroups relative to each other remains similar. For abbreviations of all lineages see Table 2. Scale bar: 50 μm ((A)–(I)).
In the remaining sections of this paper and in the accompanying paper (Wong et al., 2013), the above topological classification will be used to order the description of secondary lineages and their projections (Figs. 7–13). In the first set of figures, we describe the axonal projections of the adult secondary lineages, starting with lineages entering the anterior brain surface (BA: Fig. 7; DAL and DAM: Fig. 9), followed by those of the dorsal surface (DPL: Fig. 10), posterior surface (DPM, CM, CP: Fig. 12), and finally, lateral surface (BLA, DLD, BLP, BLV: Fig. 13). In each of these figures, the left column of panels show z-projections of frontal sections of left brain hemispheres, ordered from posterior (top) to anterior (bottom). Each z-projection represents a brain slice of approximately 15–20 μm thickness in which segments of SATs, labeled by BP104, are visible. The panels on the right hand side of Figs. 7, 9, 10, 12, and 13 represent semi-schematic 3D maps of the group(s) of lineages shown in the corresponding figure. Lineages are represented as a sphere (location of SAT entry point into neuropil) and line (SAT trajectory in neuropil). In panels at the bottom, neuropil entry points are projected on a 3D volume rendering of the neuropil surface, which illustrates the position of the lineage in relation to prominent surface landmarks (e.g. antennal lobe, anterior optic tubercle, mushroom body). The large right panel at the top schematically shows the trajectories of SATs in the neuropil. A second set of figures (Figs. 8 and 11) document SATs of the eleven lineage groups at different developmental stages, including late larva (L3), pupa (P12, P24, P32, P48), and adult. Fig. 8 shows lineages located in the anterior part of the brain while Fig. 11 shows posterior lineages. To complement this paper as well as the accompanying paper (Wong et al., 2013), we have developed an online tutorial, the Drosophila Brain Lineage Atlas, which provides a three-dimensional description of adult secondary lineages (highlights neuropil entry points, SAT trajectories, and axonal projection patterns): https://www.mcdb.ucla.edu/Research/Hartenstein/dbla/.
Fig. 7.

Trajectories of SATs formed by the BA lineage group. The left column of panels show z-projections of frontal sections of left brain hemispheres, ordered from posterior (top) to anterior (bottom). The right panels represent semi-schematic three-dimensional maps of the BA lineage group(s). Lineages are represented as a different colored spheres (location of SAT entry point into neuropil) and lines (SAT trajectory in neuropil). Fascicles are annotated in yellow letters and compartments in green ((A), (D)–(F)) or white ((B), (C) and (G)) letters; for abbreviations, see Table 2. Where one or more SATs associate with a specific fascicle, their numerical identifiers appear directly adjacent to the fascicle name. Bottom-right panels ((B) and (C)) show neuropil entry points of BA lineages projected on a three-dimensional volume rendering of the neuropil surface, illustrating the position of the lineage in relation to prominent surface landmarks, provided by specific compartments. Panel B presents an anterior view of both hemispheres. Prominent neuropil compartments shaping the surface topography are annotated in white lettering on the left side of panel B (e.g. AL antennal lobe; AOTU anterior optic tubercle; for complete list of abbreviations see Table 2); entry portals of specific lineages/lineage groups are shown by annotated hatched circles and arrows on the right side of panel B. Panel C shows antero-lateral view of right brain hemisphere; on this panel, names of lineage subgroups and their corresponding numbers are indicated. Hemilineages (represented by two separate spheres), are pointed out by single letters (d dorsal; v ventral) superimposed on spheres. (G) Schematics of trajectories of SATs of BA lineages at various levels overlaid on adult brain labeled with N-Cadherin (gray). Each level in G is represented by a corresponding frontal Z-projection (denoted by white arrows in (A), (D)–(F); see below). Z-projections are compressed (50%) along the y-axis, such as to give the set of these images the appearance of a cut-away diagram of the neuropil in antero-dorsal view. SATs entering the neuropil from anterior to associate with a specific fascicle are shown as opaque lines, converging on the signal-negative domain corresponding to that fascicle. Note, for example, the SATs of BAla1 (#1), BAlc d (#5d), BAlp4 (#9) and BAmv3 (#17), whose SATs form the antennal lobe tract (ALT). The colored lines representing these SATs target the signal-negative “hole” formed by the ALT in the posterior antennal lobe. After passing through that “hole” (and thereby disappearing “behind” the first z-projection), the lines representing the SATs are rendered semitransparent. Once they “reappear” in the space between the first (A) and second z-projection (D), the lines become opaque again. In cases where several SATs come close and cannot be separated (such as SATs which enter the ALT), lines of individual SATs are graphically “merged” by a thick, semitransparent line (blue in the case of the ALT). Hatching of (parts of) lines indicates that the corresponding segments of the SATs cannot be recognized in BP104-labeled adult brains, but are visible in larval/pupal stages, as well as MARCM clones of the corresponding lineages. ((A), (D)–(F)). Z-projections of frontal confocal sections adult brain left hemisphere labeled with N-Cadherin (purple) and Neuroglian (BP104, gray). Each z-projection represents a brain slice of approximately 15–20 μm thickness. Brain slices are ordered from anterior (A) to posterior (F) and correspond in antero-posterior location to those shown in Fig. 5A–D ((A) level of mushroom body lobes; (D) ellipsoid body; (E) fan-shaped body and great commissure; (F) lateral bend of the antennal lobe tract). Short segments of SATs and the fascicles they form in the neuropil, labeled by BP104, are visible. Only SATs and fascicles of BA group lineages are annotated. SATs are annotated by numbers, to save space; the correspondence of lineages and numbers is given in Table 1 and on panel C of this Fig. (e.g. #11–12 correspond to BAmas1-2). Scale bars: 25 μm ((A), (D)–(F)); 50 μm ((B) and (C)).
Fig. 13.

Trajectories of SATs formed by the BLA, BLD, BLP, and BLV lineage groups. The composition of this figure follows the same plan explained for Fig. 7, with sets of z-projections (A, B, E–H) illustrating segments of the SATs and fascicles at different antero-posterior levels, neuropil surface views showing location of SAT entrypoints (C–D′) and neuropil cut-away diagram depicting SAT trajectories (I). Position of A, B, and E–H along the antero-posterior axis is indicated by white arrows at the right margin of panel I. Panels C–D′ all show antero-lateral view of right brain hemisphere. In D and D′, the optic lobe (OL) is removed from volume rendering of neuropil to gain clearer view of BLP and BLV lineage entry points. White lettering in C and I annotates neuropil compartments; hatched circles and white lettering in D′ indicates SAT entry portals; yellow lettering in I indicates fascicles (for alphabetical list of abbreviations, see Table 1). Scale bars: 25 μm ((A), (D)–(F)); 50 μm ((B) and (C)).
Fig. 9.

Trajectories of SATs formed by the DAL and DAM lineage groups. The composition of this figure follows the same plan explained for Fig. 7, with sets of z-projections ((A), (D)–(F)) illustrating segments of the SATs and fascicles at different antero-posterior levels, neuropil surface views showing location of SAT entrypoints ((B) and (C)) and neuropil cut-away diagram depicting SAT trajectories (G). Note that some of the panels on the left ((E) and (F)) do not show the same z-projections as those depicted in Fig. 7 (e.g. E represents a level on slightly posterior to that shown in (D); (F) corresponds to the fan-shaped body/great commissure level, see white arrows pointing out antero-posterior levels of the z-projections). Panels B and C show antero-lateral view of right hemisphere (B) and dorsal antero-lateral view of both hemispheres (C). White lettering in C and G annotates neuropil compartments (left side of C) and SAT entry portals (right side of G); yellow lettering in G indicates fascicles (for alphabetical list of abbreviations, see Table 1). Scale bars: 25 μm ((A), (D)–(F)); 50 μm ((B) and (C)).
Fig. 10.

Trajectories of SATs formed by the DPL lineage group. The composition of this figure follows the same plan explained for Fig. 7, with sets of z-projections ((A), (D)–(F)) illustrating segments of the SATs and fascicles at different antero-posterior levels, neuropil surface views showing location of SAT entrypoints ((B) and (C)) and neuropil cut-away diagram depicting SAT trajectories (G). Position of (A) and (D)–(F) along the antero-posterior axis is indicated by white arrows. Panels B and C show posterior view and dorsal view of both brain hemispheres, respectively. (C′) and (C″*) are antero-dorso-lateral views of right hemispheres. Neuropil compartments are annotated by white lettering on the right side of (B), the bottom half of (C), and in (C′). SAT entry portals (hatched circles) and annotation (small white letters) are shown on left side of (B), top half of (C), and in C″. Yellow lettering in G indicates fascicles (for alphabetical list of all abbreviations, see Table 2). Scale bars: 25 μm ((A), (D)–(F)); 50 μm ((B) and (C)).
Fig. 12.

Trajectories of SATs formed by the DPM, CM, and CP lineage groups. The composition of this figure follows the same plan explained for Fig. 7, with sets of z-projections (A, D, E) illustrating segments of the SATs and fascicles at different antero-posterior levels, neuropil surface views showing location of SAT entrypoints ((B) and (C)) and neuropil cut-away diagram depicting SAT trajectories (G). Position of A, D, and E along the antero-posterior axis is indicated by white arrows. Panel B shows posterior view of both brain hemispheres. C presents enlargement of posterior view of right hemisphere. White lettering on right side of B and G annotates neuropil compartments; hatched circles and white lettering on left side of B indicates SAT entry portals; yellow lettering in G indicates fascicles (for alphabetical list of abbreviations, see Table 2). Scale bars: 25 μm ((A), (D)–(F)); 50 μm ((B) and (C)).
The BA lineages (#1–17)
The BA group comprises lineages associated with the ventral brain compartments (antennal lobe, antenno-mechanosensory and motor center, ventro-medial cerebrum, ventro-lateral cerebrum, lateral accessory lobe). BA cell body clusters are grouped around the antennal lobe (AL). Four lineages, BAla1–4 (#1–4), form the antero-lateral BA subgroup whose SATs enter the neuropil in the niche formed between the ventral AL and antenno-mechanosensory and motor center (AMMC), the compartment receiving input from the auditory Johnston’s organ and other mechanosensory bristles of the head (entry portal ptAL vl; Fig. 7A–C). BAlc (#5d/v; corresponding to the group of neurons called the lateral cluster in the literature, and labeled by the marker GH146-Gal4; Lai et al., 2008) enters the lateral surface of the AL (ptAL l; Fig. 7A′, B and C). SATs of the postero-lateral BA group [BAlp1-4 (#6–9), BAlv (#10)] reach the neuropil further posteriorly, in the niche formed between the AL, ventro-lateral protocerebrum (VLP), and AMMC (pt VLP vm; Fig. 7A–C). The pair of medial ascending lineages, BAmas1 and 2 (#11–12), are located ventro-medially of the AL and project their SATs dorsally into the median bundle (ptAL vm; Fig. 7A–C). BAmd1 and 2 (#13–14; Fig. 7A–C) are located dorsally of the AL. The two separate hemilineage clusters of BAmd1 flank the mushroom body medial lobe; the dorsal HSAT (#13d) enters dorsally of the medial lobe (ptVL vm; Fig. 7A′ and B), the ventral HSAT (#13v) passes between the medial lobe and antennal lobe (ptALd; Fig. 7A′ and B). The SAT entry point of BAmd2 is obscured by the fibers of the median bundle and antennal nerve in the adult brain. BAmv1-3 (#15–17) form a compact group of SATs at the dorso-lateral surface of the AL in the larva. Whereas BAmv3 (whose entry point into the AL is also obscured by antennal nerve afferents) maintains this position (entry point ptAL d; Fig. 7B), the entry points of BAmv1 and BAmv2 come to lie at the ventral surface of the adult AL (ptAL v; Fig. 7A–C; see below).
Four BA lineages, BAla1 (#1, labeled by per-Gal4; Spindler and Hartenstein, 2010; Spindler and Hartenstein, 2011), BAlc (#5d, dorsal hemilineage; labeled by GH146-Gal4; Stocker et al., 1997), BAlp4 (#9), and BAmv3 (#17, labeled by GH146-Gal4; Stocker et al., 1997) include all of the projection neurons connecting the AL and superior protocerebrum (calyx and lateral horn; Das et al., 2013; Lai et al., 2008) via the antennal lobe tracts (ALT; Fig. 7G; for a detailed description of the distinct entry portals of these lineages into the AL, see Das et al., 2013). The ventral HSAT of BAlc forms the intermediate bundle of the loV fascicle (loVI) that extends posteriorly into the inferior ventro-lateral cerebrum (VLCi; #5v in Fig. 7A, D and G). BAmas1 and 2 project dorsally through the median bundle towards the superior medial protocerebrum (SMP; #11–12 in Fig. 7A and G). BAmd1 and BAmd2 (#13–14) have commissural tracts. The dorsal HSAT of BAmd1 (#13d) projects medially directly behind the medial lobe and crosses in the fronto-dorsal commissure. Shortly after its entry point (#13d in Fig. 7A′), the trajectory of the HSAT becomes obscured by the dense labeling of the mushroom body medial lobe; the tract is visible until mid-pupal stages (Fig. 8F). The ventral HSAT of BAmd1 projects diagonally through the AL to cross in the antennal lobe commissure (#13v in Fig. 7A, D and G). BAmv1 (marked by per-Gal4; Spindler and Hartenstein, 2010; Spindler and Hartenstein, 2011) and BAmv2 form the loVM that passes underneath the AL and extends posteriorly throughout the ventro-medial cerebrum (VMC; #15–16 in Fig. 7A, D, E and G). A major dorsal branch of BAmv1 (BAmv1d; #15d) curves dorsally towards the central complex, forming the posterior component of the lateral ellipsoid fascicle (LEp; Fig. 7D and G). Tracts of BAlp2 and BAlp3 form the lateral loV fascicle (loVL; #7–8 in Fig. 7A, D, E and G). The BAlp2 tract gives off a dorsal branch that extends along the lateral surface of the lateral accessory lobe (LAL; #7d in Fig. 7D).
BAla3 (#3, Fig. 7A; marked by en-Gal4; Kumar et al., 2009a), BAla4, BAlp1, and BAlv have single SATs that enter from a position lateral of the AL. BAla3, BAla4, and BAlp1 project medially towards the ventro-medial cerebrum (VMC), with BAlp1 crossing the loVM fascicle at its dorsal surface (#6 in Fig. 7D), and BAla3-4 crosses the medial loV (loVM) at its ventral surface (#3* in Fig. 7D). BAlv has a short SAT that contacts the inferior ventro-lateral cerebrum from ventral (VLCi; #10 in Fig. 7D and G).
Of the BA lineages, nine (BAlc, BAlp1-4, BAlv, BAmd1, and BAmv1-2) can be individually followed from their point of entry deep into the neuropil throughout metamorphosis (Fig. 8; Fig. S1). Six BA lineages (BAla1-2, BAla3-4, BAmas1-2) form pairs whose SATs are closely associated. The paired SATs of these lineages (indicated by the number corresponding to the first lineage of the pair followed by an asterisk; for example, “#3*” for the pair “BAla3-4”; Fig. 7D) can also be followed throughout metamorphosis (Fig. 8), but lineages within each pair are distinguishable only on the basis of clones or genetic markers. The points of entry of two BA lineages (BAmv3, #17; BAmd2, #14) become indistinct at later pupal stages because of strong surrounding labeling of antennal afferents (Fig. 8). BAmv3, marked by the GH146-Gal4 driver (Stocker et al., 1997), enters the AL from dorsal (Fig. 7B–G, Fig. 8A′). BAmd2 (#14), clearly visible until P24, enters near the midline in between the two brain hemispheres (Fig. 8A′-B, C′-D and E′-F); the SAT joins the ventral HSAT of BAmd1, crossing in the antennal lobe commissure (ALC). In addition, BAmd2 has an ipsilateral branch that is fairly thin in the larva and early pupa, but increases in diameter and forms a visible tract in the late pupa and adult stages (#14i in Fig. 7D; Fig. 8J and L).
Changes in the position of BA lineages are mainly brought about by the general expansion of the anterior brain neuropil compartments, notably the AL, AMMC, and anterior ventrolateral protocerebrum (VLPa; see panels of left column of Fig. 8; Fig. 8A, C and E). The AMMC, formed around the mechanosensory component of the antennal nerve during metamorphosis, has no larval counterpart; it grows and expands in a region between the BAlp lineages (dorso-lateral of the AMMC) and BAla lineages (ventro-medial of the AMMC) starting around P32 (Fig. 8G, I and K). Furthermore, the hemilineage clusters of BAlc (#5, Fig. S1C; white arrows) and BAmd1 (#13, Fig. S2C; white arrows) and their HSAT entry points move slightly apart. However, the relative positions of these and all other BA SAT entry points remain constant; with the notable exception of the BAmv1 and BAmv2 (#15–16) lineages which undergo an interesting switch in position relative to the AL (compare the yellow and orange spheres in the top two panels of Fig. S1A). In the larva, the SATs of BAmv1-2 enter dorsal of the AL (Fig. 8A, blue arrow); in the adult, they are ventral (Fig. 8K, blue arrow). This change comes about as a result of the metamorphic decay of the larval AL (ALLar) and the formation of the adult AL (ALAd). The ALAd primordium is visible in the late larva as a small domain of dense NCad-labeling at the dorsal edge of the ALLar (Fig. 8A). The ALAd domain expands throughout pupal development (Fig. 8C and E) and acquires a glomerular texture by P32 (Fig. 8G). At the same time, the glomerular composition of the ALLar decays and becomes invisible by P32. The neuropil entry point of BAmv1 and 2 in the larva is positioned dorsally of the ALLar, adjacent to the small ALAd primordium (Fig. 8A). As the ALAd primordium grows (P12, P24), it pushes the BAmv1/2 entry point ventro-medially (Fig. 8C and E, blue arrow). Note that at this transitional stage, the entry point is still dorsal of the decaying ALLar (Fig. 8C). Finally, by P48, the BAmv1/2 entry point is ventral of the ALAd.
DAL lineages (#18–32)
DAL lineages occupy a position dorsal of the BA group, surrounding the spur (SP) and lobes of the mushroom body (medial lobe ML; ventral lobe VL; see Table 2). Neurons of the first subgroup, DALcl1 and DALcl2 (#18–19), encircle the anterior optic tubercle (AOTU, a distinct compartment receiving input from the optic lobe via the anterior optic tract; Strausfeld, 1976; Fig. 9B and C). DALcl tracts enter the neuropil, at the junction between the mushroom body spur (SP) and vertical lobe (VL) (entry portals ptSP d and ptSP v; Fig. 9A and G). The second subgroup, DALcm1-2 and DALd (#20–22), is located dorso-medial of the DALcl lineages (Fig. 9A–C); its tracts enter the neuropil closely adjacent to the DALcl tracts, forming two entry portals that flank the base of the VL medially and laterally (ptVL vm and ptVL vl; Fig. 9C and G). Tracts of the third subgroup, DALv1-3 (#25–27), located ventrally of the ML, pass underneath the SP and ML (ptSP v; Fig. 9A–D and G). Further laterally, DALl1 and DALl2 (#23–24) enter the anterior surface of the ventro-lateral protocerebrum (VLP), laterally adjacent to the SP (ptVLP dm; Fig. 9A–D).
DALcl1 and DALcl2 each have two hemilineages whose diverging HSATs, in a “pincer-like” manner, enclose the SP (#18d* and #18v*; Fig. 9A, Fig. S2D and E). The ventral HSATs of DAlcl1/2 pass underneath the SP and continue medially. Ventral DALcl1 (#18v) crosses the midline in the subellipsoid commissure (SuEC); ventral DALcl2 (#19v) joins the lateral ellipsoid fascicle (LE), along with DALv2 and DALv3 (see below), and projects to the central complex (#19v in Fig. 9A, D, E and G). The dorsal HSATs of both DALcl lineages curve over the dorsal surface of the SP and peduncle (P) and project towards the central complex, lateral accessory lobe (LAL), and superior medial protocerebrum (SMP; #18d* in Fig. 9A, D, E and G).
DALcm1 and DALcm2 have two hemilineages forming two paired HSATs. The medial HSAT passes behind the medial lobe into the fronto-medial commissure, following the dorsal HSAT of BAmd1 (FrMC; #20m* in Fig. 9A and G). As in the case of BAmd1d (#13d), the medial HSAT of DALcm that passes through the ML is clearly demarcated in the pupa, however it is indistinct in adult brains (Fig. 8C′ and F). The lateral HSATs of DALcm1-2 (#20l*), accompanied by the single SAT of DALd (#22), pass through the elbow formed by the VL and peduncle before turning ventrally (Fig. 9A, D–E, G; Fig. S2B). These tracts constitute the descending central protocerebral tract (deCP) that projects towards the ventral brain, including the VMC, VLCi, and SEG (Pereanu et al., 2010). DALv1 has a prominent SAT that projects straight posterior in between the ventro-lateral protocerebrum (VLP) and lateral accessory lobe (LAL) compartments (#25 in Fig. 9A, D and G), forming the anterior component of the lateral equatorial fascicle (LEFa; Pereanu et al., 2010). The LEFa bifurcates more posteriorly and enters the great commissure (GC; Fig. 9F and G; Fig. S5C and D). DALv2 (marked by EB1-Gal4 and per-Gal4; Spindler and Hartenstein, 2010, 2011) and DALv3 (marked by en-Gal4; Kumar et al., 2009a) send their SAT dorso-medially, forming the anterior componenet of the lateral ellipsoid fascicle (LEa) that passes underneath the ML towards the central complex (#26* in Fig. 9A, D and G; Fig. S2D–E). DALv2 projects into the ellipsoid body, forming the R-neurons of this compartment; DALv3 is branched, crossing the ellipsoid body dorsally and ventrally in the supraellip-soid commissure (SEC; #27d) and subellipsoid commissure (SuEC; #27v, Fig. 9D; S2D–E), respectively.
DALl1 and DALl2 are located laterally of the SP. DALl2 projects a short SAT into the anterior part of the anterior ventro-lateral protocerebrum (VLPa; #24 in Fig. 9A and G); DALl1 has a long tract that passes posteriorly (#23 in Fig. 9D–G) and, after giving off a branch ventrally towards the posterior lateral protocerebrum (PLP), makes a 180 degree turn back towards anterior to reach the anterior optic tubercle (AOTU). The recurrent leg of the DALl1 SAT can be followed in the larva and early pupa (not shown), but is indistinct in the adult.
Changes in DAL lineage topology during metamorphosis occur when the emerging AOTU, which has no larval counterpart, pushes in between DALcl1-2 (#18–19, lateral) and DALcm1-2 (#20–21, medially; Fig. 8C–C′, E–E′ and G–G′). During this period, HSATs of these two pairs move slightly apart (arrows in Fig. S2C–D). These changes aside, all DAL lineages maintain their relative position. Most of the SATs or HSATs of the DAL group, including the ventral HSATs of DALcl1/2 and the SATs of DALd, DALl1, and DALv1 (#22, #23, #25), can be individually followed throughout development (Fig. 8). The dorsal HSATs of DALcl1/2 (#18d*), as well as both HSATs of DALcm1/2 (#20m*, 20l*) form pairs; DALv2 and DALv3 have tracts that are close together and cannot be separated (#26*). Furthermore, these paired tracts become fairly indistinct in BP104-labeled brains of late pupae (>P48); as mentioned above, medial DALcm cannot be followed beyond its entry point into the neuropil of the adult brain.
DAM lineages (#28–32)
Clusters and SAT entry points of all five DAM lineages (#28–32) are located close to the brain midline, medial of the VL (entry portal ptVL dm; Fig. 9B–D). All DAM lineages have single SATs; tracts of DAMd2–3 (#29–30) and DAMv1-2 (#31–32) form pairs whose SATs cannot be separated from each other in the neuropil. DAM tracts can be clearly followed throughout pupal development (compare panels Fig. 8B, D, F, H, J and L; Fig. S2A–B). The DAMd1 SAT (#28) projects medially and crosses the midline in the anterior dorsal commissure (ADC, Fig. 9D and G). The paired DAMd2-3 tract (#29*) projects posteriorly, forming the thick loSM fascicle (Fig. 9D–G). The DAMv1-2 pair (#31*), located ventrally adjacent to DAMd2-3, forms a short tract that is directed dorso-posteriorly and terminates near the surface of the superior medial protocerebrum (SMP; Fig. 9D and G). The only developmental change affecting the DAM lineages is a dorsal shift in location, subsequent to the growth in volume of the ML and the surrounding anterior inferior protocerebrum (IPa)/SMP compartments (compare panels Fig. 8D, H).
DPL lineages (#33–50)
DPL lineages are clustered over the dorso-lateral brain surface. The lineage subgroups DPLal1-3, DPLam, and DPLd are located anteriorly in the crevice between the anterior optic tubercle (AOTU) and superior lateral protocerebrum (SLP). All other DPL subgroups are located more posteriorly, surrounding the mushroom body calyx (CA): dorso-medially (DPLc1-5), dorsally (DPLm1-2), and dorso-laterally (DPLp1-2, DPLpv) (Fig. 10A–C and F). SATs of DPLal1-3 (#33–35) form a conspicuous, crescent shaped bundle that defines the anterior transverse superior fascicle (trSA). From the DPLal entry point, located at the lateral base of the SLP (ptSLP l; Fig. 10C–C″), this bundle curves ventro-medially, turns, and then continues dorso-medially to terminate superficially within the superior lateral protocerebrum compartment (SLP; Fig. 10A and G). A second, more ventral bundle curving around the peduncle at its ventral side branches off the trSA. According to the larval and adult clones of DPLal lineages (Wong et al., 2013), one of them (DPLal1, #33) is restricted to the trSA, whereas two (DPLal2-3) contribute to both the trSA and a ventral branch (#34d* and #34v* in Fig. 10A and G, Fig. S5A–B). DPLam (#36), marked by the en-Gal4 driver (Kumar et al., 2009a), is located medially adjacent to the DPLal lineages (Fig. 10A–C″). The DPLam SAT enters between the AOTU and SLP (ptSLP a; Fig. 10C″), projects straight postero-ventrally, through the center of the hemi-circle formed by the trSA fascicle (Fig. 10A) and terminates in the inferior proto-cerebrum (purple line in Fig. 10G), laterally adjacent to the peduncle (Fig. 10D and G, Fig. S2C–D). We call this projection the vertical tract of the superior lateral protocerebrum (vSLPT; Fig. 10D). DPLd fibers (#42) enter laterally of the vertical lobe of the mushroom body (ptVL dl; Fig. 10A–C″). DPLd projects two HSATs: one is directed medially (#42m), curving around the anterior surface of the VL and entering the anterior dorsal commissure (ADC in Fig. 10A and G); the second one (#42p) projects postero-laterally, forming an anterior component of the loSL fascicle (Fig. 10A, D and G; Fig. S2D–E).
Among the posterior DPL lineages, the DPLc subgroup (#37–41) occupies the most medial position. DPLc lineages have short, ventro-medially directed SATs that enter through a common portal at the boundary between the lateral and medial superior protocerebrum compartments (ptSLP pm; Fig. 10C and G; yellow arrowhead at top of Fig. 10G). Tracts of DPLc1 (#37), c3 (#39), and c5 (#41) converge upon a point directly lateral of the conspicuous loSM fiber system (green lettering in Fig. 10E), which at this level contains numerous bundles of the DPM and CM lineages (see below). From this point, DPLc1 and DPLc5 curve in a crescent shaped path underneath the loSM (medial component of the transverse posterior fascicle of the superior protocerebrum, trSPm; Fig. 10E and G, Fig. S3A and B). The SAT of DPLc3 (#39) projects straight anteriorly, rather than medially as with DPLc1 or DPLc5 (Fig. 10E and G, Fig. S3A and B). DPLc5 has a second HSAT (#41p in Fig. 11B and D; not distinguishable in BP106/BP104-labeled preparations past P24), which enters at the posterior brain surface and projects anteriorly as part of the loSM system (see below). SATs of DPLc2 (#38) and DPLc4 (#40), located laterally adjacent to DPLc1/3/5 (#37, #39, #41), form a paired tract which extends ventrally and medially, curving around the loSM parallel to, but slightly more ventro-posteriorly than the crescent formed by DPLc1/5 (Fig. 10E and G, Fig. S3A–B).
DPLm1 (#46) and DPLm2 (#47) enter the posterior surface of the superior lateral protocerebrum, just dorsal of the calyx (ptSLP p; Fig. 10B and F). The SAT of DPLm1 projects anteriorly into the SLP; DPLm2 turns laterally towards the lateral horn (LH; Fig. 10E and G; Fig. S3A and B). DPLm2 has a second tract (#47p in Fig. 11D), no longer marked by BP104/BP106 after P12, which leaves the brain and projects to the ring gland.
SATs of DPLl1-3 (#43–45) enter at the junction between the SLP and LH (ptSLP pl; Fig. 10B and F). DPLl2 and DPLl3 form a pair with two hemilineages each. The posterior HSATs of DPLl2-3 (#44p*) are directed anteriorly, forming a thick bundle that constitutes the loSL fascicle (Fig. 10D–G, Fig. S4A). The anterior DPLl2-3 hemilineages (#44a*) shift far anteriorly during metamorphosis (Fig. 8B, D, F, H, J and L); forming a paired HSAT that enters the SLP at its anterior surface close to DPLam (ptSLP a), and projecting parallel to DPLam ventrally into the inferior protocerebrum (Fig. 10A, B, D, and G; Fig. S4A). DPLl1 (#43) enters next to the posterior HSATs of DPLl2-3 (Fig. 10B), but extends medially, forming a thin fiber bundle, the trSPl, which converges upon the fiber tracts formed by the DPLc group (Fig. 10E–G; Fig. S3A).
The last DPL subgroup, DPLp (#48–50), includes clusters of neurons located at the posterior surface of the lateral horn, lateral of the calyx (LH, CA; Fig. 10B and F). DPLp1 and DPLp2 form a pair with two HSATs. One HSAT (#48m*) enters via the entry portal ptCA l and projects medially, crossing over the peduncle and forming the most posterior of a dorsal set of commissures (pPLPC; Figs. 10B, E and G, Fig. S3C and D). The second HSAT (#48a*) is a short, anteriorly directed tract that enters at the junction between the SLP and LH (ptSLP pl) and terminates in the LH (Fig. 10B, E and G; Fig. S3C and D). An additional fiber bundle (#48v*) that branches off the anterior tract projects ventrally along the posterior vertical fascicle (Fig. 10G). DPLpv (#50) lies far more ventral, flanking the posterior surface of the posterior lateral protocerebrum (PLP; Fig. 10C and E–G). Its single SAT enters via the ptPLP ps portal and projects anteriorly as part of the fiber system called the posterior lateral fascicle (PLF; Fig. 10B, E and G; Fig. S3C and D). In the larva and early pupal stages, one can recognize a lateral branch of the DPLpv SAT that projects towards the optic lobe (blue arrowhead in Fig. 11A′, C′ and E′).
Of the 18 DPL lineages, nine (DPLam, DPLd, DPLc1, DPLc3, DPLc5, DPLm1-2, DPLl1, DPLpv) can be individually followed throughout pupal development (Figs. 8 and 11). DPLal1-3 form a triplet tract; DPLc2 and DPLc4, as well as DPLl2-3 and DPLp1-2 form paired tracts, all of which are clearly visible from larval to adult stages (Figs. 8 and 11). The cell body cluster location of DPL lineages is affected strongly by the expanding superior protocerebrum, which pushes many of the lineages far posterior. Thus, DPLc1-2 are fairly anterior in the larva (Fig. 8A′ and B), at the level of the VL and end up almost at the level of the CA in the adult (Fig. S3A and B). Cell bodies of DPLpv move from a postero-dorsal position in the larva to a postero-ventral one in the adult (#50; Fig. 11A′, C′, E′, G′, I′ and K′; Fig. S3C and D).
Four lineages, DPLc5, DPLm2, and DPLl2-3 deserve special mentioning because of the separation of hemilineage cell bodies and their HSATs. In the case of DPLc5, one HSAT follows the other DPLc tracts medially, whereas the other HSAT, clearly visible only in the larva and early pupa (#41p; Fig. 11B and D) first extends postero-ventrally; and then turns anteriorly into the loSM, following the general trajectory of DPM lineages (see below). For this reason, DPLc5 was previously named “DPMl3” (Pereanu and Hartenstein, 2006), but more aptly deserves the group designation DPLc, because it’s anterior HSAT (and its clone geometry; see accompanying paper by Wong et al., 2013) shares more commonalities with DPLc lineages. The DPLc5 hemilineage generating the posterior HSAT separates from the anterior hemilineage, moving far posteriorly and ventrally (see accompanying paper). The paired DPLl2-3 also represent a case where hemilineage clusters become far removed from each other as discussed previously (see above). Finally, in the case of DPLm2, two hemilineages also seem to exist, one of which loses expression of the Neuroglian protein. Aside from the short, laterally-directed tract that is clearly visible in the larva, pupa, and adult, a second, thinner tract (#47p) is visible only in the larva and early pupa (compare #47 to #47p in Fig. 11D). The DPLm2 HSATp extends ventro-medially, exits the brain, and projects to the ring gland.
DPM lineages (#51–59)
Cell body clusters of the DPM group are situated at the dorso-medial surface of the brain, medially of the calyx. We distinguish a more dorso-anterior (DPMm1-2, #53–54), ventro-posterior (DPMpm1-2, #58–59), and lateral (DPMl1, #51; DPMpl1-3, #55–57) subgroups (Fig. 12A–C). DPMpl1-2 (#55–56) form a pair whose SATs enter the neuropil medially adjacent to the calyx (ptCA m) and continue antero-dorsally, following the loSM fascicle (Fig. 12A, B and D–F). DPMpl3 (#57), located further ventrally, forms an SAT that enters via the conspicuous ptPB v portal at the tip of the protocerebral bridge (PB) and projects along the MEF fascicle (Fig. 12A, B and D–F). DPMm1 (#53) and DPMpm1/2 (#58–59) represent three of the large and fast-cycling type II lineages that have been previously described to innervate the central complex (Bello et al., 2008; Boone and Doe, 2008; Izergina et al., 2009). Of the eight type II lineages, six of the dorso-posteriorly located type II lineages (CM1, CM3/4, DPMm1 and DPMpm1/2) are marked by expression of dllmd23-Gal4 (Izergina et al., 2009) and earmuff (9D11-Gal4; Bayraktar et al., 2010). There are no known markers for the remaining two lineages (CP2/3). DPMm1, DPMpm1, and DPMpm2 include sub-lineages whose main SSATs, destined for the central complex (#53b, 58b, 59b), characteristically enter the neuropil in contact with the protocerebral bridge (entry portals ptPB dm and ptPB dl, respectively; Fig. 12B). As a result, the SSATs of the dorso-medial root and dorso-lateral roots of the fan-shaped body (mrFB, #53b–c; dlrFB, #58b/59b) project antero-posteriorly into the neuropil of the fan-shaped body (FB), respectively (Fig. 12D–F, Fig. S4B–C; Pereanu et al., 2010).
Additionally, DPMpm2 gives off an SSAT (#59a) projecting more dorsally, as part of the loSM (Fig. 12D–F); DPMpm1 has another SSAT (#58a) following the mALT antero-posteriorly (Fig. 12F). DPMm1 has multiple other SSATs; the four most prominent ones are a tract joining the loSM (#53a), one crossing the posterior brain surface towards the contralateral hemisphere (#53d), and two (#53c, e) extending ventrally and anteriorly along the ventro-medial surface of the fan-shaped body (Fig. 12E). #53c turns ventrally into the ventro-medial cerebrum (VMC; Fig. 12E and F); #53e continues anteriorly (not shown). DPMm2 (#54) is located laterally adjacent to DPMm1 and has a single SAT that enters the superior medial protocerebrum vertically via the ptPB dl portal (Fig. 12B, D). The distal SAT of DPMm2, which expresses BP106 only until P12 (Fig. 11D), turns anteriorly, extends over the roof of the central complex, and crosses to the contralateral hemisphere in the anterior chiasm that lies immediately posterior of the median bundle (MBDLchi in Fig. 12F). DPMl1 (#51), located next to DPMpl3 (#57) as it enters the MEF (Fig. 12A–C), has a long descending SAT that projects towards the subesophageal ganglion (SEG; Fig. 12F). The distal SAT is visible with BP106 only until stage P24 (Fig. 11B and D).
Cell body clusters and SATs of all DPM lineages perform a shift ventro-posteriorly as the superior medial protocerebrum and inferior protocerebrum expand during metamorphosis (Fig. 11B, D, F, H, J and L; Fig. S4B–C). Of the eight DPM lineages, four (DPMm1-2, DPMpm1-2) can be individually followed throughout metamorphosis (Fig. 11A–L). During the later stages of pupal development, axons formed by the three type II lineages (DPMm1, DPMpm1-2) break up into multiple thinner, parallel bundles that flank the protocerebral bridge (PB; #53, #58, #59 in Fig. 11G–L). The paired tract formed by DPMpl1-2 travels in the loSM fascicle and is also visible throughout development (#55* in Fig. 11A–L). The distal DPMl1 and DPMpl3 lose expression of BP104 Neuroglian during later pupal stages and can only be identified in the adult brain on the basis of GFP-labeled MARCM clones. For all other DPM lineages, it is only possible to follow the SATs into the larger fascicle (e.g. loSM, MEF) to which they contribute; thus, a lineage trajectory can only followed when it is labeled by GFP (see accompanying paper by Wong et al., 2013).
CM lineages (#60–63)
CM lineages occupy the postero-medial brain cortex, ventro-medially of the calyx (CA; Fig. 12A–C). Three CM lineages (CM1, CM3, CM4) are large type II lineages (called DM6, DM5 and DM4, respectively, in Bello et al., 2008). Each of these forms multiple sub-lineages, and possesses a complex array of sub-lineage tracts (SSATs). Only a subset of these, (the “main” SSATs), can be followed using global markers like BP106 or BP104. CM1 (#60) forms two main SSATs; CM4 (#62) possesses three; and CM3 (#61) has four (Fig. 12F). One SSAT of each of these three lineages enters at a ventral level into the ventro-medial cerebrum (ptVMCpo) and projects forward in the loVP fascicle (#60v* in Fig. 12A, B, D and F). The other CM SSATs enter at the tip of the protocerebral bridge (ptPB v) and project straight anteriorly in the MEF (#60d* in Fig. 12A, B and D–F). CM3 and CM4 form an additional SAT turning dorsally into the loSM (#61da* in Fig. 12D and F). CM5 (#63), located close to the brain midline, projects a single SAT forward in the MEF (Fig. 12A–D and F). The CM5 SAT then leaves the MEF and turns ventro-posteriorly, exiting the brain towards the subesophageal ganglion (SEG; Fig. 12F; visible in MARCM labeled CM5 clone; see accompanying paper by Wong et al., 2013).
Whereas CM5 with its single SAT can be identified throughout metamorphosis (#63; Fig. 11A–L), the more complex CM1, CM3, and CM4 (#60–62) with their multiple SSATs present difficulties. In the larva, SSATs of each lineage still form one bundle. CM4 (#62) is situated furthest dorsally and its SSAT bundle enters right at the tip of the protocerebral bridge, where it splits to send one main SSAT dorsally into the loSM, one straight anteriorly into the MEF, and one ventrally into the loVp (PB; #62; Fig. 11A′). CM3 lies ventrally of CM4; its SSAT bundle projects dorsally, then splits into similar components as those of CM4 (#61; Fig. 11A′). CM1 lies medially adjacent to CM3 (#60; Fig. 11A′) and sends a dorsal SSAT into the MEF and a ventral one into the loVP. Already by P12, the cell body cluster of CM4 has split into two, one dorsal component connected to the SSATs that enters the loSM and MEF and one ventral component projecting as part of the loVP (Fig. 11C′). These separate clusters move further apart towards later stages of metamorphosis (Fig. 11E′, Fig. S4D and E). CM3 and CM1 undergo a similar change, but the dorsal and ventral components stay closer together than those of CM4 (Fig. S4C and D). From P32 onward, individual subcomponents are no longer clearly distinguishable: diffuse dorsal cell body groups with fibers coalesce into bundles joining the MEF and loSM with the ventral groups projecting into the loVp (Fig. 11G–L).
CP lineages (#64–67)
The CP group includes four lineages, CP1-4, located ventro-laterally of the calyx (CA; Fig. 12A–C). CP2 (#65) and CP3 (#66) form a paired lineage with joined tracts that cannot be distinguished from each other. CP1 (#64) and CP2/3 (#65–66) possess two hemilineages and form two HSATs each; CP4 (#67) has one. The dorsal HSATs of CP1-3 (#64d, 65d*), joined by CP4 (#67), enter via the entry portals ptCA l and ptCA vl and project straight antero-medially, forming the oblique posterior fascicle (obP; Fig. 12A, B, D and F). The obP is a conspicuous landmark tract that crosses over the peduncle immediately in front of the CA and then turns anteriorly to merge with the loSM (Fig. 12D–F). Within the obP, the paired HSAT of CP2/3 is located further dorsally; tracts of CP1 (#64) and CP4 (#67), which are close and form a single bundle, are more ventral, nearly “touching” the peduncle (Fig. 12D). The ventral HSATs of CP2/3 (#65v*) enter through the ptPLP ps portal and project forward as part of the posterior lateral fascicle (PLF), running ventro-laterally of the peduncle (Fig. 12A, B and D–F). The ventral HSAT of CP1 (#64v) joins the posterior component of the lateral equatorial fascicle (LEFp) that extends ventrally of and parallel to the peduncle (Fig. 12D).
All CP tracts can be followed throughout metamorphosis (Fig. 11A–L). As described above for the CM group, hemilineages of CP1-3 (#64–66) move apart from P24 onward (Fig. 11E′, G′ and I′; Fig. S3C and D). Dorsal tracts of CP2/3 (#65d/66d), and the merged CP1dorsal-CP4 tract (#64d/67), enter laterally of the CA. Entry points of the paired ventral CP2/3 HSAT (#65v/66v) and the ventral CP1 HSAT (#64v) move further ventrally. The three posterior lineages of the DPL group, DPLp1-2 (#48–49) and DPLpv (#50) are always closely associated with the CP group. The DPLp1-2 pair (#48–49), located laterally adjacent to the dorsal CP2/3 hemilineages (#65d/66d; Fig. 12C), joins them in the obP (Fig. S3C and D). DPLpv (#50) sits laterally adjacent to the ventral CP2/3 clusters and extends its SAT into the PLF (Fig. 12C, Fig. S3C and D).
BLA lineages (#68–75)
The BLA lineages fall into two subgroups, a dorsal one (BLAd1-4, BLAl) located laterally of the superior protocerebrum, and a ventral one (BLAv1-2, BLAvm) with cell bodies anteriorly and laterally of the anterior ventro-lateral protocerebrum (VLPa; Fig. 13A–F and I). BLAd1-4 (#68–71) and BLAl (#72) are neighbors of the anterior DPLal lineages (#68*, Fig. 13B). The SATs of the quartet BLAd1-4 (#68–71) coalesce into one thick bundle that passes medially underneath the anterior optic tract (AOT) and enters via the ptSLP l portal, then turns upward to form the trSl fascicle (yellow arrowhead in Fig. 13F) that extends into the superior lateral protocerebrum (Fig. 13B, D/D′, E, F and I). BLAl, ventrally adjacent to the BLAd cluster, has two hemilineages (#72). One HSAT (#72m; Fig. 13I) is directed antero-medially, extending over the dorso-anterior surface of the VLPa, parallel to the AOT; this SAT is distinguishable in BP106 labeled brains until P24 (Fig. 8B, D and F) and later becomes indistinct. The second, dorso-posteriorly directed HSAT (#72d; Fig. 13I) extends upward along the lateral surface of the SLP, joining the superficial component of the trSI fascicle formed by BLD1-4 (see below; Fig. 13E, F and I). The three ventral BLAs (BLAv1-2, #73–74; BLAvm, #75) have two hemilineages each with one of their HSATs directed medially, the other posteriorly. BLAv2 (#74), located furthest dorsally in the BLA group, projects its medial HSAT (#74m) through the ptVLP dls portal into the VLPa, where it forms the horizontal VLP tract (hVLPT; Fig. 13A, B, D/D′ and I). The posterior HSAT of BLAv2 (#74p) extends backward over the lateral surface of the VLPa and then turns medially through the ptLH a portal towards the great commissure (GC; Fig. 13E, F and I). BLAv1 (#73) forms a similar pattern, with one HSAT (#73m) projecting medially over the surface of the VLPa, close to the AOT and the BLAl towards the pt VLP dm portal (see above; Fig. 13A, B, D/D′ and I); and a second HSAT (#73p) extending posteriorly and then ventrally, through the pt VLP dli portal into the GC (Fig. 13A, B, D/D′ and I). BLAvm (#75), the ventral-most BLA lineage, sends one HSAT dorso-medially over the surface of the VLPa, and up into the anterior SLP (#75m; Fig. 13A, B and I); the posterior HSAT (#75p) projects along the lateral surface of the VLPa (Fig. 13F and I).
The tracts formed by all BLA lineages, with the exception of BLAl and the posterior HSAT of BLAvm, which are no longer visible after P32, can be followed throughout metamorphosis. Dorsal BLA clusters and SAT entry points maintain their position (Fig. 8A–L; Fig. S5). Ventral BLA clusters and their HSAT entry points move apart, following the enormous growth of the VLPa compartment (Figs. 6F, G; Fig. 8A–L; Fig. S5C, D). The hemilineage clusters of BLAv1 and BLAv2 become separated, with the medial cluster moving up towards the dorsal tip of the VLPa while the posterior hemilineage cluster moves laterally (Fig. 13D, Fig. S5C and D). The posterior HSATs of both BLAv1 and BLAv2 acquire an additional branch: one BLAv2 HSAT projects dorsally towards the lateral horn (LH; Fig. 13E, green arrowhead), while the BLAv1 HSAT projects ventrally, into the inferior ventro-lateral cerebrum (VLCi; Fig. 13B, green arrowhead; Fig. S5C and D).
BLD lineages (#77–83)
BLD lineages flank the lateral surface of the superior lateral protocerebrum and the lateral horn, posteriorly adjacent to the dorsal BLA lineages discussed above (SLP; LH; Fig. 13C and D). Four BLDs lineages, BLD1-4 (#77–80), have tracts that enter at the base of the superior lateral protocerebrum (ptSLP l), make a characteristic 180 degree turn, curving around the anterior optic tract (AOT) and backward, dorso-posteriorly along the surface of the SLP, forming the superficial component of the trSl fiber system (Fig. 13D/D′, E–I; Fig. S6A, B). This conspicuous fiber system (red arrowheads in Fig. 13F) lies posterior to and superficially of the similarly shaped tract carrying the BLAd SATs (see above; yellow arrowhead in Fig. 13F). It also contains the dorsal HSAT of BLAl (see above). BLD1 (#77), BLD3 (#79), and BLD4 (#80) consist of two hemilineages. Aside from the HSAT that joins the trSI (#77d, #79d, #80d; Fig. 13E, F and I), they have a ventrally directed HSAT. In the case of BLD4, located more anteriorly, this tract (#80v) grows ventrally into the anterior ventro-lateral protocerebrum (VLPa; Fig. 13E and I). The ventral HSAT of BLD1 (#77p), located further posteriorly, follows the surface of the posterior VLP (VLPp) compartment ventrally, then splits into a medial branch that enters the VLPp and a lateral one which extends towards the lobula of the optic lobe (Fig. 13G, I). BLD5 (#82) and BLD6 (#83) are located in the posterior brain, flanking the lateral horn ventro-posteriorly (LH; Fig. 13D, G and H). Best visible in the larva and early pupa (Fig. 11B, D and E), both BLD5 and BLD6 form characteristic L-shaped SATs that initially project ventrally along the surface of the posterior lateral protocerebrum (PLP) and then turn medially (Fig. 13G–I) to enter via the ptPLP l portal (Fig. 13D/D′, G and H). Both send a short lateral branch into the lobula at this medial turn (not shown). The SAT of BLD5 (#82, marked by expression of ato-Gal4; Hassan et al., 2000; Spindler and Hartenstein, 2010, 2011) continues across the midline in the great commissure (GC); the short SAT of BLD6 (#83) terminates in the ventral VLPp (Fig. 13I, Fig. S6C and D).
Anterior BLD lineages (#77–83, BLD1-4) can be individually followed only throughout early stages of pupal development. Even at these early stages, it is difficult to separate the SATs in confocal sections taken in the (typical) frontal plane. However, BLD1-4 can be separated from each other by their characteristic additional branches (described above). This also makes it possible to assign MARCM clones to their proper lineages (see accompanying paper by Wong et al., 2013). Cell body clusters of the anterior BLD lineages maintain their antero-dorsal position (Fig. 6F and G; Fig. S6A and B). The analysis of GFP-labeled clones (see accompanying paper by Wong et al., 2013) indicates that the hemilineages of BLD1 (#77) and BLD3 (#79) move apart. In the case of BLD1, the hemilineage producing the ventral HSAT comes to lie posterior of the hemilineage projecting into the trSI; with BLD3, it is the other way around (Fig. S6B). Clusters and SATs of BLD5 and BLD6 are easy to follow throughout metamorphosis (Fig. 11B, D, F, H, J and L); clusters of these lineages also move posteriorly and ventrally, to end up in the niche between the posterior lateral protocerebrum (PLP) and the lobula (Fig. 13D).
BLP lineages (#84–87)
The BLP lineages form two pairs, BLP1-2 (#84/85) and BLP3-4 (#86/87), whose cell body clusters are located posteriorly of the lateral horn (LH) and posterior lateral protocerebrum (PLP; Fig. 13C, D, H and I). Each BLP lineage projects one SAT. The paired SAT of BLP1/2 (#84*) enters via the pt PLP ps portal and extends antero-ventrally, following the lateral surface of the posterior lateral protocerebrum (PLP) and posterior ventro-lateral protocerebrum (VLPp), and projecting into the anterior ventro-lateral protocerebrum (VLPa; Fig. 13E–I). The paired BLP3/4 (#86*) tract enters the neuropil at the boundary between the lateral inferior protocerebrum (IPl) and the LH and then turns dorso-laterally into the LH (ptLH p) where it ends (Fig. 13H, green arrowheads; Fig. 13I). The BLP3/4 (#86–87) tract is similar in entry and trajectory to the anterior HSAT pair formed by DPLp1/2 (#48–49), which lies medially of it (Fig. 13H, blue arrowhead; see above).
The two paired BLP tracts (#84/85 and #86/87) are clearly visible throughout metamorphosis (Fig. 11A′, C′, E′, G′, I′ and K′). The BLP3/4 cluster shifts upward and, in the P48 pupa and adult, comes to lie dorsally of BLP1/2 (Fig. 11I′/K′; Fig. S6C and D). Aside from BLP1-4, two other BLP lineages, BLP5 and BLP6, were described in the larval brain (Cardona et al., 2010a). Located ventrally of the other BLP lineages, the tracts of BLP5 and BLP6 extend anteriorly, passing ventrally of the transverse fiber systems connecting the lobula and the ventro-lateral protocerebrum (VLP). The BLP5-6 tracts are no longer distinguishable from P24 onward, and we recovered no MARCM clones (see accompanying paper by Wong et al., 2013). We speculate that these tracts, visible in the larva, belong to groups of neurons of the lobula.
BLV lineages (#89–94)
The BLV lineages form an anterior group (BLVa1-4, #89–92) and a posterior group (#93–94; BLVp1-2; Figs. 6F and G, 13D). BLVa1-4 (#89–92) are located ventro-laterally of the anterior ventro-lateral protocerebrum (VLPa) compartment; all of their SATs project dorsally. BLVa3 and 4 (#91, 92) have a short paired tract (#91*) entering the ventro-lateral surface of the VLPa compartment (pt VLP vli; Fig. 13A, B, D/D′ and I). BLVa1-2 (#89, 90) forms another paired tract (marked by so-Gal4; Chang et al., 2003; Fung et al., 2009; Spindler and Hartenstein, 2010). In the larva and early pupa (P12-24), BLVa1-2 are located ventrally, next to BLVa3-4 (Fig. 11B and D; Fig. S6A and B). The long BLVa1-2 tract extends vertically along the lateral surface of the VLP, entering at the base of the lateral horn (ptLH a; Fig. 13D/D′ and E) and terminating in the primordium of the lateral horn. At later pupal stages (P24, P32, P48), cell body clusters of BLVa1-2 perform a dramatic shift dorsally and in the adult come to lie at the dorsal surface of the VLPa, adjacent to the BLAd and anterior BLD clusters (Fig. 11F, G′, I′ and L′; Fig. S6A and B; see also accompanying paper by Wong et al., 2013).
BLVp1 (#93) and BLVp2 (#94; previously called BLVp3 in the larva; Cardona et al., 2010a) possess two hemilineages each which move away from each other during metamorphosis. In the larva and early pupa, BLVp1 and BLVp2 have a single cluster each, located at the ventro-posterior brain surface ventrally of the CM and CP lineages (Fig. 11A′ and C′). BLVp tracts are directed forward and split into a dorsal and a ventral HSAT (green arrowheads in Fig. 11A′). The dorsal HSATs enter the posterior lateral protocerebrum (ptPLP pi; Fig. 13D/D′, G and H) and form a component of the PLF fascicle. Dorsal BLVp1 (located medially of BLVp3) turns medially into the great commissure (GC); dorsal BLVp2 passes the GC and projects into the inferior protocerebrum (Fig. 13I). The ventral HSATs of BLVp1 and BLVp3 form a paired tract. In the larva and early pupa (P12), this tract projects anteriorly, passing the transverse fiber systems connecting the lobula and VLP ventrally, and reaching the VLPa. Starting around P24, the ventral hemilineages of BLVp1-3 move anteriorly and in the late pupa/adult come to lie at the ventro-lateral surface of VLPa, laterally adjacent to the BLVa3-4 clusters (#91a* in Fig. 8H, J and L). The paired BLVp1-3 HSAT (#93a*) enters the VLPa (pt VLP vls) and traverses the VLPa as the vertical VLP tract (vVLPT; Fig. 13D/D′ and I).
Discussion
SATs and neuropil fascicles can be followed throughout brain development
In the present work, we have assigned all lineage-related tracts of the Drosophila supraesophageal ganglion to fiber bundles that can be visualized by global markers, including antibodies directed against neuronal membrane proteins (BP104/6; resulting in positive labeling of bundles), as well as synaptic proteins (NCad/nc82; negative labeling of bundles). Lineage-related tracts arise in the larva when secondary neurons extend their axons, forming cohesive fiber tracts that we termed secondary axon tracts (Dumstrei et al., 2003b; Pereanu and Hartenstein, 2006). By the end of the larval stage, most secondary axon tracts of the supraesophageal ganglion have reached their full length. That is to say, tracts that in the mature (adult) brain will reach from the anterior neuropil (e.g. the antennal lobe) to the posterior neuropil (e.g. calyx or lateral horn) do so already in the larva. Based on the appearance of clones induced at later larval stages, it is evident that SATs of the late larva have not yet reached their full size in terms of number of axons: neurons born during late larval stages in many cases have only short axons or no axons (J.L., J. O., and V.H., unpublished). These late-born neurons then differentiate during early pupal stages and fasciculate with the earlier formed axons, leading to an increase in diameter of SATs. Furthermore, we show that only in a minority of lineages do axons that grow out in the pupa (presumably axons of late-born neurons) form novel branches that split off the pre-existing SAT (e.g. BAmv1).
SATs and the fascicles they form in the neuropil remain visible as conspicuous landmarks throughout metamorphosis and in the adult brain. Variations in the labeling properties of different SATs and fascicles arise around P24 when the differentiation of adult neurons is initiated. Some fascicles maintain a strong signal along their entire length; in other cases, labeling becomes fainter (e.g. lower signal-to-noise ratio, see Table 1). Typically, we observed that the most proximal segment of the tract remains strongly labeled, allowing one to follow its entry into the neuropil. More distally, however, the intensity of the labeling declines. Although the overall labeling of fascicles within the neuropil remains strong, it becomes very difficult to distinguish between individual SATs within a fascicle (formed by multiple lineages) by the late pupa (after P48).
Hemilineages and sub-lineages form separate tracts
In the majority of lineages (type I lineages), neuroblasts divide asymmetrically into next-generation neuroblasts and ganglion mother cells (GMCs). GMCs undergo one division, producing two neurons which typically follow two different fates (a and b). Recent work has shown that all neurons sharing the a fate or the b fate group together as a hemilineage. The two hemilineages formed by one neuroblast typically form two separate tracts (HSATs). In a good number of cases, one of the hemilineages undergoes cell death, leaving only one hemilineage and its HSAT (Truman et al., 2010). Other lineages maintain both hemilineages and HSATs. At the larval stage, HSATs of a lineage enter the neuropil very close to each other. This close proximity is maintained throughout metamorphosis in the majority of lineages possessing two hemilineages, including DALcl1/2, DALcm1/2, DPLal2/3, DPLd, and BLAv2. In a number of cases, hemilineages and their HSATs move slightly apart (BAlc, BAmd1, CP2/3, BLAl, BLAv1); in other cases (DPLc5, DPLl2/3, BLAl, BLAvm, BLD1, BLD3, BLVp1/2), the separation of hemilineages is more extreme, leading to HSAT entry portals being on opposite sides of the neuropil. In most of these cases (DPLl2/3, BLAvm, BLVp1/2), the gradual separation can be directly followed by analyzing the SAT patterns at successive, closely spaced pupal stages (P12, P18, P24, P32; see Fig. 3). In several other cases, notably concerning lineages located close to each other in the dorsolateral cortex (BLD1, BLD3, BLAl, DPLc5), the separation only became clear with the help of MARCM clones, where the two hemilineages were always labeled concurrently (see accompanying paper by Wong et al., 2013).
What is the mechanism behind the “movement” of hemilineages? We surmise that the SAT, or HSAT, is “anchored” in the neuropil where it interacts via a multitude of adhesion molecules with its neighboring cells, be they primary axons or glial cells. That would imply that the position of the entry portal of an SAT does not move relative to the neuropil. By contrast, the position of the cell bodies, distal to the entry portal, is more flexible. Large scale morphogenetic processes, like the unfolding of the optic lobe at the lateral surface of the brain, may lead to displacements of the cell bodies relative to their original position at the neuropil surface. In the case of two hemilineages whose cell body clusters are “pulled apart” we speculate that, although both HSATs initially contact the neuropil surface very close to each other, only one HSAT enters the neuropil. The other HSAT does not enter, but follows the neuropil surface tangentially, entering at a distant location through a separate, anterior portal. For both DPLl2/3 and BLVp1/2 this type of behavior can be observed. During metamorphosis, the cell body clusters of the anterior hemilineages move forward, reaching a position close to the anterior entry portals.
Neuroblasts of type II lineages follow a different pattern of proliferation from type I neuroblasts. Rather than forming ganglion mother cells, they produce more neuroblasts (“intermediate progenitors”; for review, see Brand and Livesey, 2011). An intermediate progenitor then behaves like regular (type I) neuroblast, giving rise to GMCs which divide into two neurons, thereby forming a sub-lineage. Even though more detailed work is required to establish the precise pattern of sub-lineages generated by DPMm1/DM1, DPMpm1/DM2, and the other type II lineages, it seems likely that at least some of the sub-lineages also generate their own axon bundles (SSAT). For example, the three type II lineages DPMm1, DPMpm1, and DPMpm2 each have a tract that passes on either side of the protocerebral bridge and then projects straight forward, forming the dorsomedial and dorsolateral roots of the fan-shaped body. These tracts most likely correspond to the X, Y, Z fiber systems which carry the columnar neurons of the central complex (Hanesch et al., 1989). Columnar neurons connect in a topographically ordered manner small segments of the protocerebral bridge with columns of the fan-shaped body and/or sectors of the ellipsoid body, but have no projections outside the central complex. We speculate that the columnar neurons form one, or several, sub-lineages of DPMm1, DPMpm1, and DPMpm2, while other neurons of these lineages, projecting outside the central complex via different tracts, represent other sub-lineages.
Comparison of protocols for visualizing fiber assembly and commissural nomenclature
In various invertebrate brains, such as the house fly Musca, both tracts and fascicles have been defined, providing the most comprehensive treatment of gross anatomical fiber systems (Strausfeld, 1976). In this and other classical works on insect neuroanatomy, brain sections were stained with the reduced silver technique developed by Power and Chen (Chen and Chen, 1969; Power, 1943). This technique labels individual fibers and authors have noted that according to precise conditions, the labeling intensity varies according to cell type and depends strongly on parameters such as fiber diameter (Strausfeld, 1976). How can one compare the assemblies of fibers that have been defined as tracts/fascicles in previous studies of silver-stained fly brains with the pattern of SATs/fascicles based on immunofluorescence of adhesion molecules and synaptic protein localization?
Thin axons, like those making up SATs in the larva and adult (~0.2 μm diameter; Cardona et al., 2010b), seem to show little if any labeling following silver impregnation. Fiber systems like the peduncle, or posterior roots of the fan-shaped body, appear mostly signal-negative (Strausfeld, 1976). On the other hand, many terminal axons, whose presynaptic sites are concentrated on thick “varicosities” or “boutons” (Cardona et al., 2010b; Prokop and Meinertzhagen, 2006; Watson and Schürmann, 2002) are labeled strongly (Strausfeld, 1976; Strausfeld and Li, 1999; Strausfeld et al., 2009). As a result, the pattern of fiber systems visible on sections using antibodies against neuronal molecules, such as Neurotactin (labeling axons) or Bruchpilot (labeling active zone at presynaptic sites), appears very different from what is visible on a silver-impregnated brain sections (e.g. the lightly stained SATs and SAT-based neuropil fascicles are barely visible on these sections, being overshadowed by the prominently labeled thick fibers). It is therefore difficult to reconcile the nomenclature of fascicles proposed on the basis of silver-impregnated sections of the Musca brain (Strausfeld, 1976) with the naming of fiber systems visible in brain confocal sections labeled with neuronal or synaptic antibodies.
A clear exception to this general rule are the commissures, most can be recognized in the silver-impregnated Musca brain and the immunofluorescently-labeled Drosophila brain. For these fiber systems, the original topology based nomenclature proposed by Strausfeld (1976) was taken over or modified slightly (Pereanu et al., 2010; Tanaka et al., 2012). For example, the “inferior inter-antennal connective” is now named the “antennal lobe commissure,” the “subellipsoid connective” is called the “subellipsoid commissure,” the “inferior ventral body connective” the “lateral accessory lobe commissure” (the prior names for the lateral accessory lobe of the dipteral brain was “ventral body”), the “arched connective of the ventral body” the “supraellipsoid commissure.” In the posterior brain, the “superior arch commissure” and “great commissure” have maintained their name; the “commissure of the lateral horn” is renamed into the “dorsal commissure of the posterior lateral protocerebrum.”
Among the longitudinal fascicles introduced for Drosophila, only the antennal lobe tract (formerly “antenno-glomerular tract”) and median bundle are easily recognizable in silver-stained and immunofluorescently-labeled sections. In addition, in the superior protocerebrum, the loSM defined here follows a similar trajectory as the “posterior division of the median fascicle” of Strausfeld (1976). More ventrally, the medial and lateral equatorial fascicles (MEF, LEF) are located at a position corresponding to the “equatorial horizontal fascicle” in Musca. The oblique posterior fascicle (obP) may correspond to the “lateral horn-medial protocerebrum tract” of Strausfeld (1976). None of the transverse fiber systems formed by the SATs (trSA, trSI, trSP) appear as named entities in the Musca Atlas; although many tracts and fascicles defined for Musca have no obvious counterparts in the Drosophila brain using global markers like BP104 (anti-Neuroglian). One can hope that the great anatomical detail revealed by silver impregnation techniques in the Musca Atlas and in numerous previous studies can be eventually “translated” to confocal microscopy, using appropriate markers for individual neurons or subsets of neurons.
As previously discussed, we propose that the system of tracts and fascicles that is positively or negatively labeled by antibody labeling against neuronal proteins (e.g. Neurotactin, Neuroglian, N-Cadherin, and Bruchpilot) will provide a helpful anatomical framework for neurobiological studies dealing with specific neuronal subsets. These antibodies are readily available, and can be used in the background of specific neuronal markers (e.g. promoter or enhancer-driven Gal4 drivers combined with membrane-localized fluorescent reporters); thereby allowing the observer to directly relate the neuronal subset to SATs and neuropil fascicles. As shown in the accompanying paper (Wong et al., 2013), it is a straightforward task to determine the lineage identity of MARCM clones based on their characteristic fasciculation with specific SATs. Thus, this work serves as a foundation for assigning secondary neurons (visualized by stable GFP markers or as single-cell clones; Chiang et al., 2011; Jefferis et al., 2001; Lai et al., 2008; Lin et al., 2012) to a comprehensive map of well-defined SATs, taking us a step closer towards reconstructing the brain macrocircuit.
Tracts and fascicles across insect taxa
It has been generally assumed that, for the last several decades, the basic pattern of lineages is conserved among different insect groups (Boyan and Ball, 1993; Duman-Scheel and Patel, 1999; Jarvis et al., 2012; Thomas et al., 1984). This strong statement is based on the observation of conserved patterns of neuroblasts and various subsets of neurons. The map of neuroblasts of an individual segment of the ventral nerve cord in Drosophila (Broadus et al., 1995; Doe, 1992; Hartenstein and Campos-Ortega, 1984; Truman and Bate, 1988) and grasshopper (Bate, 1976; Doe and Goodman, 1985) contains the same number of columns (4) and rows (7) of neuroblasts. Lineages including specific subsets of neurons are found at identical positions within the Drosophila and grasshopper neuromere (Bossing et al., 1996; Schmid et al., 1999; Taghert et al., 1982; Udolph et al., 1993) where their neuroblast maps have also been constructed (Urbach et al., 2003; Urbach and Technau, 2003a, 2003b; Williams and Boyan, 2005; Younossi-Hartenstein et al., 1996; Zacharias et al., 1993), showing significant similarities in cell number and arrangement.
As lineages of the Drosophila brain form tracts and fascicles with characteristic trajectories, it is reasonable to assume that this will be the case for other insect brains as well. Thus, it follows that neuropil fascicles should adhere to a pattern that can be recognized in other insect groups as well, which, if true, would be a great advantage for comparative insect neuroanatomy. Specific antibodies for neuronal proteins have not been produced in many insects, but some of the antibodies raised against Drosophila (as well as vertebrate) proteins cross-react with epitopes in other taxa, and numerous groups use these as markers in their (confocal) study of various insect brains (e.g. Boyan et al., 2003; Dreyer et al., 2010; Huetteroth et al., 2010; Ignell et al., 2005; Mysore et al., 2011; Rybak et al., 2010). Several studies prepared recently (J.B. and V.H., pers. comm.; Larsen et al., 2009; Mysore et al., in prep.; Pereanu et al., 2010), including this work, strongly suggest that the pattern of neuropil fascicles labeled negatively when using antibodies cross-reacting with synaptic epitopes shows significant similarities to the Drosophila pattern described previously. In this work (Fig. S7), we compare the different neuropils, taken at corresponding antero-posterior levels (fan-shaped body), of four different insects, including Drosophila, Aedes aegypti (Diptera), Tribolium castaneum (Coleoptera), and Cardiocondyla obscurior (Hymenoptera). Many fascicles, including the loSM and loSL of the superior protocerebrum, the MEF and LEF of the inferior protocerebrum, the loV separating ventro-lateral and ventro-medial cerebrum, the great commissure of the ventral cerebrum, and the dorsal and ventral commissure of the subesophageal ganglion can be tentatively identified on the basis of their entrypoints into the neuropil, and their positions relative to the surrounding compartments. It will be crucial to develop antibody markers that allow for the positive labeling of tracts and fascicles. Once that goal has been achieved, it will be possible to embark on a lineage-based, and thereby much more detailed comparative-evolutionary analysis of insect brain structure. It is likely, as proposed in previous studies (reviewed in Farris, 2005; Galizia and Rossler, 2010; Homberg, 2008; Strausfeld et al., 2009), that changes in brain anatomy of different insects (and animals in general) occurred by varying a basically conserved pattern of lineages. For example, as suggested by the brain sections shown in Fig. S7, Cardiocondyla, and Tribolium have a much reduced lateral horn, which might be correlated to a similar reduction of the optic lobes in both species. One might speculate that the reduction in lateral horn volume is brought about by eliminating some of the lineages whose SATs (and terminal arborizations; see accompanying paper by Wong et al., 2013) enter this compartment. Once it is possible to positively label the SATs of lineages in different insect species, it will become possible to test this hypothesis.
Supplementary Material
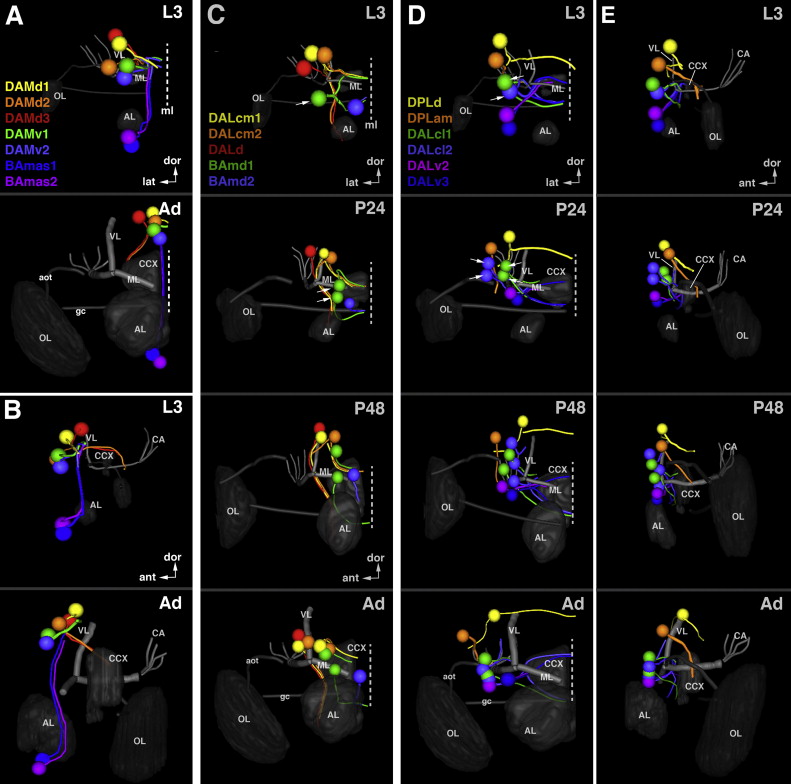
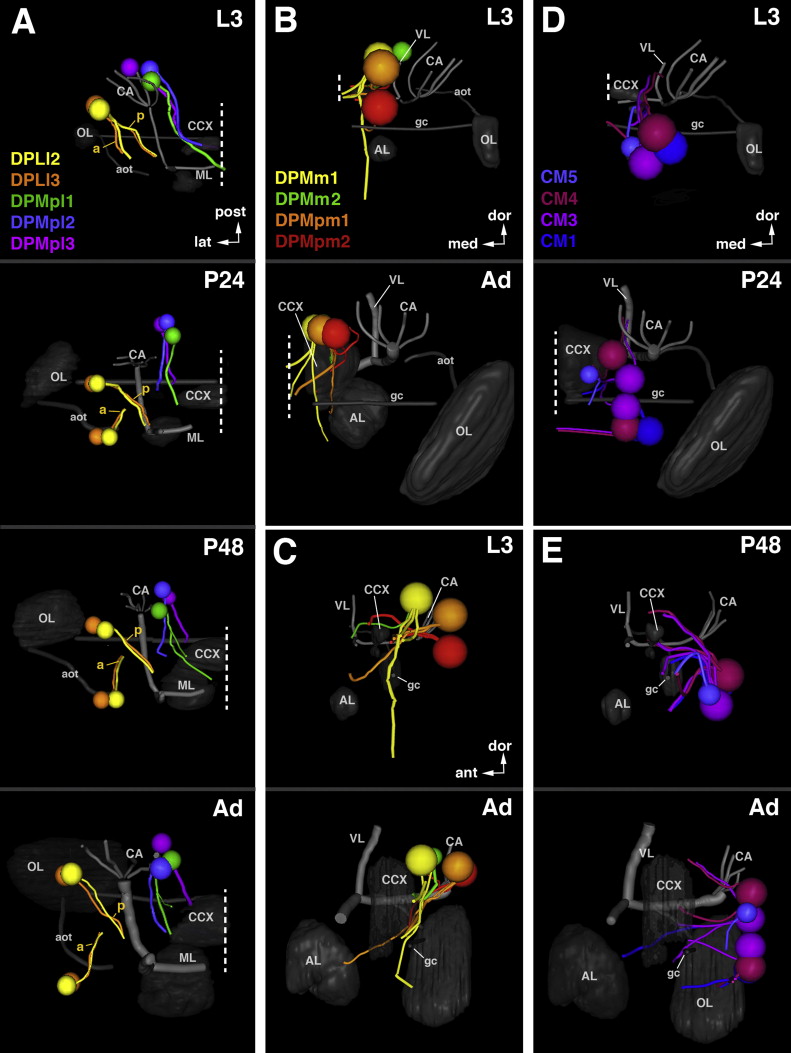
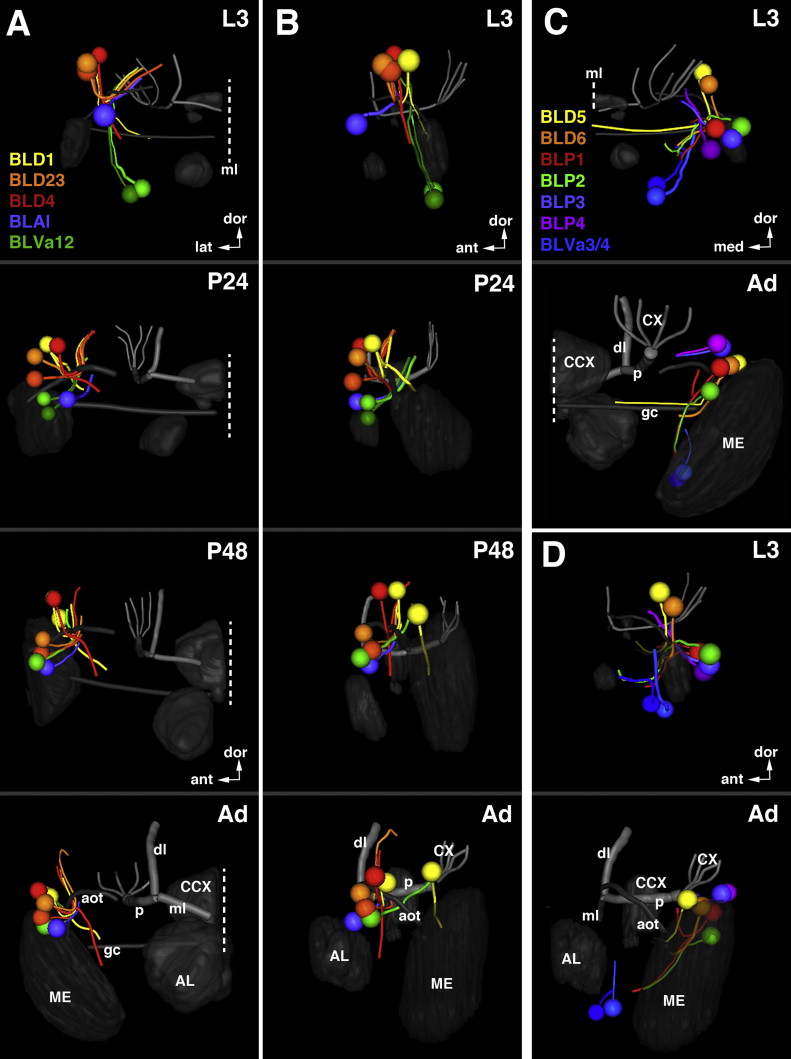
Acknowledgments
We thank the members of the Hartenstein laboratory for critical discussions during the preparation of this manuscript. We are grateful to the Bloomington Stock Center and the Developmental Studies Hybridoma Bank for fly strains and antibodies. This work was supported by NIH grant (R01 NS29357-15). K.T.N. is supported by the NSF Graduate Research Fellowship Program (No. DGE-0707424). J.J.O. is supported by the Ruth L. Kirschstein National Research Service Award (No. GM007185).
Appendix A. Supporting information
Supplementary data associated with this article can be found in the online version at http://dx.doi.org/10.1016/j.ydbio.2013.07.008.
References
- Ashburner M. A Laboratory Manual. Cold Spring Harbor Laboratory Press; Cold Spring Harbor, NY: 1989. Drosophila; pp. 214–217. [Google Scholar]
- Bate CM. Embryogenesis of an insect nervous system I. A map of the thoracic and abdominal neuroblasts in Locusta migratoria. J Embryol Exp. 1976;35:107–123. [PubMed] [Google Scholar]
- Bausenwein B, Dittrich AP, Fischbach KF. The optic lobe of Drosophila melanogaster. II Sorting of retinotopic pathways in the medulla. Cell Tissue Res. 1992;267:17–28. doi: 10.1007/BF00318687. [DOI] [PubMed] [Google Scholar]
- Bayraktar OA, Boone JQ, Drummond ML, Doe CQ. Drosophila type II neuroblast lineages keep Prospero levels low to generate large clones that contribute to the adult brain central complex. Neural Dev. 2010;5:26. doi: 10.1186/1749-8104-5-26. [DOI] [PMC free article] [PubMed] [Google Scholar]
- Bello BC, Izergina N, Caussinus E, Reichert H. Amplification of neural stem cell proliferation by intermediate progenitor cells in Drosophila brain development. Neural Dev. 2008;3:5. doi: 10.1186/1749-8104-3-5. [DOI] [PMC free article] [PubMed] [Google Scholar]
- Bieber AJ, Snow PM, Hortsch M, Patel NH, Jacobs JR, Traquina ZR, Schilling J, Goodman CS. Drosophila neuroglian: a member of the immunoglobulin superfamily with extensive homology to the vertebrate neural adhesion molecule L1. Cell. 1989;59:447–460. doi: 10.1016/0092-8674(89)90029-9. [DOI] [PubMed] [Google Scholar]
- Booker R, Truman JW. Postembryonic neurogenesis in the CNS of the tobacco hornworm, Manduca sexta. I Neuroblast arrays and the fate of their progeny during metamorphosis. Journal of Comparative Neurology. 1987a;255:548–559. doi: 10.1002/cne.902550407. [DOI] [PubMed] [Google Scholar]
- Boone JQ, Doe CQ. Identification of Drosophila type II neuroblast lineages containing transit amplifying ganglion mother cells. Dev Neurobiol. 2008;68:1185–1195. doi: 10.1002/dneu.20648. [DOI] [PMC free article] [PubMed] [Google Scholar]
- Bossing T, Udolph G, Doe CQ, Technau GM. The embryonic central nervous system lineages of Drosophila melanogaster. I Neuroblast lineages derived from the ventral half of the neuroectoderm. Dev Biol. 1996;179:41–64. doi: 10.1006/dbio.1996.0240. [DOI] [PubMed] [Google Scholar]
- Boyan G, Reichert H, Hirth F. Commissure formation in the embryonic insect brain. Arthropod Struct Dev. 2003;32:61–77. doi: 10.1016/S1467-8039(03)00037-9. [DOI] [PubMed] [Google Scholar]
- Boyan GS, Ball EE. The grasshopper, Drosophila and neuronal homology (advantages of the insect nervous system for the neuroscientist) Prog Neurobiol. 1993;41:657–682. doi: 10.1016/0301-0082(93)90030-v. [DOI] [PubMed] [Google Scholar]
- Brand AH, Perrimon N. Targeted gene expression as a means of altering cell fates and generating dominant phenotypes. Development. 1993;118:401–415. doi: 10.1242/dev.118.2.401. [DOI] [PubMed] [Google Scholar]
- Brand AH, Livesey FJ. Neural stem cell biology in vertebrates and invertebrates: more alike than different? Neuron. 2011;70:719–729. doi: 10.1016/j.neuron.2011.05.016. [DOI] [PubMed] [Google Scholar]
- Broadus J, Skeath JB, Spana EP, Bossing T, Technau G, Doe CQ. New neuroblast markers and the origin of the aCC/pCC neurons in the Drosophila central nervous system. Mech Dev. 1995;53:393–402. doi: 10.1016/0925-4773(95)00454-8. [DOI] [PubMed] [Google Scholar]
- Cardona A, Saalfeld S, Arganda I, Pereanu W, Schindelin J, Hartenstein V. Identifying neuronal lineages of Drosophila by sequence analysis of axon tracts. J Neurosci. 2010a;30:7538–7553. doi: 10.1523/JNEUROSCI.0186-10.2010. [DOI] [PMC free article] [PubMed] [Google Scholar]
- Cardona A, Saalfeld S, Preibisch S, Schmid B, Cheng A, Pulokas J, Tomancak P, Hartenstein V. An integrated micro- and macroarchitectural analysis of the Drosophila brain by computer-assisted serial section electron microscopy. PLoS Biol. 2010b;8:e1000502. doi: 10.1371/journal.pbio.1000502. [DOI] [PMC free article] [PubMed] [Google Scholar]
- Cardona A, Saalfeld S, Schindelin J, Arganda-Carreras I, Preibisch S, Longair M, Tomancak P, Hartenstein V, Douglas RJ. TrakEM2 software for neural circuit reconstruction. PLoS One. 2012;7:e38011. doi: 10.1371/journal.pone.0038011. [DOI] [PMC free article] [PubMed] [Google Scholar]
- Chang T, Younossi-Hartenstein A, Hartenstein V. Development of neural lineages derived from the sine oculis positive eye field of Drosophila. Arthropod Struct Dev. 2003;2003:303–317. doi: 10.1016/j.asd.2003.09.003. [DOI] [PubMed] [Google Scholar]
- Chen JS, Chen MG. Modification of the Bodian technique applied to insect nerves. Stain Technol. 1969;44:50–51. [PubMed] [Google Scholar]
- Chiang AS, Lin CY, Chuang CC, Chang HM, Hsieh CH, Yeh CW, Shih CT, Wu JJ, Wang GT, Chen YC, Wu CC, Chen GY, Ching YT, Lee PC, Lin CY, Lin HH, Wu CC, Hsu HW, Huang YA, Chen JY, Chiang HJ, Lu CF, Ni RF, Yeh CY, Hwang JK. Three-dimensional reconstruction of brain-wide wiring networks in Drosophila at single-cell resolution. Curr Biol. 2011;21:1–11. doi: 10.1016/j.cub.2010.11.056. [DOI] [PubMed] [Google Scholar]
- Crittenden JR, Skoulakis EM, Han KA, Kalderon D, Davis RL. Tripartite mushroom body architecture revealed by antigenic markers. Learn Memory. 1998;5:38–51. [PMC free article] [PubMed] [Google Scholar]
- Das A, Sen S, Lichtneckert R, Okada R, Ito K, Rodrigues V, Reichert H. Drosophila olfactory local interneurons and projection neurons derive from a common neuroblast lineage specified by the empty spiracles gene. Neural Dev. 2008;3:33. doi: 10.1186/1749-8104-3-33. [DOI] [PMC free article] [PubMed] [Google Scholar]
- Das A, Gupta T, Davla S, Prieto-Godino LL, Diegelmann S, Reddy OV, Raghavan KV, Reichert H, Lovick J, Hartenstein V. Neuroblast lineage-specific origin of the neurons of the Drosophila larval olfactory system. Dev Biol. 2013;373:322–337. doi: 10.1016/j.ydbio.2012.11.003. [DOI] [PMC free article] [PubMed] [Google Scholar]
- de la Escalera S, Bockamp EO, Moya F, Piovant M, Jiménez F. Characterization and gene cloning of neurotactin, a Drosophila transmembrane protein related to cholinesterases. EMBO J. 1990;9:3593–3601. doi: 10.1002/j.1460-2075.1990.tb07570.x. [DOI] [PMC free article] [PubMed] [Google Scholar]
- Doe CQ. Molecular markers for identified neuroblasts and ganglion mother cells in the Drosophila central nervous system. Development. 1992;116:855–863. doi: 10.1242/dev.116.4.855. [DOI] [PubMed] [Google Scholar]
- Doe CQ, Goodman CS. Early events in insect neurogenesis. I Development and segmental differences in the pattern of neuronal precursor cells. Dev Biol. 1985;111:193–205. doi: 10.1016/0012-1606(85)90445-2. [DOI] [PubMed] [Google Scholar]
- Dreyer D, Vitt H, Dippel S, Goetz B, El Jundi B, Kollmann M, Huetteroth W, Schachtner J. 3D standard brain of the red flour beetle Tribolium Castaneum: a tool to study metamorphic development and adult plasticity. Front Syst Neurosci. 2010;4:1–13. doi: 10.3389/neuro.06.003.2010. [DOI] [PMC free article] [PubMed] [Google Scholar]
- Duman-Scheel M, Patel NH. Analysis of molecular marker expression reveals neuronal homology in distantly related arthropods. Development. 1999;126:2327–2334. doi: 10.1242/dev.126.11.2327. [DOI] [PubMed] [Google Scholar]
- Dumstrei K, Wang F, Nassif C, Hartenstein V. Early development of the Drosophila brain: V. Pattern of postembryonic neuronal lineages expressing DE-cadherin. J Comp Neurol. 2003a;455:451–462. doi: 10.1002/cne.10484. [DOI] [PubMed] [Google Scholar]
- Dumstrei K, Wang F, Hartenstein V. Role of DE-cadherin in neuroblast proliferation, neural morphogenesis, and axon tract formation in Drosophila larval brain development. J Neurosci. 2003b;23:3325–3335. doi: 10.1523/JNEUROSCI.23-08-03325.2003. [DOI] [PMC free article] [PubMed] [Google Scholar]
- Farris SM. Evolution of insect mushroom bodies: old clues, new insights. Arthropod Struct Dev. 2005;34:211–234. [Google Scholar]
- Fischbach KF, Dittrich APM. The optic lobe of Drosophila melanogaster. I A Golgi analysis of wild-type structure. Cell Tissue Res. 1989;258:441–475. [Google Scholar]
- Fung S, Wang F, Spindler SR, Hartenstein V. Drosophila E-cadherin and its binding partner Armadillo/beta-catenin are required for axonal pathway choices in the developing larval brain. Dev Biol. 2009;332:371–382. doi: 10.1016/j.ydbio.2009.06.005. [DOI] [PMC free article] [PubMed] [Google Scholar]
- Galizia CG, Rossler W. Parallel olfactory systems in insects: anatomy and function. Annu Rev Entomol. 2010;55:399–420. doi: 10.1146/annurev-ento-112408-085442. [DOI] [PubMed] [Google Scholar]
- Hanesch U, Fischbach KF, Heisenberg M. Neuronal architecture of the central complex in Drosophila melanogaster. Cell Tissue Res. 1989;257:343–366. [Google Scholar]
- Hartenstein V, Campos-Ortega JA. Early neurogenesis in wild-type Drosophila melanogaster. Roux’s Arch Dev Biol. 1984;193:308–325. doi: 10.1007/BF00848159. [DOI] [PubMed] [Google Scholar]
- Hartenstein V, Spindler S, Pereanu W, Fung S. The development of the Drosophila larval brain. Adv Exp Med Biol. 2008;628:1–31. doi: 10.1007/978-0-387-78261-4_1. [DOI] [PubMed] [Google Scholar]
- Hassan BA, Bermingham NA, He Y, Sun Y, Jan YN, Zoghbi HY, Bellen HJ. atonal regulates neurite arborization but does not act as a proneural gene in the Drosophila brain. Neuron. 2000;25:549–561. doi: 10.1016/s0896-6273(00)81059-4. [DOI] [PubMed] [Google Scholar]
- Helfrich-Förster C, Shafer OT, Wülbeck C, Grieshaber E, Rieger D, Taghert P. Development and morphology of the clock-gene-expressing lateral neurons of Drosophila melanogaster. J Comp Neurol. 2007;500:47–70. doi: 10.1002/cne.21146. [DOI] [PubMed] [Google Scholar]
- Homberg U. Evolution of the central complex in the arthropod brain with respect to the visual system. Arthropod Struct Dev. 2008;37:347–362. doi: 10.1016/j.asd.2008.01.008. [DOI] [PubMed] [Google Scholar]
- Hortsch M, Patel NH, Bieber AJ, Traquina ZR, Goodman CS. Drosophila neurotactin, a surface glycoprotein with homology to serine esterases is dynamically expressed during embryogenesis. Development. 1990;110:1327–1340. doi: 10.1242/dev.110.4.1327. [DOI] [PubMed] [Google Scholar]
- Huetteroth W, El Jundi B, El Jundi S, Schachtner J. 3D-reconstructions and virtual 4D-visualization to study metamorphic brain development in the sphinx moth Manduca sexta. Front Syst Neurosci. 2010;4:1–15. doi: 10.3389/fnsys.2010.00007. [DOI] [PMC free article] [PubMed] [Google Scholar]
- Huser A, Rohwedder A, Apostolopoulou AA, Widmann A, Pfitzenmaier JE, Maiolo EM, Selcho M, Pauls D, von Essen A, Gupta T, Sprecher SG, Birman S, Riemensperger T, Stocker RF, Thum AS. The serotonergic central nervous system of the Drosophila larva: anatomy and behavioral function. PLoS One. 2012;7:e47518. doi: 10.1371/journal.pone.0047518. [DOI] [PMC free article] [PubMed] [Google Scholar]
- Ignell R, Dekker T, Ghaninia M, Hansson BS. Neuronal architecture of the mosquito deutocerebrum. J Comp Neurol. 2005;493:207–240. doi: 10.1002/cne.20800. [DOI] [PubMed] [Google Scholar]
- Ito K, Awano W, Suzuki K, Hiromi Y, Yamamoto D. The Drosophila mushroom body is a quadruple structure of clonal units each of which contains a virtually identical set of neurones and glial cells. Development. 1997;124:761–771. doi: 10.1242/dev.124.4.761. [DOI] [PubMed] [Google Scholar]
- Ito K, Awasaki T. Clonal unit architecture of the adult fly brain. Adv Exp Med Biol. 2008;628:137–158. doi: 10.1007/978-0-387-78261-4_9. [DOI] [PubMed] [Google Scholar]
- Ito M, Masuda N, Shinomiya K, Endo K, Ito K. Systematic analysis of neural projections reveals clonal composition of the Drosophila brain. Curr Biol. 2013;23 (8):644–655. doi: 10.1016/j.cub.2013.03.015. [DOI] [PubMed] [Google Scholar]
- Iwai Y, Usui T, Hirano S, Steward R, Masatoshi T, Uemura T. Axon patterning requires D N-cadherin, a novel neuronal adhesion receptor, in the Drosophila embryonic CNS. Neuron. 1997;19:77–89. doi: 10.1016/s0896-6273(00)80349-9. [DOI] [PubMed] [Google Scholar]
- Izergina N, Balmer J, Bello B, Reichert H. Postembryonic development of transit amplifying neuroblast lineages in the Drosophila brain. Neural Dev. 2009;4:44. doi: 10.1186/1749-8104-4-44. [DOI] [PMC free article] [PubMed] [Google Scholar]
- Jarvis E, Bruce HS, Patel NH. Evolving specialization of the arthropod nervous system. Proc Nat Acad Sci USA. 2012;109:10634–10639. doi: 10.1073/pnas.1201876109. [DOI] [PMC free article] [PubMed] [Google Scholar]
- Jefferis GS, Marin EC, Stocker RF, Luo L. Target neuron prespecification in the olfactory map of Drosophila. Nature. 2001;414:204–208. doi: 10.1038/35102574. [DOI] [PubMed] [Google Scholar]
- Jefferis GS, Marin EC, Watts RJ, Luo L. Development of neuronal connectivity in Drosophila antennal lobes and mushroom bodies. Curr Opin Neurobiol. 2002;12:80–86. doi: 10.1016/s0959-4388(02)00293-3. [DOI] [PubMed] [Google Scholar]
- Jiang Y, Reichert H. Programmed cell death in type II neuroblast lineages is required for central complex development in the Drosophila brain. Neural Dev. 2012;7:3. doi: 10.1186/1749-8104-7-3. [DOI] [PMC free article] [PubMed] [Google Scholar]
- Kumar A, Fung S, Lichtneckert R, Reichert H, Hartenstein V. Arborization pattern of engrailed-positive neural lineages reveal neuromere boundaries in the Drosophila brain neuropil. J Comp Neurol. 2009a;517:87–104. doi: 10.1002/cne.22112. [DOI] [PMC free article] [PubMed] [Google Scholar]
- Kumar A, Bello B, Reichert H. Lineage-specific cell death in postem-bryonic brain development of Drosophila. Development. 2009b;136:3433–3442. doi: 10.1242/dev.037226. [DOI] [PubMed] [Google Scholar]
- Kunz T, Kraft KF, Technau GM, Urbach R. Origin of Drosophila mushroom body neuroblasts and generation of divergent embryonic lineages. Development. 2012;139 (14):2510–2522. doi: 10.1242/dev.077883. [DOI] [PubMed] [Google Scholar]
- Lai SL, Awasaki T, Ito K, Lee T. Clonal analysis of Drosophila antennal lobe neurons: diverse neuronal architectures in the lateral neuroblast lineage. Development. 2008;135:2883–2893. doi: 10.1242/dev.024380. [DOI] [PubMed] [Google Scholar]
- Larsen C, Shy D, Spindler SR, Fung S, Pereanu W, Younossi-Hartenstein A, Hartenstein V. Patterns of growth, axonal extension, and axonal arborization of neuronal lineages in the developing Drosophila brain. Dev Biol. 2009;335:289–304. doi: 10.1016/j.ydbio.2009.06.015. [DOI] [PMC free article] [PubMed] [Google Scholar]
- Lee T, Luo L. Mosaic analysis with a repressible cell marker (MARCM) for Drosophila neural development. Trends Neurosci. 2001;24:251–254. doi: 10.1016/s0166-2236(00)01791-4. [DOI] [PubMed] [Google Scholar]
- Levine RB. Changes in neuronal circuits during insect metamorphosis. J Exp Biol. 1984;112:27–44. doi: 10.1242/jeb.112.1.27. [DOI] [PubMed] [Google Scholar]
- Levine RB, Truman JW. Dendritic reorganization of abdominal motoneurons during metamorphosis of the moth, Manduca sexta. J Neurosci. 1985;5:2424–2431. doi: 10.1523/JNEUROSCI.05-09-02424.1985. [DOI] [PMC free article] [PubMed] [Google Scholar]
- Libersat F, Duch C. Morphometric analysis of dendritic remodeling in an identified motoneuron during postembryonic development. J Comp Neurol. 2002;450:153–166. doi: 10.1002/cne.10318. [DOI] [PubMed] [Google Scholar]
- Lichtneckert R, Nobs L, Reichert H. Empty spiracles is required for the development of olfactory projection neuron circuitry in Drosophila. Development. 2008;135:2415–2424. doi: 10.1242/dev.022210. [DOI] [PubMed] [Google Scholar]
- Lin S, Kao CF, Yu HH, Huang Y, Lee T. Lineage analysis of Drosophila lateral antennal lobe neurons reveals notch-dependent binary temporal fate decisions. PLoS Biol. 2012;10:1–17. doi: 10.1371/journal.pbio.1001425. [DOI] [PMC free article] [PubMed] [Google Scholar]
- Mao Z, Davis RL. Eight different types of dopaminergic neurons innervate the Drosophila mushroom body neuropil: anatomical and physiological heterogeneity. Front Neural Circuits. 2009;3:5. doi: 10.3389/neuro.04.005.2009. [DOI] [PMC free article] [PubMed] [Google Scholar]
- Mysore K, Flister S, Muller P, Rodrigues V, Reichert H. Brain development in the yellow fever mosquito Aedes aegypti: a comparative immunocytochemical analysis using cross-reacting antibodies from Drosophila melanogaster. Dev Genes Evol. 2011;221:281–296. doi: 10.1007/s00427-011-0376-2. [DOI] [PubMed] [Google Scholar]
- Nordlander RH, Edwards JS. Postembryonic brain development in the monarch butterfly, Danaus plexippus plexippus, L. I. Cellular events during brain morphogenesis. Wilhelm Roux’ Archiv. 1969;162:197–217. doi: 10.1007/BF00576929. [DOI] [PubMed] [Google Scholar]
- Patel NH, Snow PM, Goodman CS. Characterization and cloning of fasciclin III: a glycoprotein expressed on a subset of neurons and axon pathways in Drosophila. Cell. 1987;48:975–988. doi: 10.1016/0092-8674(87)90706-9. [DOI] [PubMed] [Google Scholar]
- Pereanu W, Kumar A, Jennett A, Reichert H, Hartenstein V. Development-based compartmentalization of the Drosophila central brain. J Comp Neurol. 2010;518:2996–3023. doi: 10.1002/cne.22376. [DOI] [PMC free article] [PubMed] [Google Scholar]
- Pereanu W, Hartenstein V. Neural lineages of the Drosophila brain: a three-dimensional digital atlas of the pattern of lineage location and projection at the late larval stage. J Neurosci. 2006;26:5534–5553. doi: 10.1523/JNEUROSCI.4708-05.2006. [DOI] [PMC free article] [PubMed] [Google Scholar]
- Pfeiffer BD, Jenett A, Hammonds AS, Ngo TT, Misra S, Murphy C, Scully A, Carlson JW, Wan KH, Laverty TR, Mungall C, Svirskas R, Kadonaga JT, Doe CQ, Eisen MB, Celniker SE, Rubin GM. Tools for neuroanatomy and neurogenetics in Drosophila. Proc Natl Acad Sci USA. 2008;105:9715–9720. doi: 10.1073/pnas.0803697105. [DOI] [PMC free article] [PubMed] [Google Scholar]
- Power ME. The brain of Drosophila melanogaster. J Morphol. 1943;72:517–559. [Google Scholar]
- Power ME. A quantitative study of the growth of the central nervous system of a holometabolous insect, Drosophila melanogaster. J Morphol. 1952;91:389–411. [Google Scholar]
- Prokop A, Meinertzhagen IA. Development and structure of synaptic contacts in Drosophila. Semin Cell Dev Biol. 2006;17:20–30. doi: 10.1016/j.semcdb.2005.11.010. [DOI] [PubMed] [Google Scholar]
- Rybak J, Kuß A, Lamecker H, Zachow S, Hege HC, Lienhard M, Singer J, Neubert K, Menzel R. The digital bee brain: integrating and managing neurons in a common 3D reference system. Front Syst Neurosci. 2010;4:1–15. doi: 10.3389/fnsys.2010.00030. [DOI] [PMC free article] [PubMed] [Google Scholar]
- Schindelin J, Arganda-Carreras I, Frise E, Kaynig V, Longair M, Pietzsch T, Preibisch S, Rueden C, Saalfeld S, Schmid B, Tinevez JY, White DJ, Hartenstein V, Eliceiri K, Tomancak P, Cardona A. FIJI: an open-source platform for biological-image analysis. Nat Methods. 2012;9:676–682. doi: 10.1038/nmeth.2019. [DOI] [PMC free article] [PubMed] [Google Scholar]
- Schmid A, Chiba A, Doe CQ. Clonal analysis of Drosophila embryonic neuroblasts: neural cell types, axon projections and muscle targets. Development. 1999;126:4653–4689. doi: 10.1242/dev.126.21.4653. [DOI] [PubMed] [Google Scholar]
- Schmidt H, Rickert C, Bossing T, Vef O, Urban J, Technau GM. The embryonic central nervous system lineages of Drosophila melanogaster. II Neuroblast lineages derived from the dorsal part of the neuroectoderm. Dev Biol. 1997;189:186–204. doi: 10.1006/dbio.1997.8660. [DOI] [PubMed] [Google Scholar]
- Seibert J, Urbach R. Role of en and novel interactions between msh, ind, and vnd in dorsoventral patterning of the Drosophila brain and ventral nerve cord. Dev Biol. 2010;346:332–345. doi: 10.1016/j.ydbio.2010.07.024. [DOI] [PubMed] [Google Scholar]
- Shafer OT, Helfrich-Förster C, Renn SC, Taghert PH. Reevaluation of Drosophila melanogaster’s neuronal circadian pacemakers reveals new neuronal classes. J Comp Neurol. 2006;498:180–193. doi: 10.1002/cne.21021. [DOI] [PMC free article] [PubMed] [Google Scholar]
- Singh K, Singh RN. Metamorphosis of the central nervous system of Drosophila melanogaster Meigen (Diptera: Drosophilidae) during pupation. J Biosci. 1999;24:345–360. [Google Scholar]
- Snow PM, Patel NH, Harrelson AL, Goodman CS. Neural-specific carbohydrate moiety shared by many surface glycoproteins in Drosophila and grasshopper embryos. J Neurosci. 1987;7:4137–4144. doi: 10.1523/JNEUROSCI.07-12-04137.1987. [DOI] [PMC free article] [PubMed] [Google Scholar]
- Spindler SR, Hartenstein V. The Drosophila neural lineages: a model system to study brain development and circuitry. Dev Genes Evol. 2010;220:1–10. doi: 10.1007/s00427-010-0323-7. [DOI] [PMC free article] [PubMed] [Google Scholar]
- Spindler SR, Hartenstein V. Bazooka mediates secondary axon morphology in Drosophila brain lineages. Neural Dev. 2011;6:16. doi: 10.1186/1749-8104-6-16. [DOI] [PMC free article] [PubMed] [Google Scholar]
- Sprecher SG, Cardona A, Hartenstein V. The Drosophila larval visual system: high-resolution analysis of a simple visual neuropil. Dev Biol. 2011;358:33–43. doi: 10.1016/j.ydbio.2011.07.006. [DOI] [PMC free article] [PubMed] [Google Scholar]
- Stocker RF, Heimbeck G, Gendre N, de Belle JS. Neuroblast ablation in Drosophila P[Gal4] lines reveals origins of olfactory interneurons. J Neurobiol. 1997;32:443–456. doi: 10.1002/(sici)1097-4695(199705)32:5<443::aid-neu1>3.0.co;2-5. [DOI] [PubMed] [Google Scholar]
- Stocker RF, Lienhard MC, Borst A, Fischbach KF. Neuronal architecture of the antennal lobe in Drosophila melanogaster. Cell Tissue Res. 1990;262:9–34. doi: 10.1007/BF00327741. [DOI] [PubMed] [Google Scholar]
- Strausfeld NJ. Atlas of an Insect Brain. Springer-Verlag; Berlin: 1976. pp. 1–214. [Google Scholar]
- Strausfeld NJ, Li Y. Representation of the calyces in the medial and vertical lobes of cockroach mushroom bodies. J Comp Neurol. 1999;409:626–646. doi: 10.1002/(sici)1096-9861(19990712)409:4<626::aid-cne8>3.0.co;2-b. [DOI] [PubMed] [Google Scholar]
- Strausfeld NJ, Sinakevitch I, Brown SM, Farris SM. Ground plan of the insect mushroom body: functional and evolutionary implications. J Comp Neurol. 2009;513:265–291. doi: 10.1002/cne.21948. [DOI] [PMC free article] [PubMed] [Google Scholar]
- Taghert PH, Bastiani MJ, Ho RK, Goodman CS. Guidance of pioneer growth cones: filopodial contacts and coupling revealed with an antibody to Lucifer Yellow. Dev Biol. 1982;94:391–399. doi: 10.1016/0012-1606(82)90356-6. [DOI] [PubMed] [Google Scholar]
- Tanaka NK, Endo K, Ito K. Organization of antennal lobe-associated neurons in adult Drosophila melanogaster Brain. J Comp Neurol. 2012;520:4067–4130. doi: 10.1002/cne.23142. [DOI] [PubMed] [Google Scholar]
- Technau G, Heisenberg M. Neural reorganization during metamorphosis of the corpora pedunculata in Drosophila melanogaster. Nature. 1982;295:405–407. doi: 10.1038/295405a0. [DOI] [PubMed] [Google Scholar]
- Thomas JB, Bastiani MJ, Bate M, Goodman CS. From grasshopper to Drosophila: a common plan for neuronal development. Nature. 1984;310:203–207. doi: 10.1038/310203a0. [DOI] [PubMed] [Google Scholar]
- Tissot M, Stocker RF. Metamorphosis in Drosophila and other insects: the fate of neurons throughout the stages. Prog Neurobiol. 2000;62:89–111. doi: 10.1016/s0301-0082(99)00069-6. [DOI] [PubMed] [Google Scholar]
- Truman JW, Bate M. Spatial and temporal patterns of neurogenesis in the central nervous system of Drosophila melanogaster. Dev Biol. 1988;125:145–157. doi: 10.1016/0012-1606(88)90067-x. [DOI] [PubMed] [Google Scholar]
- Truman JW, Booker R. Adult-specific neurons in the nervous system of the moth, Manduca sexta: selective chemical ablation using hydroxyurea. J Neurobiol. 1986;17:613–625. doi: 10.1002/neu.480170606. [DOI] [PubMed] [Google Scholar]
- Truman JW, Moats W, Altman J, Marin EC, Williams DW. Role of Notch signaling in establishing the hemilineages of secondary neurons in Drosophila melanogaster. Development. 2010;137:53–61. doi: 10.1242/dev.041749. [DOI] [PMC free article] [PubMed] [Google Scholar]
- Truman JW, Reiss SE. Hormonal regulation of the shape of identified motoneurons in the moth Manduca sexta. J Neurosci. 1988;8:765–775. doi: 10.1523/JNEUROSCI.08-03-00765.1988. [DOI] [PMC free article] [PubMed] [Google Scholar]
- Truman JW, Schuppe H, Shepherd D, Williams DW. Developmental architecture of adult-specific lineages in the ventral CNS of Drosophila. Development. 2004;131:5167–5184. doi: 10.1242/dev.01371. [DOI] [PubMed] [Google Scholar]
- Udolph G, Prokop A, Bossing T, Technau GM. A common precursor for glia and neurons in the embryonic CNS of Drosophila gives rise to segment-specific lineage variants. Development. 1993;118:765–775. doi: 10.1242/dev.118.3.765. [DOI] [PubMed] [Google Scholar]
- Urbach R, Schnabel R, Technau GM. The pattern of neuroblast formation, mitotic domains and proneural gene expression during early brain development in Drosophila. Development. 2003;130:3589–3606. doi: 10.1242/dev.00528. [DOI] [PubMed] [Google Scholar]
- Urbach R, Technau GM. Segment polarity and DV patterning gene expression reveals segmental organization of the Drosophila brain. Development. 2003a;130:3607–3620. doi: 10.1242/dev.00532. [DOI] [PubMed] [Google Scholar]
- Urbach R, Technau GM. Molecular markers for identified neuroblasts in the developing brain of Drosophila. Development. 2003b;130:3621–3637. doi: 10.1242/dev.00533. [DOI] [PubMed] [Google Scholar]
- Wagh DA, Rasse TM, Asan E, Hofbauer A, Schwenkert I, Dürrbeck H, Buchner S, Dabauvalle MC, Schmidt M, Qin G, Wichmann C, Kittel R, Sigrist SJ, Buchner E. Bruchpilot, a protein with homology to ELKS/CAST, is required for structural integrity and function of synaptic active zones in Drosophila. Neuron. 2006;49:833–844. doi: 10.1016/j.neuron.2006.02.008. [DOI] [PubMed] [Google Scholar]
- Watson AH, Schürmann FW. Synaptic structure, distribution, and circuitry in the central nervous system of the locust and related insects. Microsc Res Tech. 2002;56:210–226. doi: 10.1002/jemt.10031. [DOI] [PubMed] [Google Scholar]
- Weeks JC. Thinking globally, acting locally: steroid hormone regulation of the dendritic architecture, synaptic connectivity and death of an individual neuron. Prog Neurobiol. 2003;70:421–442. doi: 10.1016/s0301-0082(03)00102-3. [DOI] [PubMed] [Google Scholar]
- Williams JL, Boyan GS. Building the central complex of the grasshopper Schistocerca gregaria: temporal topology organizes the neuroarchitecture of the w, xy, y, z tracts. Arthropod Struct Dev. 2005;34:97–110. [Google Scholar]
- Wong DC, Lovick JK, Ngo KT, Omoto JJ, Borisuthirattana W, Hartenstein V. Postembryonic lineages of the Drosophila brain: II. Identification of lineage projection patterns based on MARCM clones. Dev Biol. 2013;2013 doi: 10.1016/j.ydbio.2013.07.009. http://dx.doi.org/10.1016/j.ydbio.2013.07.009. [DOI] [PMC free article] [PubMed] [Google Scholar]
- Younossi-Hartenstein A, Nassif C, Green P, Hartenstein V. Early neurogenesis of the Drosophila brain. J Comp Neurol. 1996;370:313–329. doi: 10.1002/(SICI)1096-9861(19960701)370:3<313::AID-CNE3>3.0.CO;2-7. [DOI] [PubMed] [Google Scholar]
- Yu HH, Kao CF, He Y, Ding P, Kao JC, Lee T. A complete developmental sequence of a Drosophila neuronal lineage as revealed by twin-spot MARCM. PLoS Biol. 2010;8:e1000461. doi: 10.1371/journal.pbio.1000461. [DOI] [PMC free article] [PubMed] [Google Scholar]
- Yu HH, Awasaki T, Schroeder MD, Long F, Yang JS, He Y, Ding P, Kao JC, Wu GY, Peng H, Myers G, Lee T. Clonal development and organization of the adult Drosophila central brain. Curr Biol. 2013;23:633–643. doi: 10.1016/j.cub.2013.02.057. [DOI] [PMC free article] [PubMed] [Google Scholar]
- Zacharias D, Leslie J, Williams D, Meier T, Reichert H. Neurogenesis in the insect brain: cellular identification and molecular characterization of brain neuroblasts in the grasshopper embryo. Development. 1993;118:941–955. [Google Scholar]
- Zecca M, Basler K, Struhl G. Direct and long-range action of a wingless morphogen gradient. Cell. 1996;87:833–844. doi: 10.1016/s0092-8674(00)81991-1. [DOI] [PubMed] [Google Scholar]
Associated Data
This section collects any data citations, data availability statements, or supplementary materials included in this article.