Abstract
High ambient ultrafine particle (UFP) concentrations may play an important role in the adverse health effects associated with living near busy roadways. However, UFP size distributions change rapidly as vehicle emissions dilute and age. These size changes can influence UFP lung deposition rates and dose because deposition in the respiratory system is a strong function of particle size. Few studies to date have measured and characterized changes in near-road UFP size distributions in real-time, thus missing transient variations in size distribution due to short-term fluctuations in wind speed, direction, or particle dynamics. In this study we measured important wind direction effects on near-freeway UFP size distributions and gradients using a mobile platform with 5-s time resolution. Compared to more commonly measured perpendicular (downwind) conditions, parallel wind conditions appeared to promote formation of broader and larger size distributions of roughly one-half the particle concentration. Particles during more parallel wind conditions also changed less in size with downwind distance and the fraction of lung-deposited particle number was calculated to be 15% lower than for downwind conditions, giving a combined decrease of about 60%. In addition, a multivariate analysis of several variables found meteorology, particularly wind direction and temperature, to be important in predicting UFP concentrations within 150 m of a freeway (R2 = 0.46, p = 0.014).
Keywords: Ultrafine particles, Size distribution, Wind direction, Freeways
1. Introduction
While health effects have been associated with particle mass, PM2.5 and PM10 (Dockery, 2001; Brunekreef and Holgate, 2002; Godleski, 2006), a similar link to UFPs has yet to be made. However, the abundance of UFPs near to and on roadways, and their apparently greater toxicity on a per mass basis (Oberdorster, 2000; Li et al., 2003; Cho et al., 2005; Brauner et al., 2007; Ntziachristos et al., 2007), may have important implications for the health of persons living near roadways. Many studies have found associations between adverse health outcomes and living near busy roadways including increased risk of reduced lung function (Brunekreef et al., 1997), respiratory symptoms (van Vliet et al., 1997; Venn et al., 2001; Janssen et al., 2003), and asthma (Lin et al., 2002; McConnell et al., 2006). A comprehensive review of near-road exposures and related health effects can also be found in a special report from the Health Effects Institute (HEI, 2010).
The average spatial and temporal variation in UFP number concentration and size distribution has been studied extensively in near-road locations. In the United States, one of the first measurements of near-roadway pollution was conducted by Rodes and Holland (1980), who described the variations of NOx and ozone near a Southern California freeway. UFP gradient measurements made by Zhu et al. (2002a,b) found concentrations of UFP decreased exponentially with downwind distance from the freeway, falling to background concentrations within 300 m during the day. However, Hu et al. (2009) subsequently found that during the pre-sunrise hours, downwind UFP concentrations did not return to background levels until more than 2000 m from the roadway. Thus, time of day and meteorology can strongly affect the extent of high near-freeway UFP concentrations. However, many near-road studies have relied on near-perpendicular and steady wind conditions, which is sometimes a small subset of overall conditions. Few studies have focused on varying wind direction but recently, Hagler et al. (2012) investigated the effect of various wind conditions on UFP concentration behind different roadside barriers, and found the highest UFP levels were observed during downwind conditions followed by variable and parallel conditions.
While near-road UFP size distributions have been found to change significantly with distance by the studies cited above, such studies have only measured changes over averaging times typically longer than meteorological conditions remain stable. Because meteorological conditions often change rapidly, methodologies that use long time averaging may miss important, non-linear dynamic effects, such as coagulation, condensation, and nucleation processes during tail-pipe-to-road and road-to-ambient dilution conditions as explored in Zhang and Wexler (2004) and Zhang et al. (2004). To provide greater temporal resolution, real-time size distribution monitoring instruments such as the fast mobility particle sizer (FMPS) are required. Hagler et al. (2010) measured UFP concentrations near roadways using a similar fast analyzer, an engine exhaust particle sizer (EEPS), to investigate the influence of complex urban landscapes on UFP concentrations and observed significant variability in UFP concentrations near roadways due to low speed meandering wind conditions. In this study, an FMPS in combination with real-time meteorological data was used to show important differences in UFP size distribution and concentration gradients were linked to sometimes subtle changes in wind direction.
In addition to characterizing real-world size-resolved UFP emissions, this study evaluated the fractions of these particles that are potentially deposited in the human respiratory system. The deposition characteristics of UFP in the human respiratory system show a strong size dependence, whether modeled (ICRP, 1994) or empirically determined (Daigle et al., 2003; Montoya et al., 2004; Londahl et al., 2007, 2009). While factors such as route of breathing, breathing frequency, and lung geometries are important in affecting deposition, particle size is a dominant factor. Modeling results (EPA, 2004) found the fraction of particles 100–1000 nm in aerodynamic diameter have low deposition rates in the lung (i.e., 10–30%), for both nose and mouth breathing, either at rest or with light exercise; however, as particle size decreases from 100 nm, deposition rates increase, up to 80% for particles 10 nm in size. Londahl et al. (2009) empirically determined deposition factors by exposing human subjects (via mouth breathing) to air just downwind of a busy street and found for particles less than 20 nm, the deposition fraction in the lung was 80%, consistent with modeled results from the EPA. Near-road UFP size distributions span this range of widely varying deposition rates.
Similar to the case for particulate mass measures like PM2.5, it is important to note that not all UFPs are the same. The introduction of control devices such as diesel particulate filters and selective catalytic reduction to the diesel fleet has changed the size composition of UFP emissions over the last 5 years. Results from Herner et al. (2011) suggest the number of particles emitted from controlled diesel engines is inversely related to particle toxicity. Thus, the emissions from such controlled vehicles will become increasingly important when considering exposure and health effects from UFP exposure, especially near-roadways.
2. Methods
2.1. Instrumentation and driving route
Particle size distributions and number concentrations were measured aboard an electric vehicle with a TSI Model 3091 FMPS. Complete size distributions (from 5.6 to 560 nm) were measured every 5 s. A more detailed description of the mobile platform (MP) and the instrumentation can be found in Kozawa et al. (2009) and Westerdahl et al. (2005).
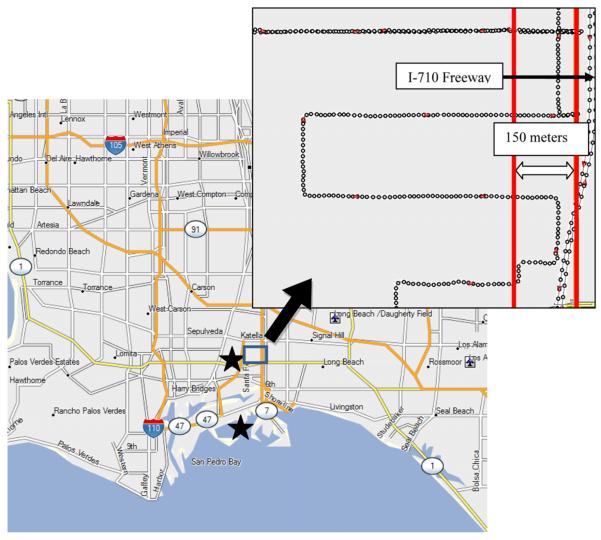
The MP collected data over ten days in 2007 and four days in 2010 while driving on a fixed route near the I-710 freeway and on busy arterials in West Long Beach, an area with high volumes of diesel truck traffic near the Ports of Los Angeles and Long Beach. Fig. 1 is a map of the mobile platform sampling area west of the I-710 freeway. The MP made measurements while being driven from 2 m to 150+ m and from the I-710 freeway at approximately 5–15 miles per hour. Given the averaging time of 5 s for the FMPS, the spatial resolution of the measurements ranged from 10 to 30 m.
Fig. 1.
Map indicating sampling area freeway and map indicating route near the I-710 freeway. Stars represent locations where meteorological data were collected.
Sampling terrain, such as roadside barriers, are an important factor in evaluating near-road pollution levels (Bowker et al., 2007; Baldauf et al., 2008; Finn et al., 2010; Hagler et al., 2010; Ning et al., 2010). In this study, transects were bound on the east (freeway) side by a sound wall about 4–5 m tall. The freeway was at grade and the surrounding terrain was flat. Any vegetation near the freeway was directly in front of the sound wall at a height no greater than the wall itself; some tall trees were observed, but not on the transects measured.
To maximize comparability of meteorological conditions, traffic volumes, and speeds, all measurements were made from 7:00 to 09:00 each morning. Video of the route driven was used to determine if individual vehicles affected concentrations during a transect.
2.2. Meteorological measurements
Data on wind speed, wind direction, temperature, and relative humidity were collected with high time resolution from two sources in the area within a 5-mile radius and are indicated in Fig. 1. The primary meteorological data used in our analyses were from the South Coast Air Quality Management District (SCAQMD) station in West Long Beach, within one mile of the sampling area. Wind speed and wind direction were measured at this site in 2-min averages at a height of 8.5 m with a Met One sonic wind sensor. For February 8, 10 (2010) and July 20, 22 (2010), we used 6-min data collected near the Port of Los Angeles by the National Oceanic and Atmospheric Administration, about 5 miles to the southwest. Vector averages were used when characterizing wind speed and direction. These two stations averaged 7% difference in wind vector averages (range of 3–16%). Temperature and relative humidity data were supplemented with data from the Port of Long Beach, as necessary.
Categorization of wind data into three categories was based on the calculated vector wind direction and the fraction of nearly parallel winds (i.e., ±11.25 degrees of the freeway, or one-eighth of a 90° quadrant) during sampling. When parallel conditions exceeded 20%, conditions were categorized as parallel, else winds were categorized as downwind (easterly vectors) or upwind (westerly vectors).
2.3. Traffic information
Traffic-related data were obtained directly from the California Department of Transportation through a network of embedded roadway sensors called the Performance Measuring System (PeMS, 2010). Data on vehicle speed and truck counts were compiled for the sampling period to check the comparability between sampling days.
2.4. Calculation of lung deposition rate differences
We weighted typical UFP size distributions from our measurements by the expected lung deposition rates to compare the impacts of differences in wind direction on overall lung deposition. We chose the experimentally-derived deposition factors of Londahl et al. (2009) that were based on human subjects exposed to traffic-generated UFP. This best matched the expected high particle hydrophobicity of the relatively fresh vehicle emissions we measured, an important factor in reducing particle growth rates and the resulting size and deposition changes in a high humidity lung environment. We refer to lung deposition as total deposition in the respiratory system including extrathoracic, tracheobronchial, and alveolar regions.
2.5. UFP concentration modeling
We performed a multivariate regression tests of how well meteorology predicted UFP concentration. We used various combinations and forms of wind speed, wind direction relative to freeway, fraction of wind parallel to freeway, temperature, humidity, and season, and also included inverse and/or trigonometric forms of these variables, where appropriate, in stepwise fashion. The variables with the two highest F values were reported for average UFP concentration, and small and large UFP size subsets (~10 nm and ~52 nm). Residuals were tested for normality and homoscedasticity.
3. Results and discussion
3.1. Meteorological and traffic conditions during sampling
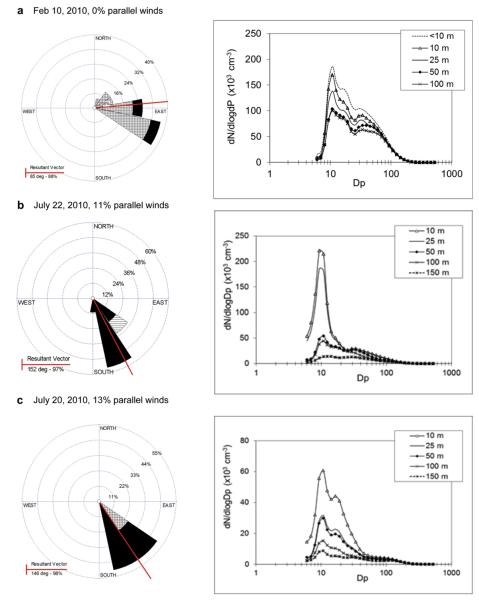
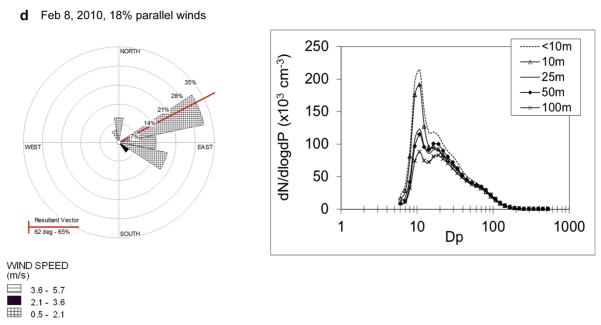
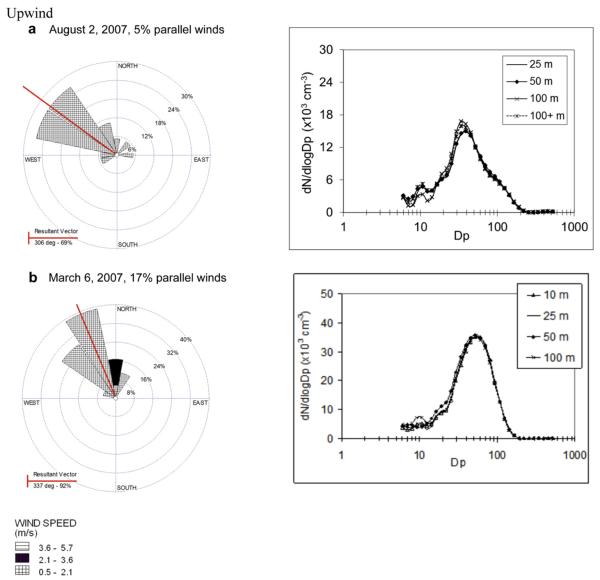
Meteorological conditions are summarized in Table 1. Mean temperature was higher in the summer by 10 C and relative humidity higher by 8%, not including two days in March when relative humidity appeared unusually low and temperatures high. These March conditions resulted from inland high pressure systems that produce strong offshore winds during the day (the reverse of usual sea breeze patterns) that are often referred to as “Santa Ana's.” During typical conditions, wind direction tended to originate from the south in summer and east in the winter. However, wind direction was often variable from day to day and also within a sampling period as seen in the wind roses of Figs. 2–4, with low wind speeds most often associated with variable wind directions.
Table 1.
Meteorological parameters and UFP concentrations observed during the sampling period (standard deviation in parentheses).
| Date (2007/2010) | Time | Vector mean WD (Degrees) | Wind sector | Wind condition category | ws (m s−) | RH (%)a | Temperature (°C)a | Mean UFP (cm−3*103)b | Predicted UFP (cm−3*103) |
|---|---|---|---|---|---|---|---|---|---|
| 8-Feb (2010) | 7:24–9:42 | 62 | E | D | 1.3 | 61 | 13 | 84 | 57 |
| 10-Feb (2010) | 7:32–9:19 | 85 | E | D | 1.5 | 65 | 10 | 97 | 85 |
| 26-Feb | 8:27–8:49 | 65 | E | D | 0.92 | 70 | 14 | 31 | 54 |
| 28-Feb | 8:25–8:55 | 295 | W | U | 3.3 | 58 | 11 | 27 | 40 |
| 4-Mar | 8:12–8:44 | 0 | N | P | 1.8 | 21 | 18 | 9.2 | 27 |
| 6-Mar | 8:38–9:12 | 337 | N | U | 1.6 | 30 | 22 | 31 | 17 |
| 19-Jul | 9:23–9:33 | 183 | S | P | 2.9 | 71 | 23 | 32 | 24 |
| 20-Jul (2010) | 7:30–9:48 | 143 | SE | DW/P | 2.1 | 77 | 19 | 13 | 41 |
| 22-Jul (2010) | 7:30–9:48 | 152 | S | DW/P | 3.0 | 77 | 18 | 44 | 39 |
| 25-Jul | 8:50–9:26 | 196 | S | P | 2.1 | 66 | 25 | 41 | 19 |
| 27-Jul | 8:40–9:32 | 176 | S | P | 1.8 | 61 | 26 | 49 | 27 |
| 29-Jul | 9:33–9:08 | 182 | S | P | 2.3 | 72 | 23 | 9 | 25 |
| 31-Jul | 8:41–9:33 | 163 | S | P | 1.8 | 79 | 22 | 13 | 33 |
| 2-Aug | 8:38–9:14 | 306 | NW | U | 1.0 | 76 | 22 | 11 | 6.6 |
| Include 3/4 and 3/6 | Winter mean | 27 | 1.7 | 51 (20) | 15 (5) | 47 (35) | |||
| Summer mean | 176 | 2.1 | 72 (6) | 22 (3) | 27 (17) | ||||
| 3/4 and 3/6 Excluded | Winter mean | 74 | – | 1.8 | 64 (5) | 12 (2) | 60 (36) | ||
| Summer mean | 176 | – | 2.1 | 72 (6) | 22 (3) | 27 (17) | |||
| 3/4 and 3/6 Excluded | Upwind | 67 (13) | 17 (8) | 19 (11) | |||||
| Downwind | 70 (7) | 15 (4) | 54 (36) | ||||||
| Parallel | 70 (7) | 24 (2) | 29 (17) |
WD = Wind direction, D = Downwind, U = Upwind, P = Parallel.
Wind sector is divided into 45° intervals.
3/6 UFP data from 3007 CPC.
3/4 and 3/6 Santa Ana conditions (unusually warm and reversed wind direction).
From Port of Long Beach-inner port historical data in bold.
Average of UFP concentration within sampling area and time described.
Fig. 2.
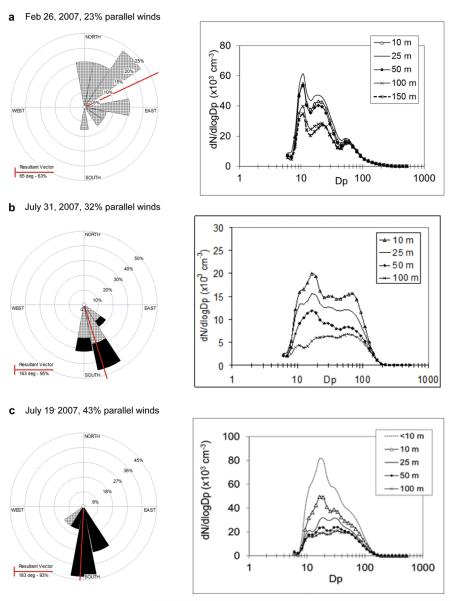
Downwind orientation wind roses and corresponding UFP size distributions measured near the I-710 freeway listed in order of increasing parallel wind fraction. Dp in units of nm. Wind rose data for 2007 from SCAQMD site, data for 2010 from NOAA site (Pier F).
Fig. 4.
Upwind orientation wind roses and corresponding UFP size distributions measured upwind near I-710, listed in order of increasing parallel wind fraction. Dp in units of nm. Wind roses data from NOAA site (Pier F).
Although changes in traffic flow and composition can influence UFP size distributions and concentrations (e.g., Jamriska et al., 2008; Fruin et al., 2008), during the times we sampled, traffic speeds and truck volumes were consistent, with the exception of Sundays. Table 2 shows the freeway speed and the truck flow during the hour sampled, which averaged 84 km h−1 (SD 9) and 768 trucks h−1 (SD 105) Monday through Saturday. On Sundays, speeds were about 35 km h−1 faster and trucks counts were an order of magnitude less. (Speed and volume data were not available for February 8 and February 10, 2010.) The influence of individual vehicles near the MP was also a concern during sampling, but based on a comparison of the video analysis and corresponding data as discussed in Kozawa et al. (2009), no measurable impacts occurred.
Table 2.
Truck flow and vehicle speed for all sampling days.
| Date (2007) | Day of week | Hour | Truck flow (Veh h−1) | Vehicle speed (kph) |
|---|---|---|---|---|
| 26-Feb | Mon | 8:00 | 999 | 68 |
| 28-Feb | Wed | 8:00 | 814 | 79 |
| 4-Mar | Sun | 8:00 | 56 | 119 |
| 6-Mar | Tues | 9:00 | 613 | 72 |
| 19-Jul | Thurs | 9:00 | 811 | 101 |
| 25-Jul | Wed | 9:00 | 734 | 86 |
| 27-Jul | Fri | 9:00 | 790 | 86 |
| 29-Jul | Sun | 9:00 | 90 | 119 |
| 31-Jul | Tues | 9:00 | 814 | 86 |
| 2-Aug | Thurs | 9:00 | 732 | 86 |
| 8-Feb (2010) | Mon | 8:00 | – | – |
| 10-Feb (2010) | Wed | 7:00 | – | – |
| 20-Jul (2010) | Tues | 7:00–10:00 | 700 | 87 |
| 22-Jul (2010) | Thurs | 7:00–10:00 | 676 | 87 |
| Weekday mean (SD) | 768 (105) | 84 (9) |
3.2. Effect of wind direction on near-freeway UFP
Fig. 2(a–d) illustrate wind direction and UFP size distribution adjacent to the I-710 freeway for days with less than 20% frequency of parallel winds and an easterly wind vector, categorized as “downwind.” The largest number mode was at 10 nm, consistent with fresh vehicle emissions, and number concentrations below about 30 nm decreased up to 50% by 100–150 m downwind of the freeway. The 10 nm mode for fresh emissions has been observed in other studies such as Kittelson et al. (2004) and Zhu et al. (2002a,b), who found distinct modes in the <20 nm range, which disappeared 300–700 m from the roadway.
Under downwind conditions, it is notable that particles greater than 50 nm did not appear to decrease in concentration with distance, while particles less than 20 nm fell rapidly. Similar findings were reported by Zhu et al. (2002a,b), who limited their measurements to wind directions within ±22% perpendicular to the freeway. One possible explanation for this larger particle number concentration stability is reduction in the smaller particle size concentrations (in the 10–30 nm range) due to evaporation, followed by increased coagulation, reducing particle number in the smaller range and adding to larger particle numbers enough to offset dilution, as detailed by Jacobson et al. (2005), who modeled the dynamics of freeway UFP and gaseous tailpipe emissions in Los Angeles. Jacobson et al. (2005) found the more volatile of the semivolatile particles quickly evaporate and shrink until their increasing coagulation coefficient (which increases more than an order of magnitude with this size decrease) causes rates of coagulation with larger particles to significantly increase. Under these conditions, evaporation and coagulation processes would be important for smaller particles and have little effect for particles greater than 50 nm (Jacobson et al., 2005). At above 50 nm, we would expect dilution to be the primary factor in the concentration reduction of particles with increasing distance from the freeway, so the observed absence of this concentration reduction for particles above 50 nm may be due to smaller particles growing into this size range.
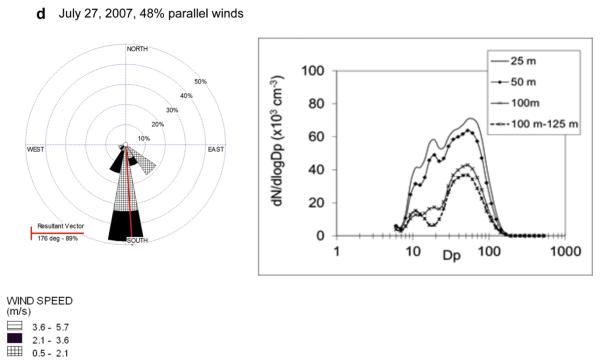
When the frequency of parallel winds was greater than 20%, we categorized these conditions as “parallel” and observed significant changes in UFP size distributions. As shown in Fig. 3a–d, the typical size distribution appeared to have a mix of both particles less than 20 nm and a noticeable increase in fraction of particles greater than 50 nm. Size distributions also showed more uniform decreases in concentration with distance across all UFP sizes. The hypothesized evaporation effect described previously may be decreased during times of parallel winds because of reduced dilution of semi-volatile vapors due to the lower effective cross wind dilution, which is determined by the perpendicular component of the nearly parallel winds. Fig. 3(b–d) show particle number concentrations of sizes up to 100 nm all decreasing significantly with distance from the freeway. Fig. 3a, which was categorized as parallel by only a few percent shows characteristics of downwind distributions, but has a noticeable mode in the larger size ranges that are absent during downwind conditions. The results above differ from Zhu et al. (2004), who suggested shifts between size modes with increasing distance from the freeway for perpendicular wind conditions. For comparison, Fig. 4(a,b) shows size distributions with modes at 40 and 50 nm, respectively, when sampling was conducted upwind of the freeway. For both days the vector average wind direction indicated an overall upwind condition (westerly wind vector) and the fraction of parallel winds were below 20%. Almost no change in concentration or size distribution was observed, regardless of distance from the freeway. These distributions generally reflect urban background UFP concentrations and stable, aged size distributions.
Fig. 3.
Parallel orientation wind roses and corresponding UFP size distributions measured near the I-710, listed in order of increasing parallel wind fraction. Dp in units of nm. Wind rose data from SCAQMD site.
Under parallel wind conditions, we also found lower rates of concentration decreases with distance compared to other studies such as Zhu et al. (2002a,b), which were conducted under perpendicular (downwind) conditions. Fig. 5 shows changes in relative UFP concentrations with increasing distance from the freeway during three parallel wind days (July 19, 27, 31, 2007) and two downwind days (July 20, 22, 2010). Relative UFP was calculated by normalizing to the concentrations observed closest to the freeway. The total particle number decay curve for Zhu et al. (2002a) for the I-710 freeway is included for comparison. These curves show parallel wind conditions appear to result in reduced rates of concentration decrease with distance compared to observed downwind conditions.
Fig. 5.
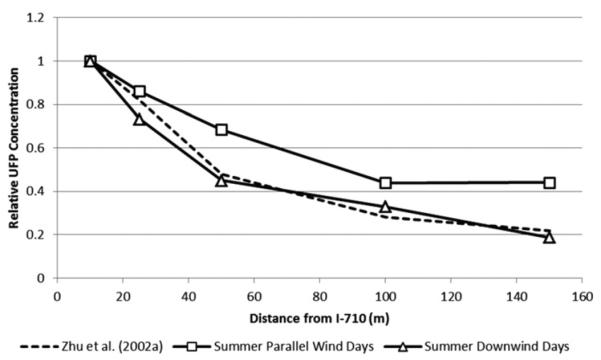
Change in relative UFP concentration with increasing distance from the freeway for parallel wind days and downwind days observed during the summer season compared with Zhu et al. (2002a).
On two sampling days the presence of the sound barrier bounding the east side of the transect appeared to have an effect on UFP concentration gradients as described in Ning et al. (2010). This effect is illustrated in Fig. 3a, when more particles are observed at 25 m compared to 10 m. However, this effect was only observed on February 26, 2007 and July 27, 2007 (not shown).
3.3. Prediction of near-road UFP concentrations
Higher UFP number concentrations were associated with the winter season, about double the summer season, due to lower temperatures and less atmospheric mixing. Such conditions tend to favor UFP formation and lower wind speeds reduce dilution. However, a multivariate analysis showed meteorological variables were more important than season in predicting UFP concentrations within 150 m of the freeway. The best UFP predictions resulted from using (1/temperature above 10 C) and the cosine of the wind angle (CosWD) from perpendicular to the freeway (i.e., from 0 at parallel to 1.0 for perpendicular) (R2 = 0.46, p = 0.014). While the fraction of variability predicted with these variables was not high, residuals passed the Chi Square and the Kolmogorov Smirnov tests for normality at a p value of 0.05. The predictive equation in this case was:
This equation shows more perpendicular winds (i.e., CosWD approaching 1.0) are predictive of higher concentrations as are low temperatures approaching 10 C (the lowest temperature observed in our study).
It is interesting that wind speed (or inverse wind speed, 1/WS) did not enter into this relationship. When we included 1/WS, it slightly worsened the R2 value. Therefore, it appears that wind direction rather than wind speed was a better measure of dilution (and reduced UFP concentration) and dilution speed (favoring smaller size distributions) for the range of wind speeds observed in our study (0.9–3.3 m s−1). Using season alone we were able to explain 28% of the variability in observed UFP concentrations if categories included winter, summer, and Santa Ana conditions. Table 1 shows observed and predicted UFP concentrations within 150 m of the freeway.
As a further indication of the sensitivity of UFP size distribution on wind direction, we also found the same two variables above to predict reasonably well the 10.8 nm size concentration and fraction of total particles in this small size, with R2s of 0.62 and 0.33, respectively. If fraction downwind was modeled the R2 for fraction 10.8 nm increased to 0.49. In contrast, we were not able to reasonably predict 52.3 nm particles with any combination of the above variables, likely due to the reduced sensitivity of this size on dilution rate and large contribution from background.
Other investigators have also found wind direction effects on UFP concentrations. Hitchins et al. (2000) evaluated differences between UFP concentrations during wind conditions downwind versus parallel to the freeway, and Hagler et al. (2012) also investigated differences in wind direction considering various roadway barriers. In both studies, near-road reductions of UFP concentrations by 30–60% were observed for parallel wind conditions, compared to 50%–80% reductions in this study.
3.4. Effect of changing UFP size on deposition rates in the lung
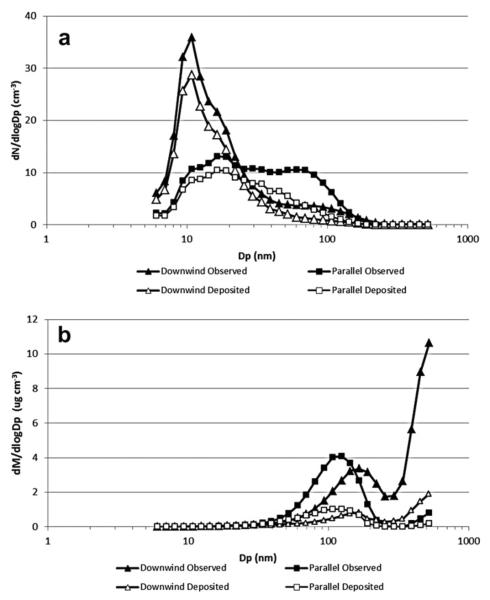
The observed differences and changes of size distribution with distance due to wind direction are important because deposition rates of particles in the lung increase sharply with decreasing particle size. For example, we would expect the deposition rates of fresh traffic emissions under downwind conditions, with their large number of particles below 20 nm, to be higher than the deposition rates of near-freeway UFP when winds are more parallel. Fig. 6a shows observed and deposition-weighted number distributions for a downwind day and a parallel wind day with similar total UFP number concentrations (over a 150 m distance from the freeway). For these two days, we calculate about 15% more particles deposited during downwind conditions compared to parallel (63% versus 73%, respectively). In close proximity to the freeway (within 10 m), deposition rates under downwind conditions increased by 20%. These differences in deposition rate between parallel and downwind directions are not large, but they further accentuate the difference in overall concentrations by wind orientation, parallel winds producing about half the concentrations, on average, of downwind conditions.
Fig. 6.
Observed and deposition-weighted particle size distributions for wind conditions that are downwind and parallel to the freeway for UFP (a) number and (b) mass deposition rates were determined empirically by Londahl et al. (2009).
The situation for particle mass is reversed. Fig. 6b shows observed and deposited distributions of particle mass for the same days as Fig. 6a. In contrast to particle number, the observed and deposited particle mass is dominated by larger particles above 50 nm, and the mean deposited mass fraction was 20% for downwind conditions vs. 30% for parallel winds. To simplify mass calculations, density was assumed to be equal across particle sizes (1 g cm−3). Particle density has been shown to decrease with decreasing particle size, 1.78 g cm−3 for particles larger than 100 nm and approaching 1 g cm−3 at 50 nm (Park et al., 2004). As a result, the calculations of observed and deposited mass presented in Fig. 6b are underestimated for particles above 100 nm, but overall fraction deposited is little changed. Furthermore, these differences in lung deposition by mass are relatively insensitive to distance because the upper tail of the size distribution changed little with distance regardless of wind orientation.
4. Conclusions
The capability of measuring UFP size distributions in real-time, when combined with higher time resolution meteorological data, uncovered important differences in concentration, size distribution, and expected lung deposition fraction due to differences in wind direction relative to freeways. Many previous studies have focused on winds perpendicular to the freeway, and our results agreed well with these studies when we measured under mostly perpendicular (downwind) conditions. During these conditions, size distributions changes at increasing distance from the freeway appeared to reflect significant rates of evaporation and coagulation of the smallest particles. However, measurements with parallel winds showed concentrations to be about half, with more uniform reductions across particle size, reflecting primarily dilution. Size differences due to more parallel wind orientation are expected to produce about 15% less lung deposition by number which, combined with the lower concentrations present during parallel wind conditions, significantly reduces overall particle deposition by 60%. Multivariate analyses of near-freeway UFP observations further demonstrated the importance of wind direction and temperature in predicting UFP concentrations within 150 m of a freeway, particularly for the smallest size UFP.
Supplementary Material
HIGHLIGHTS
-
▶
UFP size distributions were measured in real-time with a mobile platform.
-
▶
Wind direction shown critical to ultrafine number and size downwind of freeways.
-
▶
Particle number decreases up to half as winds deviate from perpendicular.
-
▶
Particle size also increases, further reducing lung deposition and dose by ~15%.
Acknowledgments
We acknowledge the California Air Resources Board (ARB) for funding this study (Contract #04-348, #09-304) and NIEHS grant 1 K25 ES019224-01 NIEHS for contributing to analysis time. We thank Sumner Wilson at the South Coast Air Quality Management District, and Professor Costas Sioutas and Dr. Katharine Moore for providing meteorological data for our efforts. We also thank Mr. Steve Mara and Drs. Jorn Herner and Seong Park for their insights and contributions. In addition, we would like to thank all ARB staff who assisted in sampling during the study.
References
- Baldauf R, Thoma E, Khylstov A, Isakov V, Bowker G, Long T, Snow R. Impacts of noise barriers on near-road air quality. Atmospheric Environment. 2008;42:7502–7507. [Google Scholar]
- Bowker G, Baldauf R, Isakov V, Khylstov A, Peterson W. The effects of roadside structures on the transport and dispersion of ultrafine particles from highways. Atmospheric Environment. 2007;41:8128–8139. [Google Scholar]
- Brauner VE, Forchhammer L, Moller P, Simonsen J, Glasius M, Wahlin P, Raaschou-Nielsen O, Loft S. Exposure to ultrafine particles from ambient air and oxidative stress-induced DNA damage. Environmental Health Perspectives. 2007;115:1177–1182. doi: 10.1289/ehp.9984. [DOI] [PMC free article] [PubMed] [Google Scholar]
- Brunekreef B, Janssen NAH, de Hartog J, Harssema H, Knape M, van Vilet P. Air pollution from truck traffic and lung function in children living near motorways. Epidemiology. 1997;8:298–303. doi: 10.1097/00001648-199705000-00012. [DOI] [PubMed] [Google Scholar]
- Brunekreef B, Holgate ST. Air pollution and health. The Lancet. 2002;360:1233–1242. doi: 10.1016/S0140-6736(02)11274-8. [DOI] [PubMed] [Google Scholar]
- Cho AK, Sioutas C, Miguel A, Kumagai Y, Schmitz D, Singh M, Eiguren-Fernandez A, Froines J. Redox activity of airborne particulate matter at different sites in the Los Angeles Basin. Environmental Research. 2005;90:40–47. doi: 10.1016/j.envres.2005.01.003. [DOI] [PubMed] [Google Scholar]
- Daigle CC, Chalupa DC, Gibb FR, Morrow PE, Oberdorster G, Utell MJ, Frampton MW. Ultrafine particle deposition in humans during rest and exercise. Inhalation Toxicology. 2003;15:539–552. doi: 10.1080/08958370304468. [DOI] [PubMed] [Google Scholar]
- Dockery DW. Epidemiologic evidence of cardiovascular effects of particulate air pollution. Environmental Health Perspectives. 2001;109(Suppl. 4):483–486. doi: 10.1289/ehp.01109s4483. [DOI] [PMC free article] [PubMed] [Google Scholar]
- EPA (United States Environmental Protection Agency) Air Quality Criteria for Particulate Matter. Research Triangle Park; NC: 2004. [Google Scholar]
- Finn D, Clawson KL, Carter R, Rich JD, Eckman RM, Perry SG, Isakov V, Heist DK. Tracer studies to characterize the effects of roadside noise barriers on near-road pollutant dispersion under varying atmospheric stability conditions. Atmospheric Environment. 2010;44:204–214. [Google Scholar]
- Fruin S, Westerdahl D, Sax T, Sioutas C, Fine PM. Measurements and predictors of on-road ultrafine particle concentrations and associated pollutants in Los Angeles. Atmospheric Environment. 2008;42:207–219. [Google Scholar]
- Godleski JJ. Responses of the heart to ambient particle inhalation. Clinics in Occupational and Environmental Medicine. 2006;5:849–864. doi: 10.1016/j.coem.2006.07.002. [DOI] [PubMed] [Google Scholar]
- Hagler GSW, Thoma E, Baldauf RW. High-resolution mobile monitoring of carbon monoxide and ultrafine particle concentrations in a near-road environment. Journal of the Air and Waste Management Association. 2010;60:328–336. doi: 10.3155/1047-3289.60.3.328. [DOI] [PubMed] [Google Scholar]
- Hagler GSW, Lin M-Y, Khlystov A, Baldauf RW, Isakov V, Faircloth J, Jackson LE. Field investigation of roadside vegetative and structural barrier impact on near-road ultrafine particle concentrations under a variety of wind conditions. Science of the Total Environment. 2012;419:7–15. doi: 10.1016/j.scitotenv.2011.12.002. [DOI] [PubMed] [Google Scholar]
- HEI (Health Effects Institute) HEI Panel on the Health Effects of Traffic-related Air Pollution. 2010. Special Report 17, Traffic-related air pollution: a critical review of the literature on emission, exposure, and health effects. [Google Scholar]
- Herner JD, Hu S, Robertson WH, Huai T, Chang M-CO, Rieger P, Ayala A. Effect of advanced after treatment for PM and NOx reduction on heavy-duty diesel engine ultrafine particle emissions. Environmental Science and Technology. 2011;45:2413–2419. doi: 10.1021/es102792y. [DOI] [PubMed] [Google Scholar]
- Hitchins J, Morawska L, Wolff R, Gilbert D. Concentrations of submicrometre particles from vehicle emissions near a major road. Atmospheric Environment. 2000;34:51–59. [Google Scholar]
- Hu S, Fruin S, Kozawa K, Mara S, Paulson S, Winer AM. A wide area of air pollutant impact downwind of a freeway during pre-sunrise hours. Atmospheric Environment. 2009;43:2541–2549. doi: 10.1016/j.atmosenv.2009.02.033. [DOI] [PMC free article] [PubMed] [Google Scholar]
- ICRP (International Commission on Radiological Protection) Human respiratory tract model for radiological protection: a report of a task group of the International Commission on Radiological Protection. Annals of the ICRP. 1994;24(1–3):267–272. [PubMed] [Google Scholar]
- Jacobson MZ, Kittelson DB, Watts WF. Enhanced coagulation due to evaporation and its effect on nanoparticle evolution. Environmental Science and Technology. 2005;39:9486–9492. doi: 10.1021/es0500299. [DOI] [PubMed] [Google Scholar]
- Jamriska M, Morawska L, Mergersen K. The effect of temperature and humidity on size segregated traffic exhaust particle emissions. Atmospheric Environment. 2008;42:2369–2382. [Google Scholar]
- Janssen NAH, Brunekreef B, van Vilet P, Aarts F, Meliefste K, Harssema H, Fischer P. The relationship between air pollution from heavy traffic and allergic sensitization, bronchial hyperresponsiveness, and respiratory symptoms in Dutch schoolchildren. Environmental Health Perspectives. 2003;111:1512–1518. doi: 10.1289/ehp.6243. [DOI] [PMC free article] [PubMed] [Google Scholar]
- Kittelson DB, Watts WF, Johnson JP. Nanoparticle emissions on Minnesota highways. Atmospheric Environment. 2004;38:9–19. [Google Scholar]
- Kozawa K, Fruin S, Winer AM. Near-road air pollution impacts of goods movement in communities adjacent to the ports of Los Angeles and Long Beach. Atmospheric Environment. 2009;43:2960–2970. [Google Scholar]
- Li N, Sioutas C, Cho A, Schmitz D, Misra C, Sempf J, Wang M, Oberley T, Froines J, Nel A. Ultrafine particulate pollutants induce oxidative stress and mitochondrial damage. Environmental Health Perspectives. 2003;111:455–460. doi: 10.1289/ehp.6000. [DOI] [PMC free article] [PubMed] [Google Scholar]
- Lin S, Munsie JP, Hwang S-A, Fitzgerald E, Cayo MR. Childhood asthma hospitalization and residential exposure to state route traffic. Environmental Research. 2002;88:73–81. doi: 10.1006/enrs.2001.4303. [DOI] [PubMed] [Google Scholar]
- Londahl J, Massling A, Pagels J, Swietlicki E, Vaclavik E, Loft S. Size-resolved respiratory-tract deposition of fine and ultrafine hydrophobic and hygroscopic aerosol particles during rest and exercise. Inhalation Toxicology. 2007;19:109–116. doi: 10.1080/08958370601051677. [DOI] [PubMed] [Google Scholar]
- Londahl J, Massling A, Vaclavik Brauner E, Ketzel M, Pagels K, Loft S. Experimentally determined human respiratory tract deposition of airborne particles at a busy street. Environmental Science and Technology. 2009;43:4659–4664. doi: 10.1021/es803029b. [DOI] [PubMed] [Google Scholar]
- McConnell R, Berhane K, Yao L, Jerrett M, Lurmann F, Gilliland F, Kunzli N, Gauderman J, Avol E, Thomas D, Peters J. Traffic, susceptibility, and childhood asthma. Environmental Health Perspectives. 2006;114:766–772. doi: 10.1289/ehp.8594. [DOI] [PMC free article] [PubMed] [Google Scholar]
- Montoya L, Lawrence J, Murthy GK, Sarnat J, Godleski J, Koutrakis P. Continuous measurements of ambient particle deposition in human subjects. Aerosol Science and Technology. 2004;38(10):980–990. [Google Scholar]
- Ntziachristos L, Froines JR, Cho AK, Sioutas C. Relationship between redox activity and chemical speciation of size-fractionated particulate matter. Particle and Fibre Toxicology. 2007;4:5. doi: 10.1186/1743-8977-4-5. [DOI] [PMC free article] [PubMed] [Google Scholar]
- Ning Z, Hudda N, Daher N, Kam W, Herner J, Kozawa K, Mara S, Sioutas C. Impact of roadside noise barriers on particles size distributions and pollutants concentrations near freeways. Atmospheric Environment. 2010;44:3118–3127. [Google Scholar]
- Oberdorster G. Pulmonary effects of inhaled ultrafine particles. International Archives of Occupational and Environmental Health. 2000;74:1–8. doi: 10.1007/s004200000185. [DOI] [PubMed] [Google Scholar]
- Park K, Kittelson DB, Zachariah R, McMurry PH. Measurement if inherent material density of nanoparticle agglomerates. Journal of Nanoparticle Research. 2004;6:267–272. [Google Scholar]
- PeMS [last accessed June 2010];Freeway Performance Measurement System. 2010 http://pems.dot.ca.gov/
- Rodes C, Holland DM. Variations of NO, NO2, and O3 concentrations downwind of a Los Angeles freeway. Atmospheric Environment. 1980;15:243–250. [Google Scholar]
- van Vliet P, Knape M, de Hartog J, Janssen N, Harssema H, Brunekreef B. Motor vehicle exhaust and chronic respiratory symptoms in children living near freeways. Environmental Research. 1997;74:122–132. doi: 10.1006/enrs.1997.3757. [DOI] [PubMed] [Google Scholar]
- Venn AJ, Lewis SA, Cooper M, Hubbard R, Britton J. Living near a main road and the risk of wheezing illness in children. American Journal of Respiratory and Critical Care Medicine. 2001;164:2177–2180. doi: 10.1164/ajrccm.164.12.2106126. [DOI] [PubMed] [Google Scholar]
- Westerdahl D, Fruin SA, Sax T, Fine PM, Sioutas C. Mobile platform measurements of ultrafine particles and associated pollutant concentrations on freeways and residential streets in Los Angeles. Atmospheric Environment. 2005;39:3597–3610. [Google Scholar]
- Zhang KM, Wexler AS. Evolution of particle number distribution near roadways-Part I: analysis of aerosol dynamics and its implications for engine emission measurement. Atmospheric Environment. 2004;38:6643–6653. [Google Scholar]
- Zhang KM, Wexler AS, Zhu YF, Hinds WC, Sioutas C. Evolution of particle number distribution near roadways, part II: the `road to ambient' process. Atmospheric Environment. 2004;38:6655–6665. [Google Scholar]
- Zhu Y, Hinds WC, Kim S, Sioutas C. Concentration and size distribution of ultrafine particles near a major highway. Journal of the Air and Waste Management Association. 2002a;52:1032–1042. doi: 10.1080/10473289.2002.10470842. [DOI] [PubMed] [Google Scholar]
- Zhu Y, Hinds WC, Kim S, Shen S, Sioutas C. Study of ultrafine particles near a major highway with heavy-duty diesel traffic. Atmospheric Environment. 2002b;36:4323–4335. [Google Scholar]
- Zhu Y, Hinds WC, Shen S, Sioutas C. Seasonal trends of concentration and size distribution of ultrafine particles near major highways in Los Angeles. Journal of Aerosol Science and Technology. 2004;38:5–13. [Google Scholar]
Associated Data
This section collects any data citations, data availability statements, or supplementary materials included in this article.


