

Abstract
The social amoeba Dictyostelium discoideum was instrumental in the discovery and early characterization of inositol pyrophosphates, a class of molecules possessing highly-energetic pyrophosphate bonds. Inositol pyrophosphates regulate diverse biological processes and are attracting attention due to their ability to control energy metabolism and insulin signalling. However, inositol pyrophosphate research has been hampered by the lack of simple experimental procedures to study them. The recent development of polyacrylamide gel electrophoresis (PAGE) and simple staining to resolve and detect inositol pyrophosphate species has opened new investigative possibilities. This technology is now commonly applied to study in vitro enzymatic reactions. Here we employ PAGE technology to characterize the D. discoideum inositol pyrophosphate metabolism. Surprisingly, only three major bands are detectable after resolving acidic extract on PAGE. We have demonstrated that these three bands correspond to inositol hexakisphosphate (IP6 or Phytic acid) and its derivative inositol pyrophosphates, IP7 and IP8. Biochemical analyses and genetic evidence were used to establish the genuine inositol phosphate nature of these bands. We also identified IP9 in D. discoideum cells, a molecule so far detected only from in vitro biochemical reactions. Furthermore, we discovered that this amoeba possesses three different inositol pentakisphosphates (IP5) isomers, which are largely metabolised to inositol pyrophosphates. Comparison of PAGE with traditional Sax-HPLC revealed an underestimation of the cellular abundance of inositol pyrophosphates by traditional methods. In fact our study revealed much higher levels of inositol pyrophosphates in D. discoideum in the vegetative state than previously detected. A three-fold increase in IP8 was observed during development of D. discoideum a value lower that previously reported. Analysis of inositol pyrophosphate metabolism using ip6k null amoeba revealed the absence of developmentally-induced synthesis of inositol pyrophosphates, suggesting that the alternative class of enzyme responsible for pyrophosphate synthesis, PP-IP5K, doesn’t’ play a major role in the IP8 developmental increase.
Introduction
The model organism Dictyostelium discoideum, originally developed to study the transition to multicellularity, has subsequently been utilised in several areas of biology from chemotaxis [1] to transcriptional control [2]. Upon exhaustion of nutrients, the Dictyosteliidae slime moulds are able to aggregate into multicellular forms, a process regulated by cAMP signaling [3]. The aggregated slugs develop into fruiting bodies (or sporocarp) compromised of two main cell types; stalk cells and thousands of spore cells. Much of the early work with this amoeba focused on this fascinating behaviour. However, in the late 1980s this model organism began to offer insight into the metabolism of inositol phosphates [4]. In fact, it was in D. discoideum that the synthesis of inositol hexakisphosphates (IP6) through direct phosphorylation of inositol was discovered [5].
D. discoideum has also been instrumental in the discovery of inositol pyrophosphates (also known as diphosphoinositol phosphates) (For reviews see [6], [7]) molecules containing highly energetic pyrophosphate moiety(ies) recently implicated into the regulation of cellular homeostasis [8], [9], [10]. Inositol pyrophosphates were identified in 1993 in D. discoideum [11] and in mammalian cell [12]. During the 1990s the synthesis of the inositol pyrophosphate IP7 (diphosphoinositol pentakisphosphate or PP-IP5) and, in particular, IP8 (bisdiphosphoinositoltetrakisphosphate or (PP)2-IP4) was linked to the D. discoideum developmental program [13]. Furthermore, thanks to the high concentration of these molecules in this amoeba, NMR could be used to resolve the isomeric nature of IP7 and IP8 extracted from D. discoideum cells. The structure of these isoforms - the 5PP-IP5 isomer of IP7 and the 5,6(PP)2-IP4 isomer of IP8 [14] are, to date, the only resolved structures of inositol pyrophosphates extracted from cells.
Despite the influence of this organism, D. discoideum has faded from the attentions of inositol phosphate scientists over time. The last study demonstrating the importance of inositol pyrophosphate in regulating Dictyostelium chemotaxy was published over 10 years ago [15]. This disengagement is in part due to the emergence of another experimental model, the yeast Saccharomyces cerevisiae [16], [17] but also to the difficulty in promptly labelling the amoeba with tritium inositol (3H-inositol) [18]. Therefore the use of routine Sax-HPLC (Strong anion exchange chromatography) to resolve the different radiolabeled inositol phosphates becomes cumbersome and expensive to apply to amoeba cells. Thus, chromatographic separation of inositol phosphates in Dictyostelium is normally performed using metal dye detector post-colum derivatization (MDD-HPLC) [11], [19] requiring a dedicated three pump HPLC apparatus and therefore is not a widespread technology.
Two different classes of enzymes are able to synthesize inositol pyrophosphates: the inositol hexakisphosphate kinases IP6Ks (Kcs1 in yeast) [20] and the PP-IP5Kinases (Vip1 in yeast) [21], [22]. These enzyme are mainly characterised from mammalian sources and possess the ability to pyrophosphorylate position 5 of the inositol ring (IP6K) [23] and position 1 (PP-IP5K) [24] in vitro. Thus, it is believed that mammalian cells posses a different isomer of IP8, namely the 1,5(PP)2-IP4 species [25].
The recent discovery that higher inositol phosphates can be resolved by polyacrylamide gel electrophoresis (PAGE) [26] and visualised by simple staining, bypassing the need to use radio labelled material, has enormously improved in vitro studies of inositol pyrophosphates [27]. In particular, this has facilitated characterisation of the inositol pyrophosphate synthesizing kinases; the inositol hexakisphosphate kinases (IP6Ks in mammals, Kcs1 in yeast) and the Diphosphoinositol pentakisphosphate kinases (PP-IP5Ks in mammals, Vip1 in yeast) [26].
In the current work we applied this PAGE technology to samples obtained from live cells, allowing us to analyse the in vivo inositol phosphate metabolism by PAGE for the first time. We demonstrated the existence of different inositol pyrophosphate species by both DAPI and Toluidine Blue staining, and reveal a complex metabolism comprising inositol pyrophosphates derived from both IP6 and inositol pentakisphosphates (IP5). Furthermore, the analysis of inositol pyrophosphate metabolism during D. discoideum development revealed a far less dramatic increase in levels of IP8 than has been previously described.
Results
Resolving D. discoideum Cell Extract by PAGE Revealed the Presence of IP6, IP7 and IP8
Inositol polyphosphates are routinely extracted using strong acid solutions, usually Percloric Acid. If appropriately labelled with 3H-inositol this cell extract can be neutralised and analysed by Strong anion exchange chromatography (Sax-HPLC) [28]. The high levels of inositol pyrophosphates in D. discoideum prompted us to analyse a fraction (1/20 by volume) of the neutralised unlabeled cells extract, equivalent to 1–2 106 cells, by PAGE [26]. Sample migration during PAGE is normal when just 20–40 microlitres of cell extract is loaded (Fig. 1). To our surprise, extract from vegetative Wild Type AX2 (WT) D. discoideum cells reveals the presence of three major bands by Toluidine staining. The fastest migrating band co-migrates with the commercially available IP6 standard (Fig. 1). Staining with DAPI also reveals the same three major bands (Fig. 1). Interestingly, DAPI is heavily photobleached (resulting in negative staining) by the two slower migrating bands and not by that which comigrates with IP6. This method of staining reveals a further weaker band, which migrates still slower and is not always detectable by Toluidine. It was previously demonstrated that the ability to photobleach DAPI is a typical characteristic of the pyrophosphate moiety [26], however the large amount of IP6 present in D. discoideum extract is able to induce some DAPI photo-bleaching, though at a much lower efficiency. Thus, besides IP6 the other bands are expected to be IP7, IP8 and, newly detected, endogenous IP9, previously identified only in vitro [23].
Figure 1. PAGE analysis of D. discoideum cell extract reveal the presence of three major bands.

Inositol phosphates were extracted from 10(WT) D. discoideum (AX2 strain) and the IP6-Kinase (ip6k null) and phospholipase C mutant (plc null) grown at a density of 2–4×10⁶ . About 30–40 microliters of neutralised cell extract (equivalent to 1/20 of the total volume) was resolved on 35.5% PAGE [26] and visualized with Toluidine blue (A) and DAPI staining (B). The figure shows the result of a representative experiment that was repeated three times.
To confirm the nature of these bands we use several approaches. First genetic; the analysis of acidic extract of Inositol Hexakisphosphate Kinase (IP6K) null amoeba (gene I6KA, DDB_G0278739) [15] reveals only the presence of a band co-migrating with IP6 and a weaker band, detectable only by DAPI, co-migrating with IP7 (Fig. 1). The virtual absence of IP7, and the total deficiency of the respective IP8 and IP9 bands phenocopies the yeast ip6k mutant (kcs1Δ) that lack any detectable inositol pyrophosphates [16], [29]. Using traditional 3H-inositol labelling and Sax-HPLC analysis, the absence of any inositol pyrophosphates in ip6k null amoeba has been previously verified [15]. Interestingly, DAPI analysis reveals the presence of a new, retarded band in ip6k null amoeba (labelled nd in Fig. 1B). This band is of undetermined nature although DAPI photobleaching ability suggests the presence of pyrophosphate moieties. The analysis of phospholypase C (PLC) mutant cells reveals a pattern of bands similar to WT cells in striking contrast of the yeast plc1Δ strain that lacks the synthesis of any highly phosphorylated forms of inositol phosphates [17]. However, our result is coherent with previous reports that demonstrate normal levels of inositol pyrophosphates in D. discoideum plc null cells (gene pipA, DDB_G0292736) [18], [30] and with the ability of the amoeba to synthesize IP6 directly from inositol independently from lipid cleavage [5].
Secondly, we use enzymology to confirm the nature of these bands as genuine inositol phosphates. The treatment of WT extract with phytase, an enzyme capable of fully dephosphorylating IP6 (also call Phytic Acid), resulted in the complete disappearance of the three major bands (Fig. 2A). The treatment of WT extract with DDP1 (Fig. 2B), a phosphatases that specifically degrades the pyrophosphate moiety, resulted in a almost complete degradation of IP7 and IP8 with the corresponding formation of IP6.
Figure 2. Treatment by Phytase, Ddp1 and acidic degradation define IP6, IP7, and IP8, in D. discoideum cell extract.

Wild type D. discoideum cell extract (-) was incubated with phytase (Phy) (A), recombinant diphosphoinositol polyphosphate phosphohydrolase (DDP1) (B) or treated with acid at high temperature (C). The inositol phosphate nature of the three major bands detectable by Toluidine stain is demonstrated by the Phytase treatment (A), an enzyme able to remove the phosphate group from any position of the inositol rings. The pyrophosphate nature of the two slower migrating bands is demonstrated by their disappearance after DDP1 treatment (B) and by the well known acidic sensitivity of the phosphoanhydride bond (C). The figure shows the result of a representative experiments repeated three to four times.
Phosphoanhydride bonds (the pyrophosphate moiety) are rapidly hydrolysed in acid at higher temperatures. Consequently, we also incubated the acidic extract at 90°C for 10 minutes before neutralization. This treatment (Fig. 2C) revealed the complete degradation of the IP7 and IP8 bands and the resultant formation of IP6 as well as three further fast migrating bands. These three extra bands migrate as expected of IP5, which is almost undetectable in untreated cell extract (Fig. 1, 2, 3). This suggests the existence of an elaborate inositol pyrophosphate metabolism (see below).
Figure 3. Mass spectrometry analysis of inositol pyrophosphates purified from D. Discoideum cell extract.
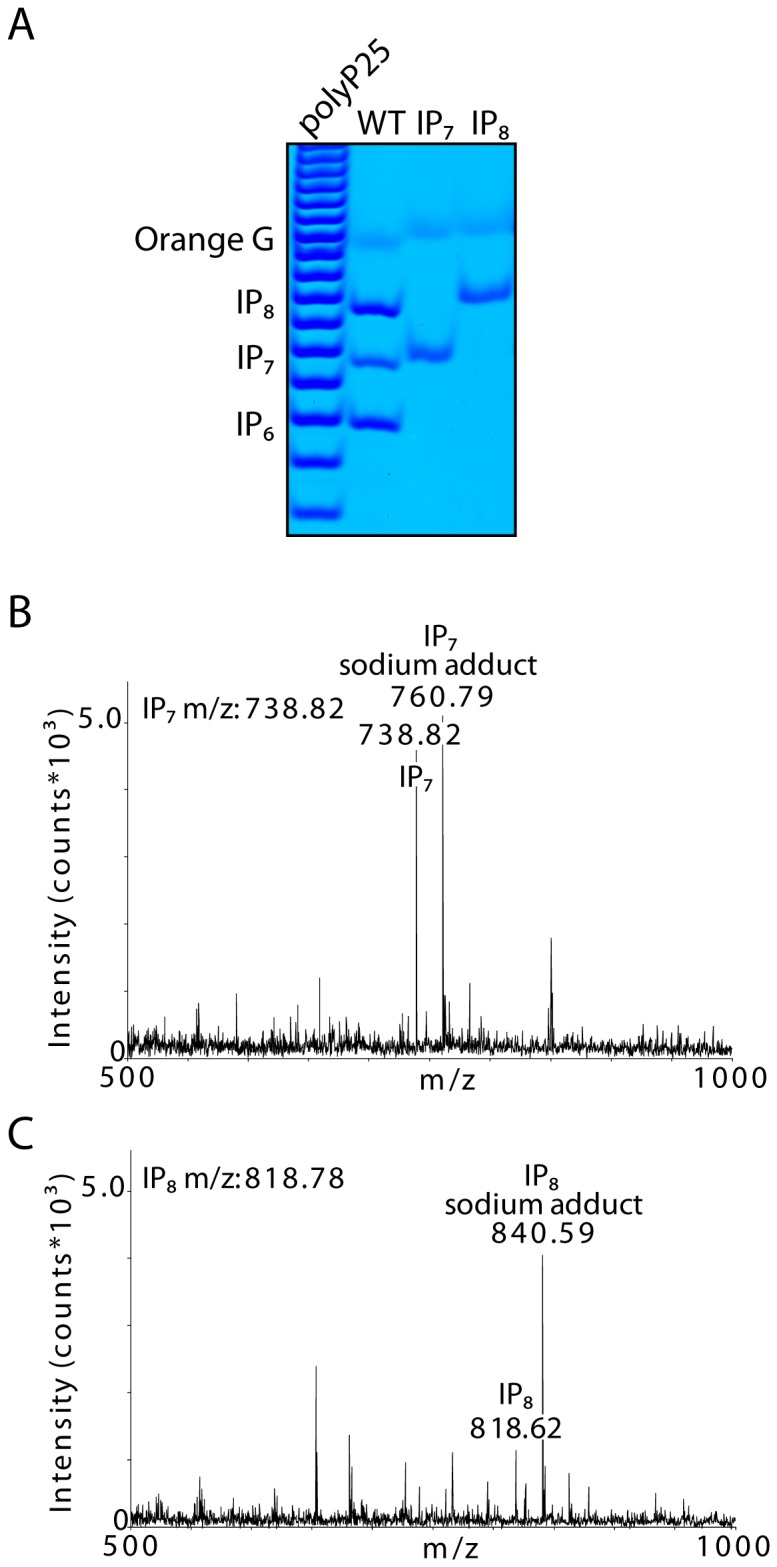
Gel purified inositol pyrophosphates (A) were subjected to mass spectrometry (B,C). The comparison of the m/z spectrum of IP7 (B) and IP8 (C) is shown. The peaks in the spectra describing inositol pyrophosphates purified from D. discoideum are in agreement with the theoretical values for molecular weight that are deduced to be 738.82 Da and 818.78 Da respectively.
Finally we use mass spectrometry to determine the mass of the purified bands (Fig. 3A). The analysis of the putative IP7 band reveals, in the m/z range 500–1000, two major peaks at 738.822 and 760.793 m/z. These m/z values are well in accordance with the theoretical mass of deprotonated IP7 and its sodium adduct respectively (Fig. 3B). The detection of an intense peak at +22 m/z with respect to the deprotonated molecule is an additional confirmation of the presence of phosphate moieties on the analyte. Similarly, the analysis of the putative IP8 band reveals a major peak at 840.590 m/z, and a minor peak at 818.627 m/z (Fig. 3C). These values correspond to the theoretical mass of, respectively, the sodium adduct of deprotonated IP8 and deprotonated IP8. The increased relative intensity of the sodium adduct is an additional confirmation of the increased number of phosphate moieties attached to the analyte in the putative IP8 band compared to the putative IP7 band.
Unfortunately, we observed a decrease in mass spectrometry ionization efficiency with increasing number of phosphate groups, as can be appreciated by comparing absolute intensities of IP7 and IP8 MALDI-TOF spectra in (Fig. 3B and C). Therefore, we were unable to determine the mass of the IP9 band. Nevertheless, taken together these genetic and biochemical studies prove that the bands observable in D. discoideum extract are bona fide inositol pyrophosphates.
Presence of a Complex IP5 Derived Inositol Pyrophosphates Metabolism
The appearance of bands migrating faster that IP6 after acidic hydrolysis prompted us to perform further analysis with the aim to determine their exact nature. We split a cell extract (from 5 ml culture growth at a density of 2–4×10⁶ cells/ml) into two halves and subjected one half to acidic hydrolysis. After neutralisation this half as well as the untreated half were analysed by PAGE. We employed IP6 as a standard as well the six IP5 isomers (Fig. 4A). Loading a larger amount of cell extract allowed us to detect fast migrating three weak bands in the untreated sample lane. These bands co-migrate with distinct IP5 standards. The acidic treated samples reveals a robust increase of both IP6, due to the conversion of IP7 and IP8 to IP6, and the three IP5 isomers. This indicates presence of inositol pyrophosphate generated from IP5, such as PP-IP4 and likely also (PP)2-IP3, which are converted back to IP5 by acidic treatment. The inositol pyrophosphates PP-IP4 and (PP)2-IP3 possessing six and seven phosphates groups migrate very closely (or co-migrate) with the more abundant IP6 and IP7 species and thus cannot be directly detected in untreated WT cell extract.
Figure 4. Characterization of D. discoideum IP5 species.

Half of the acidic cell extract (from 5 ml culture) of WT D. discoideum was incubated on ice (-) while the second half was incubated at 90°C for 20 min (Acid). Both samples were thenneutralised and resolved on 35.5% PAGE together with the six possible IP5 isomers. Inositol phosphates were visualised by Toluidine staining. Densitometry analysis of treated versus untreated sample was performed and IP6 and IP5s bands intensity compared. (A). Acidic treatment reveals the distinct presence of three IP5 species, which are otherwise barely detectable, indicating that D. discoideum possesses a complex IP5-derived inositol pyrophosphate metabolism. (B) Schematic representation of inositol pyrophosphate metabolism in D. discoideum. The gray arrow to (PP)2-IP3 indicates a likely potentiallye step. The dashed arrow from inositol to IP3 indicates uncharacterized enzymatic steps. The figure shows the result of a representative experiment that was repeated three times.
Densitometry analysis of treated IP6 and IP5s versus untreated counterpart reveals that ∼60% of the IP6 pool is converted to IP7 and IP8 while ≥90% of IP5 pool is converted to inositol pyrophosphate species (Fig. 4B). This indicates that pyrophosphates derived from IP5 and IP6 have differing metabolism and turnover. The extraordinary ability of PAGE to resolve different IP5 isomer and the densitometry analysis of the three IP5 bands reveal that the IP5 pool of D. discoideum cell is distributed as follows, ∼10% I(1,2,3,4,6)P5; ∼30% I(2,3,4,5,6,)P5 and/or I(1,2,4,5,6)P5; ∼60% I(1,3,4,5,6)P5 and/or I(1,2,3,5,6)P5 and/or I(1,2,3,4,5)P5. The presence of at least three IP5 isomers is confirmed by an early report [5], [31]. However these earlier studies, which relied on HPLC revealed differing relative distributions of the IP5 isomeric species [31]. It is important to note that strong acidic conditions (such as those used in HPLC analysis) can induce phosphate groups to move to adjacent hydroxyl positions, altering the isomeric nature of inositol phosphates, a well known phenomena during phosphoinositide (inositol lipid) purification [32]. High temperature and acidity are also able to induce movement of phosphate groups around the hydroxyl groups of the inositol ring in IP5 (Figure S1). However, the presence of the three IP5 species in untreated samples (Fig. 4A) is supportive of the genuine existence of at least three different IP5 isomers in D. discoideum. The fact that all of these IP5 species are enriched after pyrophosphate hydrolysis indicates that multiple IP5 isomers are precursors of inositol pyrophosphate species indicating a complex isomeric mixture of pyrophosphates derived from IP5.
PAGE Analysis Revealed High Levels of Inositol Pyrophosphates
Previous studies aiming to analyse the level of inositol pyrophosphate during D. discoideum development have estimated the levels of IP7 and IP8 in vegetative stage cells to be 3–6% of the levels of IP6, a ratio comparable to that observable in mammalian cells. This data, obtained using MDD-HPLC [13], was subsequently confirmed by traditional metabolic 3H-inositol labelling and Sax-HPLC technology [15]. Strikingly, however, our extraction and PAGE analysis reveals substantially higher levels of inositol pyrophosphates during vegetative state growth (Fig. 1, 2, 3, 4). DAPI analysis reveals a markedly darker stain of the IP8 band over IP6 (Fig. 1B). This can be attributed to the favourable ability of the pyrophosphates moiety to photobleach DAPI [26]. The monoaminic Toluidine, however, stains the single phosphates groups with similar efficiency. Therefore a molecule of IP8 possessing 8 phosphate groups, compared to just 6 on a molecule of IP6 groups should stain more intensely than IP6. Experimentally this value has been calculated to be 1.27+/−0.08 (see material and methods for details and Figure S2). However, even taking into account this correction factor, densitometry measurement of PAGE analysis revealed the ratio of IP8 to IP6 in the vegetative state to be in the range 30–40% (Fig. 1, 2, 3, 4). Therefore, traditional HPLC technology substantially underestimates the level of cellular inositol pyrophosphates. It is likely that this effect is due to the fact that pyrophosphate (phosphoanhydride) bonds are acid labile and prone to degradation during acidic HPLC running conditions.
To further confirm this observation we ran cultures in parallel; one labelled with 3H-inositol and analysed by HPLC, while the second was run by PAGE and analysed by Toluidine staining. We rapidly extracted the inositol phosphates at 4°C to minimise the duration and effect of the acidic conditions. This parallel analysis, reveals that the IP8 level as ratio over IP6 was 27.5%+/−6.9 (n = 4) and 36.3%+/−4.7 (n = 4) analysed by Sax-HPLC or PAGE respectively. Therefore traditional HPLC analysis results in a substantial 1/4 underestimation of IP8 cellular levels.
Application of PAGE to this in vivo system for the first time allows us to determine the intracellular concentration of highly phosphorylated inositol phosphates by simple densitometry (using IP6 concentration standards to simply calculate a linear regression curve). Our study reveals that in vegetative state, estimating a cell volume of 0.20 pL, the concentration of IP6, IP7 and IP8 are ∼520, 60 and 180 µM respectively. Interestingly, the IP6 value is in accordance with previous estimates [5], [33].
Inositol Pyrophosphates Cellular Levels Increase during Development
Dictyostelium development occurs upon exhaustion of food supply. This starvation response can be induced by shifting vegetative D. discoideum cells to agar plates made with a simple phosphate buffer (see material and methods). The regulation of inositol pyrophosphate metabolism during the slime mould’s developmental program has been previously investigated [13]. This study revealed the most dramatic cellular concentration change in IP7 and IP8 so far reported, with a 25-fold increase of IP8 level [13]. However, our obseravtions that IP7 and IP8 are present at high levels in vegetative cells (Fig. 1–4) led us to question the scale of this dramatic increase. Therefore we subjected WT and ip6k null cells to starvation, inducing the developmental program.
Cells were grown to a density of 2×10⁶ cells/ml, washed in phosphate buffer and then plated onto 20 mM phosphate buffer agar plates. Cells were collected at 5 time points; time zero, whilst still in the vegetative state; after one hour of starvation; upon first visual signs of aggregation (6–9 hr depending on strain); during the “slug” stage 15–17 hs after induction of starvation and finally after 24 hr as mature fruiting bodies. Analysis of acidic cell extract shows a clear increase of IP8 (in comparison to IP6) of 2,6 fold during the developmental time course. Therefore, although we observe a clear and substantial increase in IP8 levels (Fig. 5A), it is in the region of three fold, well below the 25-fold seen previously by HPLC analysis [13].
Figure 5. PAGE analysis of inositol pyrophosphate during D. Discoideum development.

Amoeba development program was induced as described in material and methods. The inositol phosphates extracted at the indicated time points were resolved on 35% PAGE and visualised with Toluidine. (A) The analysis of wild type (WT) D. discoideum developmental program reveal a 2.6fold increase in the IP8/IP6 ratio at the late stage of development, as quantified by densitometry quantified (Bottom), average +/− SD of four independent experiments. (B) To the contrary inositol pyrophosphates are not induced during IP6-Kinase (ip6k null) developmental program. The figure shows the result of a representative experiment that was repeated four times for the WT and two times for ip6k1 null.
We also performed developmental study of ip6k null stain (Fig. 1) [15]. This analysis revealed the lack of induction of any inositol pyrophosphate forms (Fig. 5B). This data indicates that the D. discoideum PP-IP5K homologous gene (DDB_G0284617) does not play any major role in the developmental increase of inositol pyrophosphates.
The D. discoideum development program is elicited by cAMP signal and it was reported that cAMP stimulation induced a rapid (within minutes) threefold increase in inositol pyrophosphate levels [15]. We repeated these studies and failed to see any significant change in IP7 and IP8 levels in response to cAMP when analysed by PAGE (Fig. 6).
Figure 6. No alteration of IP7 and IP8 metabolism after cAMP treatment.

Vegetative growing D. Discoideum were incubated for the indicated time with 50 µM cAMP. The incubation was terminated with equal volume of 2M Percloric acid to extract the inositol phosphates. These were resolved on 35% PAGE and stained with Touilidine blue. Two independent experiments are shown with short (left) and long (right) cAMP incubation time. The figure shows the result of a representative experiment that was repeated three times.
Discussion
The recently developed PAGE technology to resolve and visualise inositol phosphates has been previously employed to characterise in vitro enzymatic reaction [26], [27]. Here we show the huge potential of this technology to study inositol pyrophosphate metabolism in D. discoideum. The high abundance of this class of molecules in D. discoideum, coupled with the ease of analysis by PAGE has allowed us to re-evaluate the regulation of inositol pyrophosphate metabolism during the amoeba development. This re-evaluation has revealed a 3-fold increase in IP8 levels reached in mature fruiting bodies a value far below the 25-fold increase that was previously determined by MDD-HPLC [13]. MDD-HPLC technology requires the extracted samples to be resolved using an elution buffer containing 0.1M Hydrochloric Acid [13]. This condition is likely to result in the hydrolysis of pyrophosphate bonds and thus increased variability between samples. Therefore, the difference of IP8 induction during Dictyostelium development between our PAGE analysis and the previous study [13] is most likely due to the acidic sensitivity of the pyrophosphate moiety and its degradation during the strong acidic conditions associated with MDD-HPLC.
In agreement with this, analysis of 3H-inositol labelled inositol pyrophosphates by Sax-HPLC, a technology that requires less acidic conditions (Ammonium Phosphate buffer at pH 3.8) reveals that the IP8 ratio over IP6 is ∼27% higher than previous studies suggested [13]. However, pyrophosphate hydrolysis still occurs in the mildly acidic Sax-HPLC running conditions. In fact, when the IP8 ratio over IP6 ratio was measured by PAGE and densitometry (sample resolved in 1XTBE, buffer pH8.0) this value was still higher at ∼36%. Therefore both in vitro study [26] and also the current in vivo PAGE analysis suggest that HPLC analysis underestimates the cellular levels of inositol pyrophosphates. Unfortunately, technical problems still preclude the application of PAGE analysis to mammalian cells. As such, HPLC analysis remains, at least for now, the only viable method for this system. We have also demonstrated that PAGE can resolve several of the different IP5 isomeric species (Fig. 4A). This has allowed us to observe at least three different IP5 isomers in vegetative D. discoideum consistent with early reports [5], [31]. This is not a surprise as mammalian cells also possess multiple IP5 species [34], [35]. Unexpectedly, all the IP5s species are precursors of inositol pyrophosphates. Therefore, the inositol pyrophosphates derived from IP5 are quite complex in compositions, with multiple isomeric forms of PP-IP4 and (PP)2-IP3 existing in vivo. The same enzymes that generate IP7 from IP6, the IP6Ks, also generate these inositol pyrophosphates species in vitro [16], [29]. Thus the relative cellular abundance between IP7/IP8 and PP-IP4/(PP)2-IP3 might depend on the levels of IP5 versus IP6. While in D. discoideum IP6 is far more abundant of IP5 this is not the case the majority of mammalian cell lines where the cellular concentration of these two inositol polyphosphates are similar and regulated in neuron by neurotrofine signal [36]. Consequently inositol pyrophosphate derived from both IP5 and IP6 precursors are likely to have similar cellular abundance and physiological importance. More attention needs to be invested to study the functions of the IP5 derived inositol pyrophosphates. The fact that PP-IP4 is often undetected on Sax-HPLC (due to co-migration with IP6), is neither an indicator of its absence nor of a lack of physiological roles.
The simple, inexpensive and reliable PAGE analysis leads to clear qualitative and quantitative information by using simple densitometry. Classical 3H-inositol labelling and Sax-HPLC analysis of highly phosphorylated inositol perhaps retains the advantage of a higher dynamic range to calculate the relative abundance of the inositol polyphosphates. However, the use of radioactive material and HPLC apparatus has limited the implementation of inositol phosphate research to the large majority of cell biology laboratories. Here we have demonstrated the huge potential of PAGE technology to study D. discoideum inositol phosphate metabolism. PAGE analysis coupled with the generation of the knockout mutant strains for the several inositol phosphate kinases present in the amoeba genome will create a genetic system that will easily surpass the S. cerevisiae model, due to the higher complexity and greater similarity to the mammalian system.
The obvious future objective is to apply this PAGE technology to analyse inositol pyrophosphate metabolism in mammalian experimental models. However, because of the low abundance of inositol polyphosphate in mammalian cells, the direct application of PAGE technology to this system is not yet possible (Saiardi lab unpublished result). On the other hand, the effortless nature of PAGE technology should encourage further effort towards this goal, thereby opening new avenues for investigation.
Materials and Methods
Strains, Media and Reagents
We used the axenic D. discoideum strain AX2, ip6k null (axeA2,axeB2,axeC2,I6KA-[KO-vector],bsR) and plc null (axeA1, axeB1, axeC1, plc-[pNeoPLCko], neoR) background have been previously described [15], [18] and were obtained from dictyBase (http://dictybase.org). D. discoideum was generally grown in HL/5 or SIH acquired from Foremedium in presence of penicillin and streptomycin (Gibco). Polyacrylamides, TEMED, ammonium persulfate, were acquired from National Diagnostic. Inositol phosphates were acquired from Calbiochem (IP6) and Sichem (IP5s). All others reagents were purchased from the Sigma-Aldrich. Recombinant His-DDP1 was expressed and purified as previously described [8].
Culture Condition and cAMP Treatment
Amoeba cells were inoculated at a density of 1×10⁵ cells/ml in HL5 in a glass flask, and incubated with shaking at 22°C, 120 RPM. To keep the cells in the vegetative state, stock cultures were diluted every 2–3 days such that cell density didn’t surpass 5–6×10⁶ cells/ml. Every 2–3 weeks new D. discoideum were started from DMSO stock. Treatment with cAMP was performed on active growing vegetative stage cell. cAMP was added to a final concentration of 50 µM to100 µl of cells and the treatments were terminate by adding 100 µl of Percloric Acid 2 M to initiate inositol phosphate extraction.
Inositol Phosphates Extraction
The inositol polyphosphate extraction procedure is an adaptation of the yeast protocol previously described [28]. D. discoideum cells were collected during the exponential growth phase (1–3×10⁶ cells/ml) washed twice with KPO4H buffer 20 mM pH 6.0 and centrifuged at 1500 RPM on a Sorval RC-3C centrifuge for 3 min. The cell pellets were transferred to eppendorf tubes, resuspended in 1 M Perchloric acid, vortexed for 5 min at 4°C and centrifugated at 14000 RPM at 4°C for 5 min. The supernatants were transferred to a new tube and neutralised using 1M Potassium Carbonate containing 3 mM EDTA. The samples were placed on ice for 2–3 hours and subsequently spun for 10 min. The supernatants were transferred to new tubes and stored at 4°C. If required, the supernatants volume was reduced using a speed vacuum.
PAGE Analysis and Band Intensity Analysis
To resolve inositol phosphates we used 24×16×0.1 cm glass plates, using 35% polyacrylamide in 1XTBE. Samples were mixed with 6×Dye (0.01% Orange G or Bromophenol Blue; 30% glycerol; 10 mM TrisHCl pH 7.4; 1 mM EDTA). Gels were pre-run for 30 min at 300 V and run at 600 V 6 mA overnight at 4°C until the Orange G had run through 2/3 of the gel. Gels were stained with DAPI or Toluidine Blue as described previously [26]. After scanning, the Tiff format file, band densitometry was performed using ImageJ software (http://rsbweb.nih.gov/ij/). To determine the differential Toluidine Blue staining efficiency pure IP8 and IP7 were converted to IP6 by acid hydrolysis and resolved by PAGE. The different densitometry intensity of IP7 and IP8 untreated samples versus the generated IP6 was then calculated (Supporting Fig. S2). IP8 is 1.27+/−0.08 (average +/− standard deviation, n = 5) times more strongly labelled that than corresponded generated IP6, in good accordance with the theoretical value of 1.33. To determine the amount of inositol phosphates present in D. discoideum, cell extracts were run together with IP6 concentration standards from 1 nM to 8 nM. By determining the densitometry value of the IP6 standard a linear regression curve was calculated. The densitometry value of the IP6 present in the cell extract was calculated from the linear regression curve to determine its molar amount. The values for IP7 and IP8 were calculated determining the densitometry of the respective bands normalised for the Toluidine staining efficiency (1.27 for IP8 and 1.15 for IP7). The cellular concentration of inositol phosphate was then calculated estimating a cell volume of 0.20 pL.
Enzymatic Reactions and Acid Idrolysis
Neutralised D. discoideum cell extract, or purified inositol phosphate, were incubated in 30 µl enzymatic reactions containing 5XBuffer (100 mM Hepes 6.8; 250 mM NaCl; 30 mM MgSO4; 5 mM DTT; 5 mM NaF), 2 µl of recombinant purified Ddp1 (10-2-ng) or Phytase (Sigma). Reactions were incubated at 37°C for 2 hr or overnight and stopped by the addition of 2 µl EDTA (100 mM). Acidic pyrophosphate hydrolysis was performed by incubating the cell extract at 90°C for 20 min prior to neutralisation. After this treatment the samples were neutralised using Potassium Carbonate as described above.
Mass Spectrometry
Inositol phosphates from D. discoideum cell extract were purified as described above and previously [28] and directly subjected to mass spectrometry [37]. Matrix-assisted laser desorption ionization (MALDI) mass spectrometry was performed on a Voyager DE-STR (Applied Biosystems, Framingham, MA), equipped with a MALDI ion source and a time-of-flight mass analyzer (MALDI-TOF). 9-aminoacridine (9-AA, Sigma-Aldrich) was used as matrix, due to its superior performance in revealing acidic analytes in negative ion mode [37]. A double deposition sample preparation procedure was adopted. Typically, 0.5 µL of matrix solution, consisting of 7 mg/mL 9-AA in a 1∶1 mixture (v/v) of acetonitrile and water was spotted on the stainless steel MALDI sample stage and air-dried. Then, 0.5 µL of the analyte solution, either pure or diluted 1∶5 (v/v) in water, was spotted on to the matrix crystals and allowed to dry. Mass spectra were acquired in delayed extraction, reflectron negative ion mode using the following settings: accelerating voltage 20,000 V, grid voltage 73%, extraction delay time 300 nsec, acquisition mass range 300–1,500 m/z. Each spectrum was the average of 400–500 individual laser shots acquired in series of 100 consecutive shots.
Sax-HPLC Analysis
D. discoideum were cultured in inositol free SIH media containing 50 µCi/ml [3H]inositol. Cell culture (6 ml) were seeded at 1×10⁵ cells/ml and grown at 22°C for 3–4 days to get a cell density of 2–3×10⁶/ml. Cells were collected and washed once with KPO4H buffer 20 mM pH 6.0. Inositol phosphates were extracted as described above and resolved by HPLC as previously described [28].
D. discoideum Development
D. discoideum were cultured in HL/5 media to a density of 2.0×10⁶ cells/ml The cells were washed twice with KPO4H buffer 20 mM pH 6.0 and resuspended at 1×10⁷ cells/ml in the same buffer Cells were then transferred in solution to 35 mm, 20 mM phosphate agar plates such that each plate contained 1×10⁷ cells. The cells were allowed to settle before aspirating the phosphate buffer. The cells were then allowed to develop in a humidity chamber at 22 C. 10 plates (equivalent to a 1×10⁸ cells at the start of the time course) were harvested from plates at 5 time points; 0 hr during vegetative state; after 1 hr starvation; upon first signs of aggregation (6–9 hr); during the “slug” stage (15 hr); and finally as mature fruiting bodies (24–25 hr). Cells pellets were frozen at −80°C. Inositol polyphosphates were extracted as described above, normalised by protein concentration and analysed by PAGE.
Supporting Information
IP5 isomerisation by acid treatment. To verify that acid treatment of IP5 can induce movement of phosphate groups around the inositol ring we incubated two nanomols of IP6 and two nanomols of I(1,3,4,5,6)P5 with 1M Percloric acid for 30 min in ice as well as for 5 and 30 minutes at 900C. IP6 is totally unaffected by these treatments. Untreated I(1,3,4,5,6)P5 (lane 2) is 95% pure as demonstrated by its migration as a major single band. Low temperature acid treatment has no effect on I(1,3,4,5,6)P5, whilst high temperature induces rapid isomerisation. Just five minute at high temperature are sufficient to substantially convert I(1,3,4,5,6)P5 into other IP5 isomeric forms. Densitometry analysis confirmed that the total IP5 Toluidine staining did not change upon acid treatment, indicating the absence of acid-induced IP5 degradation to lower inositol phosphates.
(PDF)
Differential Toluidine Blue staining capability of IP8 and IP6. To ascertain the relative efficiency of staining of IP8 and IP6 by Toluidine blue serial amounts of IP8 from 1 nmol (A) to 16 nmol (E) were incubated in the presence of 1M Percloric acid in 20 ml (sample from A′ to E′) for 30 min at 90°C. Untreated (from A to E) and acid-treated (from A′ to E′) samples were resolved on 35% PAGE. To avoid loss of material during the neutralization step, acid-treated samples were directly loaded on the gel causing a slight retardation in migration in these lanes (as shown by the different migration of Bromophenol blue (BBF) between treated and untreated samples). Once stained with Toluidine blue, the gel was analysed with ImageJ software. Densitometry analysis enabled each pair of samples (treated and untreated) to be plotted on a graph. The areas of the peaks in these graphs correspond to the relative staining of the IP6 and IP8 bands on the gel. Depicted are the analyses of samples D–D′ and E–E′. Dividing the densitometry derived values for untreated IP8 by those for the acid-generated IP6 indicates the difference in staining efficiency of the two molecules by Toluidine blue. On average IP8 is stained 1.27+/−0.08 (+/− SD) better that IP6. A virtually identical result was obtained from a second, independent experiment also run in quintuplicate. The experimentally calculated value of 1.27 is in good accordance with the theoretical value of 1.33 reflecting the presence of eight phosphates groups in IP8 rather than the six in IP6 (8/6 = 1.33).
(PDF)
Acknowledgments
We thank Antonella Riccio for suggestions and helpful comments and the members of Saiardi lab for discussion.
Funding Statement
This work was supported by the Medical Research Council funding of the Cell Biology Unit. The funders had no role in study design, data collection and analysis, decision to publish, or preparation of the manuscript.
References
- 1. Franca-Koh J, Kamimura Y, Devreotes P (2006) Navigating signaling networks: chemotaxis in Dictyostelium discoideum. Curr Opin Genet Dev 16: 333–338. [DOI] [PubMed] [Google Scholar]
- 2. Muramoto T, Cannon D, Gierlinski M, Corrigan A, Barton GJ, et al. (2012) Live imaging of nascent RNA dynamics reveals distinct types of transcriptional pulse regulation. Proc Natl Acad Sci U S A 109: 7350–7355. [DOI] [PMC free article] [PubMed] [Google Scholar]
- 3. Van Haastert PJ (1995) Transduction of the chemotactic cAMP signal across the plasma membrane of Dictyostelium cells. Experientia 51: 1144–1154. [DOI] [PubMed] [Google Scholar]
- 4. Newell PC, Europe-Finner GN, Small NV, Liu G (1988) Inositol phosphates, G-proteins and ras genes involved in chemotactic signal transduction of Dictyostelium. J Cell Sci 89 (Pt 2): 123–127. [DOI] [PubMed] [Google Scholar]
- 5. Stephens LR, Irvine RF (1990) Stepwise phosphorylation of myo-inositol leading to myo-inositol hexakisphosphate in Dictyostelium. Nature 346: 580–583. [DOI] [PubMed] [Google Scholar]
- 6. Saiardi A (2012) Cell signalling by inositol pyrophosphates. Subcell Biochem 59: 413–443. [DOI] [PubMed] [Google Scholar]
- 7. Wilson MS, Livermore TM, Saiardi A (2013) Inositol pyrophosphates: between signalling and metabolism. Biochem J 452: 369–379. [DOI] [PubMed] [Google Scholar]
- 8. Lonetti A, Szijgyarto Z, Bosch D, Loss O, Azevedo C, et al. (2011) Identification of an evolutionarily conserved family of inorganic polyphosphate endopolyphosphatases. J Biol Chem 286: 31966–31974. [DOI] [PMC free article] [PubMed] [Google Scholar]
- 9. Saiardi A (2012) How inositol pyrophosphates control cellular phosphate homeostasis? Adv Biol Regul 52: 351–359. [DOI] [PubMed] [Google Scholar]
- 10. Szijgyarto Z, Garedew A, Azevedo C, Saiardi A (2011) Influence of inositol pyrophosphates on cellular energy dynamics. Science 334: 802–805. [DOI] [PubMed] [Google Scholar]
- 11. Stephens L, Radenberg T, Thiel U, Vogel G, Khoo KH, et al. (1993) The detection, purification, structural characterization, and metabolism of diphosphoinositol pentakisphosphate(s) and bisdiphosphoinositol tetrakisphosphate(s). J Biol Chem 268: 4009–4015. [PubMed] [Google Scholar]
- 12. Menniti FS, Miller RN, Putney JW Jr, Shears SB (1993) Turnover of inositol polyphosphate pyrophosphates in pancreatoma cells. J Biol Chem 268: 3850–3856. [PubMed] [Google Scholar]
- 13. Laussmann T, Pikzack C, Thiel U, Mayr GW, Vogel G (2000) Diphospho-myo-inositol phosphates during the life cycle of Dictyostelium and Polysphondylium. Eur J Biochem 267: 2447–2451. [DOI] [PubMed] [Google Scholar]
- 14. Laussmann T, Reddy KM, Reddy KK, Falck JR, Vogel G (1997) Diphospho-myo-inositol phosphates from Dictyostelium identified as D-6-diphospho-myo-inositol pentakisphosphate and D-5,6-bisdiphospho-myo-inositol tetrakisphosphate. Biochem J 322 (Pt 1): 31–33. [DOI] [PMC free article] [PubMed] [Google Scholar]
- 15. Luo HR, Huang YE, Chen JC, Saiardi A, Iijima M, et al. (2003) Inositol pyrophosphates mediate chemotaxis in Dictyostelium via pleckstrin homology domain-PtdIns(3,4,5)P3 interactions. Cell 114: 559–572. [DOI] [PubMed] [Google Scholar]
- 16. Saiardi A, Sciambi C, McCaffery JM, Wendland B, Snyder SH (2002) Inositol pyrophosphates regulate endocytic trafficking. Proc Natl Acad Sci U S A 99: 14206–14211. [DOI] [PMC free article] [PubMed] [Google Scholar]
- 17. York JD, Odom AR, Murphy R, Ives EB, Wente SR (1999) A phospholipase C-dependent inositol polyphosphate kinase pathway required for efficient messenger RNA export. Science 285: 96–100. [DOI] [PubMed] [Google Scholar]
- 18. Drayer AL, Van der Kaay J, Mayr GW, Van Haastert PJ (1994) Role of phospholipase C in Dictyostelium: formation of inositol 1,4,5-trisphosphate and normal development in cells lacking phospholipase C activity. Embo J 13: 1601–1609. [DOI] [PMC free article] [PubMed] [Google Scholar]
- 19. Mayr GW (1988) A novel metal-dye detection system permits picomolar-range h.p.l.c. analysis of inositol polyphosphates from non-radioactively labelled cell or tissue specimens. Biochem J 254: 585–591. [DOI] [PMC free article] [PubMed] [Google Scholar]
- 20. Saiardi A, Erdjument-Bromage H, Snowman AM, Tempst P, Snyder SH (1999) Synthesis of diphosphoinositol pentakisphosphate by a newly identified family of higher inositol polyphosphate kinases. Curr Biol 9: 1323–1326. [DOI] [PubMed] [Google Scholar]
- 21. Fridy PC, Otto JC, Dollins DE, York JD (2007) Cloning and characterization of two human VIP1-like inositol hexakisphosphate and diphosphoinositol pentakisphosphate kinases. J Biol Chem 282: 30754–30762. [DOI] [PubMed] [Google Scholar]
- 22. Choi JH, Williams J, Cho J, Falck JR, Shears SB (2007) Purification, sequencing, and molecular identification of a mammalian PP-InsP5 kinase that is activated when cells are exposed to hyperosmotic stress. J Biol Chem 282: 30763–30775. [DOI] [PMC free article] [PubMed] [Google Scholar]
- 23. Draskovic P, Saiardi A, Bhandari R, Burton A, Ilc G, et al. (2008) Inositol hexakisphosphate kinase products contain diphosphate and triphosphate groups. Chem Biol 15: 274–286. [DOI] [PubMed] [Google Scholar]
- 24. Wang H, Falck JR, Hall TM, Shears SB (2011) Structural basis for an inositol pyrophosphate kinase surmounting phosphate crowding. Nat Chem Biol 8: 111–116. [DOI] [PMC free article] [PubMed] [Google Scholar]
- 25. Lin H, Fridy PC, Ribeiro AA, Choi JH, Barma DK, et al. (2009) Structural analysis and detection of biological inositol pyrophosphates reveal that the family of VIP/diphosphoinositol pentakisphosphate kinases are 1/3-kinases. J Biol Chem 284: 1863–1872. [DOI] [PMC free article] [PubMed] [Google Scholar]
- 26. Losito O, Szijgyarto Z, Resnick AC, Saiardi A (2009) Inositol pyrophosphates and their unique metabolic complexity: analysis by gel electrophoresis. PLoS One 4: e5580. [DOI] [PMC free article] [PubMed] [Google Scholar]
- 27. Kilari RS, Weaver JD, Shears SB, Safrany ST (2013) Understanding inositol pyrophosphate metabolism and function: Kinetic characterization of the DIPPs. FEBS Lett. 587: 3464–70. [DOI] [PMC free article] [PubMed] [Google Scholar]
- 28. Azevedo C, Saiardi A (2006) Extraction and analysis of soluble inositol polyphosphates from yeast. Nat Protoc 1: 2416–2422. [DOI] [PubMed] [Google Scholar]
- 29. Saiardi A, Caffrey JJ, Snyder SH, Shears SB (2000) The inositol hexakisphosphate kinase family. Catalytic flexibility and function in yeast vacuole biogenesis. J Biol Chem 275: 24686–24692. [DOI] [PubMed] [Google Scholar]
- 30. Van Dijken P, de HaasJR, Craxton A, Erneux C, Shears SB, et al. (1995) A novel, phospholipase C-independent pathway of inositol 1,4,5-trisphosphate formation in Dictyostelium and rat liver. J Biol Chem 270: 29724–29731. [DOI] [PubMed] [Google Scholar]
- 31. Stephens LR, Hawkins PT, Stanley AF, Moore T, Poyner DR, et al. (1991) myo-inositol pentakisphosphates. Structure, biological occurrence and phosphorylation to myo-inositol hexakisphosphate. Biochem J 275 (Pt 2): 485–499. [DOI] [PMC free article] [PubMed] [Google Scholar]
- 32. Dove SK, Michell RH (2009) Inositol lipid-dependent functions in Saccharomyces cerevisiae: analysis of phosphatidylinositol phosphates. Methods Mol Biol 462: 59–74. [DOI] [PubMed] [Google Scholar]
- 33. Letcher AJ, Schell MJ, Irvine RF (2008) Do mammals make all their own inositol hexakisphosphate? Biochem J 416: 263–270. [DOI] [PMC free article] [PubMed] [Google Scholar]
- 34. McConnell FM, Stephens LR, Shears SB (1991) Multiple isomers of inositol pentakisphosphate in Epstein-Barr-virus- transformed (T5–1) B-lymphocytes. Identification of inositol 1,3,4,5,6-pentakisphosphate, D-inositol 1,2,4,5,6-pentakisphosphate and L-inositol 1,2,4,5,6-pentakisphosphate. Biochem J 280 (Pt 2): 323–329. [DOI] [PMC free article] [PubMed] [Google Scholar]
- 35. Irvine RF, Schell MJ (2001) Back in the water: the return of the inositol phosphates. Nat Rev Mol Cell Biol 2: 327–338. [DOI] [PubMed] [Google Scholar]
- 36. Loss O, Wu CT, Riccio A, Saiardi A (2013) Modulation of inositol polyphosphate levels regulates neuronal differentiation. Mol Biol Cell 24: 2981–2989. [DOI] [PMC free article] [PubMed] [Google Scholar]
- 37. Guo Z, He L (2007) A binary matrix for background suppression in MALDI-MS of small molecules. Anal Bioanal Chem 387: 1939–1944. [DOI] [PubMed] [Google Scholar]
Associated Data
This section collects any data citations, data availability statements, or supplementary materials included in this article.
Supplementary Materials
IP5 isomerisation by acid treatment. To verify that acid treatment of IP5 can induce movement of phosphate groups around the inositol ring we incubated two nanomols of IP6 and two nanomols of I(1,3,4,5,6)P5 with 1M Percloric acid for 30 min in ice as well as for 5 and 30 minutes at 900C. IP6 is totally unaffected by these treatments. Untreated I(1,3,4,5,6)P5 (lane 2) is 95% pure as demonstrated by its migration as a major single band. Low temperature acid treatment has no effect on I(1,3,4,5,6)P5, whilst high temperature induces rapid isomerisation. Just five minute at high temperature are sufficient to substantially convert I(1,3,4,5,6)P5 into other IP5 isomeric forms. Densitometry analysis confirmed that the total IP5 Toluidine staining did not change upon acid treatment, indicating the absence of acid-induced IP5 degradation to lower inositol phosphates.
(PDF)
Differential Toluidine Blue staining capability of IP8 and IP6. To ascertain the relative efficiency of staining of IP8 and IP6 by Toluidine blue serial amounts of IP8 from 1 nmol (A) to 16 nmol (E) were incubated in the presence of 1M Percloric acid in 20 ml (sample from A′ to E′) for 30 min at 90°C. Untreated (from A to E) and acid-treated (from A′ to E′) samples were resolved on 35% PAGE. To avoid loss of material during the neutralization step, acid-treated samples were directly loaded on the gel causing a slight retardation in migration in these lanes (as shown by the different migration of Bromophenol blue (BBF) between treated and untreated samples). Once stained with Toluidine blue, the gel was analysed with ImageJ software. Densitometry analysis enabled each pair of samples (treated and untreated) to be plotted on a graph. The areas of the peaks in these graphs correspond to the relative staining of the IP6 and IP8 bands on the gel. Depicted are the analyses of samples D–D′ and E–E′. Dividing the densitometry derived values for untreated IP8 by those for the acid-generated IP6 indicates the difference in staining efficiency of the two molecules by Toluidine blue. On average IP8 is stained 1.27+/−0.08 (+/− SD) better that IP6. A virtually identical result was obtained from a second, independent experiment also run in quintuplicate. The experimentally calculated value of 1.27 is in good accordance with the theoretical value of 1.33 reflecting the presence of eight phosphates groups in IP8 rather than the six in IP6 (8/6 = 1.33).
(PDF)