

Abstract
The devastating effects of the still incurable Alzheimer's disease (AD) project an ever increasing shadow of burden on the health care system and society in general. In this ominous context, amyloid (Aβ) imaging is considered by many of utmost importance for progress towards earlier AD diagnosis and for potential development of effective therapeutic interventions. Amyloid imaging positron emission tomography procedures offer the opportunity for accurate mapping and quantification of amyloid-Aβ neuroaggregate deposition in the living brain of AD patients. This review analyzes the perceived value of current Aβ imaging probes and their clinical utilization and, based on amyloid imaging results, offers a hypothesis on the effects of amyloid deposition on the biology of AD and its progression. It also analyzes lingering questions permeating the field of amyloid imaging on the apparent contradictions between imaging results and known neuropathology brain regional deposition of Aβ aggregates. As a result, the review also discusses literature evidence as to whether brain Aβ deposition is truly visualized and measured with these amyloid imaging agents, which would have significant implications in the understanding of the biological AD cascade and in the monitoring of therapeutic interventions with these surrogate Aβ markers.
Keywords: Aβ, Alzheimer's disease, Amyloid imaging, Florbetapir, Neuropathological correlations, Neuropathological diagnostic criteria, Pittsburgh Compound B
Usefulness and limitations of amyloid PET imaging (C. R. Jack Jr.)
The first positron emission tomography (PET) ligand specific for amyloid (Aβ) was 11C Pittsburgh Compound B (PIB), which was developed by Chet Mathis and William Klunk [58] at the University of Pittsburgh. PIB was rapidly incorporated into research programs around the world including many single-site programs as well as large multi-site flagship studies such as the Australian Imaging Biomarkers and Lifestyle (AIBL) [96] and the Alzheimer's Disease Neuroimaging Initiative (ADNI) [49].
The overwhelmingly positive experience with 11C PIB provided impetus for commercial development of 18F amyloid labeling compounds. The half-life of 11C is approximately 20 min which makes this impractical for distribution to imaging centers from a centrally located production site. 11C ligands therefore require an on-site cyclotron for ligand production thus limiting widespread clinical use of PIB. In contrast, the half-life of 18F is roughly 2 h. This renders central production and distribution feasible and greatly heightens commercial interest in 18F amyloid ligands. Accordingly, several 18F compounds are now in various stages of the regulatory approval process including Amyvid™ (18F Florbetapir, Avid/Lilly), Flutametamol (GE Healthcare), 18F Florbetaben (Piramal) and AZD-4694 (Navidea). Florbetapir is currently the only amyloid PET ligand to have received approval for use by the FDA [27]. The specified indication for use was “to estimate beta-amyloid neuritic plaque density in adult patients with cognitive impairment who are being evaluated for Alzheimer's Disease and other causes of cognitive decline. A negative Amyvid scan indicates sparse to no neuritic plaques and is inconsistent with a neuropathological diagnosis of Alzheimer's Disease at the time of image acquisition; a negative scan result reduces the likelihood that a patient's cognitive impairment is due to Alzheimer's Disease. A positive Amyvid scan indicates moderate to frequent amyloid neuritic plaques [27].” The FDA approval also included the following language on limitations of use: “A positive Amyvid scan does not establish a diagnosis of Alzheimer's Disease, or other cognitive disorder” [27].
Relevant research studies can be considered in several categories: autopsy correlations, measurement accuracy and precision, cross-sectional clinical correlation, prediction of clinical outcomes, longitudinal studies, and correlations with other AD biomarkers.
Autopsy correlation
Imaging-autopsy correlation studies have documented a high correlation between PIB retention and beta-amyloid (Aβ pathology in autopsy specimens as assessed by immune assay or silver staining [5, 37, 64, 79, 92, 103]. Autopsy correlations with 18F amyloid ligands have demonstrated similar amyloid plaque binding properties as PIB albeit with slightly less range separating normal from abnormal [16, 31]. There were some early suggestions that PIB bound to cored and neuritic plaques and not to diffuse plaques. However, terms like diffuse, dense, cored, and amorphous are not well defined and are not specific. The substrate for all currently known Aβ amyloid tracers is the tertiary beta-pleated sheet conformation of fibrillar amyloid [37]. Plaques with more fibrillar amyloid will have greater affinity for Aβ ligands than plaques with less. Vascular amyloid, which tends to be fibrillar, also binds PIB [6, 11, 37, 51, 66, 114]. Aβ amyloid ligands are specific for Aβ amyloid; they do not bind to neurofibrillary tangles or other aggregated protein deposits [37]. PIB studies have been negative in pathologically confirmed prion disease [114], pure alpha-synucleinopathy [11], and pure tauopathy [22].
Another source of confirmatory data is correlation with the other major biomarker of Aβ—cerebrospinal fluid (CSF) Aβ42. PIB binding correlates closely with low CSF Aβ42 in every publication in which this association has been investigated [28, 33, 48, 108, 116].
Measurement accuracy and precision
Different methods have been used for quantitation of amyloid ligand binding. Greatest accuracy and precision may be achieved by long (90 min) dynamic acquisition methods with Logan DVR [67] or reference tissue models [109]. However, 90-min acquisition times or arterial sampling for a reference function greatly diminishes general applicability of the technique. A more widely used approach is ligand injection followed 40–50 min later by a roughly 20-min imaging period when the tracer has reached steady state equilibrium. Test/retest precision estimates in the 5–7 % range have been published using this late uptake imaging approach [67, 73, 85], and these have proven to be good substitutes for the longer dynamic methods. Precision over serial PIB imaging sessions within individual subjects demonstrates a measurement error (analogous to a coefficient of variation) for late uptake methods of around 3 %—very reasonable for longitudinal measurements [47].
A point of significant interest in the field has been defining what constitutes an abnormal amyloid PET study. Scans can be evaluated visually, but most research studies employ a quantitative approach in which tracer uptake in selected cortical regions of interest is measured and then scaled to a reference value. While the reference function can be an arterial sample, most often the reference function is the measured uptake in the cerebellum or pons—forming standardized uptake value ratio (SUVR) units. This is typically done in a fully automated way by spatially registering an anatomic template to the individual amyloid PET scan (or vice versa) and extracting intensity values (representing tracer uptake) from selected regions of interest. Many in the field have coalesced around a SUVR value of 1.5 with PIB PET as the threshold for abnormality in the context of defining values typically associated with the diagnosis of AD dementia [97]. Lower thresholds are often used in the context of defining the earliest quantitative evidence of amyloid deposition in cognitively normal individuals. However, SUVR values will vary as function of the PET ligand and the image analysis method used. To address this problem quantifying amyloid PET on a centiloid scale has been suggested as a common standard in which to report quantitative amyloid PET values derived from different ligands and different processing methods. The centiloid concept has been adopted by an international work group [60]. To create a centiloid scale, amyloid PET studies are performed in a group of typical AD patients to define the upper/abnormal end of the scale (centiloid value = 100), and in a group of young normal individuals to define the low/normal end of the scale (centiloid value = 0). Amyloid SUVR values are scaled linearly across this range anchored by the average values in these two groups. Thus, centiloid scaling is analogous to the scaling of all biomarkers on a common scale from minimum to maximum proposed in [43].
Clinical correlations
Roughly 30 % of cognitively normal [1, 26, 35, 40, 41, 49, 56, 68, 74, 90, 91, 97, 98, 101, 113, 117] and 60 % of mild cognitive impairment (MCI) patients are amyloid PET positive [32, 40, 41, 49, 61, 68, 83, 117]. These findings are consistent with autopsy studies which demonstrate similar percentages of cognitively normal elderly [10, 61, 62, 85, 86, 87] and MCI who meet pathological criteria for AD [50]. Roughly 85–90 % of clinically diagnosed AD dementia subjects are amyloid positive [26, 35, 40, 41, 49, 56, 68, 97, 98, 101, 113, 117]. It is widely assumed that amyloid-negative patients diagnosed as AD dementia have been given an etiologically incorrect clinical diagnosis [88, 89]. Also of note, the most important genetic risk factor for sporadic AD is the ε4 allele of the APOE gene and PIB binding correlates strongly with the presence of APOE ε4 in a dose-dependent manner [23, 79, 111].
Cognitively normal elderly [13, 15, 78] and MCI subjects [15, 32, 41, 42, 49, 61, 83, 117] with positive amyloid PET studies decline cognitively faster than those with negative studies. Amyloid-positive cognitively normal, MCI and AD subjects are more likely to have abnormal neurodegenerative biomarkers [29, 49] than amyloid-negative subjects. Rates of brain atrophy are more rapid in amyloid positive than negative cognitively normal and MCI subjects [14, 63].
As initially predicted hypothetically [43], several studies have now demonstrated empirically that amyloid PET tracer accumulation reaches a plateau [4, 30, 45, 47, 112, 115]. The plateauing of amyloid deposition is seen in both sporadic [45, 47, 112, 115] and autosomal dominant AD [4, 30]. The estimated time from detectable levels of amyloid in vivo to levels at which amyloid accumulation plateaus is roughly 15–20 years. In studies that have measured rates of change of amyloid as a function of baseline SUVR [47, 112, 115], rates of amyloid PET tracer accumulation increase initially, reach a peak, and then decline to near zero—i.e., rates follow an inverted u-shape as a function of baseline SUVR. This results in a sigmoidalshaped plot of amyloid burden as a function of time. If one assumes that SUVR is a reasonable measure of the distance traveled along the amyloid pathway then the greater the SUVR, the closer a normally functioning person is to clinical symptoms. As would be expected then on average individuals with amyloid decline cognitively faster than those without. However, since the rate of change in amyloid accumulation declines at higher SUVRs, the rate of change in amyloid is not linearly related to the rate of cognitive decline.
Temporal ordering of AD biomarkers
Some of the data above may seem counterintuitive given that amyloid PET directly measures one of the two hallmark proteinopathies that characterize AD. The facts that 30 % of elderly individuals who are cognitively normal have positive amyloid PET studies and that rates of amyloid accumulation do not correlate well with the rate of change of clinical symptoms indicate a lack of direct correlation between amyloid deposition and cognitive impairment. This is explained by the concept that the disease is characterized by an ordering of pathophysiological events. Aβ dysregulation is an upstream process while neurodegeneration is a downstream process [34, 39]. This pathophysiology is mirrored by in vivo AD biomarkers which exhibit a time-dependent but overlapping temporal evolution [41, 43, 46, 77, 84]. The five most well-established biomarkers of AD can be divided into two major categories: the two biomarkers of brain Aβ deposition are amyloid PET and CSF Aβ42. The second category is biomarkers of neurodegeneration where neurodegeneration is defined as progressive loss of neurons or their processes with a corresponding progressive impairment in neuronal function. The neurodegenerative biomarkers are increased levels of CSF total (t-tau) and phosphorylated (p-tau) tau [100], hypometabolism on FDG PET [20, 49] and atrophy on structural MRI [110]. FDG PET and MRI follow a modality specific topology that is characteristic of AD.
The model of ordered biomarker evolution (Fig. 1) posits that amyloid biomarkers become abnormal first, beginning while subjects are cognitively normal [43, 46]. CSF tau becomes abnormal next, followed by biomarkers of tau-related neurodegeneration (FDG PET and atrophy on structural MRI) [43, 46]. Cognitive symptoms are directly related to neurodegeneration [99] and closely follow progression of neurodegenerative biomarkers. This model explains the lack of direct correlation between clinical symptoms and amyloid deposition and why amyloid load reaches a plateau while clinical symptoms are still evolving [43, 46]. Although perhaps confusing, we do not mean to imply that at a histological level, Aβ amyloid plaques precede neurofibrillary tangles in sporadic AD. In fact the opposite seems to be true in late onset AD. Entorhinal and hippocampal neurofibrillary tangles are commonly found at autopsy in the absence of amyloid plaques in middle aged and older cognitively normal subjects [10, 86]. Our model (Fig. 1) reflects the proposal that tauopathy and Abeta arise independently in sporadic AD [86]. But, that Aβ pathophysiology transforms and accelerates an antecedent subcortical tauopathy leading to neocortical spread of neurofibrillary tangles as was proposed by Price and Morris [80, 86]. Acceleration of the initial slowly developing subcortical tauopathy often occurs after Aβ biomarkers have become abnormal.
Fig. 1.

Model of dynamic biomarkers of the Alzheimer's disease pathological cascade. The severity of biomarker abnormality is indicated on the y axis and time on the x axis. Neurodegeneration is measured by FDG PET and structural MRI, which are drawn concordantly (dark blue). By definition, all curves converge at the top right-hand corner of the plot, the point of maximum abnormality. Cognitive impairment is illustrated as a zone (light green-filled area) with low- and high-risk borders. People who are at high risk of cognitive impairment due to Alzheimer's disease pathophysiology are shown with a cognitive impairment curve that is shifted to the left. By contrast, the cognitive impairment curve is shifted to the right in people with a protective genetic profile, high cognitive reserve, and the absence of comorbid pathological changes in the brain, showing that two patients with the same biomarker profile can have different cognitive outcomes. Aβ beta-amyloid, FDG fluorodeoxyglucose, MCI mild cognitive impairment. Reprinted from [46]
In addition to a temporal dissociation between clinical symptoms and amyloid there is a spatial dissociation between tau-related neurodegeneration and amyloid deposition (Fig. 2). Tau pathology begins in the medial temporal lobe and spreads outward to heteromodal association cortical areas [9]. In contrast, amyloid deposition begins in neocortical association areas and typically does not greatly involve the hippocampus.
Fig. 2.
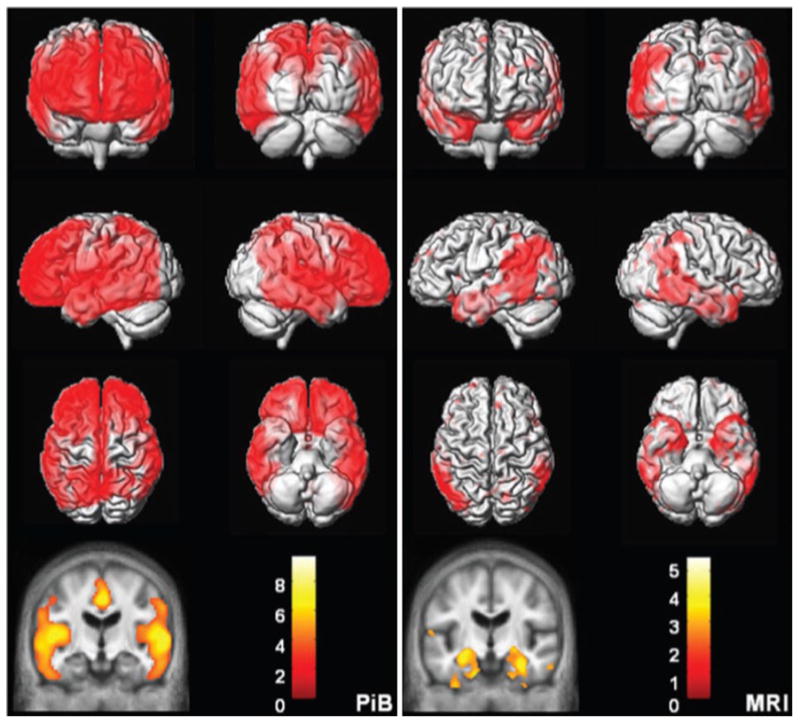
Topographic differences between amyloid and neurodegeneration. Alzheimer's disease versus cognitively normal voxel mapping. PIB (left) statistic parametric mapping (SPM) of PIB retention ratio. MRI (right) voxel-based morphometry (VBM) of MRI grey matter density. Plaque deposition but not grey matter loss is seen in the prefrontal cortex while grey matter loss but not plaque deposition is seen in the medial and basal temporal lobes. Reprinted from [40]
The data above emphasize that it is important to remember that amyloid PET is a measure of Aβ amyloid deposition, not a stand-alone diagnostic test for AD dementia. This point has been made from the very beginning of amyloid imaging [58] and is included in the FDA use guidance for Amyvid™, but is (unfortunately) often over looked by critics of amyloid imaging who point out the lack of direct correlation between clinical symptoms and the presence of amyloid on PET imaging—particularly in positive cognitively normal subjects.
Use of amyloid PET in clinical diagnosis
The first widely accepted diagnostic criteria for Alzheimer's disease were formulated in 1984 [70]. In the McKhann criteria [71] AD was conceived as a clinical–pathological entity. Symptoms of AD dementia were assumed to accompany AD pathology and the absence of symptoms was assumed to accompany no AD pathology. AD was a clinical diagnosis, made after other potential causes of symptoms were excluded. The role of imaging, initially CT and then MRI, was to exclude structural abnormalities that could cause cognitive symptoms (like stroke or subdural hemorrhage). The McKhann criteria [71] stood for nearly a quarter of century until evolution in thinking about the disease led to updated criteria published in the past few years.
In 2007 (later updated in 2010), Dubois et al. [24, 25] published revised criteria for AD that for the first time incorporated AD biomarkers as supportive criteria. In 2011, three work groups were commissioned by the National Institute of Aging and the Alzheimer's Association (NIA-AA) to create criteria for the three recognized phases of AD–AD dementia [72], MCI [2], and new research criteria for preclinical AD [104]. Biomarkers were included in the criteria for all three phases of the disease [44]. In the clinically symptomatic phases (MCI and AD dementia) the role of biomarkers was to establish the etiology of the observed impairment, i.e., improve the specificity of clinical diagnosis. An amyloid PET study may alter clinical management by changing medications, changing additional diagnostic tests which might be requested by a physician, and enabling patients and families to make difficult personal decisions with greater certainly about the prognosis.
Although some in the field believe that biomarkers of Aβ (amyloid PET and CSF Aβ42) should be placed above the more non-specific biomarkers (esp. MRI atrophy and FDG hypometabolism), the NIA-AA criteria do not impose any hierarchal ranking of biomarkers [44]. The probability of dementia of MCI due to AD pathophysiology is increased if one class of AD biomarker is positive. And if both classes of biomarkers are positive, the probability that AD pathophysiology is the etiology of the impairment is further increased to the highest level. The criteria do not address the situation where biomarker test results conflict between the amyloid and neurodegenerative categories, nor do the criteria address the situation where conflicting results occur within a class (e.g., a positive amyloid PET and a negative CSF Aβ42 results).
In preclinical AD, biomarkers are central since by definition, subjects do not have overt clinical symptoms. Preclinical AD was divided into three stages: stage 1, amyloid alone; stage 2, amyloid plus neurodegeneration; stage 3, amyloid plus neurodegeneration plus evidence of subtle cognitive impairment of insufficient magnitude to qualify for a diagnosis of MCI [104]. This staging scheme was based on the model of the temporal evolution of biomarkers outlined above [43], where amyloid biomarkers become abnormal first, then biomarkers of neurodegeneration, and then clinical symptoms.
Use of amyloid PET in clinical trials
Amyloid PET has assumed a key role in modern clinical trials of anti-amyloid interventions. Amyloid PET is used in two ways, as entry criteria and as outcome measure to assess target engagement. With experience the value of amyloid imaging at screening has become clear. Roughly 9 % of clinically diagnosed AD dementia subjects enrolled in recent trials who are APOE ε4 carriers have been amyloid negative, while this number has been a surprising 33 % in APOEe4 non-carriers. In other words, roughly 1/3 of clinically diagnosed APOE ε4 non-carrier AD dementia subjects enrolled in anti-amyloid trials have not had the disease that was targeted by the therapeutic intervention. Therapeutic reduction in amyloid load over time has been demonstrated [94]—thus illustrating the ability of amyloid imaging to serve as an indicator of target engagement.
Summary
In summary, amyloid PET imaging is sensitive and specific for fibrillar Aβ deposits and is feasible in both research and clinical settings. Longitudinal change in amyloid plaque load over time can be measured using standard clinically acceptable PET methods. Amyloid PET has become an indispensable component of clinical AD research in all phases of the disease. Amyloid PET will be essential for clinical trials of anti-amyloid interventions, both as an inclusion criterion and as an indicator of therapeutic target engagement.
Neuropathological correlates of amyloid-specific PET imaging: open questions (Jorge R. Barrio, Vladimir Kepe)
The use of biomarkers for assessing evolution of Alzheimer's disease (AD), its diagnosis and monitoring of therapeutic approaches has significantly improved our understanding of the disease. The hypothetical model of Jack et al. [46] describing the sequential emergence and utilization of biomarkers with AD progression is a welcome addition to the interpretation of the disease cascade biology. The updated model—using in great measure data obtained under ADNI—identifies CSF Aβ42 and brain Aβ deposition, as determined with amyloid PET, as very early events when the disease does not yet have clinical manifestation. With disease progression these events are sequentially followed by CSF tau increases, brain metabolic alterations as measured with FDG PET and structural changes (e.g., atrophy) by MRI. Progressive cognitive impairment would appear driven by synaptic dysfunction, neuronal death and disconnection of neuronal circuits.
That brain Aβ (and tau) deposition is part of the initial events of the evolutive progression of AD is of course not surprising. The Consortium to Establish a Registry for Alzheimer's Disease (CERAD) has recently revised neuropathological criteria for progression and diagnosis of AD (National Institutes of Aging-Alzheimer's Association, NIA-AA), that involve the regional localization of tau and Aβ neuroaggregates [36, 76] and requires determination of an “ABC” score of AD neuropathological change. These changes include (A)histopathologic assessments of β-amyloidosis in the medial temporal lobe structures, as described by Thal et al. [106, 107]; (B)staging of neurofibrillary tangles (Braak tau pathology stages) [9]; and (C)scoring of neuritic plaques (based on semi-quantitative determination of senile plaque densities (sparse, moderate, frequent) in at least five neocortical regions, which should always include the middle frontal gyrus, superior and middle temporal gyri, inferior parietal lobule, hippocampus, entorhinal cortex, and amygdala) [75].
Deposition of Aβ-protein aggregates and development of tau neurofibrillary changes are thus important histopathological hallmarks of AD, together with neuronal loss and gliosis. Brain β-amyloidosis in particular have been characterized as progressive and following a hierarchical order of regional brain deposition, with substantial changes in the anatomical distribution pattern of different types of Aβ-deposits observed in the course of AD [9, 106, 107]. In the process of brain β-amyloidosis, a distinct developmental sequence is represented in four phases in which the medial temporal lobe inexorably becomes involved early, highlighting the importance of the entorhino-hippocampal pathways for the expansion of β-amyloidosis. In this sequence, from Thal medial temporal lobe amyloidosis Phase 1 to Phase 4, diffuse non-neuritic plaques are deposited first in the basal temporal neocortex, extending next to the internal entorhinal layers and in CA1 followed by emergence of Aβ-neuritic plaques in the basal temporal neocortex and the entorhinal region, and, later, in hippocampal regions including CA4. Once Aβ-deposition is initiated in the neocortical medial temporal lobe, it expands anterogradely into regions that receive neuronal projections from regions already exhibiting Aβ deposits. In Thal Aβ Phase 2, medial temporal lobe structures already present widespread accumulation of Aβ deposits while Aβ deposition in neocortex remains limited to a number of isolated areas. Figure 3 displays this sequence of events in medial temporal lobe in four phases, as described by Thal et al. [106, 107] and adopted by NIA-AA.
Fig. 3.
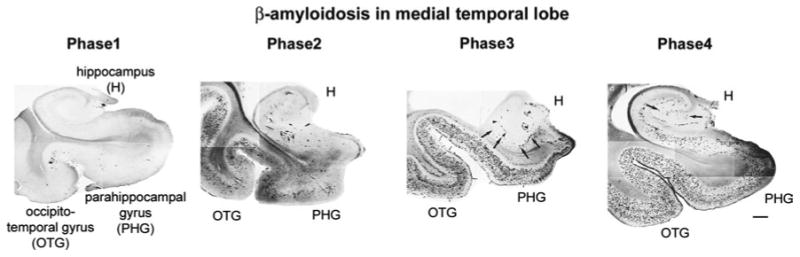
Phases of Aβ deposition in medial temporal lobe structures during evolution of Alzheimer's disease. Phases as defined by Thal et al. [106, 107] and adopted by NIA-AA. OTG occipitotemporal gyrus, PHG parahippocampal gyrus, H hippocampus
In Jack's model of disease progression, it appears clear that the direct CSF Aβ measurement has gained significant favor as one of the first indicators of abnormalities for possible AD, in part possibly because of its reliability and low cost. Amyloid PET, however, has the benefit of avoiding the spinal tap, which may not be acceptable or recommended for some patients. Importantly, it also provides information about regional Aβ deposition load for all brain regions not available from CSF Aβ42 levels. Several investigators have also reported that the expected drop in CSF Aβ does not always foreshadow brain Aβ deposition based on amyloid PET determinations in subjects with normal cognition, MCI, or AD, based on ADNI data. There appears to be support for the idea that CSF and amyloid PET may measure different forms (yet undetermined) of the protein, so results of the two methods are not necessarily interchangeable (Amyloid Imaging meeting, Miami, 2013; on-line Book of Abstracts available at http://www.worldeventsforum.com/hai/xhtml-css/past-programs/HAI_2013_ConferenceBook%20A.pdf).
It is always possible that the two methods (CSF Aβ and amyloid PET) measure different forms of the protein, but there are other significant inconsistencies in the interpretation of amyloid PET outcomes. This is particularly evident when imaging results are compared with Aβ aggregate brain distributions observed in independent neuropathological determinations at autopsy [9, 106, 107]. Obviously, the visualization, mapping and quantification of these deposits require a given PET imaging probe for Aβ neuroaggregates to bind with high affinity to the protein target (Aβ aggregates) in the tissue and be sensitive and specific for these aggregates [74]. Similar to other tissue targets (e.g., neuroreceptors) it would be expected that these amyloid imaging agents would demonstrate the progressive presence of brain β-amyloidosis in the hierarchical order of brain regions with increase in deposition load expected from NIA-AA criteria [36, 76, 106, 107]. Therefore, if PET signals provide faithful visualization and quantification of Aβ deposits in the brain, these signals should match the spatial distribution and densities of Aβ neuropathology obtained post mortem.
Cerebral amyloid PET imaging in the medial temporal lobe
The first observation that can be made about amyloid-specific PET imaging probes, either from the 6-hydroxybenzothiazole (e.g., 11C PIB, fluoroPIB or flutemetamol) or transstilbene (e.g., florbetapir) structural families, is that they consistently produce images with an essentially immutable cortical pattern, that is their relative brain cortical profile suffers little change with AD progression. A typical positive amyloid PET in AD includes high signal in most cortical areas, except in the isocortical medial temporal lobe. Are these results consistent with neuropathological data in AD included in the NIA-AA criteria?
In Thal et al. Phase 4, typical of AD (Fig. 3) and corresponding to Braak amyloid Stage C, high densities of Aβ plaques and diffuse Aβ are present in the inferior temporal gyrus (Brodmann area 20) and occipitotemporal gyrus (neocortical medial temporal lobe, Brodmann areas 35/36) which has been shown to exceed levels present in the frontal lobe or precuneus (Brodmann area 7) [3, 19]. This imaging profile of brain localization using amyloid PET agents, with low accumulation in the inferior and medial regions of the temporal lobe in comparison with the frontal lobe, parietal lobe, precuneus, and lateral temporal lobe has been widely reported in the literature but has surprisingly received only limited scrutiny. This lack of sensitivity of these amyloid PET agents for Aβ accumulation in the medial temporal lobe is significant since Aβ deposition in the medial temporal lobe is one of the earliest events in AD and one of the key in the neuropathological diagnostic criteria for the disease [106, 107]. These in vivo 11C-PIB results are in stark contrast with in vitro determinations showing levels of hippocampal 3H-PIB binding to be higher than those of other brain cortices known to have high 11C-PIB PET signal retention [82].
There are certainly topographical differences in the distribution of Aβ within the medial temporal lobe, with lower densities in limbic areas such as the hippocampus and subiculum, where tau pathology is prevalent [3, 21], but prominent medial temporal lobe areas (such as the occipitotemporal gyrus and the parahippocampal gyrus) have Aβ plaque densities (both diffuse and neuritic) similar to those observed in the lateral temporal lobe and other cortical areas (Fig. 4) [86, 107].
Fig. 4.
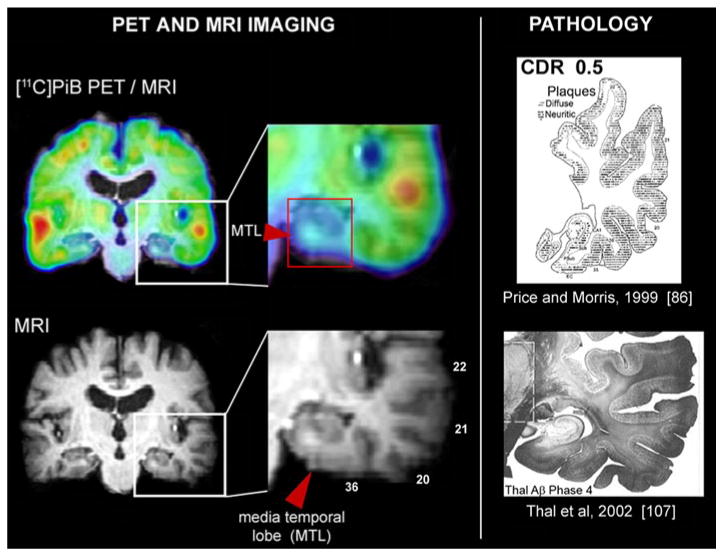
Lack of binding in medial temporal lobe structures in 11C-PIB PET scan of an AD patient. Comparison of 11C-PIB PET scan (upper left) and MRI scan (lower left) reveals that medial temporal lobe 11C-PIB signal is significantly lower than in other cortical structures. Detailed view of temporal lobe (middle column) clearly shows that 11C-PIB signal is low not only in hippocampus but also in hippocampal gyrus and occipitotemporal gyrus, both areas of medial temporal lobe that have Aβ levels comparable to the levels observed in other parts of temporal lobe as shown on examples from AD pathology studies. Examples from Price and Morris [86] (upper right) and Thal et al. [107] (lower right). Distribution volume ratio (DVR) 11 C-PIB image in reference to cerebellum is shown. Warmer colors represent higher DVR values. MTL medial temporal lobe
Cortical atrophy may be a contributing factor for the low imaging signals but partial volume effects may lead to underestimation of PET signals in all cortical areas, not only in the medial temporal lobe, particularly in severe dementia. This observation is present at all levels of cognitive impairment, however. For this reason, and also based on results with other imaging agents, it cannot be reasonably expected that binding of these imaging probes would only be affected by partial volume effect in the medial temporal lobe as reported earlier [102].
Does cerebral amyloid PET imaging reflect amyloid burden?
Another related element resulting from amyloid PET data that is in questionable agreement with known and reported post mortem data refers to the neuropathological accumulation in earlier stages of dementia (Fig. 3; e.g., Thal et al., Phase 2). In these subjects cortical accumulation of amyloid imaging agents has been reported to have a bi-modal character that resembles the typical profile observed in either AD patients (“positive scan”) or controls (“negative scan”) [74]. It is understood that this may be overly simplistic considering the heterogeneity of MCI groups, yet the known neuropathological Aβ profiles that are defined by the NIA/AA diagnosis criteria (Fig. 3) [9, 75, 76, 106, 107] demonstrate that in Thal Aβ phase 2, Aβ deposition in these subjects is largely confined to the medial temporal lobe and a limited number of neocortical brain regions, with several cortical brain regions still free of Aβ [106, 107].
This uncertain representation of Aβ neuropathology by amyloid PET agents begs another question: Why would approximately 30 % of cognitively normal control subjects, based on amyloid PET, have been reported to have an Aβ load comparable with that found in AD patients? Is there strong independent support for this critical finding? Even though Aβ may be unquestionably present in the brain of normal controls based on neuropathological determinations, the literature does not display autopsy findings describing Aβ brain deposition in such a large number of control subjects at levels reportedly found in AD, that is engulfing the whole brain. For example, in a recent review of large clinic-pathological correlation studies by Nelson et al. [81] the authors concluded that “it is extraordinarily rare for a case with widespread, dense AD-type neocortical lesions to lack documented ante mortem cognitive decline”. Confirmatory of these results in a context of a chronic traumatic encephalopathy study involving 85 brain donors, McKee et al. [70] recently analyzed the brains of 18 cognitively intact subjects (mean age 69.7 ± 8.1 years). Of them, three control subjects were reported to have only ‘small amounts of Aβ deposition as diffuse, neuritic plaques or vascular amyloid’. The authors found no evidence of generalized amyloidosis in any of these control subjects.
Studies describing ante mortem negative amyloid PET results in clinically diagnosed AD subjects with positive post mortem evidence of pathology deposition can also be found in the literature [12, 38, 93]. However, in the same detailed and comprehensive review, Nelson et al. [81] describe that “with some notable exceptions (e.g., elderly schizophrenia patients, substance abusers, systemic disease), no significant subset of patients with severe age-associated cognitive decline exists that lacks any pathologic substrate when modern methods (i.e., immunohistochemistry) are used in the neuropathologic examination.” Since some of these contradictory studies involve subjects with specific mutations (e.g., E693G substitution in the APP gene, “Arctic mutation” or APParc; “Osaka mutation” E693), these negative imaging results have been attributed in multiple publications to different “conformations” of Aβ deposits affecting the binding patterns of the amyloid imaging probes, but structural binding evidence in support of this assertion is lacking [93]. Similar inconsistent imaging results have been earlier reported with amyloid imaging in transgenic mice with large cortical amyloid deposition [59].
The Table summarizes reports in which amyloid PET probes have been correlated with neuropathology at biopsy [64, 65, 95, 118, 119] or autopsy in AD [12, 16, 17, 38, 54], dementia with Lewy bodies [38, 55], Parkinson's disease with dementia [11] and sporadic Creutzfeldt-Jakob disease [114], with variable interpretations as to the Aβ tertiary form purportedly responsible for the imaging PET probe signal. It is most often claimed that amyloid PET agents bind strongly to fibrillar Aβ, but in a recent correlative study, agreement of amyloid PET results with Aβ neuropathology (CERAD neuritic plaques) was reported as limited in demented older adults [103]. Most specifically, it was described that in “individuals with either intermediate or localized elevation of Aβ levels in vivo, variable agreement with diagnostic neuropathologic assessment was observed, even after applying several thresholds for positive scans (PiB +) and accounting for cerebral amyloid angiopathy (CAA)” [103]. Other studies also dispute the invoked specificity of amyloid imaging for fibrillar amyloid (Table 1). These reports claim that imaging results are in agreement with both fibrillar and diffuse Aβ plaques [54] or mainly with diffuse plaques, as reported with a Lewy body dementia patient [51]. Moreover, the in vivo affinity of amyloid PET probes for the Aβ42 and Aβ40 isoforms appears also controversial when Aβ42- and Aβ40-immunoreactive plaques were found to correlate with PIB binding in amyloid-positive scans but not in amyloid-negative scans [38].
Table 1. Amyloid PET studies reporting correlations of imaging results with post mortem autopsy or biopsy results.
| Molecular imaging probe | Disease | Subjects | CERAD | Braak tau | Thal MTL stages | Abeta IHC in other areas | Reference | |||||
|---|---|---|---|---|---|---|---|---|---|---|---|---|
|
| ||||||||||||
| F | T | P | HIPP/EC | Amygdala | Other | |||||||
| Autopsy | ||||||||||||
| Florbetapir | AD, other dementias, MCI | 59 | + | + | + | ND | ND | ND | + | ND | F, T, P, precuneus, ACG, PCG | [17] |
| Florbetapir | AD | 35 | + | + | + | ND | ND | ACG, PCG, precuneus, cerebellum | + | ND | F, T, P, ACG, PCG, precuneus, cerebellum | [16] |
| PIB | AD | 27 | + | + | + | + | + | ND | + | + | 25 areas | [37] |
| PIB | AD | 1 | + | + | + | + | ND | Striatum, thalamus, cerebellum | + | ND | F, T, P, Occ, HIPP, striatum, thalamus, cerebellum | [54] |
| PIB | AD, MCI, controls | 6 | + | + | + | EC only | + | ND | + | + | HIPP, OFC, ACG, PCG, precuneus, cerebellum | [21] |
| PIB | AD, controls | 6 | + | + | + | EC only | + | Visual cortex | + | ND | F, T, P, EC, amygdala, visual cortex | [103] |
| PIB | DLB | 1 | + | + | + | + | + | Basal ganglia, thalamus, midbrain | + | + | 17 areas | [55] |
| PIB | DLB-AD | 1 | + | + | + | + | + | ND | + | + | 25 areas | [38] |
| PIB | DLB-AD | 1 | + | + | + | + | + | Occ | + | ND | ND | [6] |
| PIB | CJD | 2 | ND | ND | ND | ND | ND | ND | ND | ND | Abeta and PrP IHC | [114] |
| PIB | PD | 3 | + | + | + | HIPP only | + | Occ, thalamus, striatum | + | ND | 11 areas | [11] |
| Biopsy | ||||||||||||
| Flutemetamol | Hydrocephalus | 52 | ND | ND | ND | ND | ND | ND | ND | ND | Right F or right P | [95] |
| Flutemetamol | Hydrocephalus | 7 | ND | ND | ND | ND | ND | Right frontal cortex | ND | ND | Right frontal cortex | [118] |
| Flutemetamol, PIB | Hydrocephalus | 15 | + | ND | ND | ND | ND | ND | ND | ND | Right F | [65] |
| PIB | Hydrocephalus | 10 | + | ND | ND | ND | ND | ND | ND | ND | Right F | [64] |
| Flutemetamol | Hydrocephalus | 12 | ND | ND | P | ND | ND | ND | ND | ND | P | [119] |
F frontal lobe (middle frontal gyrus), T temporal lobe (superior and middle temporal gyri), P parietal lobe (inferior parietal lobule), HIPP hippocampus, EC entorhinal cortex, ACG anterior cingulate gyrus, PCG posterior cingulate gyrus, Occ occipital lobe, Abeta beta-amyloid protein, PrP prion protein, IHC immunohistochemistry, MTL medial temporal lobe, AD Alzheimer's disease, CJD Creuzfeldt-Jakob disease, DLB dementia with Lewy bodies, PD Parkinson's disease, MCI mild cognitive impairment, ND not determined
Monitoring changes in β-amyloid load in AD patients in anti-β-amyloid treatment clinical trials with amyloid biomarkers has been proposed [8] but its application appears limited to the clinical trial with the humanized monoclonal antibody bapineuzumab [94]. In this study, the bapineuzumab-treated group of AD patients was reported to have a 24 % lower cortical 11C-PIB PET retention than the placebo treated group of AD patients. However, post mortem follow-up of three bapineuzumab-treated AD patients participating in another trial has shown no difference in the load of cortical β-amyloid pathology in autopsy specimens when compared with the pathology loads found in non-treated AD patients [96].
In summary, reported literature evidence raises doubt about amyloid PET imaging as representative of Aβ loads in the living human brain. Whereas the host of apparent contradictions with these amyloid PET probes may explain the difficulty in interpreting these images and the multiple restrictions imposed on their utilization in clinical practice [53] at issue is not only the utility of these imaging agents, however, but also the interpretation of their brain imaging signals as predictable and consistent markers of Aβ brain deposition. It has been argued [103] that potential factors that affect the reported relationship between in vivo amyloid imaging and CERAD-based neuropathological assessments may be methodological based on (a) CERAD's semi-quantitative assessment of Aβ, (b) the presence of different forms of Aβ, and (c) imaging–pathologic assessment intervals. Unquestionably, these factors may be present in some cases, but there is also evidence that these amyloid PET agents are sensitive to other tissue targets in the living brain of animals (e.g., estrogen sulfotransferase; SULT1E1) [18] and humans (e.g., undetermined non-Aβ tumor and stroke targets, as well as myelin) [7, 52, 57, 69, 105], which adds questions about their purported specificity for brain Aβ aggregation. All these data combined suggest that alternative interpretation of amyloid PET brain signals needs to be considered for AD, that is, the possibility that other tissue targets may contribute, totally or partially, to the PET brain signals. Understanding the significance of these non-Aβ tissue targets would undoubtedly increase our understanding of the pathophysiology of the disease and help define more precisely the biological disease cascade.
Acknowledgments
JRB and VK work was partially supported by the UCLA ADRC (NIH grant P50 AG 16570). JRB and VK did not receive support from any for-profit entity, including licensing agreements. CRJ was supported by RO1 AG011378 and RO1 AG041851 and the Alexander Family Professorship of Alzheimers disease research, Mayo Clinic.
Contributor Information
Clifford R. Jack, Jr., Email: jack.clifford@mayo.edu, Department of Radiology, Mayo Clinic, Rochester, USA.
Jorge R. Barrio, Email: jbarrio@mednet.ucla.edu, Department of Molecular and Medical Pharmacology, David Geffen School of Medicine University of California, Los Angeles, USA.
Vladimir Kepe, Department of Molecular and Medical Pharmacology, David Geffen School of Medicine University of California, Los Angeles, USA.
References
- 1.Aizenstein HJ, Nebes RD, Saxton JA, Price JC, Mathis CA, Tsopelas ND, Ziolko SK, James JA, Snitz BE, Houck PR, Bi W, Cohen AD, Lopresti BJ, DeKosky ST, Halligan EM, Klunk WE. Frequent amyloid deposition without significant cognitive impairment among the elderly. Arch Neurol. 2008;65:1509–1517. doi: 10.1001/archneur.65.11.1509. [DOI] [PMC free article] [PubMed] [Google Scholar]
- 2.Albert MS, DeKosky ST, Dickson D, Dubois B, Feldman HH, Fox NC, Gamst A, Holtzman DM, Jagust WJ, Petersen RC, Snyder PC, Phelps CH. The diagnosis of mild cognitive impairment due to Alzheimer's disease: recommendations from the National Institute on Aging and Alzheimer's Association Workgroup. Alzheimers Dement. 2011;7:270–279. doi: 10.1016/j.jalz.2011.03.008. [DOI] [PMC free article] [PubMed] [Google Scholar]
- 3.Arnold SE, Hyman BT, Flory J, Damasio AR, Van Hoesen GW. The topographical and neuroanatomical distribution of neurofibrillary tangles and neuritic plaques in the cerebral cortex of patients with Alzheimer's disease. Cereb Cortex. 1991;1:103–116. doi: 10.1093/cercor/1.1.103. [DOI] [PubMed] [Google Scholar]
- 4.Bateman RJ, Xiong C, Benzinger TL, Fagan AM, Goate A, Fox NC, Marcus DS, Cairns NJ, Xie X, Blazey TM, Holtzman DM, Santacruz A, Buckles V, Oliver A, Moulder K, Aisen PS, Ghetti B, Klunk WE, McDade E, Martins RN, Masters CL, Mayeux R, Ringman JM, Rossor MN, Schofield PR, Sperling RA, Salloway S, Morris JC. Dominantly inherited Alzheimer network clinical and biomarker changes in dominantly inherited Alzheimer's disease. New Engl J Med. 2012;367:795–804. doi: 10.1056/NEJMoa1202753. [DOI] [PMC free article] [PubMed] [Google Scholar]
- 5.Bacskai BJ, Kajdasz ST, Christie RH, Carter C, Games D, Seubert P, Schenk D, Hyman BT. Imaging of amyloid-beta deposits in brains of living mice permits direct observation of clearance of plaques with immunotherapy. Nat Med. 2001;7:369–372. doi: 10.1038/85525. [DOI] [PubMed] [Google Scholar]
- 6.Bacskai BJ, Frosch MP, Freeman SH, Raymond SB, Augustinack JC, Johnson KA, Irizarry MC, Klunk WE, Mathis CA, Dekosky ST, Greenberg SM, Hyman BT, Growdon JH. Molecular imaging with Pittsburgh Compound B confirmed at autopsy: a case report. Arch Neurol. 2007;64:431–434. doi: 10.1001/archneur.64.3.431. [DOI] [PubMed] [Google Scholar]
- 7.Bengel FM, Minoshima S. 2012 SNM highlights lectures. J Nucl Med. 2012;53:15N–31N. [PubMed] [Google Scholar]
- 8.Blennow K, Hampel H, Zetterberg H. Biomarkers in β-amyloid immunotherapy trials in Alzheimer’s disease. Neuropsychopharmacology. 2013 doi: 10.1038/npp.2013.154. [DOI] [PMC free article] [PubMed] [Google Scholar]
- 9.Braak H, Braak E. Neuropathological stageing of Alzheimer-related changes. Acta Neuropathol. 1991;82:239–259. doi: 10.1007/BF00308809. [DOI] [PubMed] [Google Scholar]
- 10.Braak H, Braak E. Frequency of stages of Alzheimer-related lesions in different age categories. Neurobiol Aging. 1997;18:351–357. doi: 10.1016/s0197-4580(97)00056-0. [DOI] [PubMed] [Google Scholar]
- 11.Burack MA, Hartlein J, Flores HP, Taylor-Reinwald L, Perlmutter JS, Cairns NJ. In vivo amyloid imaging in autopsy-confirmed Parkinson disease with dementia. Neurology. 2010;74:77–84. doi: 10.1212/WNL.0b013e3181c7da8e. [DOI] [PMC free article] [PubMed] [Google Scholar]
- 12.Cairns NJ, Ikonomovic MD, Benzinger T, Storandt M, Fagan AM, Shah AR, Reinwald LT, Carter D, Felton A, Holtzman DM, Mintun MA, Klunk WE, Morris JC. Absence of Pittsburgh compound B detection of cerebral amyloid beta in a patient with clinical, cognitive, and cerebrospinal fluid markers of Alzheimer disease: a case report. Arch Neurol. 2009;66:1557–1562. doi: 10.1001/archneurol.2009.279. [DOI] [PMC free article] [PubMed] [Google Scholar]
- 13.Chetelat G, Villemagne VL, Pike KE, Ellis KA, Bourgeat P, Jones G, O'Keefe GJ, Salvado O, Szoeke C, Martins RN, Ames D, Masters CL, Rowe CC. Independent contribution of temporal beta-amyloid deposition to memory decline in the pre-dementia phase of Alzheimer's disease. Brain. 2011;134:798–807. doi: 10.1093/brain/awq383. [DOI] [PubMed] [Google Scholar]
- 14.Chetelat G, Villemagne VL, Villain N, Jones G, Ellis KA, Ames D, Martins RN, Masters CL, Rowe CC. Accelerated cortical atrophy in cognitively normal elderly with high beta-amyloid deposition. Neurology. 2012;78:477–484. doi: 10.1212/WNL.0b013e318246d67a. [DOI] [PubMed] [Google Scholar]
- 15.Chételat G, Villemagne VL, Pike KE, Ellis KA, Ames D, Masters CL, Rowe CC, Australian Imaging Biomarkers and Lifestyle Study of Ageing Research Group Relationship between memory performance and beta-amyloid deposition at different stages of Alzheimer's disease. Neurodegener Dis. 2012;10:141–144. doi: 10.1159/000334295. [DOI] [PubMed] [Google Scholar]
- 16.Clark CM, Schneider JA, Bedell BJ, Beach TG, Bilker WB, Mintun MA, Pontecorvo MJ, Hefti F, Carpenter AP, Flitter ML, Krautkramer MJ, Kung HF, Coleman RE, Doraiswamy PM, Fleisher AS, Sabbagh MN, Sadowsky CH, Reiman PEM, Zehntner SP, Skovronsky DM. Use of Florbetapir-PET for imaging β-amyloid pathology. JAMA. 2011;305:275–283. doi: 10.1001/jama.2010.2008. [DOI] [PMC free article] [PubMed] [Google Scholar]
- 17.Clark CM, Pontecorvo MJ, Beach TG, Bedell BJ, Coleman RE, Doraiswamy PM, Fleisher AS, Reiman EM, Sabbagh MN, Sadowsky CH, Schneider JA, Arora A, Carpenter AP, Flitter ML, Joshi AD, Krautkramer MJ, Lu M, Mintun MA, Skovronsky DM, AV-45-A16 Study Group Cerebral PET with florbetapir compared with neuropathology at autopsy for detection of neuritic amyloid-beta plaques: a prospective cohort study. Lancet Neurol. 2012;11:669–678. doi: 10.1016/S1474-4422(12)70142-4. [DOI] [PubMed] [Google Scholar]
- 18.Cole GB, Keum G, Liu J, Small GW, Satyamurthy N, Kepe V, Barrio JR. Specific estrogen sulfotransferase (SULT1E1) substrates and molecular imaging probe candidates. Proc Natl Acad Sci USA. 2010;107:6222–6227. doi: 10.1073/pnas.0914904107. [DOI] [PMC free article] [PubMed] [Google Scholar]
- 19.Cupidi C, Capobianco R, Goffredo D, Marcon G, Ghetti B, Bugiani O, Tagliavini F, Giaccone G. Neocortical variation of Abeta load in fully expressed, pure Alzheimer's disease. J Alzheimers Dis. 2010;19:57–68. doi: 10.3233/JAD-2010-1205. [DOI] [PubMed] [Google Scholar]
- 20.DeCarli CS, Atack JR, Ball MJ, Kaye JA, Grady CL, Fewster P, Schapiro MB, Rapoport SI. Postmortem regional neurofibrillary tangle densities, but not senile plaque densities, are related to regional cerebral metabolic rates for glucose during life in Alzheimer's disease. Neurodegeneration. 1992;1:113–121. [Google Scholar]
- 21.Driscoll I, Troncoso JC, Rudow G, Sojkova J, Pletnikova O, Zhou Y, Kraut MA, Ferrucci L, Mathis CA, Klunk WE, O'Brien RJ, Davatzikos C, Wong DF, Resnick SM. Correspondence between in vivo (11)C-PiB-PET amyloid imaging and postmortem, region-matched assessment of plaques. Acta Neuropathol. 2012;124:823–831. doi: 10.1007/s00401-012-1025-1. [DOI] [PMC free article] [PubMed] [Google Scholar]
- 22.Drzezga A, Grimmer T, Henriksen G, Stangier I, Perneczky R, Diehl-Schmid J, Mathis CA, Klunk WE, Price J, DeKosky S, Wester HJ, Schwaiger M, Kurz A. Imaging of amyloid plaques and cerebral glucose metabolism in semantic dementia and Alzheimer's disease. Neuroimage. 2008;39:619–633. doi: 10.1016/j.neuroimage.2007.09.020. [DOI] [PubMed] [Google Scholar]
- 23.Drzezga A, Grimmer T, Henriksen G, Muhlau M, Perneczky R, Miederer I, Praus C, Sorg C, Wohlschlager A, Riemenschneider M, Wester HJ, Foerstl H, Schwaiger M, Kurz A. Effect of APOE genotype on amyloid plaque load and gray matter volume in Alzheimer disease. Neurology. 2009;72:1487–1494. doi: 10.1212/WNL.0b013e3181a2e8d0. [DOI] [PubMed] [Google Scholar]
- 24.Dubois B, Feldman HH, Jacova C, Dekosky ST, Barberger-Gateau P, Cummings J, Delacourte A, Galasko D, Gauthier S, Jicha G, Meguro K, O'Brien J, Pasquier F, Robert P, Rossor M, Salloway S, Stern Y, Visser PJ, Scheltens P. Research criteria for the diagnosis of Alzheimer's disease: revising the NINCDS-ADRDA criteria. Lancet Neurol. 2007;6:734–746. doi: 10.1016/S1474-4422(07)70178-3. [DOI] [PubMed] [Google Scholar]
- 25.Dubois B, Feldman HH, Jacova C, Cummings JL, Dekosky ST, Barberger-Gateau P, Delacourte A, Frisoni G, Fox NC, Galasko D, Gauthier S, Hampel H, Jicha GA, Meguro K, O'Brien J, Pasquier F, Robert P, Rossor M, Salloway S, Sarazin M, de Souza LC, Stern Y, Visser PJ, Scheltens P. Revising the definition of Alzheimer's disease: a new lexicon. Lancet Neurol. 2010;9:1118–1127. doi: 10.1016/S1474-4422(10)70223-4. [DOI] [PubMed] [Google Scholar]
- 26.Edison P, Archer HA, Hinz R, Hammers A, Pavese N, Tai YF, Hotton G, Cutler D, Fox N, Kennedy A, Rossor M, Brooks DJ. Amyloid, hypometabolism, and cognition in Alzheimer disease: an [11C]PIB and [18F]FDG PET study. Neurology. 2007;68:501–508. doi: 10.1212/01.wnl.0000244749.20056.d4. [DOI] [PubMed] [Google Scholar]
- 27.Eli Lilly and Company. Lilly USA, LLC; Indianapolis: Amyvid Prescribing Information; pp. 1–10. http://pi.lilly.com/us/amyvid-uspi.pdf2012. [Google Scholar]
- 28.Fagan AM, Mintun MA, Mach RH, Lee SY, Dence CS, Shah AR, LaRossa GN, Spinner ML, Klunk WE, Mathis CA, DeKosky ST, Morris JC, Holtzman DM. Inverse relation between in vivo amyloid imaging load and cerebrospinal fluid Abeta42 in humans. Ann Neurol. 2006;59:512–519. doi: 10.1002/ana.20730. [DOI] [PubMed] [Google Scholar]
- 29.Fagan AM, Mintun MA, Shah AR, Aldea P, Roe CM, Mach RH, Marcus D, Morris JC, Holtzman DM. Cerebrospinal fluid tau and ptau(181) increase with cortical amyloid deposition in cognitively normal individuals: implications for future clinical trials of Alzheimer's disease. EMBO Mol Med. 2009;1:371–380. doi: 10.1002/emmm.200900048. [DOI] [PMC free article] [PubMed] [Google Scholar]
- 30.Fleisher AS, Chen K, Quiroz YT, Jakimovich LJ, Gomez MG, Langois CM, Langbaum JB, Ayutyanont N, Roontiva A, Thiyyagura P, Lee W, Mo H, Lopez L, Moreno S, Acosta-Baena N, Giraldo M, Garcia G, Reiman RA, Huentelman MJ, Kosik KS, Tariot PN, Lopera F, Reiman EM. Florbetapir PET analysis of amyloid-beta deposition in the presenilin 1 E280A autosomal dominant Alzheimer's disease kindred: a cross-sectional study. Lancet Neurol. 2012;11:1057–1065. doi: 10.1016/S1474-4422(12)70227-2. [DOI] [PMC free article] [PubMed] [Google Scholar]
- 31.Fleisher AS, Chen K, Liu X, Roontiva A, Thiyyagura P, Ayutyanont N, Joshi AD, Clark CM, Mintun MA, Pontecorvo MJ, Doraiswamy PM, Johnson KA, Skovronsky DM, Reiman EM. Using positron emission tomography and florbetapir F18 to image cortical amyloid in patients with mild cognitive impairment or dementia due to Alzheimer disease. Arch Neurol. 2011;68:1404–1411. doi: 10.1001/archneurol.2011.150. [DOI] [PubMed] [Google Scholar]
- 32.Forsberg A, Engler H, Almkvist O, Blomquist G, Hagman G, Wall A, Ringheim A, Långström B, Nordberg A. PET imaging of amyloid deposition in patients with mild cognitive impairment. Neurobiol Aging. 2008;29:1456–1465. doi: 10.1016/j.neurobiolaging.2007.03.029. [DOI] [PubMed] [Google Scholar]
- 33.Grimmer T, Riemenschneider M, Förstl H, Henriksen G, Klunk WE, Mathis CA, Shiga T, Wester HJ, Kurz A, Drzezga A. Beta amyloid in Alzheimer's disease: increased deposition in brain is reflected in reduced concentration in cerebrospinal fluid. Biol Psychiatry. 2009;65:927–934. doi: 10.1016/j.biopsych.2009.01.027. [DOI] [PMC free article] [PubMed] [Google Scholar]
- 34.Hardy J, Selkoe DJ. The amyloid hypothesis of Alzheimer's disease: progress and problems on the road to therapeutics. Science. 2002;297:353–356. doi: 10.1126/science.1072994. [DOI] [PubMed] [Google Scholar]
- 35.Hedden T, Van Dijk KR, Becker JA, Mehta A, Sperling RA, Johnson KA, Buckner RL. Disruption of functional connectivity in clinically normal older adults harboring amyloid burden. J Neurosci. 2009;29:12686–12694. doi: 10.1523/JNEUROSCI.3189-09.2009. [DOI] [PMC free article] [PubMed] [Google Scholar]
- 36.Hyman BT, Phelps CH, Beach TG, Bigio EH, Cairns NJ, Carrillo MC, Dickson DW, Duyckaerts C, Frosch MP, Masliah E, Mirra SS, Nelson PT, Schneider JA, Thal DR, Thies B, Trojanowski JQ, Vinters HV, Montine TJ. National Institute on Aging-Alzheimer's Association guidelines for the neuropathologic assessment of Alzheimer's disease. Alzheimers Dement. 2012;8:1–13. doi: 10.1016/j.jalz.2011.10.007. [DOI] [PMC free article] [PubMed] [Google Scholar]
- 37.Ikonomovic MD, Klunk WE, Abrahamson EE, Mathis CA, Price JC, Tsopelas ND, Lopresti BJ, Ziolko S, Bi W, Paljug WR, Debnath ML, Hope CE, Isanski BA, Hamilton RL, DeKosky ST. Post-mortem correlates of in vivo PiB-PET amyloid imaging in a typical case of Alzheimer's disease. Brain. 2008;131:1630–1645. doi: 10.1093/brain/awn016. [DOI] [PMC free article] [PubMed] [Google Scholar]
- 38.Ikonomovic MD, Abrahamson EE, Price JC, Hamilton RL, Mathis CA, Paljug WR, Debnath ML, Cohen AD, Mizukami K, DeKosky ST, Lopez OL, Klunk WE. Early AD pathology in a [C-11]PiB-negative case: a PiB-amyloid imaging, biochemical, and immunohistochemical study. Acta Neuropathol. 2012;123:433–447. doi: 10.1007/s00401-012-0943-2. [DOI] [PMC free article] [PubMed] [Google Scholar]
- 39.Ingelsson M, Fukumoto H, Newell KL, Growdon JH, Hedley-Whyte ET, Frosch MP, Albert MS, Hyman BT, Irizarry MC. Early Abeta accumulation and progressive synaptic loss, gliosis, and tangle formation in AD brain. Neurology. 2004;62:925–931. doi: 10.1212/01.wnl.0000115115.98960.37. [DOI] [PubMed] [Google Scholar]
- 40.Jack CR, Jr, Lowe VJ, Senjem ML, Weigand SD, Kemp BJ, Shiung MM, Knopman DS, Boeve BF, Klunk WE, Mathis CA, Petersen RC. 11C PiB and structural MRI provide complementary information in imaging of Alzheimer's disease and amnestic mild cognitive impairment. Brain. 2008;131:665–680. doi: 10.1093/brain/awm336. [DOI] [PMC free article] [PubMed] [Google Scholar]
- 41.Jack CR, Jr, Lowe VJ, Weigand SD, Wiste HJ, Senjem ML, Knopman DS, Shiung MM, Gunter JL, Boeve BF, Kemp BJ, Weiner M, Petersen RC. Serial PIB and MRI in normal, mild cognitive impairment and Alzheimer's disease: implications for sequence of pathological events in Alzheimer's disease. Brain. 2009;132:1355–1365. doi: 10.1093/brain/awp062. [DOI] [PMC free article] [PubMed] [Google Scholar]
- 42.Jack CR, Jr, Wiste HJ, Vemuri P, Weigand SD, Senjem ML, Zeng G, Bernstein MA, Gunter JL, Pankratz VS, Aisen PS, Weiner MW, Petersen RC, Shaw LM, Trojanowski JQ, Knopman DS, Alzheimer's Disease Neuroimaging Initiative Brain beta-amyloid measure and magnetic resonance imaging atrophy both predict time-to-progression from mild cognitive impairment to Alzheimer's disease. Brain. 2010;133:3336–3348. doi: 10.1093/brain/awq277. [DOI] [PMC free article] [PubMed] [Google Scholar]
- 43.Jack CR, Jr, Knopman DS, Jagust WJ, Shaw LM, Aisen PS, Weiner MW, Petersen RC, Trojanowski JQ. Hypothetical model of dynamic biomarkers of the Alzheimer's pathological cascade. Lancet Neurol. 2010;9:119–128. doi: 10.1016/S1474-4422(09)70299-6. [DOI] [PMC free article] [PubMed] [Google Scholar]
- 44.Jack CR, Jr, Albert MS, Knopman DS, McKhann GM, Sperling RA, Carrillo MC, Thies B, Phelps CH. Introduction to the recommendations from the National Institute on Aging-Alzheimer's Association workgroups on diagnostic guidelines for Alzheimer's disease. Alzheimers Dement. 2011;7:257–262. doi: 10.1016/j.jalz.2011.03.004. [DOI] [PMC free article] [PubMed] [Google Scholar]
- 45.Jack CR, Jr, Vemuri P, Wiste HJ, Weigand SD, Lesnick TG, Lowe V, Kantarci K, Bernstein MA, Senjem ML, Gunter JL, Boeve BF, Trojanowski JQ, Shaw LM, Aisen PS, Weiner MW, Petersen RC, Knopman DS, Alzheimer's Disease Neuroimaging Initiative Shapes of the trajectories of 5 major biomarkers of Alzheimer disease. Arch Neurol. 2012;69:856–867. doi: 10.1001/archneurol.2011.3405. [DOI] [PMC free article] [PubMed] [Google Scholar]
- 46.Jack CR, Jr, Knopman DS, Jagust WJ, Petersen RC, Weiner MW, Aisen PS, Shaw LM, Vemuri P, Wiste HJ, Weigand SD, Lesnick TG, Pankratz VS, Donohue MC, Trojanowski JQ. Tracking pathophysiological processes in Alzheimer's disease: an updated hypothetical model of dynamic biomarkers. Lancet Neurol. 2013;12:207–216. doi: 10.1016/S1474-4422(12)70291-0. [DOI] [PMC free article] [PubMed] [Google Scholar]
- 47.Jack CR, Jr, Wiste HJ, Lesnick TG, Weigand SD, Knopman DS, Vemuri P, Pankratz VS, Senjem ML, Gunter JL, Mielke MM, Lowe VJ, Boeve BF, Petersen RC. Brain beta-amyloid load approaches a plateau. Neurology. 2013;80:890–896. doi: 10.1212/WNL.0b013e3182840bbe. [DOI] [PMC free article] [PubMed] [Google Scholar]
- 48.Jagust WJ, Landau SM, Shaw LM, Trojanowski JQ, Koeppe RA, Reiman EM, Foster NL, Petersen RC, Weiner MW, Price JC, Mathis CA, Alzheimer's Disease Neuroimaging Initiative Relationships between biomarkers in aging and dementia. Neurology. 2009;73:1193–1199. doi: 10.1212/WNL.0b013e3181bc010c. [DOI] [PMC free article] [PubMed] [Google Scholar]
- 49.Jagust WJ, Bandy D, Chen K, Foster NL, Landau SM, Mathis CA, Price JC, Reiman EM, Skovronsky D, Koeppe RA. The Alzheimer's Disease Neuroimaging Initiative positron emission tomography core. Alzheimers Dement. 2010;6:221–229. doi: 10.1016/j.jalz.2010.03.003. [DOI] [PMC free article] [PubMed] [Google Scholar]
- 50.Jicha GA, Parisi JE, Dickson DW, Johnson K, Cha R, Ivnik RJ, Tangalos EG, Boeve BF, Knopman DS, Braak H, Petersen RC. Neuropathologic outcome of mild cognitive impairment following progression to clinical dementia. Arch Neurol. 2006;63:674–681. doi: 10.1001/archneur.63.5.674. [DOI] [PubMed] [Google Scholar]
- 51.Johnson KA, Gregas M, Becker JA, Kinnecom C, Salat DH, Moran EK, Smith EE, Rosand J, Rentz DM, Klunk WE, Mathis CA, Price JC, Dekosky ST, Fischman AJ, Greenberg SM. Imaging of amyloid burden and distribution in cerebral amyloid angiopathy. Ann Neurol. 2007;62:229–234. doi: 10.1002/ana.21164. [DOI] [PubMed] [Google Scholar]
- 52.Johnson G, Nathan M, Parisi J, Lingle W, Hunt C, Peller P, Fauq A, Maharvi G, Mathis CA, Lowe V. PiB PET/CT identification of meningiomas is not due to presence of amyloid-beta within tumors. J Nucl Med. 2012;53(Supplement 1):253. [Google Scholar]
- 53.Johnson KA, Minoshima S, Bohnen NI, Donohoe KJ, Foster NL, Herscovitch P, Karlawish JH, Rowe CC, Carrillo MC, Hartley DM, Hedrick S, Pappas V, Thies WH. Appropriate use criteria for amyloid PET: a report of the Amyloid Imaging Task Force, the Society of Nuclear Medicine and Molecular Imaging, and the Alzheimer's Association. Alzheimers Dement. 2013;9:e-1–e-16. doi: 10.1016/j.jalz.2013.01.002. [DOI] [PMC free article] [PubMed] [Google Scholar]
- 54.Kadir A, Marutle A, Gonzalez D, Scholl M, Almkvist O, Mousavi M, Mustafiz T, Darreh-Shori T, Nennesmo I, Nordberg A. Positron emission tomography imaging and clinical progression in relation to molecular pathology in the first Pittsburgh Compound B positron emission tomography patient with Alzheimer's disease. Brain. 2011;134:301–317. doi: 10.1093/brain/awq349. [DOI] [PMC free article] [PubMed] [Google Scholar]
- 55.Kantarci K, Yang C, Schneider JA, Senjem ML, Reyes DA, Lowe VJ, Barnes LL, Aggarwal NT, Bennett DA, Smith GE, Petersen RC, Jack CR, Jr, Boeve BF. Antemortem amyloid imaging and beta-amyloid pathology in a case with dementia with Lewy bodies. Neurobiol Aging. 2012;33:878–885. doi: 10.1016/j.neurobiolaging.2010.08.007. [DOI] [PMC free article] [PubMed] [Google Scholar]
- 56.Kemppainen NM, Aalto S, Wilson IA, Någren K, Helin S, Brück A, Oikonen V, Kailajärvi M, Scheinin M, Viitanen M, Parkkola R, Rinne JO. Voxel-based analysis of PET amyloid ligand [11C]PIB uptake in Alzheimer disease. Neurology. 2006;67:1575–1580. doi: 10.1212/01.wnl.0000240117.55680.0a. [DOI] [PubMed] [Google Scholar]
- 57.Kim HY, Kim J, Lee JH. Incidental finding of meningioma on C11-PIB PET. Clin Nucl Med. 2012;37:e36–e37. doi: 10.1097/RLU.0b013e318238f25a. [DOI] [PubMed] [Google Scholar]
- 58.Klunk WE, Engler H, Nordberg A, Wang Y, Blomqvist G, Holt DP, Bergstrom M, Savitcheva I, Huang GF, Estrada S, Ausen B, Debnath ML, Barletta J, Price JC, Sandell J, Lopresti BJ, Wall A, Koivisto P, Antoni A, Mathis CA, Langstrom B. Imaging brain amyloid in Alzheimer's disease with Pittsburgh Compound-B. Ann Neurol. 2004;55:306–319. doi: 10.1002/ana.20009. [DOI] [PubMed] [Google Scholar]
- 59.Klunk WE, Lopresti BJ, Ikonomovic MD, Lefterov IM, Koldamova RP, Abrahamson EE, Debnath ML, Holt DP, Huang GF, Shao L, DeKosky ST, Price JC, Mathis CA. Binding of the positron emission tomography tracer Pittsburgh compound-B reflects the amount of amyloid-beta in Alzheimer's disease brain but not in transgenic mouse brain. J Neurosci. 2005;25:10598–10606. doi: 10.1523/JNEUROSCI.2990-05.2005. [DOI] [PMC free article] [PubMed] [Google Scholar]
- 60.Klunk WE. 7th Human Amyloid Imaging. Miami, Florida: 2013. Jan 16–18, Standardization of quantitative amyloid imaging data: the centiloid project. 2013. Abstract available on page 31 of the on-line Book of Abstracts at http://www.worldeventsforum.com/hai/xhtml-css/past-programs/HAI_2013_ConferenceBook%20A.pdf. [Google Scholar]
- 61.Koivunen J, Scheinin N, Virta JR, Aalto S, Vahlberg T, Någren K, Helin S, Parkkola R, Viitanen M, Rinne JO. Amyloid PET imaging in patients with mild cognitive impairment: a 2-year follow-up study. Neurology. 2011;76:1085–1090. doi: 10.1212/WNL.0b013e318212015e. [DOI] [PubMed] [Google Scholar]
- 62.Knopman DS, Parisi JE, Salviati A, Floriach-Robert M, Boeve BF, Ivnik RJ, Smith GE, Dickson DW, Johnson KA, Petersen LE, McDonald WC, Braak H, Petersen RC. Neuropathology of cognitively normal elderly. J Neuropathol Exp Neurol. 2003;62:1087–1095. doi: 10.1093/jnen/62.11.1087. [DOI] [PubMed] [Google Scholar]
- 63.Knopman DS, Jack CR, Wiste HJ, Weigand SD, Vemuri P, Lowe VJ, Kantarci K, Gunter JL, Senjem ML, Mielke MM, Roberts RO, Boeve BF, Petersen RC. Selective worsening of brain injury biomarker abnormalities in cognitively normal elderly persons with β-amyloidosis. JAMA Neurology. 2013 doi: 10.1001/jamaneurol.2013.182. [DOI] [PMC free article] [PubMed] [Google Scholar]
- 64.Leinonen V, Alafuzoff I, Aalto S, Suotunen T, Savolainen S, Någren K, Tapiola T, Pirttilä T, Rinne J, Jääskeläinen JE, Soininen H, Rinne JO. Assessment of beta-amyloid in a frontal cortical brain biopsy specimen and by positron emission tomography with carbon 11-labeled Pittsburgh Compound B. Arch Neurol. 2008;65:1304–1309. doi: 10.1001/archneur.65.10.noc80013. [DOI] [PubMed] [Google Scholar]
- 65.Leinonen V, Rinne JO, Virtanen KA, Eskola O, Rummukainen J, Huttunen J, von Und Zu Fraunberg M, Nerg O, Koivisto AM, Rinne J, Jääskeläinen JE, Buckley C, Smith A, Jones PA, Sherwin P, Farrar G, McLain R, Kailajärvi M, Heurling K, Grachev ID. Positron emission tomography with [(18) F]flutemetamol and [(11) C]PiB for in vivo detection of cerebral cortical amyloid in normal pressure hydrocephalus patients. Eur J Neurol. 2013;20:1043–1052. doi: 10.1111/ene.12102. [DOI] [PubMed] [Google Scholar]
- 66.Lockhart A, Lamb JR, Osredkar T, Sue LI, Joyce JN, Ye L, Libri V, Leppert D, Beach TG. PIB is a non-specific imaging marker of amyloid-beta (Abeta) peptide-related cerebral amyloidosis. Brain. 2007;130:2607–2615. doi: 10.1093/brain/awm191. [DOI] [PubMed] [Google Scholar]
- 67.Lopresti BJ, Klunk WE, Mathis CA, Hoge JA, Ziolko SK, Lu X, Meltzer CC, Schimmel K, Tsopelas ND, DeKosky ST, Price JC. Simplified quantification of Pittsburgh Compound B amyloid imaging PET studies: a comparative analysis. J Nucl Med. 2005;46:1959–1972. [PubMed] [Google Scholar]
- 68.Lowe VJ, Kemp BJ, Jack CR, Jr, Senjem M, Weigand S, Shiung M, Smith G, Knopman D, Boeve B, Mullan B, Petersen RC. Comparison of 18F-FDG and PiB PET in cognitive impairment. J Nucl Med. 2009;50:878–886. doi: 10.2967/jnumed.108.058529. [DOI] [PMC free article] [PubMed] [Google Scholar]
- 69.Ly JV, Rowe CC, Villemagne VL, Zavala JA, Ma H, Sahathevan R, O'Keefe G, Gong SJ, Gunawan R, Churilov L, Saunder T, Ackerman U, Tochon-Danguy H, Donnan GA. Subacute ischemic stroke is associated with focal 11C PiB positron emission tomography retention but not with global neocortical Abeta deposition. Stroke. 2012;43:1341–1346. doi: 10.1161/STROKEAHA.111.636266. [DOI] [PubMed] [Google Scholar]
- 70.McKee AC, Stein TD, Nowinski CJ, Stern RA, Daneshvar DH, Alvarez VE, Lee HS, Hall G, Wojtowicz SM, Baugh CM, Riley DO, Kubilus CA, Cormier KA, Jacobs MA, Martin BR, Abraham CR, Ikezu T, Reichard RR, Wolozin BL, Budson AE, Goldstein LE, Kowall NW, Cantu RC. The spectrum of disease in chronic traumatic encephalopathy. Brain. 2013;136:43–64. doi: 10.1093/brain/aws307. [DOI] [PMC free article] [PubMed] [Google Scholar]
- 71.McKhann G, Drachman D, Folstein M, Katzman R, Price D, Stadlan EM. Clinical diagnosis of Alzheimer's disease: report of the NINCDS-ADRDA Work Group under the auspices of Department of Health and Human Services Task Force on Alzheimer's Disease. Neurology. 1984;34:939–944. doi: 10.1212/wnl.34.7.939. [DOI] [PubMed] [Google Scholar]
- 72.McKhann GM, Knopman DS, Chertkow H, Hyman BT, Jack CR, Jr, Kawas CH, Klunk WE, Koroshetz WJ, Manly JJ, Mayeux R, Mohs RC, Morris JC, Rossor MN, Scheltens P, Carrillo MC, Thies B, Weintraub S, Phelps CH. The diagnosis of dementia due to Alzheimer's disease: recommendations from the National Institute on Aging and the Alzheimer's Association Workgroup. Alzheimers Dement. 2011;7:263–269. doi: 10.1016/j.jalz.2011.03.005. [DOI] [PMC free article] [PubMed] [Google Scholar]
- 73.McNamee RL, Yee SH, Price JC, Klunk WE, Rosario B, Weissfeld L, Ziolko S, Berginc M, Lopresti B, Dekosky S, Mathis CA. Consideration of optimal time window for Pittsburgh compound B PET summed uptake measurements. J Nucl Med. 2009;50:348–355. doi: 10.2967/jnumed.108.057612. [DOI] [PMC free article] [PubMed] [Google Scholar]
- 74.Mintun MA, Larossa GN, Sheline YI, Dence CS, Lee SY, Mach RH, Klunk WE, Mathis CA, DeKosky ST, Morris JC. [11C]PIB in a nondemented population: potential antecedent marker of Alzheimer disease. Neurology. 2006;67:446–452. doi: 10.1212/01.wnl.0000228230.26044.a4. [DOI] [PubMed] [Google Scholar]
- 75.Mirra SS, Heyman A, McKeel D, Sumi SM, Crain BJ, Brownlee LM, Vogel FS, Hughes JP, van Belle G, Berg L. The Consortium to Establish a Registry for Alzheimer's Disease (CERAD). Part II. Standardization of the neuropathologic assessment of Alzheimer's disease. Neurology. 1991;41:479–486. doi: 10.1212/wnl.41.4.479. [DOI] [PubMed] [Google Scholar]
- 76.Montine TJ, Phelps CH, Beach TG, Bigio EH, Cairns NJ, Dickson DW, Duyckaerts C, Frosch MP, Masliah E, Mirra SS, Nelson PT, Schneider JA, Thal DR, Trojanowski JQ, Vinters HV, Hyman BT. National Institute on Aging-Alzheimer's Association guidelines for the neuropathologic assessment of Alzheimer's disease: a practical approach. Acta Neuropathol. 2012;123:1–11. doi: 10.1007/s00401-011-0910-3. [DOI] [PMC free article] [PubMed] [Google Scholar]
- 77.Mormino EC, Kluth JT, Madison CM, Rabinovici GD, Baker SL, Miller BL, Koeppe RA, Mathis CA, Weiner MW, Jagust WJ, Alzheimer's Disease Neuroimaging Initiative Episodic memory loss is related to hippocampal-mediated beta-amyloid deposition in elderly subjects. Brain. 2009;132:1310–1323. doi: 10.1093/brain/awn320. [DOI] [PMC free article] [PubMed] [Google Scholar]
- 78.Morris JC, Roe CM, Grant EA, Head D, Storandt M, Goate AM, Fagan AM, Holtzman DM, Mintun MA. Pittsburgh Compound B imaging and prediction of progression from cognitive normality to symptomatic Alzheimer disease. Arch Neurol. 2009;66:1469–1475. doi: 10.1001/archneurol.2009.269. [DOI] [PMC free article] [PubMed] [Google Scholar]
- 79.Morris JC, Roe CM, Xiong C, Fagan AM, Goate AM, Holtzman DM, Mintun MA. APOE predicts amyloid-beta but not tau Alzheimer pathology in cognitively normal aging. Ann Neurol. 2010;67:122–131. doi: 10.1002/ana.21843. [DOI] [PMC free article] [PubMed] [Google Scholar]
- 80.Musiek ES, Holtzman DM. Origins of Alzheimer's disease: reconciling cerebrospinal fluid biomarker and neuropathology data regarding the temporal sequence of amyloid-beta and tau involvement. Curr Opin Neurol. 2012;25:715–720. doi: 10.1097/WCO.0b013e32835a30f4. [DOI] [PMC free article] [PubMed] [Google Scholar]
- 81.Nelson PT, Alafuzoff I, Bigio EH, Bouras C, Braak H, Cairns NJ, Castellani RJ, Crain BJ, Davies P, Del Tredici K, Duyckaerts C, Frosch MP, Haroutunian V, Hof PR, Hulette CM, Hyman BT, Iwatsubo T, Jellinger KA, Jicha GA, Kövari E, Kukull WA, Leverenz JB, Love S, Mackenzie IR, Mann DM, Masliah E, McKee AC, Montine TJ, Morris JC, Schneider JA, Sonnen JA, Thal DR, Trojanowski JQ, Troncoso JC, Wisniewski T, Woltjer RL, Beach TG. Correlation of Alzheimer disease neuropathologic changes with cognitive status: a review of the literature. J Neuropathol Exp Neurol. 2012;71:362–381. doi: 10.1097/NEN.0b013e31825018f7. [DOI] [PMC free article] [PubMed] [Google Scholar]
- 82.Niedowicz DM, Beckett TL, Matveev S, Weidner AM, Baig I, Kryscio RJ, Mendiondo MS, LeVine H, 3rd, Keller JN, Murphy MP. Pittsburgh compound B and the postmortem diagnosis of Alzheimer disease. Ann Neurol. 2012;72:564–570. doi: 10.1002/ana.23633. [DOI] [PMC free article] [PubMed] [Google Scholar]
- 83.Okello A, Koivunen J, Edison P, Archer HA, Turkheimer FE, Någren K, Bullock R, Walker Z, Kennedy A, Fox NC, Rossor MN, Rinne JO, Brooks DJ. Conversion of amyloid positive and negative MCI to AD over 3 years: an 11C-PIB PET study. Neurology. 2009;73:754–760. doi: 10.1212/WNL.0b013e3181b23564. [DOI] [PMC free article] [PubMed] [Google Scholar]
- 84.Perrin RJ, Fagan AM, Holtzman DM. Multimodal techniques for diagnosis and prognosis of Alzheimer's disease. Nature. 2009;461:916–922. doi: 10.1038/nature08538. [DOI] [PMC free article] [PubMed] [Google Scholar]
- 85.Price JC, Klunk WE, Lopresti BJ, Lu X, Hoge JA, Ziolko SK, Holt DP, Meltzer CC, DeKosky ST, Mathis CA. Kinetic modeling of amyloid binding in humans using PET imaging and Pittsburgh Compound-B. J Cereb Blood Flow Metab. 2005;25:1528–1547. doi: 10.1038/sj.jcbfm.9600146. [DOI] [PubMed] [Google Scholar]
- 86.Price JL, Morris JC. Tangles and plaques in nondemented aging and “preclinical” Alzheimer's disease. Ann Neurol. 1999;45:358–368. doi: 10.1002/1531-8249(199903)45:3<358::aid-ana12>3.0.co;2-x. [DOI] [PubMed] [Google Scholar]
- 87.Price JL, McKeel DW, Jr, Buckles VD, Roe CM, Xiong C, Grundman M, Hansen LA, Petersen RC, Parisi JE, Dickson DW, Smith CD, Davis DG, Schmitt FA, Markesbery WR, Kaye J, Kurlan R, Hulette C, Kurland BF, Higdon R, Kukull W, Morris JC. Neuropathology of nondemented aging: presumptive evidence for preclinical Alzheimer disease. Neurobiol Aging. 2009;30:1026–1036. doi: 10.1016/j.neurobiolaging.2009.04.002. [DOI] [PMC free article] [PubMed] [Google Scholar]
- 88.Rabinovici GD, Furst AJ, O'Neil JP, Racine CA, Mormino EC, Baker SL, Chetty S, Patel P, Pagliaro TA, Klunk WE, Mathis CA, Rosen HJ, Miller BL, Jagust WJ. 11C-PIB PET imaging in Alzheimer disease and frontotemporal lobar degeneration. Neurology. 2007;68:1205–1212. doi: 10.1212/01.wnl.0000259035.98480.ed. [DOI] [PubMed] [Google Scholar]
- 89.Rabinovici GD, Jagust WJ, Furst AJ, Ogar JM, Racine CA, Mormino EC, O'Neil JP, Lal RA, Dronkers NF, Miller BL, Gorno-Tempini ML. Abeta amyloid and glucose metabolism in three variants of primary progressive aphasia. Ann Neurol. 2008;64:388–401. doi: 10.1002/ana.21451. [DOI] [PMC free article] [PubMed] [Google Scholar]
- 90.Rabinovici GD, Jagust WJ. Amyloid imaging in aging and dementia: testing the amyloid hypothesis in vivo. Behav Neurol. 2009;21:117–128. doi: 10.3233/BEN-2009-0232. [DOI] [PMC free article] [PubMed] [Google Scholar]
- 91.Rabinovici GD, Furst AJ, Alkalay A, Racine CA, O'Neil JP, Janabi M, Baker SL, Agarwal N, Bonasera SJ, Mormino EC, Weiner MW, Gorno-Tempini ML, Rosen HJ, Miller BL, Jagust WJ. Increased metabolic vulnerability in early-onset Alzheimer's disease is not related to amyloid burden. Brain. 2010;133:512–528. doi: 10.1093/brain/awp326. [DOI] [PMC free article] [PubMed] [Google Scholar]
- 92.Reiman EM, Chen K, Liu X, Bandy D, Yu M, Lee W, Ayutyanont N, Keppler J, Reeder SA, Langbaum JB, Alexander GE, Klunk WE, Mathis CA, Price JC, Aizenstein HJ, DeKosky ST, Caselli RJ. Fibrillar amyloid-beta burden in cognitively normal people at 3 levels of genetic risk for Alzheimer's disease. Proc Natl Acad Sci USA. 2009;106:6820–6825. doi: 10.1073/pnas.0900345106. [DOI] [PMC free article] [PubMed] [Google Scholar]
- 93.Ringman JM, Teplow DB, Villemagne VL. The exception makes the rule: not all Abeta plaques are created equal. Neurology. 2012;79:206–207. doi: 10.1212/WNL.0b013e31825fe11f. [DOI] [PubMed] [Google Scholar]
- 94.Rinne JO, Brooks DJ, Rossor MN, Fox NC, Bullock R, Klunk WE, Mathis CA, Blennow K, Barakos J, Okello AA, Rodriguez Martinez de Liano S, Liu E, Koller M, Gregg KM, Schenk D, Black R, Grundman M. 11C-PiB PET assessment of change in fibrillar amyloid-beta load in patients with Alzheimer's disease treated with bapineuzumab: a phase 2, double-blind, placebo-controlled, ascending-dose study. Lancet Neurol. 2010;9:363–372. doi: 10.1016/S1474-4422(10)70043-0. [DOI] [PubMed] [Google Scholar]
- 95.Rinne JO, Wong DF, Wolk DA, Leinonen V, Arnold SE, Buckley C, Smith A, McLain R, Sherwin PF, Farrar G, Kailajärvi M, Grachev ID. [(18)F]Flutemetamol PET imaging and cortical biopsy histopathology for fibrillar amyloid beta detection in living subjects with normal pressure hydrocephalus: pooled analysis of four studies. Acta Neuropathol. 2012;124:833–845. doi: 10.1007/s00401-012-1051-z. [DOI] [PubMed] [Google Scholar]
- 96.Roher AE, Cribbs DH, Kim RC, Maarouf CL, Whiteside CM, Kokjohn TA, Daugs ID, Head E, Liebsack C, Serrano G, Belden C, Sabbagh MN, Beach TG. Bapineuzumab alters aβ composition: implications for the amyloid cascade hypothesis and anti-amyloid immunotherapy. PLoS One. 2013;8:e59735. doi: 10.1371/journal.pone.0059735. [DOI] [PMC free article] [PubMed] [Google Scholar]
- 97.Rowe CC, Ng S, Ackermann U, Gong SJ, Pike K, Savage G, Cowie TF, Dickinson KL, Maruff P, Darby D, Smith C, Woodward M, Merory J, Tochon-Danguy H, O'Keefe G, Klunk WE, Mathis CA, Price JC, Masters CL, Villemagne VL. Imaging beta-amyloid burden in aging and dementia. Neurology. 2007;68:1718–1725. doi: 10.1212/01.wnl.0000261919.22630.ea. [DOI] [PubMed] [Google Scholar]
- 98.Rowe CC, Ellis KA, Rimajova M, Bourgeat P, Pike KE, Jones G, Fripp J, Tochon-Danguy H, Morandeau L, O'Keefe G, Price R, Raniga P, Robins P, Acosta O, Lenzo N, Szoeke C, Salvado O, Head R, Martins R, Masters CL, Ames D, Villemagne VL. Amyloid imaging results from the Australian Imaging, Biomarkers and Lifestyle (AIBL) study of aging. Neurobiol Aging. 2010;31:1275–1283. doi: 10.1016/j.neurobiolaging.2010.04.007. [DOI] [PubMed] [Google Scholar]
- 99.Savva GM, Wharton SB, Ince PG, Forster G, Matthews FE, Brayne C, Medical Research Council Cognitive Function and Ageing Study Age, neuropathology, and dementia. N Engl J Med. 2009;360:2302–2309. doi: 10.1056/NEJMoa0806142. [DOI] [PubMed] [Google Scholar]
- 100.Shaw LM, Vanderstichele H, Knapik-Czajka M, Clark CM, Aisen PS, Petersen RC, Blennow K, Soares H, Simon A, Lewczuk P, Dean R, Siemers E, Potter W, Lee VM, Trojanowski JQ, Alzheimer's Disease Neuroimaging Initiative Cerebrospinal fluid biomarker signature in Alzheimer's disease neuroimaging initiative subjects. Ann Neurol. 2009;65:403–413. doi: 10.1002/ana.21610. [DOI] [PMC free article] [PubMed] [Google Scholar]
- 101.Shin J, Lee SY, Kim SH, Kim YB, Cho SJ. Multitracer PET imaging of amyloid plaques and neurofibrillary tangles in Alzheimer's disease. Neuroimage. 2008;43:236–244. doi: 10.1016/j.neuroimage.2008.07.022. [DOI] [PubMed] [Google Scholar]
- 102.Shin J, Kepe V, Small GW, Phelps ME, Barrio JR. Multimodal imaging of Alzheimer pathophysiology in the brain's default mode network. Int J Alzheimers Dis. 2011;2011:687945. doi: 10.4061/2011/687945. [DOI] [PMC free article] [PubMed] [Google Scholar]
- 103.Sojkova J, Driscoll I, Iacono D, Zhou Y, Codispoti KE, Kraut MA, Ferrucci L, Pletnikova O, Mathis CA, Klunk WE, O'Brien RJ, Wong DF, Troncoso JC, Resnick SM. In vivo fibrillar beta-amyloid detected using [11C]PiB positron emission tomography and neuropathologic assessment in older adults. Arch Neurol. 2011;68:232–240. doi: 10.1001/archneurol.2010.357. [DOI] [PMC free article] [PubMed] [Google Scholar]
- 104.Sperling RA, Aisen PS, Beckett LA, Bennett DA, Craft S, Fagan AM, Iwatsubo T, Jack CR, Jr, Kaye J, Montine TJ, Park DC, Reiman EM, Rowe CC, Siemers E, Stern Y, Yaffe K, Carrillo MC, Thies B, Morrison-Bogorad M, Wagster MV, Phelps CH. Toward defining the preclinical stages of Alzheimer's disease: recommendations from the National Institute on Aging-Alzheimer's Association workgroups on diagnostic guidelines for Alzheimer's disease. Alzheimers Dement. 2011;7:280–292. doi: 10.1016/j.jalz.2011.03.003. [DOI] [PMC free article] [PubMed] [Google Scholar]
- 105.Stankoff B, Freeman L, Aigrot MS, Chardain A, Dollé F, Williams A, Galanaud D, Armand L, Lehericy S, Lubetzki C, Zalc B, Bottlaender M. Imaging central nervous system myelin by positron emission tomography in multiple sclerosis using [methyl-(1)(1)C]-2-(4′-methylaminophenyl)-6-hydroxybenzothiazole. Ann Neurol. 2011;69:673–680. doi: 10.1002/ana.22320. [DOI] [PubMed] [Google Scholar]
- 106.Thal DR, Rüb U, Schultz C, Sassin I, Ghebremedhin E, Del Tredici K, Braak E, Braak H. Sequence of Abeta-protein deposition in the human medial temporal lobe. J Neuropathol Exp Neurol. 2000;59:733–748. doi: 10.1093/jnen/59.8.733. [DOI] [PubMed] [Google Scholar]
- 107.Thal DR, Rüb U, Orantes M, Braak H. Phases of A beta-deposition in the human brain and its relevance for the development of AD. Neurology. 2002;58:1791–1800. doi: 10.1212/wnl.58.12.1791. [DOI] [PubMed] [Google Scholar]
- 108.Tolboom N, van der Flier WM, Yaqub M, Boellaard R, Verwey NA, Blankenstein MA, Windhorst AD, Scheltens P, Lammertsma AA, van Berckel BN. Relationship of cerebrospinal fluid markers to 11C-PiB and 18F-FDDNP binding. J Nucl Med. 2009;50:1464–1470. doi: 10.2967/jnumed.109.064360. [DOI] [PubMed] [Google Scholar]
- 109.Tolboom N, Yaqub M, Boellaard R, Luurtsema G, Windhorst AD, Scheltens P, Lammertsma AA, van Berckel BN. Test-retest variability of quantitative [11C]PIB studies in Alzheimer's disease. Eur J Nucl Med Mol Imaging. 2009;36:1629–1638. doi: 10.1007/s00259-009-1129-6. [DOI] [PMC free article] [PubMed] [Google Scholar]
- 110.Vemuri P, Wiste HJ, Weigand SD, Shaw LM, Trojanowski JQ, Weiner MW, Knopman DS, Petersen RC, Jack CR, Jr, Alzheimer's Disease Neuroimaging Initiative MRI and CSF biomarkers in normal, MCI, and AD subjects: diagnostic discrimination and cognitive correlations. Neurology. 2009;73:287–293. doi: 10.1212/WNL.0b013e3181af79e5. [DOI] [PMC free article] [PubMed] [Google Scholar]
- 111.Vemuri P, Wiste HJ, Weigand SD, Knopman DS, Shaw LM, Trojanowski JQ, Aisen PS, Weiner M, Petersen RC, Jack CR, Jr, Alzheimer's Disease Neuroimaging Initiative Effect of apolipoprotein E on biomarkers of amyloid load and neuronal pathology in Alzheimer disease. Ann Neurol. 2010;67:308–316. doi: 10.1002/ana.21953. [DOI] [PMC free article] [PubMed] [Google Scholar]
- 112.Villain N, Chételat G, Grassiot B, Bourgeat P, Jones G, Ellis KA, Ames D, Martins RN, Eustache F, Salvado O, Masters CL, Rowe CC, Villemagne VL, AIBL Research Group Regional dynamics of amyloid-beta deposition in healthy elderly, mild cognitive impairment and Alzheimer's disease: a voxelwise PiB-PET longitudinal study. Brain. 2012;135:2126–2139. doi: 10.1093/brain/aws125. [DOI] [PubMed] [Google Scholar]
- 113.Villemagne VL, Pike KE, Darby D, Maruff P, Savage G, Ng S, Ackermann U, Cowie TF, Currie J, Chan SG, Jones G, Tochon-Danguy H, O'Keefe G, Masters CL, Rowe CC. Abeta deposits in older non-demented individuals with cognitive decline are indicative of preclinical Alzheimer's disease. Neuropsychologia. 2008;46:1688–1697. doi: 10.1016/j.neuropsychologia.2008.02.008. [DOI] [PubMed] [Google Scholar]
- 114.Villemagne VL, McLean CA, Reardon K, Boyd A, Lewis V, Klug G, Jones G, Baxendale D, Masters CL, Rowe CC, Collins SJ. 11C-PiB PET studies in typical sporadic Creutzfeldt-Jakob disease. J Neurol Neurosurg Psychiatry. 2009;80:998–1001. doi: 10.1136/jnnp.2008.171496. [DOI] [PubMed] [Google Scholar]
- 115.Villemagne VL, Burnham S, Bourgeat P, Brown B, Ellis KA, Salvado O, Szoeke C, Macaulay SL, Martins R, Maruff P, Ames D, Rowe CC, Masters CL, Australian Imaging Biomarkers and Lifestyle (AIBL) Research Group Amyloid beta deposition, neurodegeneration, and cognitive decline in sporadic Alzheimer's disease: a prospective cohort study. Lancet Neurol. 2013;12:357–367. doi: 10.1016/S1474-4422(13)70044-9. [DOI] [PubMed] [Google Scholar]
- 116.Weigand SD, Vemuri P, Wiste HJ, Senjem ML, Pankratz VS, Aisen PS, Weiner MW, Petersen RC, Shaw LM, Trojanowski JQ, Knopman DS, Jack CR, Jr, Alzheimer's Disease Neuroimaging Initiative Transforming cerebrospinal fluid Abeta42 measures into calculated Pittsburgh compound B units of brain Abeta amyloid. Alzheimers Dement. 2011;7:133–141. doi: 10.1016/j.jalz.2010.08.230. [DOI] [PMC free article] [PubMed] [Google Scholar]
- 117.Wolk DA, Klunk W. Update on amyloid imaging: from healthy aging to Alzheimer's disease. Curr Neurol Neurosci Rep. 2009;9:345–352. doi: 10.1007/s11910-009-0051-4. [DOI] [PMC free article] [PubMed] [Google Scholar]
- 118.Wolk DA, Grachev ID, Buckley C, Kazi H, Grady MS, Trojanowski JQ, Hamilton RH, Sherwin P, McLain R, Arnold SE. Association between in vivo fluorine 18-labeled flutemetamol amyloid positron emission tomography imaging and in vivo cerebral cortical histopathology. Arch Neurol. 2011;68:1398–1403. doi: 10.1001/archneurol.2011.153. [DOI] [PMC free article] [PubMed] [Google Scholar]
- 119.Wong DF, Moghekar AR, Rigamonti D, Brašić JR, Rousset O, Willis W, Buckley C, Smith A, Gok B, Sherwin P, Grachev ID. An in vivo evaluation of cerebral cortical amyloid with [18F]flutemetamol using positron emission tomography compared with parietal biopsy samples in living normal pressure hydrocephalus patients. Mol Imaging Biol. 2013;15:230–237. doi: 10.1007/s11307-012-0583-x. [DOI] [PMC free article] [PubMed] [Google Scholar]