

Background: Both ceramides and glucosylceramides have been implicated in the pathogenesis of insulin resistance.
Results: These two classes of sphingolipids modulate insulin action but differ by both tissue specificity and mechanism of action.
Conclusion: Ceramides and glucosylceramides are independent and separable antagonists of insulin signaling.
Significance: These observations will contribute to our understanding of how sphingolipids contribute to obesity-related metabolic diseases.
Keywords: Ceramide, Glucose Transport, Glycerosphingolipid, Insulin Resistance, Lipotoxicity, Metabolism, Sphingolipid, Ceramide, Glucosylceramide, Insulin
Abstract
Inhibitors of sphingolipid synthesis protect mice from diet induced-insulin resistance, and sphingolipids such as ceramides and glucosylated-ceramides (e.g., GM3) are putative nutritional intermediates linking obesity to diabetes risk. Herein we investigated the role of each of these sphingolipids in muscle and adipose tissue and conclude that they are independent and separable antagonists of insulin signaling. Of particular note, ceramides antagonize insulin signaling in both myotubes and adipocytes, whereas glucosyceramides are only efficacious in adipocytes: 1) In myotubes exposed to saturated fats, inhibitors of enzymes required for ceramide synthesis enhance insulin signaling, but those targeting glucosylceramide synthase have no effect. 2) Exogenous ceramides antagonize insulin signaling in myotubes, whereas ganglioside precursors do not. 3) Overexpression of glucosylceramide synthase in myotubes induces glucosylceramide but enhances insulin signaling. In contrast, glucosylated ceramides have profound effects in adipocytes. For example, either ganglioside addition or human glucosylceramide synthase overexpression suppresses insulin signaling in adipocytes. These data have important mechanistic implications for understanding how these sphingolipids contribute to energy sensing and the disruption of anabolism under conditions of nutrient oversupply.
Introduction
Insulin resistance is a physiological condition that occurs when a normal dose of the hormone is incapable of inducing an appropriate anabolic response (1). The condition predisposes individuals to diabetes, hypertension, hyperlipidemia, cardiomyopathy, nonalcoholic steatohepatitis, and atherosclerosis (2). Insulin resistance is often associated with obesity, and several mechanisms have been proposed to explain the relationship. For example, obesity leads to the accumulation of various nutritional intermediates in tissues, many of which provide negative feedback to halt insulin signaling. Moreover, the condition is associated with an increased inflammatory tone, and some of the cytokines present in the circulation oppose insulin action.
The increased delivery of fat to peripheral tissues synergizes with inflammatory cytokines to generate sphingolipids (3–5). Ceramide, generated through a ubiquitous and evolutionarily conserved biosynthetic pathway, is the precursor of complex sphingolipids such as sphingomyelin, glucosylceramides, etc. Genetic or pharmacological inhibition of various sphingolipid-synthesizing enzymes (e.g., serine palmitoyltransferase, ceramide synthase(s), dihydroceramide desaturase, or glucosylceramide synthase, or GM3 synthase) is incredibly effective in the treatment of insulin resistance and its metabolic manifestations in rodents (reviewed in Refs. 6 and 7).
There are hundreds of glucosylceramides and gangliosides that might serve as antagonists of insulin action. A glycosphingolipid class that has emerged as a likely antagonist of insulin action is GM3 ganglioside (8, 9). Using cultured adipocytes, Inokuchi and co-workers (8, 9) demonstrated that the accumulation of GM3 gangliosides in caveolae membrane microdomains can affect insulin signaling by interacting with a lysine residue on the insulin receptor (Lys944) (10). This interaction displaces the insulin receptor from caveolar microdomains, uncoupling it from its downstream substrates (9, 10). Reducing glucosylceramide/ganglioside levels in mice with glucosylceramide synthase inhibitors enhances insulin signaling in adipose tissue and improves whole body insulin sensitivity and glucose tolerance (11, 12). Moreover, mice lacking GM3 synthase are protected from high fat diet-induced insulin resistance (13). Thus, GM3 or one of its downstream products is a candidate intermediate that links nutritional overload to the antagonism of peripheral insulin sensitivity.
When the studies using the glucosylceramide synthase (GCS)2 inhibitors were published, we were perplexed by their strong effects. Contrary to this view, our own studies had revealed that ceramide was the likely sphingolipid antagonist of insulin signaling. First, ceramide inhibits activation of the serine/threonine kinase Akt/PKB (14–17), an insulin signaling intermediate that accounts for virtually all of the anabolic actions of insulin. However, ceramide did so without affecting early signaling events such as IRS1 tyrosine phosphorylation or PI3K activity (17) and thus seemed to be acting at a different locus than that proposed for GM3 gangliosides. Moreover, treating myotubes with a GCS inhibitor actually increased ceramide levels and antagonized signaling to Akt/PKB (15). These data suggested that ceramide, and not a glucosylated derivative, was the sphingolipid that served as an energy sensor to block anabolism. The interpretation of these studies was complicated by the use of early generation glucosylceramide synthase inhibitors derived from N-(2-hydroxy-1-(4-morpholinylmethyl)-2-phenylethyl)decanamide monohydrochloride. These compounds simultaneously lower glucosylceramide and elevate ceramide at midmicromolar concentrations. More recently developed inhibitors demonstrate IC50 values in the nanomolar range without elevation of ceramide. The latter effect is due to inhibition of a secondary site of action 1-O-acylceramide synthase (group XV phospholipase A2) (18, 19).
Because of the differing conclusions, questions have arisen as to whether ceramides or glucosylceramides are the primary antagonists of insulin action (20). Herein we sought to obtain some resolution to our confusion and inform this debate. We examined the effects of exogenous and endogenous ceramides and glucosylceramides on insulin signaling in cultured myotubes and adipocytes using a more selective inhibitor of glucosylceramide synthase. The data reveal that both have independent roles as insulin signaling antagonists. Ceramides inhibit insulin signaling in numerous tissues, whereas glucosylceramides are preferentially efficacious in adipocytes. These findings have important implications in our understanding of the mechanism of action of these nutritional regulators, as well as for the design of new therapeutics.
EXPERIMENTAL PROCEDURES
Reagents
High glucose DMEM was from Invitrogen. The following additional reagents were obtained from Sigma-Aldrich: fetal bovine serum and bovine calf serum, palmitate, N-acetyl-d-sphingosine (C2-ceramide), fatty acid-free BSA, and 2-deoxy-d-glucose. 2-Deoxy-d-glucose 2-[1,2-3H(N)] was purchased from PerkinElmer. Recombinant mouse TNF-α and ganglioside GM3 were from EMD Chemicals, Inc. The GCS inhibitor d-threo-et-P4 was synthesized as described previously (19).
Cell Line Culturing
Mouse C2C12 myoblasts were purchased from American Type Culture Collection (Manassas, VA). 3T3-L1 fibroblast expressing coxsackie virus and adenovirus receptor (L1-CAR) were a generous gift from Haiyan Xu (Brown Medical School, Providence, RI). Cells were seeded in a 6-well plate at the density of 3 × 10⁵ cells/well. L1-CAR cells were maintained at 37 °C in DMEM containing 10% bovine calf serum and differentiated into adipocytes as described (21). C2C12 myoblasts were grown in DMEM containing 10% fetal bovine serum and differentiated into myotubes as described (15).
Palmitate and TNF-α Treatment
Palmitate was administered to C2C12 myotubes as a conjugate with fatty acid-free BSA prepared using methods described previously (14). An insulin-resistant adipocyte model was established as described previously with minor modifications (22). Briefly, on the 7th day after induction, the fully differentiated L1-CAR adipocytes maintained in DMEM-10% FBS containing 0.5% bovine serum albumin were treated with 0.6 nm of recombinant mouse TNF-α for 96 h. Cultured L1-CAR adipocytes exposed to TNF-α became insulin-resistant as assessed by the ability of insulin to stimulate glucose uptake.
Western Analysis
Upon 2 h of serum starvation, the cells were stimulated with 100 nm insulin for 10 min. The cells were lysed with sample buffer containing 66 mm Tris and 2% SDS. Protein lysates were resolved on a 10% SDS-polyacrylamide gel and transferred onto Immobilon-P transfer membranes from Millipore (Billerica, MA). Membranes were blocked in 5% milk/TBST for 1 h and incubated in primary antibody overnight at 4 °C, followed by incubation with IgG-horseradish peroxidase-conjugated secondary antibody for 1 h. Proteins bands were visualized using ECL-Advance chemiluminescent substrate (GE Healthcare) and VersaDocTM imaging system software (Bio-Rad) according to the manufacturer's instructions. Antibodies utilized included the following: rabbit polyclonal anti-phospho-Akt/PKB (Ser473), anti-Akt (pan) (40D4) mouse mAb, anti-phospho-GSK3β (Ser9), anti-phospho TBC1d1 (Thr590), and anti-Myc tag antibodies from Cell Signaling (Danvers, MA) and horseradish peroxidase-conjugated anti-rabbit and anti-mouse antibodies from Santa Cruz Biotechnology (Santa Cruz, CA).
2-Deoxyglucose Uptake Assay
The 2-deoxyglucose assay was performed using methods described previously (17).
siRNA Transfection
On-Target Plus siRNA targeting mouse UDP-glucose ceramide glucosyltransferase (UGCG, L-058491-00), and nontargeting control (D-001810-01) were purchased from Dharmacon (Lafayette, CO) and transfected using Dharmafect Duo transfection reagents following the manufacturer's instructions.
Real Time Quantitative PCR
Total RNA extraction from cells was performed using the RNeasy kit from Qiagen according to the manufacturer's instructions. To amplify human GCS (hGCS, NM_003358.1), mouse GCS (NM_011673), and mouse β-actin cDNA (NM_007393.3), sense and antisense oligonucleotide primers were designed based on the published cDNA sequences using Primer Express version 2.0.0 (Applied Biosystems). Oligonucleotides were obtained from Integrated DNA Technology (Coralville, IA). The sequences of the primers were as follows: hGCS forward, 5′-ATG TGT CAT TGC CTG GCA TG-3′ (958–977); hGCS reverse, 5′-CCA GGC GAC TGC ATA ATC AAG-3′ (1059–1039); mouse GCS forward, 5′-AGG CTT TGC TGC CAC CTT AGA-3′ (534–554); mouse GCS reverse, 5′-CGA CCT GAT GTT GCC ACT GTT-3′ (639–619); mouse β-actin cDNA forward, 5′-TGG CAT TGT TAC CAA CTG GG-3′ (219–238); and mouse β-actin cDNA reverse, 5′-GGG TCA TCT TTT CAC GGT TG-3′ (361–342). cDNA was synthesized with the iScriptTM cDNA synthesis kit (Bio-Rad) using 1 μg of total RNA in a 20-μl reaction volume. For real time PCR, the cDNA was mixed with iTaq SYBR Green Supermix with ROX to allow for quantitative detection of the PCR product in a 25-μl reaction volume. Thermal cycling was done in an ABI Prism® 7000 sequence detection system cycler (PE Applied Biosystems) under the following conditions: 95 °C for 3 min, 40 cycles of denaturation at 95 °C for 15 s, annealing at 60 °C for 1 min, and extension at 72 °C for 30 s. An internal housekeeping gene control, β-actin, was used to normalize differences in RNA isolation, RNA degradation, and the efficiencies of the RT.
Adenoviral Infection
hGCS-Myc expressing adenovirus was created by cloning hGCS cDNA (CCDS: 6782.1) containing the human c-Myc sequence 5′-AAG ATC TTC TTC AGA AAT AAG TTT CTG TTC-3′ into the shuttle vector Dual-CCM-CMV (Vector Biolabs) that contains dual CMV promoters to drive expression of hGCS-Myc. Construction of hGCS-expressing adenoviral vector (Ad-CMV-hGCS-Myc) and production of viral stocks were conducted by Vector Biolabs. C2C12, and L1-CAR cells were infected with Ad-CMV-Null or Ad-CMV-hGCS-Myc using a multiplicity of infection of 500 in serum-free DMEM for 4 h, after which FBS was added to a final concentration of 10%. 48 h after infection, cells were harvested in SDS-PAGE lysis buffer for Western blot analysis.
Animals
At 6 weeks of age, male mice (C57Bl/6) from the Jackson Laboratory (Bar Harbor, ME) were placed on standard chow or an obesogenic diet (D12492; Research Diets, Inc., New Brunswick, NJ). Studies were conducted in accordance with the principles and procedures outlined in the National Institutes of Health Guide for the Care and Use of Laboratory Animals and were approved by the Duke University Institutional Animal Care and Use Committee.
Glucose Tolerance Tests
Glucose tolerance tests were performed in conscious mice after 12 weeks of feeding. A basal (0 min) blood sample was taken via tail prick, an intraperitoneal injection of glucose (1 g/kg body mass; Sigma-Aldrich) was administered, and blood was sampled 15, 30, 45, 60, and 90 min later. Glucose was measured using a NovaMax®Plus glucose monitor (Billerica, MA). Mice were euthanized following the intraperitoneal glucose tolerance test, and tissues (quadriceps and epididymal fat pad) were collected and immediately frozen in liquid nitrogen and stored at −80 °C for further analysis.
Lipidomics
For analysis of sphingolipids, cells were washed twice in ice-cold PBS, washed once in ice-cold water, scraped in 100 μl of water, transferred to a 13-ml conical tube, centrifuged, and rapidly frozen in liquid nitrogen. For tissue analysis, 20–30-mg tissue sections (gastrocnemius muscle and intra-abdominal fat) were homogenized with zircon beads in MagNA Lyzer (Roche Applied Science) for 60 s. For each sample, 1 mg of protein was used for lipid measurements. LC/MS lipid meaurements were performed at the Lipidomics Core Facility at the Medical University of South Carolina (Charleston, SC) and the Duke-National University of Singapore Metabolomics Facility (Singapore).
Statistical Analysis
The data are presented as the means ± S.E. The results were assessed using two-tailed unpaired Student's t test or two-way analysis of variance (Tukey) as indicated. A p value of <0.05 was deemed statistically significant.
RESULTS
Overexpression of GCS Protects Cells from Palmitate-induced Insulin Resistance
GCS catalyzes the glucosylation of ceramide, which is the first step in the synthesis of an array of complex glycosphingolipids (GSLs). To evaluate whether endogenous GSLs antagonize insulin signaling in skeletal muscle, we overexpressed a Myc-tagged, human GCS in C2C12 myotubes using recombinant adenovirus (Ad-hGCS-Myc). Control cells were treated with an empty adenoviral vector (Ad-Null) (Fig. 1). Myotubes were treated with or without palmitate to fuel the pathway with substrates required for sphingolipid synthesis. GCS expression negated the inhibitory effects of palmitate, lowered cellular ceramide levels, and increased glucosylceramide content. These findings are consistent with our earlier work implicating ceramides, but not glucosylceramides, as antagonists of insulin signaling.
FIGURE 1.

Adenovirus-mediated overexpression of human GCS in C2C12 myotubes protects cells from palmitate-induced inhibition of insulin signaling. C2C12 myotubes were incubated with adenovirus encoding either an empty CMV promoter (Ad-Null) or CMV promoter in combination with the human GCS containing a Myc tag in the C terminus (Ad-hGCS-Myc). 48 h later, cells were treated with palmitate (0.75 mm, 16 h) followed by insulin stimulation (100 nm, 10 min). A, levels of transcripts encoding GCS were assayed by quantitative real time PCR analysis. B, ceramide and GC levels were quantified by LC-MS/MS as described under “Experimental Procedures.” GC levels are presented as the mean fold increase (over basal) ± S.E. Asterisks denote that the value is significantly different from basal levels (p ≤ 0.05). Double asterisks denote that the values are significantly different from each other. C, C2C12 myotubes overexpressing hGCS-Myc adenovirus were incubated in serum-free media for 2 h before stimulation with insulin (100 nm, 10 min). Cell lysates were resolved by SDS-PAGE, transferred to nitrocellulose, and immunoblotted with the indicated antibodies. D, C2C12 myotubes suffer a reduction in insulin-stimulated Akt/PKB(Ser473) phosphorylation in the presence of palmitate (0.75 mm, 16 h;) that is prevented when hGCS is overexpressed. Adenovirus-mediated hGCS overexpression was confirmed by using antibodies against Myc tag.
Exogenous Ceramide, but Not GM3 Antagonizes Insulin Signaling in Myotubes
Because of limitations in our lipidomics capabilities, we were not able to measure the whole cadre of glucosylceramides (e.g., GM3). To exclude the possibility that the limited impact of adenoviral hGCS on insulin signaling was a result of poor overexpression, we assessed the effects of exogenous GM3 ganglioside on insulin-stimulated Akt/PKB activation. Briefly, GM3 ganglioside was dissolved in Me2SO and administrated to myotubes at a concentration of 100 μm for 8 h. These conditions are comparable to those used in the prior studies showing inhibitory GM3 effects on insulin signaling in 3T3-L1 adipocytes (22) (see below). As shown in Fig. 2, the addition of GM3 ganglioside to the medium bathing C2C12s did not inhibit signaling to Akt/PKB. Similarly, it failed to inhibit phosphorylation of GSK3β and TBC1d1, substrates of Akt/PKB with numerous functions including the regulation of glycogen synthase activity and GLUT4 translocation, respectively (23, 24) (Fig. 2). In contrast, C2-ceramide (50 μm, 8 h) impaired insulin signaling (Fig. 2). Thus, GM3 appears incapable of antagonizing insulin signaling in skeletal muscle, and activation of GCS is in fact protective.
FIGURE 2.
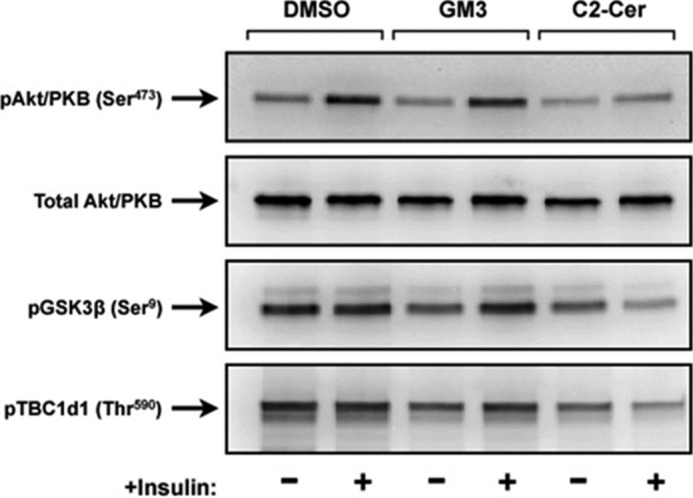
Exogenous incubation of C2C12 myotubes with GM3 ganglioside does not antagonizes insulin signaling. C2C12 myotubes were incubated in the presence or absence of the C2-ceramide (50 μm, 8 h) or GM3 (100 μm, 8 h) before stimulation with insulin (100 nm, 10 min). Cell lysates were resolved by SDS-PAGE, transferred to nitrocellulose, and immunoblotted with the indicated antibodies.
Palmitate-induced Insulin Resistance Is Unaffected by GCS Inhibition
The data showing roles for GSLs in rodent models of metabolic disease have relied on next generation GCS inhibitors that, unlike the compound used in our prior study (25), do not promote ceramide accumulation (19). As described in the introduction, these inhibitors are potently insulin sensitizing and improve glucose tolerance in rodents. Because most glucose is disposed in skeletal muscle, one would suspect that GSLs are working to antagonize insulin signaling in the tissue, as was shown in 3T3-L1 adipocytes. However, it is also possible that the improvement in muscle insulin sensitivity in vivo is secondary to effects in other tissues (e.g., liver and adipose). Herein we demonstrate that GCS inhibitors do not improve insulin sensitivity in our cultured cell model of insulin resistance.
We incubated C2C12 myotubes with the GCS inhibitor d-threo-3′,4′-ethylenedioxy-P4 (d-threo-et-P4) in the presence and absence of palmitate. As expected, d-threo-et-P4 completely prevented the palmitate-induced increase in glucosylceramides without affecting ceramide, sphingosine, or sphingosine-1-phosphate (Fig. 3A). Palmitate potently inhibited insulin-stimulated phosphorylation of Akt/PKB (Fig. 3B), and GCS inhibitors were incapable of negating this effect (Fig. 3B) (23). By contrast, myriocin, which blocks formation of ceramide (as well as its downstream metabolites), negates the palmitate effect (Fig. 4) (25).
FIGURE 3.

Inhibition of glucosylceramide synthase activity did not prevent the antagonism of insulin signaling by palmitate in C2C12 myotubes. C2C12 myotubes were incubated in the presence or absence of palmitate (0.75 mm, 16 h) and/or the GCS inhibitor d-threo-et-P4 (100 nm, 16 h). A, lipid analysis using LC-MS/MS confirmed that inhibitor d-threo-et-P4 drastically prevents GC synthesis while maintaining ceramide levels unchanged. Sphingolipids levels are presented as the mean fold increase (over basal) ± S.E. Asterisks indicate that GC values were significantly decreased. B, C2C12 myotubes treated with or without palmitate (0.75 mm, 16 h) or the inhibitor d-threo-et-P4 (100 nm, 16 h) were incubated in serum-free media for 2 h before stimulation with insulin (100 nm, 10 min). Cell lysates were resolved by SDS-PAGE, transferred to nitrocellulose, and immunoblotted with the indicated antibodies. C2C12 myotubes were transfected with siRNA targeting GCS or Scrambled control for 48 h. C, to confirm the efficiency of the knockdown, levels of transcripts encoding GCS were assayed by quantitative real time-PCR. D, data are presented as the percentages of GCS mRNA expression normalized to Scrambled basal control (100%) ± S.E., and levels of GC were determined by LC-MS/MS. GC levels are presented as the mean fold increase (over Scrambled basal control) ± S.E. Asterisks indicate that the mRNA and GC values were significantly decreased. E, transfected myotubes treated with or without palmitate were incubated in serum-free media for 2 h before stimulation with insulin (100 nm, 10 min). Cell lysates were resolved by SDS-PAGE, transferred to nitrocellulose, and immunoblotted with the indicated antibodies. Palm, palmitate.
FIGURE 4.

Myriocin prevents the inhibition of insulin signaling by palmitate while blocking ceramide and glucosylceramide accumulation. A, C2C12 myotubes were incubated in the presence or absence of palmitate (0.75 mm) or myriocin (10 μm) for 16 h before lipid extraction. Lipid levels were quantified by LC-MS/MS as described under “Experimental Procedures.” The data are presented as the mean fold increase (over basal) ± S.E. Asterisks denote that the value was significantly different from basal levels (p ≤ 0.05). Double asterisks denote that the GC levels are significantly decreased. B, C2C12 myotubes were incubated in the presence or absence of palmitate (0.75 mm, 8 h) before stimulation with insulin (100 nm, 10 min). Selected samples were treated with or without myriocin (10 μm) just before adding palmitate. Cell lysates were resolved by SDS-PAGE, transferred to nitrocellulose, and immunoblotted with the indicated antibodies.
We recapitulated the data with the GCS inhibitor using RNAi-mediated GCS gene silencing. The efficiency of the knockdown was determined using quantitative RT-PCR (Fig. 3C). GCS knockdown effectively lowered glucosylceramide levels (Fig. 3D) but failed to negate the inhibitory effects of palmitate on insulin signaling (Fig. 3E). Collectively, these data reveal that in C2C12 myotubes, nonglucosylated sphingolipids such as ceramides are the likely antagonists of insulin signaling.
GSLs Inhibit Insulin Action in Adipocytes
Contrary to our data indicating that GSLs are dispensable for insulin resistance in myotubes, several studies report that GM3 antagonizes insulin signaling in 3T3-L1 adipocytes (9–11, 13, 22). Consequently, we performed a similar battery of experiments in adipocytes, to learn that they were indeed highly efficacious. To induce an increase in GSLs, we infected L1-CAR cells with the aforementioned adenovirus encoding hGCS-Myc or treated with TNF-α, a proinflammatory cytokine that activates ceramide and GSLs formation (26). As seen in Fig. 5A, adenovirus-mediated overexpression of hGCS produced a very large increase in GC accumulation and inhibited signaling to Akt/PKB (Fig. 5B). hGCS expression also inhibited insulin-stimulated phosphorylation of GSK3β (Fig. 5B). C2-ceramide, which can be converted to GSLs through the salvage pathway, only modestly affected glucosylceramide levels but was a more potent inhibitor of Akt/PKB and GSK3β. As we published previously, the GM3 and C2-ceramide treatments did not alter expression of Akt or GSK3β (data not shown). These treatments also inhibited 2-deoxyglucose uptake (Fig. 5C).
FIGURE 5.

Increasing ceramides or glucosyceramides in adipocytes down-regulates insulin signaling. To increase endogenous GSL levels, L1-CAR adipocytes were incubated in the presence or absence of TNF-α (0.6 nm, 96 h) or C2-ceramide (C2Cer, 50 mm, 8 h) or infected with Ad-hGCS-Myc adenovirus as described under “Experimental Procedures.” A, levels of GC were quantified by LC-MS/MS as described under “Experimental Procedures.” GC levels are presented as the mean fold increase (over basal). Asterisks denote that the value was significantly different from the untreated control (p ≤ 0.05). L1-CAR adipocytes cells were serum-deprived for 2 h before insulin stimulation (100 nm, 10 min). B, cell lysates were resolved by SDS-PAGE, transferred to nitrocellulose, and immunoblotted with the indicated antibodies. C, rates of 2-deoxyglucose were determined as described under “Experimental Procedures.” Asterisks denote that the value was significantly different from basal levels (p ≤ 0.05).
High Fat Feeding Causes Differential Effects on GSL Content in Muscle versus Fat
A number of groups have quantified ceramide levels in muscle, fat, liver, and serum of obese rodents, nonhuman primates, and humans. In most studies (3, 27–40), but not all (41, 42), ceramide levels are elevated. Far fewer studies have evaluated GSL levels, and many have relied on anti-GM3 staining, thin layer chromatography, or HPLC, and not on more quantitative mass spectroscopy approaches. We thus opted to evaluate the effects of obesity on glucosylceramide in both muscle and fat.
C57BL/6J mice were subjected to either a high fat diet (HFD, 60 kcal% fat diet) or to a low fat diet (LFD, 10 kcal% fat diet) for 12 weeks. As always, HFD consumption increased body weight and impaired glucose tolerance (Fig. 6A). Moreover, the HFD blunted insulin-stimulated Akt/PKB phosphorylation at serine 473 in both muscle and adipose (Fig. 6B). As predicted, the levels of several ceramide species increased in muscle but not in fat (Table 1). Surprisingly, levels of some glucosylceramides showed a striking differential expression pattern in muscle compared with adipose. The total levels of glucosylceramide were decreased in skeletal muscle from HFD-fed, whereas those of adipose tissue were increased (Table 1). It is noteworthy to mention that the high levels of glucosylceramide observed in skeletal muscle subjected to the LFD did not affect the ability of insulin to metabolize glucose or phosphorylate Akt/PKB (Fig. 6, A and B, and Table 1).
FIGURE 6.

High fat feeding induces ceramide accumulation in skeletal muscle and glucosylceramide in adipose tissue. A, male mice (C57Bl/6) were made obese by HFD (60 kcal% fat diet) for 12 weeks. Error bars represent ± S.E. B, following the treatment period, intraperitoneal glucose (1 g/kg of body weight) tolerance test was conducted as described under “Experimental Procedures.” Error bars represent ± S.E. Gastrocnemius muscle and intra-abdominal fat were extracted from mice fed HFD or LFD (10 kcal% fat diet) following glucose tolerance test. C, tissues lysates were resolved by SDS-PAGE, transferred to nitrocellulose, and immunoblotted with anti-p-AKT (Ser473) and anti-AKT (pan) antibodies. Bars show quantification of phosphorylated protein normalized by total protein in tissue. *, p < 0.05 (n = 4).
TABLE 1.
Ceramide and glucosylceramide content in skeletal muscle and in fat tissue from mice fed an HFD for 12 weeks
Lipids from skeletal muscle (gastrocnemius muscle) and fat tissue (intra-abdominal fat) were extracted from mice receiving LFD (10 kcal% fat diet) or HFD (60 kcal% fat diet), and levels of ceramide and GC were quantified by LC-MS/MS as described under “Experimental Procedures.” Lipid levels were normalized to total protein content and presented as pmol/mg of protein ± S.E. p ≤ 0.05 (n = 6). Asterisks denote that the value is significantly different in the HFD. The values are given as pmol/mg of protein.
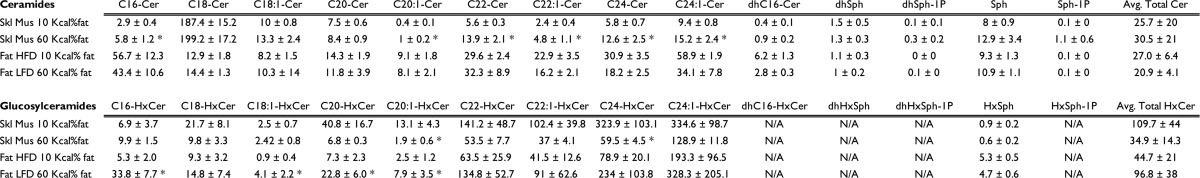
These results indicate that HFD-induced insulin resistance is associated with increased GSLs in adipose tissue and concomitantly decreased GSLs in skeletal muscle. Collectively these data identify adipose tissue as the relevant target for GSLs.
DISCUSSION
The discoveries that inhibition of ceramide (SPT, CerS, or Des1) or GSL (GCS or GM3) synthesis improves insulin sensitivity and wards off diseases associated with obesity in rodents reveal important information about metabolic disease etiology and possible therapeutic interventions. However, the discovery has led to new questions about which sphingolipids serve as metabolic regulators (20). Because all of the inhibitory events should prevent formation of glucosylceramides, the formal possibility remained that ceramides themselves were not important modulators of insulin action.
GSLs and the Adipocyte
Administration of GCS inhibitors to rodents improves whole body insulin sensitivity, and this must involve improved insulin action in skeletal muscle. Muscle accounts for the vast majority of postprandial glucose disposal, and the data that GCS inhibitors improve muscle insulin sensitivity in vivo are unequivocal (11). However, our data suggest that this is secondary to effects in other tissues, most likely the adipocyte. First, GM3 addition or GCS overexpression fails to inhibit insulin signaling in myotubes. In fact, GCS overexpression improved insulin action. Second, pharmacological inhibition or RNAi-mediated knockdown of GCS in myotubes effectively lowered GCS levels but did not negate sphingolipid-induced insulin resistance. Third, glucosylceramide levels actually went down in muscles of mice fed an obesogenic diet. In contrast, GSLs accumulated in adipocytes, where it has potent effects on insulin signaling.
There are numerous precedents for how impaired insulin signaling in adipose tissue leads to secondary effects in skeletal muscle. Most notably, ablation of the insulin-sensitive glucose transporter GLUT4 exclusively in adipose tissue leads to marked induction of insulin resistance in muscle and liver (43). Numerous mechanisms could account for the GSL effects, but they likely result from impaired synthesis of triglyceride in adipose tissue leading to the enhanced delivery of fat to peripheral tissues. This would result from the impairment in glucose uptake, which is needed to provide the glycerol moiety and or acetyl-CoA for fatty acid biogenesis, and prevention of the anti-lipolytic actions of insulin. As a result of this increased lipolysis, fatty acids are delivered to the liver and subsequently to muscle, where other lipotoxic metabolites (e.g., ceramides, diacylglycerols, lysophosphatidic acid) might accumulate. Indeed, van Eijk et al. (44) demonstrated that GCS inhibitors markedly improved the metabolic health of adipose tissue in vivo.
Supporting the hypothesis is the observation that although GCS inhibition improves hepatic insulin sensitivity and prevents hepatic steatosis, its selective ablation in the liver failed to prevent these conditions (45). Thus, the liver effects are also indirect, and we would speculate that the improvement in liver function that is observed is also likely to result from GSL action in the adipocyte.
GSL Mechanism of Action: Why Do GSLs Antagonize Insulin Signaling Only in the Adipocyte?
The “membrane microdomain disorder” model was presented by the Inokuchi group to explain how glucosylceramide derivatives such as the GM3 gangliosides may alter insulin sensitivity. As described above, GM3 gangliosides have been shown to bind IR through an electrostatic interaction with a lysine residue (Lys944) located just above the transmembrane domain (46). This interaction has proven to be detrimental to the binding of the insulin receptor and caveolin-1, which is necessary for successful insulin metabolic signaling. Why would this mechanism be irrelevant in muscle, when it is so potent in adipocytes?
A potential explanation is that caveolin-1 protein is not abundant in skeletal muscle cells, particularly when compared with adipocytes (47, 48). Indeed, adipocytes have an exceptional number of caveolae on the surface, whereas myotubes contain far fewer. Thus, caveolae and caveolin-1 likely play unique roles in adipose metabolism, and this is a probable mechanism through which GM3 selectively impairs adipose health while being relatively benign in muscle.
We note also that in skeletal muscle fed a high fat diet, there is a reduction in GCS levels, whereas they were increased in adipocytes. We noted no change in expression of the mouse GCS mRNA under these conditions, but these data may suggest inhibition of GCS activity by a post-transcriptional mechanism.
Which Glucosylceramide Is the Critical Antagonist of Insulin Signaling in the Adipocyte?
We only measured glucosylceramides as a surrogate for all glucosylated ceramides and gangliosides. Gangliosides are difficult to measure quantitatively and reliably, because of problems extracting the lipids when they have a polar head group. Thus, we do not know which class of glucosylated ceramide species are the principle antagonists of insulin action, and there are literally hundreds/thousands of distinct glucosylated ceramide species, including the glucosylceramides, lactosylceramides, and the various ganglioside classes (GM3, GD3, GD2, GD1b, GT11b, GQ1b, GM2, GM1a, GD1a, and GT1a). Each class has multiple distinct lipid species because of different acylation patterns. Ablation of GM3 synthase, which is insulin-sensitizing, blocks synthesis of the other downstream ganglioside classes. Moreover, GM3 is an upstream precursor of most gangliosides, and exogenous GM3 could easily be converted to others. Thus, the identity of the relevant ganglioside is still unclear, and multiple ones could play regulatory roles in anabolism.
Ceramide or Another Ceramide Metabolite in Muscle and Fat
Our findings reaffirm that ceramides (or another, nonglucosylated ceramide metabolites) likely impair insulin signaling downstream of the insulin receptor. Thus far, ceramide remains the most likely candidate. Pharmacologically or genetically ablating three different enzymes required for ceramide biosynthesis or overexpressing acid ceramidase or glucosylceramide synthase prevents the antagonistic effects of palmitate on insulin signaling (14, 25, 31, 49, 50). Blocking glucosylceramide synthase failed to recapitulate these effects, and in fact hGCS overexpression was protective.
We note that ceramide or another ceramide metabolite is also likely biologically active in adipose tissue. The addition of C2-ceramide, which creates other endogenous sphingolipids through the salvage pathway, was more potent at inhibiting Akt/PKB than was hGCS. Moreover, C2-ceramide had a modest effect on glucosylceramide levels (Fig. 5) and seems to work downstream of the insulin receptor and PI3K (17).
Concluding Remarks
We have demonstrated that GSLs do not inhibit insulin signaling in myotubes but have as their likely target tissue the adipocyte. By contrast, ceramides (or ceramide metabolites) antagonize signaling to Akt/PKB in multiple tissues.
Pharmacological inhibitors of serine palmitoyltransferase (51), dihydroceramide desaturase (31), and glucosylceramide synthase (11, 12) have an overlapping, broad spectrum of beneficial metabolic effects in rodents. These enzymes, which are involved in ceramide or glucosylceramide biosynthesis, are exciting new therapeutic targets. The studies using these reagents reveal quite clearly that endogenous sphingolipids are important modulators of metabolic activities.
The studies in this manuscript indicate that at least two classes of sphingolipids modulate insulin action, and they differ by both tissue specificity and by mechanism of action. Thus, the role of sphingolipids in nutrient homeostasis is highly nuanced and needs much more study. According to LIPID MAPS Lipidomics and Metabolomics Services, sphingolipids comprise 3,939 of 37,127 lipids. They differ by tissue distribution and biological effects. Determining mechanisms accounting for their effects on nutrient homeostasis and their regulation by factors associated with metabolic health (e.g., inflammatory molecules and adipokines) (3, 52) will require close attention to details and experimental limitations. The number of questions remaining is daunting but could have a revolutionary impact on our understanding of the deleterious complications affecting the obese.
Acknowledgments
We acknowledge Myles C. Cabot (John Wayne Cancer Institute, Santa Monica, CA) for the pTRE-GCS vector and Liping Wang (Duke University) for critically reviewing the manuscript before submission.
This work was supported, in whole or in part, by National Institutes of Health Grant R01DK081456-01 (to S. A. S.). This work was also supported by National Medical Research Council Grant IRG09may004 (to S. A. S.), Singapore Ministry of Education Academic Research Fund Grant MOE2009-T2-2-016 (to S. A. S.), and the Duke-NUS Signature Research Program funded by the Agency for Science, Technology and Research, Singapore, and the Ministry of Health, Singapore (to S. A. S.).
- GCS
- glucosylceramide synthase
- GC
- glucosylceramide
- hGCS
- human GCS
- HFD
- high fat diet
- LFD
- low fat diet
- GSL
- glycosphingolipid.
REFERENCES
- 1. Chavez J. A., Summers S. A. (2010) Lipid oversupply, selective insulin resistance, and lipotoxicity. Molecular mechanisms. Biochim. Biophys. Acta 1801, 252–265 [DOI] [PMC free article] [PubMed] [Google Scholar]
- 2. Reaven G. M. (1988) Banting lecture 1988. Role of insulin resistance in human disease. Diabetes 37, 1595–1607 [DOI] [PubMed] [Google Scholar]
- 3. Holland W. L., Bikman B. T., Wang L. P., Yuguang G., Sargent K. M., Bulchand S., Knotts T. A., Shui G., Clegg D. J., Wenk M. R., Pagliassotti M. J., Scherer P. E., Summers S. A. (2011) Lipid-induced insulin resistance mediated by the proinflammatory receptor TLR4 requires saturated fatty acid-induced ceramide biosynthesis in mice. J. Clin. Invest. 121, 1858–1870 [DOI] [PMC free article] [PubMed] [Google Scholar]
- 4. Gill J. M., Sattar N. (2009) Ceramides. A new player in the inflammation-insulin resistance paradigm? Diabetologia 52, 2475–2477 [DOI] [PubMed] [Google Scholar]
- 5. de Mello V. D., Lankinen M., Schwab U., Kolehmainen M., Lehto S., Seppänen-Laakso T., Oresic M., Pulkkinen L., Uusitupa M., Erkkilä A. T. (2009) Link between plasma ceramides, inflammation and insulin resistance. Association with serum IL-6 concentration in patients with coronary heart disease. Diabetologia 52, 2612–2615 [DOI] [PubMed] [Google Scholar]
- 6. Chavez J. A., Summers S. A. (2012) A ceramide-centric view of insulin resistance. Cell Metab. 15, 585–594 [DOI] [PubMed] [Google Scholar]
- 7. Aerts J. M., Boot R. G., van Eijk M., Groener J., Bijl N., Lombardo E., Bietrix F. M., Dekker N., Groen A. K., Ottenhoff R., van Roomen C., Aten J., Serlie M., Langeveld M., Wennekes T., Overkleeft H. S. (2011) Glycosphingolipids and insulin resistance. Adv. Exp. Med. Biol. 721, 99–119 [DOI] [PubMed] [Google Scholar]
- 8. Inokuchi J. (2007) Insulin resistance as a membrane microdomain disorder. Yakugaku Zasshi 127, 579–586 [DOI] [PubMed] [Google Scholar]
- 9. Kabayama K., Sato T., Kitamura F., Uemura S., Kang B. W., Igarashi Y., Inokuchi J. (2005) TNFα-induced insulin resistance in adipocytes as a membrane microdomain disorder. Involvement of ganglioside GM3. Glycobiology 15, 21–29 [DOI] [PubMed] [Google Scholar]
- 10. Kabayama K., Sato T., Saito K., Loberto N., Prinetti A., Sonnino S., Kinjo M., Igarashi Y., Inokuchi J. (2007) Dissociation of the insulin receptor and caveolin-1 complex by ganglioside GM3 in the state of insulin resistance. Proc. Natl. Acad. Sci. U.S.A. 104, 13678–13683 [DOI] [PMC free article] [PubMed] [Google Scholar]
- 11. Aerts J. M., Ottenhoff R., Powlson A. S., Grefhorst A., van Eijk M., Dubbelhuis P. F., Aten J., Kuipers F., Serlie M. J., Wennekes T., Sethi J. K., O'Rahilly S., Overkleeft H. S. (2007) Pharmacological inhibition of glucosylceramide synthase enhances insulin sensitivity. Diabetes 56, 1341–1349 [DOI] [PMC free article] [PubMed] [Google Scholar]
- 12. Zhao H., Przybylska M., Wu I. H., Zhang J., Siegel C., Komarnitsky S., Yew N. S., Cheng S. H. (2007) Inhibiting glycosphingolipid synthesis improves glycemic control and insulin sensitivity in animal models of type 2 diabetes. Diabetes 56, 1210–1218 [DOI] [PubMed] [Google Scholar]
- 13. Yamashita T., Hashiramoto A., Haluzik M., Mizukami H., Beck S., Norton A., Kono M., Tsuji S., Daniotti J. L., Werth N., Sandhoff R., Sandhoff K., Proia R. L. (2003) Enhanced insulin sensitivity in mice lacking ganglioside GM3. Proc. Natl. Acad. Sci. U.S.A. 100, 3445–3449 [DOI] [PMC free article] [PubMed] [Google Scholar]
- 14. Chavez J. A., Holland W. L., Bär J., Sandhoff K., Summers S. A. (2005) Acid ceramidase overexpression prevents the inhibitory effects of saturated fatty acids on insulin signaling. J. Biol. Chem. 280, 20148–20153 [DOI] [PubMed] [Google Scholar]
- 15. Chavez J. A., Knotts T. A., Wang L. P., Li G., Dobrowsky R. T., Florant G. L., Summers S. A. (2003) A role for ceramide, but not diacylglycerol, in the antagonism of insulin signal transduction by saturated fatty acids. J. Biol. Chem. 278, 10297–10303 [DOI] [PubMed] [Google Scholar]
- 16. Chavez J. A., Summers S. A. (2003) Characterizing the effects of saturated fatty acids on insulin signaling and ceramide and diacylglycerol accumulation in 3T3-L1 adipocytes and C2C12 myotubes. Arch. Biochem. Biophys. 419, 101–109 [DOI] [PubMed] [Google Scholar]
- 17. Summers S. A., Garza L. A., Zhou H., Birnbaum M. J. (1998) Regulation of insulin-stimulated glucose transporter GLUT4 translocation and Akt kinase activity by ceramide. Mol. Cell Biol. 18, 5457–5464 [DOI] [PMC free article] [PubMed] [Google Scholar]
- 18. Abe A., Shayman J. A. (1998) Purification and characterization of 1-O-Acylceramide synthase, a novel phospholipase A2 with transacylase activity. J. Biol. Chem. 273, 8467–8474 [DOI] [PubMed] [Google Scholar]
- 19. Lee L., Abe A., Shayman J. A. (1999) Improved inhibitors of glucosylceramide synthase. J. Biol. Chem. 274, 14662–14669 [DOI] [PubMed] [Google Scholar]
- 20. Deevska G. M., Nikolova-Karakashian M. N. (2011) The twists and turns of sphingolipid pathway in glucose regulation. Biochimie 93, 32–38 [DOI] [PMC free article] [PubMed] [Google Scholar]
- 21. Frost S. C., Lane M. D. (1985) Evidence for the involvement of vicinal sulfhydryl groups in insulin-activated hexose transport by 3T3-L1 adipocytes. J. Biol. Chem. 260, 2646–2652 [PubMed] [Google Scholar]
- 22. Tagami S., Inokuchi Ji J., Kabayama K., Yoshimura H., Kitamura F., Uemura S., Ogawa C., Ishii A., Saito M., Ohtsuka Y., Sakaue S., Igarashi Y. (2002) Ganglioside GM3 participates in the pathological conditions of insulin resistance. J. Biol. Chem. 277, 3085–3092 [DOI] [PubMed] [Google Scholar]
- 23. Summers S. A., Kao A. W., Kohn A. D., Backus G. S., Roth R. A., Pessin J. E., Birnbaum M. J. (1999) The role of glycogen synthase kinase 3β in insulin-stimulated glucose metabolism. J. Biol. Chem. 274, 17934–17940 [DOI] [PubMed] [Google Scholar]
- 24. Peck G. R., Chavez J. A., Roach W. G., Budnik B. A., Lane W. S., Karlsson H. K., Zierath J. R., Lienhard G. E. (2009) Insulin-stimulated phosphorylation of the Rab GTPase-activating protein TBC1D1 regulates GLUT4 translocation. J. Biol. Chem. 284, 30016–30023 [DOI] [PMC free article] [PubMed] [Google Scholar]
- 25. Chavez J. A., Knotts T. A., Wang L. P., Li G., Dobrowsky R. T., Florant G. L., Summers S. A. (2003) A role for ceramide, but not diacylglycerol, in the antagonism of insulin signal transduction by saturated fatty acids. J. Biol. Chem. 278, 10297–10303 [DOI] [PubMed] [Google Scholar]
- 26. Hannun Y. A. (1994) The sphingomyelin cycle and the second messenger function of ceramide. J. Biol. Chem. 269, 3125–3128 [PubMed] [Google Scholar]
- 27. Amati F., Dubé J. J., Alvarez-Carnero E., Edreira M. M., Chomentowski P., Coen P. M., Switzer G. E., Bickel P. E., Stefanovic-Racic M., Toledo F. G., Goodpaster B. H. (2011) Skeletal muscle triglycerides, diacylglycerols, and ceramides in insulin resistance. Another paradox in endurance-trained athletes? Diabetes 60, 2588–2597 [DOI] [PMC free article] [PubMed] [Google Scholar]
- 28. Bruce C. R., Risis S., Babb J. R., Yang C., Kowalski G. M., Selathurai A., Lee-Young R. S., Weir J. M., Yoshioka K., Takuwa Y., Meikle P. J., Pitson S. M., Febbraio M. A. (2012) Overexpression of sphingosine kinase 1 prevents ceramide accumulation and ameliorates muscle insulin resistance in high-fat diet-fed mice. Diabetes 61, 3148–3155 [DOI] [PMC free article] [PubMed] [Google Scholar]
- 29. Blachnio-Zabielska A. U., Koutsari C., Tchkonia T., Jensen M. D. (2012) Sphingolipid content of human adipose tissue. Relationship to adiponectin and insulin resistance. Obesity 20, 2341–2347 [DOI] [PMC free article] [PubMed] [Google Scholar]
- 30. Blachnio-Zabielska A. U., Baranowski M., Hirnle T., Zabielski P., Lewczuk A., Dmitruk I., Górski J. (2012) Increased bioactive lipids content in human subcutaneous and epicardial fat tissue correlates with insulin resistance. Lipids 47, 1131–1141 [DOI] [PMC free article] [PubMed] [Google Scholar]
- 31. Bikman B. T., Guan Y., Shui G., Siddique M. M., Holland W. L., Kim J. Y., Fabriàs G., Wenk M. R., Summers S. A. (2012) Fenretinide prevents lipid-induced insulin resistance by blocking ceramide biosynthesis. J. Biol. Chem. 287, 17426–17437 [DOI] [PMC free article] [PubMed] [Google Scholar]
- 32. Ussher J. R., Koves T. R., Cadete V. J., Zhang L., Jaswal J. S., Swyrd S. J., Lopaschuk D. G., Proctor S. D., Keung W., Muoio D. M., Lopaschuk G. D. (2010) Inhibition of de novo ceramide synthesis reverses diet-induced insulin resistance and enhances whole-body oxygen consumption. Diabetes 59, 2453–2464 [DOI] [PMC free article] [PubMed] [Google Scholar]
- 33. Frangioudakis G., Garrard J., Raddatz K., Nadler J. L., Mitchell T. W., Schmitz-Peiffer C. (2010) Saturated- and n-6 polyunsaturated-fat diets each induce ceramide accumulation in mouse skeletal muscle. Reversal and improvement of glucose tolerance by lipid metabolism inhibitors. Endocrinology 151, 4187–4196 [DOI] [PMC free article] [PubMed] [Google Scholar]
- 34. Coen P. M., Dubé J. J., Amati F., Stefanovic-Racic M., Ferrell R. E., Toledo F. G., Goodpaster B. H. (2010) Insulin resistance is associated with higher intramyocellular triglycerides in type I but not type II myocytes concomitant with higher ceramide content. Diabetes 59, 80–88 [DOI] [PMC free article] [PubMed] [Google Scholar]
- 35. Brozinick J. T., Hawkins E., Hoang Bui H., Kuo M. S., Tan B., Kievit P., Grove K. (2012) Plasma sphingolipids are biomarkers of metabolic syndrome in non-human primates maintained on a Western-style diet. Int. J. Obes. (Lond.) 37, 1064–1070 [DOI] [PMC free article] [PubMed] [Google Scholar]
- 36. Blachnio-Zabielska A. U., Pulka M., Baranowski M., Nikolajuk A., Zabielski P., Górska M., Górski J. (2012) Ceramide metabolism is affected by obesity and diabetes in human adipose tissue. J. Cell. Physiol. 227, 550–557 [DOI] [PubMed] [Google Scholar]
- 37. Chocian G., Chabowski A., Zendzian-Piotrowska M., Harasim E., Lukaszuk B., Górski J. (2010) High fat diet induces ceramide and sphingomyelin formation in rat's liver nuclei. Mol. Cell. Biochem. 340, 125–131 [DOI] [PubMed] [Google Scholar]
- 38. Haus J. M., Kashyap S. R., Kasumov T., Zhang R., Kelly K. R., Defronzo R. A., Kirwan J. P. (2009) Plasma ceramides are elevated in obese subjects with type 2 diabetes and correlate with the severity of insulin resistance. Diabetes 58, 337–343 [DOI] [PMC free article] [PubMed] [Google Scholar]
- 39. Kolak M., Westerbacka J., Velagapudi V. R., Wågsäter D., Yetukuri L., Makkonen J., Rissanen A., Häkkinen A. M., Lindell M., Bergholm R., Hamsten A., Eriksson P., Fisher R. M., Oresic M., Yki-Järvinen H. (2007) Adipose tissue inflammation and increased ceramide content characterize subjects with high liver fat content independent of obesity. Diabetes 56, 1960–1968 [DOI] [PubMed] [Google Scholar]
- 40. Adams J. M., 2nd, Pratipanawatr T., Berria R., Wang E., DeFronzo R. A., Sullards M. C., Mandarino L. J. (2004) Ceramide content is increased in skeletal muscle from obese insulin-resistant humans. Diabetes 53, 25–31 [DOI] [PubMed] [Google Scholar]
- 41. Skovbro M., Baranowski M., Skov-Jensen C., Flint A., Dela F., Gorski J., Helge J. W. (2008) Human skeletal muscle ceramide content is not a major factor in muscle insulin sensitivity. Diabetologia 51, 1253–1260 [DOI] [PubMed] [Google Scholar]
- 42. Kristensen D., Prats C., Larsen S., Ara I., Dela F., Helge J. W. (2013) Ceramide content is higher in type I compared to type II fibers in obesity and type 2 diabetes mellitus. Acta Diabetol. 50, 705–712 [DOI] [PubMed] [Google Scholar]
- 43. Abel E. D., Peroni O., Kim J. K., Kim Y. B., Boss O., Hadro E., Minnemann T., Shulman G. I., Kahn B. B. (2001) Adipose-selective targeting of the GLUT4 gene impairs insulin action in muscle and liver. Nature 409, 729–733 [DOI] [PubMed] [Google Scholar]
- 44. van Eijk M., Aten J., Bijl N., Ottenhoff R., van Roomen C. P., Dubbelhuis P. F., Seeman I., Ghauharali-van der Vlugt K., Overkleeft H. S., Arbeeny C., Groen A. K., Aerts J. M. (2009) Reducing glycosphingolipid content in adipose tissue of obese mice restores insulin sensitivity, adipogenesis and reduces inflammation. PLoS One 4, e4723. [DOI] [PMC free article] [PubMed] [Google Scholar]
- 45. Jennemann R., Rothermel U., Wang S., Sandhoff R., Kaden S., Out R., van Berkel T. J., Aerts J. M., Ghauharali K., Sticht C., Gröne H. J. (2010) Hepatic glycosphingolipid deficiency and liver function in mice. Hepatology 51, 1799–1809 [DOI] [PubMed] [Google Scholar]
- 46. Inokuchi J. (2011) Physiopathological function of hematoside (GM3 ganglioside). Proc. Jpn. Acad. Ser. B Phys. Biol. Sci. 87, 179–198 [DOI] [PMC free article] [PubMed] [Google Scholar]
- 47. Tang Z., Scherer P. E., Okamoto T., Song K., Chu C., Kohtz D. S., Nishimoto I., Lodish H. F., Lisanti M. P. (1996) Molecular cloning of caveolin-3, a novel member of the caveolin gene family expressed predominantly in muscle. J. Biol. Chem. 271, 2255–2261 [DOI] [PubMed] [Google Scholar]
- 48. Feron O., Belhassen L., Kobzik L., Smith T. W., Kelly R. A., Michel T. (1996) Endothelial nitric oxide synthase targeting to caveolae. Specific interactions with caveolin isoforms in cardiac myocytes and endothelial cells. J. Biol. Chem. 271, 22810–22814 [DOI] [PubMed] [Google Scholar]
- 49. Watson M. L., Coghlan M., Hundal H. S. (2009) Modulating serine palmitoyl transferase (SPT) expression and activity unveils a crucial role in lipid-induced insulin resistance in rat skeletal muscle cells. Biochem. J. 417, 791–801 [DOI] [PubMed] [Google Scholar]
- 50. Powell D. J., Turban S., Gray A., Hajduch E., Hundal H. S. (2004) Intracellular ceramide synthesis and protein kinase Czeta activation play an essential role in palmitate-induced insulin resistance in rat L6 skeletal muscle cells. Biochem. J. 382, 619–629 [DOI] [PMC free article] [PubMed] [Google Scholar]
- 51. Holland W. L., Brozinick J. T., Wang L. P., Hawkins E. D., Sargent K. M., Liu Y., Narra K., Hoehn K. L., Knotts T. A., Siesky A., Nelson D. H., Karathanasis S. K., Fontenot G. K., Birnbaum M. J., Summers S. A. (2007) Inhibition of ceramide synthesis ameliorates glucocorticoid-, saturated-fat-, and obesity-induced insulin resistance. Cell Metab. 5, 167–179 [DOI] [PubMed] [Google Scholar]
- 52. Holland W. L., Miller R. A., Wang Z. V., Sun K., Barth B. M., Bui H. H., Davis K. E., Bikman B. T., Halberg N., Rutkowski J. M., Wade M. R., Tenorio V. M., Kuo M. S., Brozinick J. T., Zhang B. B., Birnbaum M. J., Summers S. A., Scherer P. E. (2011) Receptor-mediated activation of ceramidase activity initiates the pleiotropic actions of adiponectin. Nat. Med. 17, 55–63 [DOI] [PMC free article] [PubMed] [Google Scholar]