

Abstract
To test the hypothesis that embryogenesis depends upon α-tocopherol (E) to protect embryo polyunsaturated fatty acids (PUFAs) from lipid peroxidation, new methodologies were applied to measure α-tocopherol and fatty acids in extracts from saponified zebrafish embryos. A solid phase extraction method was developed to separate the analyte classes, using a mixed mode cartridge (reverse phase, π–π bonding, strong anion exchange), then α-tocopherol and cholesterol were measured using standard techniques, while the fatty acids were quantitated using a novel, reverse phase liquid chromatography–mass spectrometry (LC–MS) approach. We also determined if α-tocopherol status alters embryonic lipid peroxidation products by analyzing 24 different oxidized products of arachidonic or docosahexaenoic (DHA) acids in embryos using LC with hybrid quadrupole-time of flight MS. Adult zebrafish were fed E− or E+ diets for 4 months, and then were spawned to obtain E− and E+ embryos. Between 24 and 72 hours post-fertilization (hpf), arachidonic acid decreased 3-times faster in E− (21 pg/h) compared with E+ embryos (7 pg/h, P<0.0001), while both α-tocopherol and DHA concentrations decreased only in E− embryos. At 36 hpf, E− embryos contained double the 5-hydroxy-eicosatetraenoic acids and 7-hydroxy-DHA concentrations, while other hydroxy-lipids remained unchanged. Vitamin E deficiency during embryogenesis depleted DHA and arachidonic acid, and increased hydroxy-fatty acids derived from these PUFA, suggesting that α-tocopherol is necessary to protect these critical fatty acids.
Abbreviations: ARA, 20:4 ω-6, arachidonic acid; CNS, central nervous system; dn, deuterium-labeled; δT3, delta-tocotrienol; DHA, 22:6 ω-3, docosahexaenoic acid; hpf, hours post-fertilization; HETEs, hydroxy-eicosatetraenoic acids; HDHA, hydroxy-DHA; LTA4, leukotriene A4
Keywords: Vitamin E, Embryogenesis, Neurogenesis, Arachidonic acid, Hybrid quadrupole-time of flight MS
Graphical abstract
Highlights
-
•
α-Tocopherol and fatty acids were measured using a novel extraction and LCMS methodology.
-
•
Oxidation products of arachidonic or docosahexaenoic acids were analyzed in embryo extracts using UPLC with hybrid quadrupole-time of flight MS.
-
•
Embryogenesis depletes arachidonic and docosahexaenoic acids, but these disappear faster, when α-tocopherol is insufficient to prevent lipid peroxidation.
Introduction
Traditional methods of measuring of long chain polyunsaturated fatty acids (PUFAs) by gas chromatography require derivatization and result in long retention times and broad peak shapes [1,2]. Liquid chromatography with mass spectrometry (LC–MS) using a reverse phase column has the advantage of reversing the order of retention such that peaks of interest, such as docosahexaenoic acid (DHA, 22:6 ω-3), emerge early in the chromatography. Additional advantages include shortened run times, separation does not require sample derivatization, and LCMS allows absolute quantitation by use of internal standards that co-elute with the fatty acids of interest because they are identical to the fatty acid with the exception of the stable-isotope label. These labeled fatty acids can be added prior to extraction of the sample and thus provide a measure of recovery through the multiple steps necessary to prepare the sample. We sought to develop such methods to evaluate the effect of vitamin E deficiency during embryogenesis in zebrafish.
Previously, we observed that vitamin E deficient zebrafish embryos develop morphologic abnormalities by 48 hours post-fertilization (hpf) [3]. More severe abnormalities were observed in α-tocopherol transfer protein knockdown zebrafish embryos, which by 15 hpf have a head and/or brain malformation [4]. Docosahexaenoic acid (DHA, 22:6 ω-3) is a polyunsaturated fatty acid (PUFA) required for proper embryonic neurodevelopment. DHA is highly enriched in the human central nervous system (CNS), comprising upwards of 50% of CNS PUFA content [5]. Rapid accretion of DHA within the CNS occurs during the last trimester of pregnancy in humans [6] and coincides with a time of maximal neurogenesis and synaptogenesis [7]. Studies in rats and monkeys have shown that maternal ω-3 PUFA deficiency leads to impaired fetal neurogenesis [8,9] and neuronal migration [10], reduced visual acuity [11,12], altered dopaminergic regulatory protein composition [13] and neuronal phospholipid composition [14] (and presumably signaling [15]). Adverse developmental outcomes caused by DHA inadequacy persist even after repletion with DHA [16,17], demonstrating long-lasting effects of embryonic DHA deficiency regardless of later restitution with an adequate diet. Notably, the dietary essential fatty acids, linoleic acid (18:2 ω-6) and α-linolenic acid (18:3 ω-3), comprise less than 1% of neural PUFAs [18]. The fetal liver and brain are capable of synthesizing DHA from α-linolenic [19,20]; however, this synthetic capacity decreases over time [21] and in adult humans is limited such that less than 5% of ingested α-linolenic is converted to DHA [22,23]. Additionally, greater amounts of DHA are accumulated within the developing brain when preformed DHA is supplied to the developing fetus [24,25]. Studies evaluating the efficacy of α-linolenic supplementation to preterm infants demonstrate that endogenous DHA synthesis cannot match in utero accretion rates of preformed DHA [26]. Indeed, the placenta preferentially transfers DHA over other PUFAs to the developing fetus [27,28].
Arachidonic acid (20:4 ω-6) is the most abundant ω-6 neuronal fatty acid throughout gestation and postnatal development [6]. It is a component of cellular phospholipids and functions as a precursor for lipid secondary messengers involved in numerous cell-signaling pathways. An appropriate balance between DHA and arachidonic acid is required during neonatal development, as infant formula supplemented with DHA, but lacking arachidonic acid, impaired infant growth [29]. Indeed, higher infant arachidonic acid concentrations are positively correlated with infant birth weight and length [30]. Conversely, arachidonic acid inadequacy is associated with delayed postnatal development and reduced growth [31].
In 1922, α-tocopherol (vitamin E) was discovered because rats fed rancid fat failed to carry their offspring to term [32]. Unlike other vitamins, α-tocopherol's specific biologic function, and the mechanism mediating its requirement for reproduction, remains unknown. α-Tocopherol is a lipid soluble antioxidant and co-localizes with PUFA-enriched phospholipid domains of the cell membrane [33], which are highly susceptible to peroxidation. Indeed, α-tocopherol requirements increase in parallel with dietary PUFA consumption or with an increasing index of fatty acid unsaturation [34]. Studies in experimental animals have demonstrated the importance of α-tocopherol in protecting PUFAs: adult zebrafish fed a vitamin E deficient diet have reduced visceral percentages of total ω-6 and ω-3 PUFAs [35] and feeding fish oil to rat mothers decreased fetal brain α-tocopherol concentrations [31].
DHA and arachidonic acid are enzymatically oxidized to a large class of signaling molecules with a wide array of functions [36]. Oxidation of arachidonic acid gives rise to hydroxy-eicosatetraenoic acids (HETEs) and the eicosanoids, a class of lipids that encompass the prostaglandins, prostacyclins, thromboxanes, leuokotrienes, lipoxins, and isoprostanes. Similarly, DHA oxidation gives rise to the docosanoids, which include the resolvins (D-series), neuroprotectins, and maresins, as well as intermediary monohydroxy lipids, termed HDHAs. Oxidation of DHA and arachidonic acid to these signaling molecules can occur both through enzymatic peroxidation or non-enzymatic radical-mediated peroxidation [37,38]. The three known enzymatic pathways that act upon PUFAs include the cyclooxygenase (COX), lipoxygenase (LOX), and cytochrome P450 (CYP450) pathways.
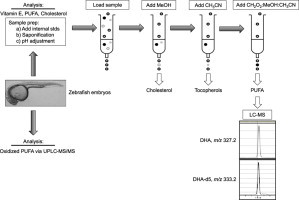
We hypothesize that embryonic development depends upon sufficient DHA, arachidonic acid and specific oxidation products of DHA and arachidonic acid, as well as sufficient α-tocopherol to protect the embryo from lipid peroxidation products. To test this hypothesis we induced vitamin E deficiency in zebrafish embryos by dietary manipulations in the parents. We developed a highly sensitive, novel method using solid phase extraction, liquid chromatography and mass spectrometry to quantify α-tocopherol, cholesterol and fatty acids in these embryos. Additionally, 24 different oxidized products of arachidonic or DHA acids were analyzed using ultra high-performance liquid chromatography coupled with hybrid quadrupole-time of flight mass spectrometry.
Methods
Ethics statement
This study was performed in strict accordance with the recommendations in the Guide for the Care and Use of Laboratory Animals of the National Institutes of Health. All protocols were approved by the Institutional Animal Care and Use Committee of Oregon State University (ACUP Number: 4344). All fish were euthanized by tricaine (MS 222, Argent Chemical Laboratories, Inc., Redmond, WA) overdose prior to sampling, and every effort was made to minimize suffering.
Fish husbandry
Tropical 5D strain zebrafish were housed in the Sinnhuber Aquatic Research Laboratory at Oregon State University and studied in accordance with protocols approved by the Institutional Animal Care and Use Committee. Adult zebrafish were kept under standard laboratory conditions at 28.5 °C with a 14 h light/10 h dark cycle. Embryos were obtained through natural group spawning, collected, and kept in standard fish water. Embryos used for analysis, described below, were euthanized by an overdose of tricaine.
Feeding study
Beginning at 50 days post-fertilization and up to 6 months, zebrafish were fed either a defined diet (described below) or a conventional zebrafish diet (hereafter referred to as “Lab”), as previously described [35]. The lab diet is a mix of commercially available foods with undefined ingredients, thus it contains large amounts of fish oil and fishmeal.
The defined diets were prepared in 300-g batches containing 143±16 mg ascorbic acid/kg (as StayC [500 mg/kg], Argent Chemical Laboratories Inc., Redmond, WA) without (E−) or with added α-tocopherol (E+, 500 mg RRR-α-tocopheryl acetate/kg diet, ADM, Decatur, IL). Measured α-tocopherol concentrations in the E− and E+ diets were 1.6±0.1 and 334±12 mg/kg, respectively. Diets were stored at −20 °C until fed to the zebrafish. The fatty acid compositions of the defined diets were described previously [35] and consisted primarily of palmitic, stearic, oleic, α-linolenic, and linoleic acids. The defined diets did not contain any PUFA with carbon chains longer than α-linolenic or linoleic acids.
Embryos from adult zebrafish fed the lab diet hereafter are called “Lab embryos”, while the embryos from adult zebrafish fed the E− or E+ diets are called “E− embryos or E+ embryos”. Note that the embryos themselves were not fed these diets, they were obtained from fish fed the diets a minimum of 4 months. The growth curves and α-tocopherol depletion curve for the adult fish and the embryo morphology were described previously [3].
Sample preparation for α-tocopherol, fatty acid, and cholesterol analyses
At 24 hpf, embryos (n=10 embryos per condition) were collected in 1.6 mL centrifuge tubes, excess water removed, and snap-frozen in liquid nitrogen and stored at −80 °C until analyzed. Embryos were added to 10 mL screw top, round-bottom, glass tubes with teflon-lined caps containing 2 mL 1% ascorbic acid in ethanol (w/v) and 1 mL Milli-Q water (Millipore, Billerica, MA). The following deuterium-labeled (d) internal standards were obtained from Cayman Chemical (Ann Harbor, MI): α-linolenic-d14, eicosapentaenoic acid-d5, DHA-d5, linoleic acid-d4, and arachidonic acid-d8. These were diluted in ethanol, and then added in amounts equivalent to the expected normal endogenous levels of respective fatty acids. Delta-tocotrienol (δT3) was added as an internal standard for α-tocopherol. Following addition of saturated KOH (300 µL), tubes were gently mixed, flushed with argon, and then placed in a water bath at 65 °C for 30 min. After cooling to room temperature, the samples were adjusted to a pH of 7.5±0.1 with 3 N HCl for solid phase extraction.
Solid phase extraction and separation of lipids
We developed a solid phase extraction method to separate the three analyte classes, using a mixed mode cartridge (reverse phase, π–π bonding, strong anion exchange, according to the manufacturer, Phenomenex, Torrance, CA). Strata-X-A 33 µm Polymeric Strong Anion Exchange cartridges (200 mg/3 mL, Phenomenex), loaded on a Zymark Rapid Trace SPE robot (Caliper Life Sciences, Hopkinton, MA), were conditioned with 3 mL methanol followed by 3 mL Milli-Q water. Saponified samples (described above) with added internal standards were then loaded onto the prepared cartridges. The elution strategy was as follows. Cholesterol, bound to the stationary phase by hydrophobic interactions, was eluted from the cartridges using 4 mL methanol. Using the robots, cartridges were partially dried with three consecutive “washes” of 6 mL air, and then α-tocopherol was eluted from the cartridge with 4 mL acetonitrile to disrupt π–π bonding. Finally, PUFAs were eluted from the cartridge with 4 mL formic acid in methanol–acetonitrile (5:47.5:47.5, v/v/v). The acidified solvent was used to overcome ionic bonding; the inclusion of acetonitrile in the latter mixture was needed to overcome the π–π bonding of the more highly unsaturated PUFAs. Extracts were dried under nitrogen, resuspended in the appropriate solvent, and then analyzed as described in the appropriate sections below. The cholesterol-containing extract was resuspended in 200 µL 1X Amplex Red Cholesterol Assay reaction buffer (Life Technologies, Carlsbad, CA), the α-tocopherol-containing extract was resuspended in 50:50 (v/v) methanol–ethanol, and the PUFA-containing extract was resuspended in methanol containing 0.1% (v/v) formic acid.
Cholesterol analyses
Cholesterol was analyzed using the Amplex Red Cholesterol Assay Kit (Life Technologies, Carlsbad, CA) according to the manufacturer's instructions. Specifically, cholesterol concentrations were determined fluorometrically using a SpectraMax Gemini XS microplate spectrofluorometer (Molecular Devices, Silicon Valley, CA) with an excitation wavelength of 545 nm and an emission wavelength of 590 nm and quantitated using authentic cholesterol standards. Cholesterol concentrations were estimated based on the various dilution factors used.
α-Tocopherol analyses
α-Tocopherol and δT3 concentrations were analyzed by high performance liquid chromatography (HPLC) with electrochemical detection, as previously described [39]. Briefly, the samples or standards were injected onto the HPLC system, the mobile phase consisted of 0.1% (w/v) lithium perchlorate in 98:2 (v/v) methanol:water, the analytes were detected using an electrochemical detector. α-Tocopherol concentrations were calculated from the peak area ratios of α-tocopherol to δT3 using authentic compounds to generate a standard curve.
Free fatty acids via LC–MS
HPLC was performed on a Shimadzu Prominence system (DGU-20A3 degasser, two LC-20AD pumps, CMB-20A control module, and SIL-20AC HT autosampler) coupled through an electrospray ionization source to a single quadrupole MS (LC–MS 2010A Shimadzu, Columbia, MD) operated in negative single ion monitoring mode (Table 1 for analyte m/z ratios). The mass spectrometer acquisition time was set at 0.5 s, the detector voltage at 1.5 kV, the curved desolvation line temperature at 230 °C, the block temperature at 200 °C, and the nitrogen nebulizing gas at 2.5 mL/min. Drying gas pressure was set to 0.1 MPa. Chromatographic separations were carried out on an Ascentis Express C8 column (15 cm×2.1 mm×2.7 µm, Supelco, Bellefonte, PA) with matching guard column. Mobile phases consisted of 0.05% (v/v) acetic acid in (A) Milli-Q water and in (B) methanol with a total flow of 0.2 mL/min. The elution gradient was 0 min, 80% B; 12 min, 85% B; 15 min, 85% B; 18 min, 100% B; 22 min, 100% B; 22 min, 80% B. The injection volume was 1 µL. The C8 LC/MS column (Ascentis Express), which is a superficially porous C8 column, was used with the optimized solvent gradient to resolve isobaric positional isomers of free fatty acids, which was confirmed using authentic standards. For example, gamma-linolenic acid (18:3 ω-6) was resolved from α-linolenic (18:3 ω-3), enabling accurate quantitation of the latter. Analyte concentrations were calculated from the peak area ratios of authentic compounds (obtained from Cayman Chemicals) to internal standards.
Table 1.
PUFAs and hydroxy-PUFAs: abbreviations and detection characteristics.
| Analyte | Abbreviation | m/z, [M–H]− |
|---|---|---|
| Fatty acids | ||
| Linoleic acid (18:2 ω-6) | linoleic acid | 279.2 |
| Linoleic acid-d4 | linoleic acid-d4 | 283.2 |
| Arachidonic acid (20:4 ω-6) | arachidonic acid | 303.2 |
| Arachidonic acid-d8 | arachidonic acid-d8 | 311.2 |
| α-Linolenic acid (18:3 ω-3) | α-linolenic | 277.2 |
| α-Linolenic acid-d14 | α-linolenic-d14 | 291.2 |
| Eicosapentaenoic acid (20:5 ω-3) | eicosapentaenoic | 301.2 |
| Eicosapentaenoic acid-d5 | eicosapentaenoic-d5 | 306.2 |
| Docosahexaenoic acid (22:6 ω-3) | DHA | 327.2 |
| Docosahexaenoic acid-d5 | DHA-d5 | 332.2 |
| Hydroxy-fatty acids | Abbreviation | m/z→m/z (XIC) |
| Derived from DHA | ||
| 7-hydroxy-4Z,8E,10Z,13Z,16Z,19Z – DHA | 7-HDHA | 343.2−141.0 |
| 10-hydroxy-4Z,7Z,11E,13Z,16Z,19Z – DHA | 10-HDHA | 343.2−153.0 |
| 14-hydroxy-4Z,7Z,10Z,12E,16Z,19Z – DHA | 14-HDHA | 343.2−205.1 |
| 17-hydroxy-4Z,7Z,10Z,13Z,15E,19Z – DHA | 17-HDHA | 343.2−201.1 |
| Derived from arachidonic acid (eicosatetraenoic acid; ETE) | ||
| 5-hydroxy-6E,8Z,11Z,14Z – ETE | 5-HETE | 319.2−115.0 |
| 12-hydroxy-5Z,8Z,10E,14Z – ETE | 12-HETE | 319.2−179.1 |
| 20-HETE-d6 | 325.2−281.2 | |
Precision and recovery experiments
Lab embryos (n=300) from zebrafish under our standard conditions were collected at 5 hpf, homogenized in 3 mL 1% ascorbic acid (w/v) in ethanol, and stored at −80 °C until analyzed. Six replicate aliquots (100 µL) were extracted and analyzed for PUFAs and α-tocopherol (described above) on three different days. Within-day, between-day, and total imprecision were calculated according to the method of Krouwer and Rabinowitz [40,41]. Recovery was calculated relative to a methanol sample, spiked with an equivalent concentration of internal standards as samples used for precision experiments, analyzed without prior extraction on three different days.
Analysis of PUFAs by LC–MS
We developed novel methods for the analysis of PUFAs with optimized HPLC gradient conditions. Total run time was 30 min, which includes the 8 min required for column re-equilibration between runs. Typical retention times were linoleic acid 10.9 min, arachidonic acid 10.8 min, α-linolenic 8.8 min, eicosapentaenoic acid 8.7 min, and DHA 10.5 min. Calibration curves relating the amount of analyte injected on column to the area ratio of each PUFA to its respective deuterated analog showed linear responses in the following ranges (ng injected on column): linoleic acid, 1–125 ng; arachidonic acid, 1–160 ng; α-linolenic, 0.5–25 ng; eicosapentaenoic, 0.4–50 ng; and DHA, 0.5–200 ng. The lower limit of detection for each PUFA was approximately 0.1 ng injected on column, while the lower limit of quantitation was approximately 0.2 ng injected on column.
Oxidized lipid extraction and UPLC-MS/MS
At 24 or 36 hpf, embryos (n=200, or n=100, respectively, as indicated in figure legends) were collected in 1.6 mL tubes, water removed, and snap-frozen in liquid nitrogen. All samples were stored at −80 °C until analysis. Embryos were transferred to 10 mL screw-top, round bottom, glass tubes with teflon-lined caps, homogenized in 3 mL ice-cold 66% LC–MS grade methanol containing internal standard 20-HETE-d6 (20-hydroxy-5Z,8Z,11Z,14Z-eicosatetraenoic acid-d6, m/z 325.2→281.2, Cayman Chemical), and placed at −80 °C for 1 h. The embryo homogenate was then transferred to 1.6 mL polypropylene tubes and centrifuged at 3000g at 4 °C for 15 min. The supernatant was collected and dried under nitrogen. Samples were resuspended in 100 µL methanol with 0.1% formic acid (v/v) and transferred to injection vials. Ultra high-performance liquid chromatography was performed using a 4 µL injection onto a Shimadzu Nexera system (Shimadzu, Columbia, MD) coupled to a hybrid quadrupole-time of flight MS (TripleTOF™ 5600, AB SCIEX). Chromatographic separations were carried out on a Brownlee Analytical DB AQ C18 column (100×2.1 mm, 1.9 µm, PerkinElmer). The flow rate was 0.35 mL/min and mobile phases consisted of water (A) and acetonitrile (B), both with 0.1% formic acid. The elution gradient was 0 min, 35% B; 2.5 min, 50% B; 7 min, 64.4% B; 9 min, 100% B; 12 min, 100% B; 12.5 min, 35% B; and 13.5 min, 35% B. Column temperature was held at 40 °C. Mass spectrometry was performed using an electrospray ionization source. The instrument was operated in high-resolution product ion mode and negative ion polarity. Product ion accumulation time was 0.12 s for each parent ion; collision energies were between −15 and −25 V. Scan range for each product ion experiment was m/z 40–450. Ion source gas 1 and 2 and curtain gas (all nitrogen) were set at 50, 40, and 25, respectively. The source temperature was set at 500 °C and IonSpray voltage at −5.5 kV. Two-min auto calibrations were performed hourly. In preliminary experiments of lab embryos (data not shown), we found that only 5-HETE, 12-HETE, 7-HDHA, 10-HDHA, 14-HDHA, and 17-HDHA were detectable in the embryo extracts. The m/z ratios of fragments were used for identification in post-acquisition filtering (Table 1; Figs. 1 and 2). Standard curves of each of these lipids at concentrations of 1000, 100, 10 μg/L were generated. Area counts were corrected for recovery of the internal standard and concentrations were calculated using standard curves generated from the authentic compounds, which were injected on three separate occasions during the sample analysis.
Fig. 1.

Structures of hydroxy-lipids. Shown are the structures of 5-HETE, 12-HETE, 7-HDHA, 10-HDHA, 14-HDHA, and 17-HDHA.
Fig. 2.
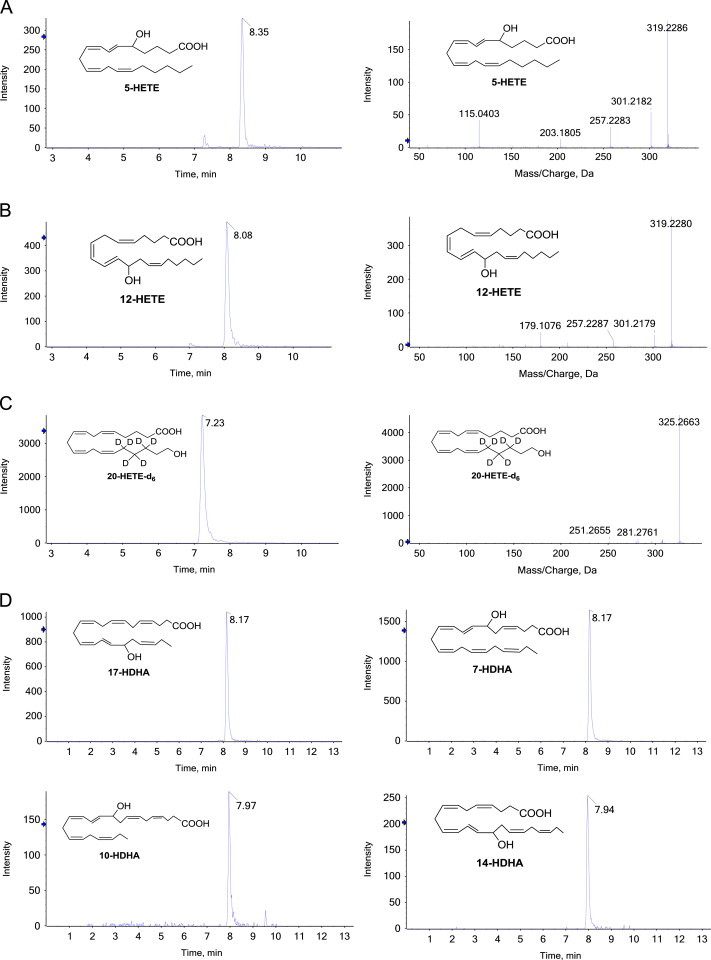
Chromatograms and fragmentation patterns of hydroxy-lipids. Shown in A, B, C are the chromatograms (left panel) and fragmentation patterns (right panel) of authentic samples of 5-HETE, 12-HETE, 20-HETE-d6, respectively. Shown in D are the chromatograms of 7-HDHA, 10-HDHA, 14-HDHA, and 17-HDHA, as indicated. These hydroxy fatty acids were detectable in extracts of zebrafish embryos at 24 hpf. Table 1 shows the mass spectrometry detection characteristics (m/z ratios).
Statistics
Statistical analysis was performed using GraphPad Prism (GraphPad Software, San Diego, CA). Time-course E− and E+ embryo PUFAs were analyzed using two-way ANOVA; time course for each PUFA was analyzed by repeated measures one-way ANOVA. Time-course PUFAs in lab embryos were analyzed separately using a two-way ANOVA. Multiple paired comparisons were carried out using a Tukey test. E− and E+ embryo hydroxy-PUFA data were analyzed using a t-test. Data were log-transformed when unequal variances were observed between groups, as confirmed by Bartlett's test for equal variances. When hydroxy-lipids were below levels of detection, Fisher's exact test was used to assess statistical significance.
Results
Fatty acid, cholesterol and α-tocopherol precision and recovery
To test precision, six aliquots of the embryo homogenate were analyzed in three separate batches over a 2-week time period. The within-day and between-day variance did not exceed 5% for any of the PUFA or α-tocopherol concentrations (Table 2). Analyte recovery exceeded 70% for each PUFA, but was 50%–60% for α-tocopherol. Cholesterol recovery was not determined since we did not have labeled-cholesterol or a validated method for labeled cholesterol measurements using LC/MS; additionally this measure was not a focus of our experiments. It should be noted that all values reported have been corrected using the added internal standards for PUFAs and tocopherol.
Table 2.
Precision of PUFA, α-tocopherol, and cholesterol measurements in 5 h post-fertilization zebrafish embryos.
| Mean±SDa | Within-day CVb (%) | Between-day CV (%) | Total CV (%) | % Recovery | ||
|---|---|---|---|---|---|---|
| Linoleic acid | ng/embryo | 2.1±0.1 | 3 | 0 | 3 | 77±2 |
| Arachidonic acid | ng/embryo | 0.7±0.0 | 2.8 | 2.4 | 3.7 | 77±2 |
| α-Linolenic acid | ng/embryo | 0.2±0.0 | 4.5 | 1.8 | 4.9 | 75±3 |
| Eicosapentaenoic acid | ng/embryo | 1.3±0.1 | 3.4 | 0 | 3.4 | 82±5 |
| DHA | ng/embryo | 21.9±0.8 | 3.1 | 1.4 | 3.4 | 80±3 |
| α-Tocopherol | pmol/embryo | 91.4±5.7 | 3.9 | 3.1 | 5 | 57±4 |
| Cholesterol | nmol/embryo | 10.3±2.5 | 24.9 | 0 | 24.9 | NDc |
Mean±SD of six replicate aliquots (100 µL) of zebrafish embryos extracted and analyzed on three different days. Embryos (5 hours post-fertilization) were from adults fed standard laboratory diets.
CV= (SD/mean)×100.
Not determined.
Analysis of PUFAs in zebrafish embryos fed a laboratory diet
We established a time course of concentrations of unsaturated and polyunsaturated fatty acids of interest (linoleic acid, arachidonic acid, α-linolenic acid, eicosapentaenoic acid, DHA) during normal zebrafish embryonic development. Zebrafish (fed a commercial laboratory diet) were spawned and embryos harvested at 3, 24, 48 and 72 hpf. Embryo fatty acid concentrations did not change significantly between 3 and 24 hpf (Fig. 3), suggesting that the fatty acids present were those deposited in the eggs by the zebrafish mother. Notably, the DHA concentrations were about 20-fold more than the other fatty acids measured, reflecting the abundant fish oil and fishmeal present in the diets fed to the adult zebrafish. Between 24 and 72 hpf, all PUFA fatty acids decreased when expressed per embryo (Fig. 3). The rates of decrease were greatest for DHA (65 pg/h), followed by linoleic acid (12 pg/h) and eicosapentaenoic (7 pg/h), while α-linolenic and arachidonic acid decreased similarly and more slowly (2 pg/h).
Fig. 3.
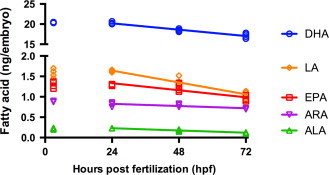
| Fatty acid | ANOVA | 3 vs 24 h | 24 vs 48 h | 24 vs 72 h | 48 vs 72 h |
| Tukey paired comparisons | |||||
| DHA | <0.0001 | NS | P<0.05 | P<0.05 | P<0.05 |
| EPA | <0.0001 | NS | NS | P<0.05 | P<0.05 |
| ALA | <0.0001 | NS | P<0.05 | P<0.05 | P<0.05 |
| ARA | <0.0001 | P<0.05 | NS | P<0.05 | P<0.05 |
| LA | <0.0001 | NS | P<0.05 | P<0.05 | P<0.05 |
- DHA=−0.065X+21.77, R2=0.913, P<0.0001;
- eicosapentaenoic=−0.007X+1.506, R2=0.7474, P=0.0003;
- α-linolenic=−0.002X+0.285, R2=0.9272, P<0.0001;
- arachidonic acid=−0.002X+0.882, R2=0.6068, P=0.0028;
- linoleic acid=−0.01208X+1.932, R2=0.9159, P<0.0001.
α-Tocopherol deficiency alters PUFA concentrations and utilization during embryonic development
We have reported that the E− embryos suffered increased morbidity and mortality as a result of inadequate α-tocopherol status [3]. We hypothesize that α-tocopherol is required during embryonic development specifically to protect DHA and arachidonic acid and that these critical PUFA are depleted during α-tocopherol deficiency. PUFA concentrations were measured in E− and E+ embryos from 3 to 72 h. It should be noted that the defined diets contain no fatty acids longer than C18; thus, initial concentrations of arachidonic acid and DHA found in eggs are derived from adult zebrafish synthesis of arachidonic acid and DHA from linoleic acid and α-linolenic, respectively. This requirement is not the case for zebrafish fed the lab diet, which contains fish oil, and thus the PUFA concentrations observed in embryos are not directly comparable between diets.
E− embryos contained 40-fold less α-tocopherol compared with E+ embryos (P<0.0001, Fig. 4F). α-Tocopherol concentrations in the embryos did not change between 3 and 24 hpf and did not change in E+ embryos up to 72 hpf. However, α-tocopherol concentrations in E− embryos decreased at 11 pmol/h between 24 and 72 hpf.
Fig. 4.
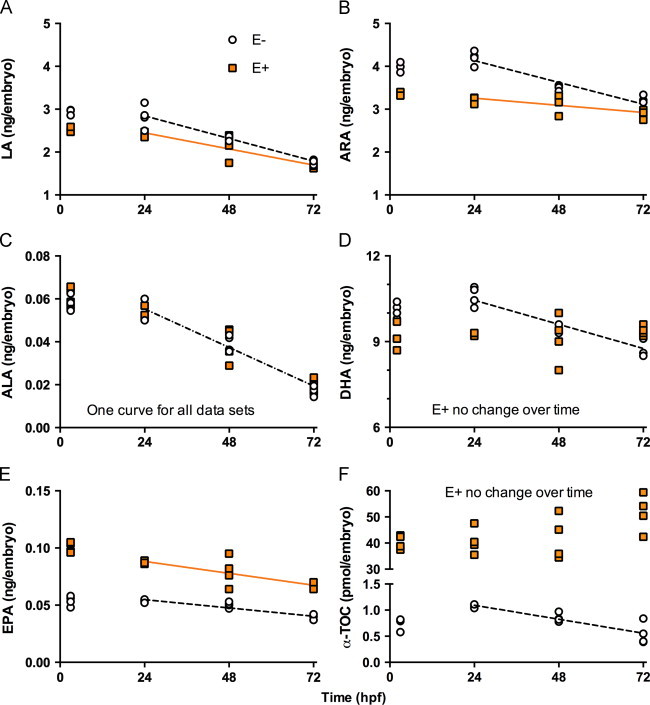
| Comparisons between E− and E+ embryos, at 3 and 24 hpf | ||||
| Graph: | PUFA | Diet×time interaction | Time | Diet |
| A | Linoleic acid | NS | NS | P=0.0002 |
| B | Arachidonic acid | P=0.0089 | NS | P<0.0001 |
| D | DHA | NS | NS | P<0.0001 |
| E | Eicosapentaenoic | P=0.0042 | P=0.0033 | P<0.0001 |
- E− linoleic acid=−0.022X+3.373, R2=0.9039, P<0.0001;
- E+ linoleic acid=−0.016X+2.826, R2=0.7593, P=0.0005; E− vs E+ slope, P=0.0491;
- E− arachidonic acid=−0.021X+4.643, R2=0.898, P<0.0001;
- E+ arachidonic acid=−0.007X+3.425, R2=0.4768, P=0.0187; E− vs E+ slope, P=0.008;
- E− DHA=−0.035X+11.29, R2=0.7879, P=0.0001;
- E+ DHA no significant change; E− vs E+ slope, P=0.0013;
- E− eicosapentaenoic=−0.0003X+0.0621, R2=0.8328, P<0.0001; E+ eicosapentaenoic= −0.0004X+0.099, R2=0.5816, P=0.0063; E− vs E+ slope, NS, P=0.301.
α-Tocopherol status altered the embryonic PUFA concentrations, as well as the magnitude of change in PUFAs during development (Fig. 4). At 3 hpf, E− embryos on average contained 0.4 ng more linoleic acid (Fig. 4A, P=0.0002) and 0.7 ng more arachidonic acid (Fig. 4B, P<0.0001) compared with the E+ embryos. In E− embryos, linoleic acid decreased at 22 pg/h (Fig. 4A), and arachidonic acid decreased at 21 pg/h (Fig. 3B), while in E+ embryos the rates of decrease in these omega-6 fatty acid concentrations were slower (linoleic acid 16 pg/h, P=0.0051 and arachidonic acid 7 pg/h, P<0.0001). With regard to omega-3 fatty acids, no differences in α-linolenic concentrations at 3 hpf or throughout development were observed between E− and E+ embryos, although concentrations in both groups decreased at 0.7 pg/h (Fig. 4C). However, stark differences were noted between E− and E+ embryos in eicosapentaenoic and DHA concentrations. E+ embryos contained double the eicosapentaenoic concentrations of E− embryos throughout the 72 h of the study (Fig. 4E). Eicosapentaenoic levels decreased in both groups with the decrease in E+ embryos occurring at a greater rate (0.4 pg/h) than in the E− embryos (0.3 pg/h, P<0.0001). Interestingly, at 3 hpf E− embryos contained 0.9 ng more DHA than did E+ embryos; DHA concentrations did not significantly change in either group between 3 and 24 hpf (Fig. 4D). Subsequently, E− embryos' DHA concentrations decreased at rate of 35 pg/h, while E+ embryos' DHA concentrations were unchanged (P=0.0018 for comparison of treatments). Finally, cholesterol concentrations did not differ between E− and E+ embryos (data not shown).
α-Tocopherol deficiency increases HETE and docosanoid concentrations
We have previously demonstrated that E− embryos appear normal at 36 hpf, but by 48 hpf, 50% of E− embryos display developmental defects [3]. We hypothesized that α-tocopherol is needed to mediate the production of hydroxy-PUFAs, specifically HETEs and HDHAs. Thus, we measured hydroxy-PUFAs at 36 hpf to discern if altered production of these signaling molecules precedes observable malformations in E− embryos. Using authentic standards, we searched for 24 specific hydroxy-PUFAs. Of the 24 analytes, only 5-HETE, 12-HETE, 7-HDHA, 10-HDHA, and 14-HDHA were detectable in zebrafish embryos fed our defined diets. E− embryos had significantly increased concentrations of 5-HETE and 7-HDHA compared with E+ embryos (Table 3). 12-HETE, 10-HDHA, 14-HDHA, and 17-HDHA did not significantly change in E− embryos compared with E+ embryos.
Table 3.
Hydroxy-PUFAs in E− and E+ embryos at 36 hpf.
| Hydroxy PUFA |
E− |
E+ |
t-test |
|---|---|---|---|
| (pg/embryo) | N=4 | N=3 | P value |
| 5-HETE | 82±11 | 33±21 | 0.0099 |
| 12-HETE | 166±53 | 123±47 | NS |
| 7-HDHA | 45±9 | 19±9 | 0.0107 |
| 10-HDHA | 7±3 | 4±2 | NS |
| 14-HDHA | 16±6 | 15±10 | NS |
| 17-HDHA | 43±6 | 28±13 | NS |
Data shown as mean±SD of 100 embryos per N sample.
Discussion
Based on our previous measurements of PUFAs in zebrafish embryos [35], this new LC–MS method allowed us several advantages: (1) the number of embryos used per sample was reduced 10-fold, (2) PUFAs, α-tocopherol, and cholesterol were measured in the same extract of embryos, (3) lengthy derivatizations of PUFAs were avoided, and (4) absolute quantitation and recovery for each individual PUFA was determined. This method should be generally applicable to any situation where small sample sizes are necessary.
α-Tocopherol deficiency increased the PUFA concentrations in the early (3 hpf) zebrafish embryo. A similar phenomenon was observed in eggs from vitamin E deficient chickens [42], suggesting that the mother can increase the PUFA concentrations in eggs in times of oxidative stress. α-Tocopherol deficiency also increased the rate of decline of embryonic PUFA concentrations, as well as increasing the hydroxy-PUFA concentrations from 24 to 72 hpf (Fig. 4). In both E− and E+ embryos, as well as in the lab embryos, PUFA concentrations declined, as development progressed. Monroig et al. [43] previously reported that linoleic acid and α-linolenic decline during zebrafish development, whereas potential products of linoleic acid and α-linolenic (sum of all other ω-6 and ω-3 PUFAs, respectively) increase during embryogenesis relative to total lipid content. We observed that α-tocopherol deficiency increased the rate of decline in PUFAs, which could reflect increased losses due to lipid peroxidation.
Notably, the highly peroxidizable DHA declined in E− embryos, but did not change in E+ embryos. Concurrently, 7-HDHA was elevated in E− embryos compared with E+ embryos. Radical-mediated lipid peroxidation could produce the increase in 7-HDHA measured in E− embryos at 36 hpf. A limitation of this study is the lack of chiral analysis of the monohydroxy fatty acids [44]. We have presumed that these monohydroxy fatty acids are of enzymatic origin; however, non-enzymatic autoxidation can play a significant role and α-tocopherol can act as an antioxidant in this process [45,46]. However, not all HDHAs increased coordinately with α-tocopherol deficiency, which is suggestive of a regulatory mechanism controlling the peroxidation of DHA. LOX activity is mediated by cellular hydroperoxide tone [36]. With α-tocopherol deficiency, it is reasonable to assume that the cellular hydroperoxide tone increases, and consequently, that LOX activity would increase and account for the noted increase in HDHA. Interestingly, only 5-HETE and 7-HDHA increased in E− embryos, suggesting that 5-LOX was specifically activated by vitamin E deficiency.
In summary, we demonstrated using novel methodologies that α-tocopherol modulates PUFA and hydroxy-PUFA homeostasis during vertebrate embryogenesis. Additionally, we have developed highly sensitive methods for the analysis of fatty acids, cholesterol and α-tocopherol in small biologic samples.
Acknowledgments
Grant support: Natl Inst Food & Agri (NIFA) 2009-65200-05846 and NIH, DK094600 (DBJ); HL081721 (JFS); NICHD HD062109 (MGT and RLT). These studies were supported by a center grant: NIEHS ES000210.
Peter Momjian of Phenomenex for sample cartridges and for technical advice.
Footnotes
This is an open-access article distributed under the terms of the Creative Commons Attribution-NonCommercial-ShareAlike License, which permits non-commercial use, distribution, and reproduction in any medium, provided the original author and source are credited.
References
- 1.Morrison W.R., Smith L.M. Preparation of fatty acid methyl esters and dimethylacetals from lipids with boron fluoride–methanol. J. Lipid Res. 1964;5:600–608. [PubMed] [Google Scholar]
- 2.Tripathy S., Torres-Gonzalez M., Jump D.B. Elevated hepatic fatty acid elongase-5 activity corrects dietary fat-induced hyperglycemia in obese C57BL/6J mice. J. Lipid Res. 2010;51:2642–2654. doi: 10.1194/jlr.M006080. [DOI] [PMC free article] [PubMed] [Google Scholar]
- 3.Miller G.W., Labut E.M., Lebold K.M., Floeter A., Tanguay R.L., Traber M.G. Zebrafish (Danio rerio) fed vitamin E-deficient diets produce embryos with increased morphologic abnormalities and mortality. J. Nutr.Biochem. 2012;23:478–486. doi: 10.1016/j.jnutbio.2011.02.002. [DOI] [PMC free article] [PubMed] [Google Scholar]
- 4.Miller G.W., Ulatowski L., Labut E.M., Lebold K.M., Manor D., Atkinson J., Barton C.L., Tanguay R.L., Traber M.G. The α-tocopherol transfer protein is essential for vertebrate embryogenesis. PLoS One. 2012;7:e47402. doi: 10.1371/journal.pone.0047402. [DOI] [PMC free article] [PubMed] [Google Scholar]
- 5.Bazan N.G., Molina M.F., Gordon W.C. Docosahexaenoic acid signalolipidomics in nutrition: significance in aging, neuroinflammation, macular degeneration, Alzheimer's, and other neurodegenerative diseases. Annu. Rev. Nutr. 2011;31:321–351. doi: 10.1146/annurev.nutr.012809.104635. [DOI] [PMC free article] [PubMed] [Google Scholar]
- 6.Martinez M. Tissue levels of polyunsaturated fatty acids during early human development. J. Pediatr. 1992;120:S129–138. doi: 10.1016/s0022-3476(05)81247-8. [DOI] [PubMed] [Google Scholar]
- 7.Green P., Yavin E. Mechanisms of docosahexaenoic acid accretion in the fetal brain. J. Neurosci. Res. 1998;52:129–136. doi: 10.1002/(SICI)1097-4547(19980415)52:2<129::AID-JNR1>3.0.CO;2-C. [DOI] [PubMed] [Google Scholar]
- 8.Cao D., Kevala K., Kim J., Moon H.S., Jun S.B., Lovinger D., Kim H.Y. Docosahexaenoic acid promotes hippocampal neuronal development and synaptic function. J. Neurochem. 2009;111:510–521. doi: 10.1111/j.1471-4159.2009.06335.x. [DOI] [PMC free article] [PubMed] [Google Scholar]
- 9.Coti Bertrand P., O'Kusky J.R., Innis S.M. Maternal dietary (n-3) fatty acid deficiency alters neurogenesis in the embryonic rat brain. J. Nutr. 2006;136:1570–1575. doi: 10.1093/jn/136.6.1570. [DOI] [PubMed] [Google Scholar]
- 10.Yavin E., Himovichi E., Eilam R. Delayed cell migration in the developing rat brain following maternal omega 3 alpha linolenic acid dietary deficiency. Neuroscience. 2009;162:1011–1022. doi: 10.1016/j.neuroscience.2009.05.012. [DOI] [PubMed] [Google Scholar]
- 11.Neuringer M., Connor W.E., Van Petten C., Barstad L. Dietary omega-3 fatty acid deficiency and visual loss in infant rhesus monkeys. J. Clin. Invest. 1984;73:272–276. doi: 10.1172/JCI111202. [DOI] [PMC free article] [PubMed] [Google Scholar]
- 12.Neuringer M., Connor W.E., Lin D.S., Barstad L., Luck S. Biochemical and functional effects of prenatal and postnatal omega 3 fatty acid deficiency on retina and brain in rhesus monkeys. Proc. Natl. Acad. Sci. U.S.A. 1986;83:4021–4025. doi: 10.1073/pnas.83.11.4021. [DOI] [PMC free article] [PubMed] [Google Scholar]
- 13.Kuperstein F., Eilam R., Yavin E. Altered expression of key dopaminergic regulatory proteins in the postnatal brain following perinatal n-3 fatty acid dietary deficiency. J. Neurochem. 2008;106:662–671. doi: 10.1111/j.1471-4159.2008.05418.x. [DOI] [PubMed] [Google Scholar]
- 14.Hamilton L., Greiner R., Salem N., Jr., Kim H.Y. n-3 fatty acid deficiency decreases phosphatidylserine accumulation selectively in neuronal tissues. Lipids. 2000;35:863–869. doi: 10.1007/s11745-000-0595-x. [DOI] [PubMed] [Google Scholar]
- 15.Akbar M., Calderon F., Wen Z., Kim H.Y. Docosahexaenoic acid: a positive modulator of Akt signaling in neuronal survival. Proc. Natl. Acad. Sci. U.S.A. 2005;102:10858–10863. doi: 10.1073/pnas.0502903102. [DOI] [PMC free article] [PubMed] [Google Scholar]
- 16.Anderson G.J., Neuringer M., Lin D.S., Connor W.E. Can prenatal N-3 fatty acid deficiency be completely reversed after birth? Effects on retinal and brain biochemistry and visual function in rhesus monkeys. Pediatr. Res. 2005;58:865–872. doi: 10.1203/01.pdr.0000182188.31596.5a. [DOI] [PubMed] [Google Scholar]
- 17.Harauma A., Salem N., Jr., Moriguchi T. Repletion of n-3 fatty acid deficient dams with α-linolenic acid: effects on fetal brain and liver fatty acid composition. Lipids. 2010;45:659–668. doi: 10.1007/s11745-010-3443-y. [DOI] [PubMed] [Google Scholar]
- 18.Sastry P.S. Lipids of nervous tissue: composition and metabolism. Prog. Lipid Res. 1985;24:69–176. doi: 10.1016/0163-7827(85)90011-6. [DOI] [PubMed] [Google Scholar]
- 19.Scott B.L., Bazan N.G. Membrane docosahexaenoate is supplied to the developing brain and retina by the liver. Proc. Natl. Acad. Sci. U.S.A. 1989;86:2903–2907. doi: 10.1073/pnas.86.8.2903. [DOI] [PMC free article] [PubMed] [Google Scholar]
- 20.Su H.M., Huang M.C., Saad N.M., Nathanielsz P.W., Brenna J.T. Fetal baboons convert 18:3n-3 to 22:6n-3 in vivo. A stable isotope tracer study. J. Lipid Res. 2001;42:581–586. [PubMed] [Google Scholar]
- 21.Carnielli V.P., Simonato M., Verlato G., Luijendijk I., De Curtis M., Sauer P.J., Cogo P.E. Synthesis of long-chain polyunsaturated fatty acids in preterm newborns fed formula with long-chain polyunsaturated fatty acids. Am. J. Clin. Nutr. 2007;86:1323–1330. doi: 10.1093/ajcn/86.5.1323. [DOI] [PubMed] [Google Scholar]
- 22.Burdge G.C., Wootton S.A. Conversion of α-linolenic acid to eicosapentaenoic, docosapentaenoic and docosahexaenoic acids in young women. Br. J. Nutr. 2002;88:411–420. doi: 10.1079/BJN2002689. [DOI] [PubMed] [Google Scholar]
- 23.Burdge G.C., Calder P.C. Conversion of α-linolenic acid to longer-chain polyunsaturated fatty acids in human adults. Reprod. Nutr. Dev. 2005;45:581–597. doi: 10.1051/rnd:2005047. [DOI] [PubMed] [Google Scholar]
- 24.Ozias M.K., Carlson S.E., Levant B. Maternal parity and diet (n-3) polyunsaturated fatty acid concentration influence accretion of brain phospholipid docosahexaenoic acid in developing rats. J. Nutr. 2007;137:125–129. doi: 10.1093/jn/137.1.125. [DOI] [PubMed] [Google Scholar]
- 25.Greiner R.C., Winter J., Nathanielsz P.W., Brenna J.T. Brain docosahexaenoate accretion in fetal baboons: bioequivalence of dietary α-linolenic and docosahexaenoic acids. Pediatr. Res. 1997;42:826–834. doi: 10.1203/00006450-199712000-00018. [DOI] [PubMed] [Google Scholar]
- 26.Lapillonne A., Jensen C.L. Reevaluation of the DHA requirement for the premature infant. Prostaglandins Leukot. Essent. Fatty Acids. 2009;81:143–150. doi: 10.1016/j.plefa.2009.05.014. [DOI] [PubMed] [Google Scholar]
- 27.Larque E., Demmelmair H., Gil-Sanchez A., Prieto-Sanchez M.T., Blanco J.E., Pagan A., Faber F.L., Zamora S., Parrilla J.J., Koletzko B. Placental transfer of fatty acids and fetal implications. Am. J. Clin. Nutr. 2011;94:1908S–1913S. doi: 10.3945/ajcn.110.001230. [DOI] [PubMed] [Google Scholar]
- 28.Haggarty P., Page K., Abramovich D.R., Ashton J., Brown D. Long-chain polyunsaturated fatty acid transport across the perfused human placenta. Placenta. 1997;18:635–642. doi: 10.1016/s0143-4004(97)90004-7. [DOI] [PubMed] [Google Scholar]
- 29.Carlson S.E., Cooke R.J., Werkman S.H., Tolley E.A. First year growth of preterm infants fed standard compared to marine oil n-3 supplemented formula. Lipids. 1992;27:901–907. doi: 10.1007/BF02535870. [DOI] [PubMed] [Google Scholar]
- 30.Elias S.L., Innis S.M. Infant plasma trans, n-6, and n-3 fatty acids and conjugated linoleic acids are related to maternal plasma fatty acids, length of gestation, and birth weight and length. Am. J. Clin. Nutr. 2001;73:807–814. doi: 10.1093/ajcn/73.4.807. [DOI] [PubMed] [Google Scholar]
- 31.Amusquivar E., Ruperez F.J., Barbas C., Herrera E. Low arachidonic acid rather than α-tocopherol is responsible for the delayed postnatal development in offspring of rats fed fish oil instead of olive oil during pregnancy and lactation. J. Nutr. 2000;130:2855–2865. doi: 10.1093/jn/130.11.2855. [DOI] [PubMed] [Google Scholar]
- 32.Evans H.M., Bishop K.S. On the existence of a hitherto unrecognized dietary factor essential for reproduction. Science. 1922;56:650–651. doi: 10.1126/science.56.1458.650. [DOI] [PubMed] [Google Scholar]
- 33.Atkinson J., Harroun T., Wassall S.R., Stillwell W., Katsaras J. The location and behavior of α-tocopherol in membranes. Mol. Nutr. Food Res. 2010;54:641–651. doi: 10.1002/mnfr.200900439. [DOI] [PubMed] [Google Scholar]
- 34.Valk E.E., Hornstra G. Relationship between vitamin E requirement and polyunsaturated fatty acid intake in man: a review. Int. J. Vitam. Nutr. Res. 2000;70:31–42. doi: 10.1024/0300-9831.70.2.31. [DOI] [PubMed] [Google Scholar]
- 35.Lebold K.M., Jump D.B., Miller G.W., Wright C.L., Labut E.M., Barton C.L., Tanguay R.L., Traber M.G. Vitamin E deficiency decreases long-chain PUFA in zebrafish (Danio rerio) J. Nutr. 2011;141:2113–2118. doi: 10.3945/jn.111.144279. [DOI] [PMC free article] [PubMed] [Google Scholar]
- 36.Haeggstrom J.Z., Funk C.D. Lipoxygenase and leukotriene pathways: biochemistry, biology, and roles in disease. Chem. Rev. 2011;111:5866–5898. doi: 10.1021/cr200246d. [DOI] [PubMed] [Google Scholar]
- 37.Lee S.H., Blair I.A. Targeted chiral lipidomics analysis of bioactive eicosanoid lipids in cellular systems. BMB Rep. 2009;42:401–410. doi: 10.5483/bmbrep.2009.42.7.401. [DOI] [PMC free article] [PubMed] [Google Scholar]
- 38.Mesaros C., Lee S.H., Blair I.A. Analysis of epoxyeicosatrienoic acids by chiral liquid chromatography/electron capture atmospheric pressure chemical ionization mass spectrometry using [13C]-analog internal standards. Rapid Commun. Mass Spectrom. 2010;24:3237–3247. doi: 10.1002/rcm.4760. [DOI] [PMC free article] [PubMed] [Google Scholar]
- 39.Podda M., Weber C., Traber M.G., Milbradt R., Packer L. Sensitive high-performance liquid chromatography techniques for simultaneous determination of tocopherols, tocotrienols, ubiquinols, and ubiquinones in biological samples. Methods Enzymol. 1999;299:330–341. doi: 10.1016/s0076-6879(99)99033-x. [DOI] [PubMed] [Google Scholar]
- 40.Krouwer J.S., Rabinowitz R. How to improve estimates of imprecision. Clin. Chem. 1984;30:290–292. [PubMed] [Google Scholar]
- 41.Krouwer J.S. Observations on comparisons of within-run and day-to-day precision. Clin. Chem. 1981;27:202. [PubMed] [Google Scholar]
- 42.Galobart J., Barroeta A.C., Baucells M.D., Cortinas L., Guardiola F. α-Tocopherol transfer efficiency and lipid oxidation in fresh and spray-dried eggs enriched with omega3-polyunsaturated fatty acids. Poult. Sci. 2001;80:1496–1505. doi: 10.1093/ps/80.10.1496. [DOI] [PubMed] [Google Scholar]
- 43.Monroig O., Rotllant J., Sanchez E., Cerda-Reverter J.M., Tocher D.R. Expression of long-chain polyunsaturated fatty acid (LC-PUFA) biosynthesis genes during zebrafish Danio rerio early embryogenesis. Biochim. Biophys. Acta. 2009;1791:1093–1101. doi: 10.1016/j.bbalip.2009.07.002. [DOI] [PubMed] [Google Scholar]
- 44.Oh S.F., Vickery T.W., Serhan C.N. Chiral lipidomics of E-series resolvins: aspirin and the biosynthesis of novel mediators. Biochim. Biophys. Acta. 2011;1811:737–747. doi: 10.1016/j.bbalip.2011.06.007. [DOI] [PMC free article] [PubMed] [Google Scholar]
- 45.Gleissman H., Yang R., Martinod K., Lindskog M., Serhan C.N., Johnsen J.I., Kogner P. Docosahexaenoic acid metabolome in neural tumors: identification of cytotoxic intermediates. FASEB J. 2010;24:906–915. doi: 10.1096/fj.09-137919. [DOI] [PMC free article] [PubMed] [Google Scholar]
- 46.Lindskog M., Gleissman H., Ponthan F., Castro J., Kogner P., Johnsen J.I. Neuroblastoma cell death in response to docosahexaenoic acid: sensitization to chemotherapy and arsenic-induced oxidative stress. Int. J. Cancer. 2006;118:2584–2593. doi: 10.1002/ijc.21555. [DOI] [PubMed] [Google Scholar]