Abstract
Melanoma is a solid tumour with its own specificity from the biological and morphological viewpoint. On one hand, numerous mutations are already known affecting different pathways. They usually concern proliferation rate, apoptosis, cell senescence and cell behaviour. On the other hand, several visual criteria at the tissue level are used by physicians in order to diagnose skin lesions. Nevertheless, the mechanisms between the changes from the mutations at the cell level to the morphology exhibited at the tissue level are still not fully understood. Using physical tools, we develop a simple model. We demonstrate analytically that it contains the necessary ingredients to understand several specificities of melanoma such as the presence of microstructures inside a skin lesion or the absence of a necrotic core. We also explain the importance of senescence for growth arrest in benign skin lesions. Thanks to numerical simulations, we successfully compare this model to biological data.
Melanoma is a rare form of skin cancer, less than 5% of the cases, but the most lethal and more than 75% of deaths1. However, recent drug discoveries and targeted therapies indicate evidence for durable remissions but no guaranty can be given yet on drug resistance2. It is why early detection and diagnosis remain of utmost importance3 and the evolution of melanocytic lesion morphology remains an important diagnostic tool.
In order to distinguish benign lesions, nevi, from melanomas, physicians have several visual features at their disposal, the most famous one being the ABCDE criteria: Asymmetry, Border, Color, Diameter, Evolution3. They are based on medical statistical studies coupled to the malignancy probability of a skin lesion. Nevertheless, the mechanism of their apparition and evolution remains poorly understood.
Since the work of Greenspan in 19764, several approaches have been developed to model tumour growth5, continuum models at the tissue scale6, discrete models at the cell scale7,8, and hybrid continuum-discrete models9. But, in spite of their complexity, none of these models take into account the specificity of melanoma. Even in the avascular growth phase, most of them do not exhibit a necrotic core. Introducing only the minimal set of physical parameters, we develop a simple model that can explain how changes at the cell level result in melanoma morphology. We aim to justify the absence of a necrotic core despite the absence of angiogenesis. But first we need to recall briefly the bio-structure and the biology of the skin.
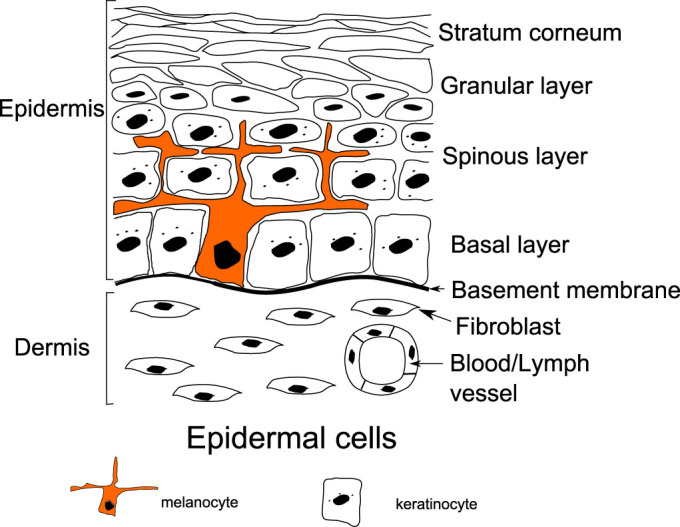
Skin is composed of three main layers, the hypodermis, the dermis and the epidermis. In this work, we focus on skin cancers located in the upper layer of the skin, the epidermis, where tumors can easily be seen and are well referenced. Beneath the epidermis, the dermis contains blood and lymphatic networks providing nutrient supply. It is separated from the epidermis by a basement membrane composed of fibers like collagen. This basement membrane plays the role of a barrier between the dermis and the epidermis, but also the support necessary for cell mitosis. The epidermis is mainly composed of keratinocytes (~90%). They proliferate on the basal layer, and progressively migrate to the skin surface creating a protective barrier called the stratum corneum (see Fig. 1). In order to protect the body from UV damages, melanocytes (~5–10% of epidermis cells), also located in the basal layer of the epidermis, strongly bind to several keratinocytes (~3510) delivering them melanin, an UV absorbing molecule. Melanocytes are bound to the basement membrane via collagen IV and laminin-mediated adhesion, and to keratinocytes via E-cadherin and Desmoglein (see the Supplementary). In order to divide, melanocytes need to decouple from the basement membrane and from the keratinocytes, and finally they retract their dendrites. After dividing, they migrate before re-binding to the matrix and to keratinocytes.
Figure 1. Schematic representation of the two outmost layers of the skin, the dermis and the epidermis.
Through mutations, melanocytic cells change their behaviour resulting in different types of lesions. The most benign one is the nevus, also known as “regular mole”. On the contrary, the dysplastic nevus known as atypical mole display most of the visual characteristics of a melanoma (irregular border, asymmetry) but they are also benign, because of an extension arrest through a senescence process. When a lesion becomes malignant, it is called a melanoma. Usually melanomas undergo different phases. In the radial growth phase (RGP) melanomas grow horizontally and are restricted to the epidermis, then in the vertical growth phase (VGP) melanomas invade the dermis rapidly and drastically lowering the survival rate11. (see Fig. 2).
Figure 2. Pigmented lesions given their malignancies.
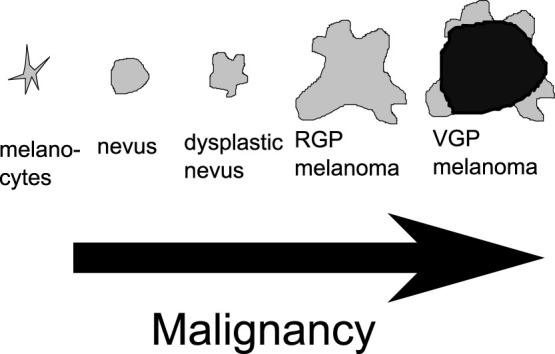
The nevi are senescent and benign. The RGP melanomas are immortal but restricted to the epidermis, and the VGP are invasive. This drawing was inspired by13.
Here, we focus on growth restricted to the epidermis, nevi and melanoma in situ or RGP melanoma. In this phase, melanomas are treated by excision with a very good survival rate (more than 99% of cases11), the metastasis spreading being unlikely. At this point, growth is avascular, and even though angionesis does not occur, the peculiarity of melanoma is the absence of necrotic core during the horizontal development: this is contrary to other solid tumours and to usual modelling of avascular tumour growth where a necrotic core is commonly found. Nonetheless, a necrotic core can appear during the vertical growth of the lesion. For instance, nodular melanomas (~15% of cutaneous melanoma) grow vertically from the beginning and present a necrotic core12.
Focusing on these main differences and cell micro-environment, we now construct a model in order to explain the different features of melanoma, and its different stages of progression as seen in Fig. 2.
Results
Modeling the morphonenesis of melanocytic lesion at the tissue level
We present here a continuous model of melanoma growth as a two phase mixture, a cancerous phase, ϕc, containing the proliferating melanocytic cells and a second healthy phase containing the interstitial fluid and the keratinocytes, ϕh = 1 − ϕc. Both phases contain nutrients ensuring cell development. Hereafter, we explicit the equations governing each population, beginning by the nutrient equations.
Nutrients are small molecules which diffuse inside the tissues and their concentration n satisfies a diffusion equation with consumption. Many kinds of nutrients intervene to maintain the homeostasis and growth of the tumour such as glucose36, oxygen34,35 and growth factors. They satisfy the same equation with different biochemical factors. Only oxygen, the slowest one, that is the one with the longest consumption time will control the growth dynamic. Due to skin hypoxia (small concentration of oxygen in the skin), consumption is described by a linearized Michaelis-Menten law, and we get:
 |
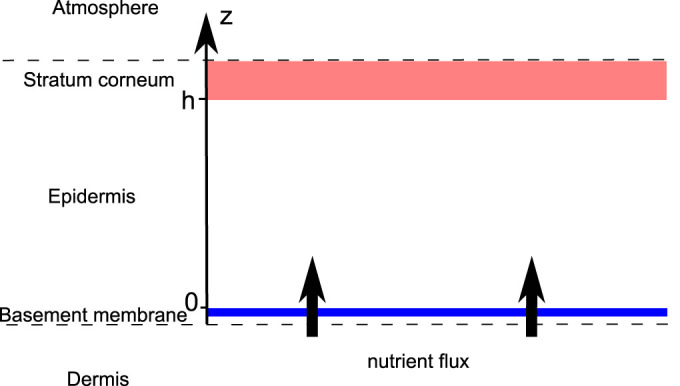
where Δ is the 2D Laplacian (see the Supplementary), n and ϕc are now the concentration averaged along the epidermis depth, ns is a typical nutrient concentration necessary to maintain the homeostatic state of the skin. Sn(ns − n) is the orthogonal flux of nutrients which is generated by the disequilibrium from the homeostatic state, coming from the dermis (see Fig. 3). This flux regulates the oxygen consumption insuring the nutrient provision and so the natural development of cells on the basement membrane in healthy tissue, including keratinocytes. It is mainly responsible for the absence of a necrotic core inside a growing melanoma in situ. Let us consider now the cancerous cell equation.
Figure 3. Schematic representation of the epidermis.
Assuming the same density for the two phases, ϕc and ϕh, the mass balance equation can be written for each phase:
 |
where Γ is the mass exchange rate between each phase, and Γ(ϕc, n) = −Γ(ϕh, n).  and
and  are the velocities of the cancerous and healthy phase. The closure condition imposes the proliferation rate of each phase to be the opposite of each other. We choose the simplest form for the mass exchange between the two phases, Γ(ϕc, n). Cancerous cell death rate is taken constant, while the growth rate depends linearly on nutrient and cancer cell concentrations. Finally it reads:
 |
In order to ascertain the velocity  : mechanical ingredients are needed. A variational principle (see the Supplementary) in conjunction with the elimination of ϕh = 1 − ϕc14,15 leads to a Darcy law for the velocity of the cancerous phase
  :
:
 |
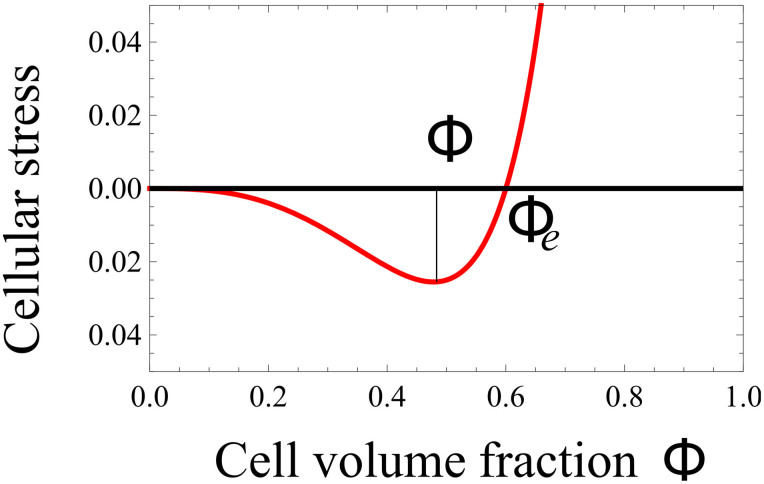
where Σ(ϕc) is the derivative of the free-energy of cancerous cell-cell interactions with respect to ϕc. As the cell-cell interaction is weak at low concentration, becoming repulsive at high concentration and attractive in between, f(ϕc) in Eq.(4) has a simple form reminding the Lennard-Jones potential (see Fig. 4). A surface term  is added to Σ(ϕc) penalizing large concentration gradients.
Figure 4. Σ, derivative of the free-energy as a function of concentration, f(ϕc) representing the attraction between melanocytic cells.
ϕe is the concentration at equilibrium with the surrounding tissue.
Gathering the former equations gives us a master equation for the cancerous phase ϕc:
 |
This model takes into account most of the cellular pathways affected by melanoma: apoptotosis in the term δ, proliferation in γ, and cell-cell interactions in Σ(ϕ).
The governing equations for the nutrient concentration and cancerous phase, (1) and (5) can be rewritten in terms of dimensionless quantities:  ,
,  ,
,  ,
,  ,
,  ,
,  ,
,  , β = Sn/δn,
  where
where  is the nutrient penetration length and
  is the typical value of the excess pressure generated by the cell (typical value of Σ). Notice that uncertainties in the precise knowledge of biomechanical factors do not change our treatment and main results. As an example, different values of the oxygen diffusion coefficient can be found in the literature34,35 depending on the location inside the skin and on the orientation (see Table 1). These uncertainties in the oxygen diffusion coefficient (a factor two is commonly found) enter only in the pattern length-scale (by a factor 1.4) without changing the results drastically. Dropping the hats and the index for the cancerous phase for simplification, the dimensionless equations are restricted to:
 |
 |
Table 1. Estimation of the model parameters from experimental data on healthy and diseased skin.
| ϕe cell volume fraction at mechanical equilibrium | 0.6–0.9 | 28 |
| M interphase friction | 963–11571 mm−2 Pa day | 29, 30 |
| χ interstitial fluid pressure in healthy skin | 133 Pa | 28 |
| χ interstitial fluid pressure in skin carcinoma | 1330 Pa | 28 |
 melanoma cell size melanoma cell size |
6–20 μm | 31 |
| γc melanoma cell proliferation rate | 0.2 day−1 | 32 |
| δc threshold for cell death rate due to anoxia | 0.1–0.33 | 33 |
| Dn Oxygen lateral diffusion coefficient in the stratum corneum | 39.7 mm2 day−1 | 34 |
| Dn Oxygen perpendicular diffusion coefficient | 18.5–26.6 mm2 day−1 | 35 |
| Dn Sugar diffusion coefficient | 4.4–6.4 mm2 day−1 | 36 |
| δn Oxygen consumption rate of the skin | 1190–3310 day−1 | 35 |
| Sn | 104 day−1 | 14 |
| ns Oxygen partial pressure in the skin | 3320–10400 Pa | 35 |
| ln nutrient penetration length | 0.04–0.18 mm | |
| D | 1.7–1725 | |
 |
0.02–0.5 | |
| δ | 0.1–0.33 | |
| β | 0.1–8.4 | |
| κ | 0.1–10 |
Analytical predictions
Although simplified in comparison with avascular tumour growth modeling5, these two equations remain difficult to solve explicitly and numerics is required. It is why we begin by an analysis of possible explicit cases.
One can grasp the main results of Eq. (6) and (7) by focusing on the simplest solutions compatible with these equations. Then, we study the dynamical stability of such solutions. We consider first the time evolution of the tumour concentration.
This set of Eq.(6,7) accepts obvious time and space independent solutions both for ϕ and n given by
 |
 |
This set exists if and only if β does not vanish. Let us remind that β measures the strength of the vertical flux of nutrients, being a specificity of the melanoma geometry in the epidermis. It does not exist for spheroid as example. Let us consider now the possibility of small micro-stuctures and averaged quantities on a scale larger than their size but smaller than the tumour size. In this hypothesis, neglecting the mass creation at the interface and all border effects, integrating equations (6) and (7) on a surface immersed in the lesion, and taking nutrients at equilibrium give us:
 |
This equation can be solved by an exponential law, whose decreasing time constant is τ = 1/δ. So, inside a wide enough tumour, after a typical time about 5 τ, the average concentrations 〈ϕ〉x and 〈n〉x should be given by (8) and should be constant over time. As expected the nutrient diffusion from the dermis insures the existence of such homogeneous state for the cancer cell population which is in contradiction with the existence of a stable necrotic core (Γ = 0 and ϕc ≠ 0 inside the tumor). However, our average does not consider the border, the tumour grows through the border, in analogy with epithelial cell colony experiments where mitosis is localised at the border16.
We show that the large scale concentration inside a lesion is given by (8), but the structure at small scale could be more complicated with emergence of microstructures.
Space distribution analysis
An exact solution of the concentration inside the tumour cannot be found analytically, a numerical simulation is needed. Nevertheless, it is possible to predict mathematically the existence of a phase separation. An homogeneous distribution inside the tumour with 〈ϕ〉x = ϕc.s.h. exists if this solution is stable when perturbations occur. It is why we perform a linear stability analysis in the vicinity of the stationary homogeneous solution. An infinitesimal perturbation of wavevector k can be written as:
 |
 |
The stability of the uniform concentration inside the tumour (8) is insured by a negative growth rate λ < 0 for all values of the spatial wavevector k. Therefore, substituting these expressions in equations (6) and (7), we obtain the growth rate of the perturbation:
 |
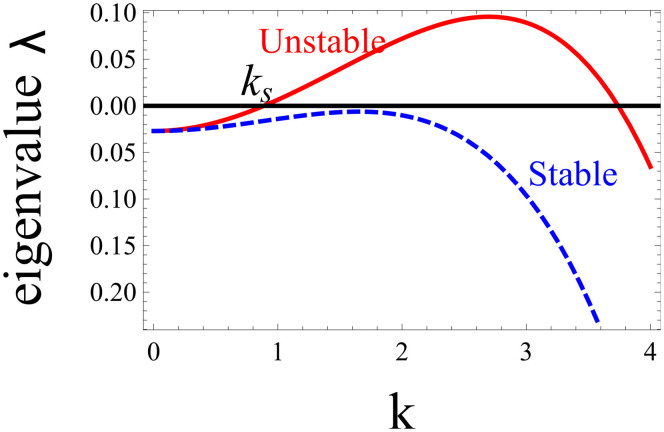
The diagram of λ(k) displayed in Fig. 5 shows that the nutrient contribution in the last term of Eq. (12) stabilizes the long wavelength perturbations with small k. This insures that the average concentration inside the tumour 〈ϕ〉x is given by (8)17. Because of this stabilization, an homogeneous distribution of the concentration inside the tumour may be stable at all wavelengths (dashed curve of Fig. 5) and microstructures may not automatically appear. The domain size of microstructures is determined by the nutrient penetration length, showing an effect of the micro-environment of the lesion.
Figure 5. Growth rate λ of a spatial instability inside the tumour versus the wavenumber k of a spatial perturbation.
Long-wavelengths, small k are stabilized due to nutrients. The homogeneous distribution of the mixture is linearly unstable for f′(ϕ0) = 0.1 (continuous line), while it becomes stable for f′(ϕ0) = −0.03 (dashed line). Other material parameters are set at  , D = 2.0, β = 0.2, ϕ0 = 0.3, κ = 0. The parameters taken for the continuous line lead to a phase separation then predicting micro-stuctures, whereas for the dashed line the concentration should remain uniform.
Discussion
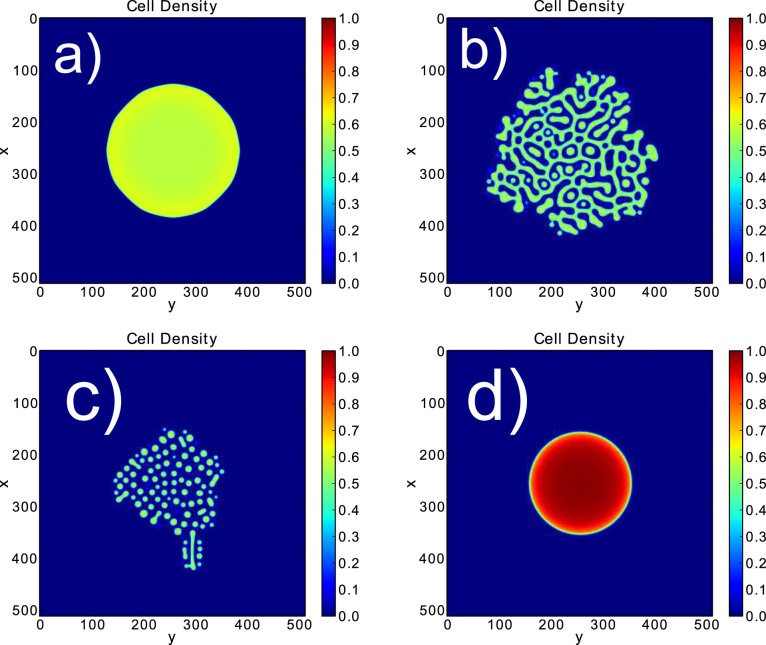
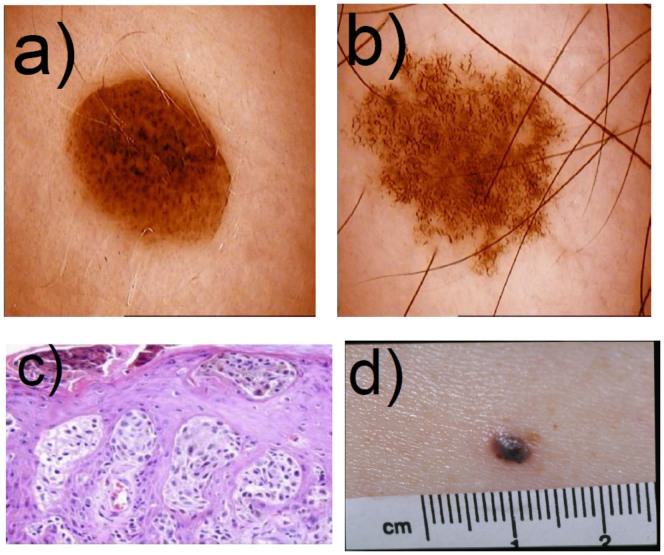
Our simulations (see Fig. 6 and Materials and Methods) exhibit several behaviours that are also seen in vivo. Microstructural patterns appear in the second and third simulations. Their origin is a phase separation process. It corresponds to the dots observed in dermoscopy and to the nests seen in histopathology (see Fig. 7b and Fig. 7c). Since the concentration inside microstructures is close to the mechanical equilibrium concentration ϕe, the simulations show that with this separation process cells insure their mechanical equilibrium at small scales. In the same time, they insure their equilibrium at large scales, because the long-scale concentration is given by the interaction with nutrients and the difference between proliferation and death as predicted previously (see Analytical predictions).
Figure 6. Several behaviours shown in the simulations on a 512 × 512 grid.
The stepsize dx is 0.12, the steptime is 10−4. The same expression for Σ is chosen for all pictures, p = 2 and ϕe = 0.6. Different values of ϕc.s.h are taken 0.65 for (a), 0.33 for (b), 0.25 for (c) and 1.3 for (d).
Figure 7.
a) Picture of a nevus presenting regular border. b) Picture of a dysplastic nevus presenting irregular border and microstructures. c) Histopathological cut of a melanoma presenting melanoma nests. d) Picture of a nodular melanoma. Figures a), b) and d) were kindly given by Dr. Pascale Guitera. Figure c) was taken from the work of Viros25.
Moreover, this phase separation leads to a growth asymmetry, whereas in the first picture the radial symmetry is preserved. Therefore, this model explains for the clinical differences between nevi and melanomas. In addition and especially a necrotic core is not found. But, the asymmetry and irregularity displayed in the simulation can be attributed to either a melanoma or a dysplastic nevus that actually show the same aspect at the tissue level. While the micro-environment can be responsible for the different characteristics between a nevus, a dysplastic nevus or a melanoma, the difference between dysplastic nevus and melanoma is the existence of growth arrest for the nevus which stops its final size.
For a range of biological parameters, this model leads to ϕc.s.h. > 1 which seems to be inconsistent. The choice of Σ with a divergence as ϕ → 1, should prevent the concentration to exceed one. Nevertheless, because of the geometry chosen, restriction to a 2D model for the epidermis and a continuous flux of incoming nutrient, the concentration may diverge in the simulation. The growth of a circular tumour of size R is proportional to the size of the border:
 |
whereas the development inside the tumour is proportional to the size of the tumour itself so to its surface:
 |
As  , above a critical radius Rc, the geometry of the avascular growth can lead to a divergence of the cell concentration. This seems like a failure of the model, with no biological consistency. But, the system can either change its shape in order to increase the size border compared to the volume creating a shape instability18,19, or grow in depth. A type of melanoma called nodular melanoma grows vertically from the first stages of its development. It invades the dermis quickly and keeps a round and symmetric border, and usually exhibits a exophytic nodule (small bump)20 (see Fig. 7d). These findings are shown in the simulation of Fig. 6, where the cell concentration is really high and diverges. Taking into account the cellular repulsion that could break the basement membrane, it is clear that the model cannot be restricted to the epidermis and that a 3D model should be developed to investigate the vertical growth phase.
Melanogenesis cannot be restricted to a small number of mutations. Moreover, the nature and number of these mutations differ from a patient to another. Nevertheless, these mutations affect mainly 4 pathways: proliferative, anti-apoptotic, senescence, and cell interactions pathways. For instance, among the most common mutations (80–90% of cases), the p16 mutation leads to evade senescence13,21, an irreversible arrest of proliferation. The most common trigger for senescence is the telomere shortening, limiting the number of population doubling (pd) from 2 to 40 pd for adult melanocytes21. This number can differ for dysplastic nevi if the senescence pathways are affected, how they are affected, or if their surrounding medium changes22. All cellular activities stop after the lesion reaches a certain size when senescence is triggered. Another switch is the shift from E-cadherin (a protein which links together the melanocytes to keratinocytes) to N-cadherin that insures cell-cell adhesion between melanoma cells with the production of melanoma cells adhesion molecules called Mel-CAM23,24. This shift results in a radical change in cell interaction, favoring melanoma cell-melanoma cell contacts to melanoma cell-keratinocyte.
An important question remains unsolved by our model: the growth arrest which occurs for dysplastic nevi for example. This growth can be limited by senescence. In the model, senescence is responsible of the maximum tumour size corresponding to a threshold in population doublings (pd), after which there is no more exchange of mass between phases, Γ(ϕc, n) = 0. The number of pd is not rigorously determined, varying from 2 up to 4013. Moreover, it surely varies with the micro-environment and it differs in a tumour2 from the one estimated in vitro. In the work of Zapperi8 a pd number is estimated to be 39 which is probably over-estimated. So considering a maximum pd of 32, the number of cells at the limit of senescence is then of order 109. The cell size of a dysplastic melanocytic nevus has been measured with precision in the work of Rhodes26,27: the height is hc ~ 6 μm while the average diameter is about 11 μm (a value bigger than for ordinary melanocyte cells) and we arrive to a volume per cell of V ~ 570(μm3). Taking an epithelium of order 1 mm thick we arrive to a maximum size for radius of order 1.6 cm if the nevus is entirely located above the basal membrane and if only one primitive melanoma cell is present in the lesion permanently. Otherwise the maximal nevus size varies as the square root of the number of primitive melanoma cells. In any case, senescence is consistent with the limiting size (Rm ~ 2 cm) of a dysplastic nevus if we exclude giant congenital nevi.
We aim to construct a simple and unique model based on physical equations that could exhibit the different features specific to melanomas and nevi. Taking into account the changes at the cellular level due to mutations and the importance of the micro-environment, this model manages to display some of the observations usually used to distinguish nevi from melanomas. It also explains the absence of a necrotic core in melanoma, even in the avascular solid tumour phase. Melanoma differs from other solid tumors by many aspects during its evolution and metastasis but the absence of necrotic core is really its specificity. In this work this is explained by the growth confined in the epidermis which modifies the usual spheroid geometry and the nutrient distribution as well.
Methods
Derivation of the main equations
Eq.(6) is a modified diffusion equation in the static limit with a consumption term proportional to the cancerous cell concentration ϕ (according to the Michaelis-Merten law) and a source flux of nutients. It results from an average of the 3-dimensional diffusion equation in the vertical direction, which is justified by the tiny thickness of the epidermis. It transforms the 3-dimensional diffusion equation into a simplified effective 2D diffusion equation (more details can be found in the Supplementary information). The velocity field of the cancerous cells Eq.(4) is derived from a variational principle of energy minimization including the cell-cell adhesion and the friction between phases. Elimination of the liquid phase is made possible due to conservation relations such as ϕc + ϕl = 1 (see the Supplementary) and the theoretical treatment requires only two coupled partial differential equations depending on (x,y,t): Eq.(1) and Eq.(5), instead of the 3 expected. However remaining enough complicated, inspection of these equations is done first analytically and reveals the existence of a simple homogeneous solution which allows a linear perturbation analysis as commonly done in nonlinear physics. Depending on the range of parameters entering the model and according to the dispersion relation given the growth rate of a perturbation Eq.(12) with a wavenumber k (plotted in Fig. 6), one can expect or not a phase segregation inside the growing tumour.
Simulations
Numerical simulations of Eqs.(6,7) were performed in a two-dimensional N × N lattice, with ϕ ≡ 0 and n ≡ n0 at the lattice border. The initial conditions are taken as parabolic form for the concentration distribution and an initial white noise is added inside the parabola. The equations are discretized using centered second-order accurate differencing schemes in space, explicit first-order accurate in time. We use a FCTS (forward time centered space) scheme to represent Eq.(7). In order to express Eq.(6), we introduce a time dependence with a different time scale to insure that growth is slower than diffusion:
 |
where k is the time index, i and j are the grid position, and  .
.
The analytical form of f in Σ, (Eq.(4) in the simulations) is taken as:
 |
where  , to satisfy the shape of Fig. 4. The results are not strongly dependent on the form taken for f. Here, we take p = 2 and ϕe = 0.6, the other parameters being chosen in the range of skin biological data given in Table 1. The program was implemented on a graphic processor unit, a GTX-580 Nvidia graphic card, using the CUDA parallel programming language, in order to reduce the computational time.
Biological data
An estimation of these parameters has been gathered in Table 1. We also gave an estimation of the dimensionless parameters. These quantities are used in our simulations.
Author Contributions
T.B. and M.B.A. have contributed equally to this work. They wrote the main manuscript text, prepared the figures. All authors reviewed the manuscript.
Supplementary Material
Supplementary Infotmation
Acknowledgments
This work was supported in part by AAP Physique Cancer 2012.
References
- Stern R. S. Prevalence of a history of skin cancer in 2007: results of an incidence based model. Arch. Dermatol 146, 279–282 (2010). [DOI] [PubMed] [Google Scholar]
- Pimiento J. M. et al. Melanoma genotypes and phenotypes get personal. Nat. Commun. 13, 858–867 (2013) 10.1038/labinvest.2013.84. [DOI] [PubMed] [Google Scholar]
- Weinstock M. A. Cutaneous melanoma: public health approach to early detection. Dermatol. Ther. 19, 26–31 (2006). [DOI] [PubMed] [Google Scholar]
- Greenspan H. P. On the growth and stability of cell cultures and solid tumors. J. Theor. Biol 56, 229–242 (1976). [DOI] [PubMed] [Google Scholar]
- Lowengrub J. S. et al. Nonlinear modelling of cancer: Bridging the gap between cells and tumors. Nonlinearity 23, 1–91 (2010). [DOI] [PMC free article] [PubMed] [Google Scholar]
- Preziosi L. & Vitale G. A Multiphase model of tumor and tissue growth including cell adhesion and plastic reorganization. Math.Mod. Meth. App.S. 21, 1901–1932 (2011). [Google Scholar]
- Hoehme S. & Drasdo D. A cell-based simulation software for multi-cellular systems. Bioinformatics 26, 2641–2642 (2010). [DOI] [PMC free article] [PubMed] [Google Scholar]
- Zapperi S., La Porta C. A. & Sethna J. P. Senescent cells in growing tumors: population dynamics and cancer stem cells. PLoS Computational Biology 57, 1–13 (2012). [DOI] [PMC free article] [PubMed] [Google Scholar]
- Bearer E. L. et al. Multiparameter computational modeling of tumor invasion. Cancer Res 69, 4493–4501 (2009). [DOI] [PMC free article] [PubMed] [Google Scholar]
- Fitzpatrick T. B. & Breathnach A. S. Das epidermale Melanin-Einheit-System. Dermatol. Wochenschr 147, 481–489 (1963). [PubMed] [Google Scholar]
- Balch C. M. et al. Final version of 2009 ajcc melanoma staging and classification. J. Clin. Oncol. 27, 6199–6206 (2009). [DOI] [PMC free article] [PubMed] [Google Scholar]
- Bachmann I. M. et al. Tumor necrosis is associated with increased alphavbeta3 integrin expression and poor prognosis in nodular cutaneous melanomas. BMC Cancer 8, 362 (2008). [DOI] [PMC free article] [PubMed] [Google Scholar]
- Bennett D. C. Human melanocyte senescence and melanoma susceptibility genes. Oncogene 22, 3063–3069 (2003). [DOI] [PubMed] [Google Scholar]
- Chatelain C., Ciarletta P. & Ben Amar M. Morphological changes in early melanoma development: Influence of nutrients, growth inhibitors and cell-adhesion mechanisms. J. of Theoretical Biology 290, 46–59 (2011). [DOI] [PubMed] [Google Scholar]
- Doi M. & Onuki A. Dynamic coupling between stress and composition in polymer solutions and blends. J. Physique II 2, 1631–1656 (1992). [Google Scholar]
- Puliafito A. et al. Collective and single cell behavior in epithelial contact inhibition. PNAS 109, 739–744 (2012). [DOI] [PMC free article] [PubMed] [Google Scholar]
- Chatelain C., Balois T., Ciarletta P. & Ben Amar M. Emergence of microstructural patterns in skin cancer: a phase separation analysis in a binary mixture. New Journal of Physics 13, 115013 (2011). [Google Scholar]
- Ciarletta P., Foret L. & Ben Amar M. The radial growth phase of malignant melanoma. J. Roy. Soc. Interface 8, 345–368 (2011). [DOI] [PMC free article] [PubMed] [Google Scholar]
- Ben Amar M., Chatelain C. & Ciarletta P. Contour instabilities in early tumor growth models. Phys. Rev. Lett. 106, 148101 (2011). [DOI] [PubMed] [Google Scholar]
- Nordlund J. J. Clinical appearence of cutaneous melanoma. The Yale Journal of biology and medicine 48, 403–407 (1975). [PMC free article] [PubMed] [Google Scholar]
- Bennett D. C. How to make a melanoma: what do we know of the primary clonal events? Pigment Cell Melanoma Res. 21, 27–38 (2008). [DOI] [PubMed] [Google Scholar]
- Hsu M. Y., Meier F. & Herlyn M. Melanoma development and progression: a conspiracy between tumor and host. Differentiation 70, 522–536 (2002). [DOI] [PubMed] [Google Scholar]
- Haas N. K. & Herlyn M. Normal human melanocyte homeostasis as a paradigm for understanding melanoma. J. Investg. Derm. Symp. Proc. 10, 153–163 (2005). [DOI] [PubMed] [Google Scholar]
- Haas N. K. et al. Adhesion, migration and communication in melanoma and melanocytes. Pigment Cell Res. 18, 150–159 (2005). [DOI] [PubMed] [Google Scholar]
- Viros A. et al. Improving Melanoma Classification by integrating Genetic and Morphologic Features,. PLoS Med. 5, 941–952 (2008). [DOI] [PMC free article] [PubMed] [Google Scholar]
- Rhodes A. R. et al. Increased intraepidermal melanocyte frequency and size in dysplastic melanocytic nevi and cutaneous melanoma. A comparative quantitative study of dysplastic melanocytic nevi, superficial spreading melanoma, nevocellular nevi, and solar lentigines. J Invest Dermatol. 80, 452–459 (1983). [DOI] [PubMed] [Google Scholar]
- Rhodes A. R. Melanocytic precursors of cutaneous melanoma. Estimated risks and guidelines for management. Med Clin North Am. 70, 3–37 (1986). [DOI] [PubMed] [Google Scholar]
- Jain R. K. Transport of molecules in the tumor interstitium: a review. Cancer Res. 47, 3039–3051 (1987). [PubMed] [Google Scholar]
- van Kemenade P. M., Huyghe J. M. & Douven L. F. A. Triphasic FE modeling of skin water barrier. Transp. Porous Media 50, 93–109 (2003). [Google Scholar]
- Swabb E. A., Wei J. & Gullino P. M. Diffusion and convection in normal and neoplastic tissues. Cancer Res. 34, 2814–2822 (1974). [PubMed] [Google Scholar]
- Clark W. H., From L., Bernardino E. A. & Mihm M. C. The histogenesis and biological behavior of primary human malignant melanoma of the skin. Cancer Res. 29, 705–726 (1969). [PubMed] [Google Scholar]
- Creasey A. A. et al. Biological properties of human melanoma cells in culture. In Vitro 5, 342–350 (1979). [DOI] [PubMed] [Google Scholar]
- Bedogni B. & Powell M. B. Hypoxia, melanocytes and melanoma - survival and tumor development in the permissive microenvironment of the skin. Pigment Cell Melanoma Res. 22, 166–174 (2009). [DOI] [PMC free article] [PubMed] [Google Scholar]
- Johnson M. E., Blankschtein D. & Langer R. Evaluation of solute permeation through the stratum corneum: lateral bilayer diffusion as the primary transport mechanism. J. Pharm. Sc. 86, 1162–1172 (1997). [DOI] [PubMed] [Google Scholar]
- Stucker M. et al. The cuteneous uptake of atmospheric oxygen contributes significantly to the oxygen supply of human dermis and epidermis. J. Physiol. 538, 985–994 (2002). [DOI] [PMC free article] [PubMed] [Google Scholar]
- Cornelissen L. H. et al. Diffusion measurements in epidermal tissues with fluorescent recovery after photobleaching. Skin Res. Technol. 14, 462–467 (2008). [DOI] [PubMed] [Google Scholar]
Associated Data
This section collects any data citations, data availability statements, or supplementary materials included in this article.
Supplementary Materials
Supplementary Infotmation


