Abstract
Position within a tissue often correlates with cellular phenotype, for example, differential expression of odorant receptors and cell adhesion molecules across the olfactory mucosa (OM). The association between position and phenotype is often paralleled by gradations in the concentration of retinoic acid (RA), caused by differential expression of the RA synthetic enzymes, the retinaldehyde dehydrogenases (RALDH). We show here that RALDH-1, -2, and -3 are enriched in the sustentacular cells, deep fibroblasts of the lamina propria, and the superficial fibroblasts, respectively, of the ventral and lateral OM as compared to the dorsomedial OM. The shift from high to low expression of the RALDHs matches the boundary defined by the differential expression of OCAM/mamFasII. Further, we found that RA-binding proteins are expressed in the epithelium overlying the RALDH-3 expressing fibroblasts of the lamina propria. Both findings suggest that local alterations in RA concentration may be more important than a gradient of RA across the epithelial plane, per se. In addition, RALDH-3 is found in a small population of basal cells in the ventral and lateral epithelium, which expand and contribute to the neuronal lineage following MeBr lesion. Indeed, transduction with a retrovirus expressing a dominant negative form of retinoic acid receptor type alpha blocks the reappearance of mature, olfactory marker protein (OMP) (+) olfactory neurons as compared to empty vector. These results support the notion of a potential role for RA, both in maintaining the spatial organization of the normal olfactory epithelium and in reestablishing the neuronal population during regeneration after injury. J. Comp. Neurol. 520:3707–3726, 2012.
INDEXING TERMS: retinoic acid, olfactory epithelium, regeneration, retinaldehyde dehydrogenase, cellular retinoic acid binding protein
In many systems, gradations in the concentration of retinoic acid (RA), which are established by the differential expression of the RA synthetic enzymes (RALDH-1, -2, -3), are essential for patterning complex morphogenetic fields (Ross et al., 2000; Appel and Eisen, 2003). This is also true in the olfactory system, where the emergence of nasal structure and olfactory epithelial organization and patterning depend on epithelial–mesenchymal interactions that are mediated, to some extent, by RA. For example, in the early embryo, RALDH-2 is expressed in the frontonasal mesenchyme and provides a local source of RA to the developing olfactory system (Bhasin et al., 2003). This source of RA is a critical component of the epithelial–mesenchymal interactions necessary for the expression of key RA signaling molecules, such as several of the RA-receptors, and RA binding proteins (LaMantia et al., 1993). Further, without the mesenchymal RALDH-2 as a source of RA, RALDH-3 is not expressed in the epithelium, and the application of exogenous RA fails to rescue the expression of this necessary enzyme (Bhasin et al., 2003). Indeed, Raldh-3 knockout animals die perinatally due to severe malformations of the nasal region, which results in fatal respiratory failure (Dupe et al., 2003). Furthermore, the contribution of RA to the organization of the olfactory system is demonstrated by ex vivo experiments using Pax6sey animals, which do not produce RA in their frontonasal mesenchyme, and lack an olfactory epithelium. When wildtype epithelium is cultured with Pax6sey mutant mesenchyme, the mucosa fails to organize and differentiate, although some medial olfactory characteristics develop. This experiment demonstrates that RA is a critical element of epithelial–mesenchymal interactions. It also suggests that medial differentiation of the olfactory epithelium (OE) is less dependent on RA signaling than is lateral differentiation (LaMantia et al., 2000), which illustrates that RA is not only an important differentiation signal, but also an important factor in the spatial order and patterning of olfactory structures.
The role of RA in patterning the olfactory mucosa (OM) is further demonstrated by the expression of RALDH enzymes, which are expressed differentially across the developing OM. At embryonic day 16 all three RALDHs are more heavily concentrated in the ventral and lateral aspects of the OM compared to the dorsomedial part (Niederreither et al., 2002). This has been shown using both in situ hybridization (ISH) techniques, and by the examination of RA-reporter mice as embryos. Further, RA-reporter mice, have been used to show that a population of basal cells, in the embryonic OE, are activated by RA at developmental timepoints that are coincident with the onset of neurogenesis (Rawson and LaMantia 2007). In the same embryonic time frame, RA-responsive genes are turned on in a subset of ORNs in the dorsolateral embryonic epithelium (Whitesides et al., 1998).
Beyond its role in the embryonic organization of the olfactory placodal derivatives, the pattern of differential expression of components critical to the RA signaling cascade across the plane of the mucosa are seemingly recapitulated in the adult, as it has been shown by ISH that the gene encoding RALDH-2 is more highly expressed in the mesenchyme underlying the ventral and lateral regions of the epithelium of the adult mouse (Norlin et al., 2001). The obvious implication, in the context of the adult, has to do with the organization of expression of the odorant receptor (OR) genes by olfactory sensory neurons (OSNs) in the OE. The OSNs of the OE are organized across the plane of the epithelium, such that each neuron expresses one dominant OR (Mombaerts, 2004) from a gene family of ≈1,000 functional members (Zhang and Firestein, 2002), and each OR is only expressed by OSNs within a specific anteroposterior-aligned stripe of the epithelium (Vassar et al., 1993; Ressler et al., 1993; Chess et al., 1994; Iwema et al., 2004; Miyamichi et al., 2005). Taken together, the data from placodal development and the adult OM suggest that RA may play an early and continuing role in establishing coordinates of epithelial “space.”
Therefore, we wished to provide a more comprehensive analysis of the localization of the major components of the RA signaling pathway and also to determine the role of RA signaling in cells that are regenerating after lesion. To this end we used immunohistochemistry (IHC) and ISH to describe the expression pattern of some of the major components of the RA signaling cascade, and we used a retroviral vector to deliver a dominant-negative form of the alpha subunit of the RA receptor (dnRARα403) to progenitor cells, as they repopulate the epithelium after lesion with MeBr, in order to interfere with RA signaling within the regenerating neurons of the epithelium. Here we show that the three RALDH enzymes are differentially expressed across the OE, we determine that a subset of RALDH-3 expressing cells contribute to the neuronal population of the OE, and that blockade of RA signaling prevents regenerating neurons from becoming mature at a point that is coincident with the timing of OR choice.
MATERIALS AND METHODS
Animals and MeBr lesion
All animal studies conformed to protocols approved by the Institutional Animal Care and Use Committee at Tufts University. Ten-week-old male C57B6 mice were obtained from Jackson Laboratories (Bar Harbor, ME). Some were used for examination of the OE in the normal animal. Others animals were subjected to lesion by MeBr, as described previously (Chen et al., 2004). In brief, mice were placed in wire enclosures centered in a Plexiglas box and exposed to MeBr gas for 8 hours at a concentration of 200 ppm in purified air at a flow rate of 10 l/min. MeBr-exposed mice were allowed to survive 2 days, 7 days, 14 days, or 6 weeks postlesion.
For the viral studies, mice were subjected to lesion using the method described above. At 24 hours after lesion the mice were anesthetized and tracheotomized. The viral constructs were introduced into the nasal cavity by threading a length of PE10 tubing, fitted with a 30G needle, ≈7 mm into the naris. The mice were allowed to survive 3 weeks postinfusion.
To prepare tissue for analysis, the mice were deeply anesthetized by intraperitoneal injection of 0.5–0.7 ml/kg of an anesthetic cocktail (43 mg/ml ketamine, 9 mg/ ml xylazine, and 1.5 mg/ml acepromazine) and killed by intracardiac flush with phosphate-buffered saline (PBS), pH 7.4, followed by perfusion with one of several different fixatives depending on the protein targets for IHC (Bouin’s, 4% paraformaldehyde, or Zamboni’s fixative). After perfusion, the head was stripped of soft tissue and the heavy bones of the skull were removed; the remaining nasal skeleton and attached mucosa were postfixed for an additional 60 minutes. The tissue was rinsed and then decalcified by submersion in either saturated EDTA, for paraformaldehyde- and Zamboni’s-fixed tissue, or formic-citrate solution, for Bouin’s-fixed tissue. The tissue was cryoprotected overnight in 30% sucrose in PBS and frozen in OCT compound. The OM was sectioned on a cryostat (Leica CM3050S) in the coronal plane, and 8- and 16-mm thick sections were collected onto “Super Frost Plus” slides (Fisher Scientific, Pittsburgh, PA) and stored at −20°C.
Immunohistochemistry
Standard laboratory protocols were used for each of the primary antibodies (listed in Table 1). Bound primary antibodies were visualized either by using a directly conjugated fluorescent secondary (Jackson Immunoresearch, West Grove, PA) or by incubation with the corresponding biotinylated secondary antibody followed by avidin-bHRP conjugate (Elite ABC Kit, Vector Laboratories, Burlingame, CA) when 3, 3′-diaminobenzidine was used as the chromogen (Table 2).
TABLE 1.
Characterization of Antibodies Used in the Current Study
| Primary antibody | Immunogen | Source, cat. no., species, mono/polyclonal |
|---|---|---|
| CD31 (MEC13.3) | An endothelioma cell line (tEnd.1) derived from the 129/Sv mouse strain. | BD Biosciences, Franklin Lakes, NJ, 550274, rat, monoclonal |
| CD54 | Purified, NS0-derived, recombinant rat intercellular adhesion molecule 1 (rrICAM-1) extracellular domain. | R&D systems, Minneapolis, MN, AF583, goat, polyclonal |
| CRABPII (K-13) | A peptide from within an internal region of human CRABPII | Santa Cruz, Santa Cruz, CA, sc-10065, goat, polyclonal |
| F4/80 – Pan Macrophage Marker | The mouse F4/80 antigen, which is expressed by a majority of mature macrophages. | eBiosciences, San Diego, CA, 14-4801, rat, monoclonal |
| GFP | Purified recombinant full length GFP made in E. Coli | Abcam, Cambridge, MA, ab6556, rabbit polyclonal |
| mamFasII/OCAM | Recombinant mouse OCAM (Leu20-Gly700) | R&D systems, Minneapolis, MN, AF778, goat, polyclonal |
| p75 | Extracellular fragment generated from sequences from the third exon of mouse p75 (amino acids 43-161). | Millipore, Beford, MA AB1554, rabbit polyclonal |
| PGP9.5 | Human PGP9.5 (ubiquitin-C-terminal hydrolase 1, 27 kD) protein purified from brain. | Cedarlane Laboratories Ltd., Burlington, NC, 31A3 (same as RA95101, ultraclone) rabbit, polyclonal |
| Proliferating cell nuclear antigen (PCNA) | Synthetic peptide: DMGHLKYYLAPKIEDEEGS, corresponding to C terminal aa 243-261 of human PCNA | Abcam, Cambridge, MA, ab2426, rabbit polyclonal |
| RALDH-1 | A synthetic peptide from within residues 450 to the C-terminus of rat ALDH1A, conjugated to KLH | Abcam, Cambridge, MA, Ab23375, rabbit, polyclonal |
| RALDH-2 | Recombinant mouse RALDH-2 | Dr. Ursula Dräger, rabbit, polyclonal |
| RALDH-3 | Recombinant mouse RALDH-3 | Dr. Ursula Dräger, rabbit, polyclonal |
| Vimentin (C-20) | Purified vimentin from pig’s eye-lens. | Santa Cruz, Santa Cruz, CA, sc-7557, goat, polyclonal |
TABLE 2.
Immunohistochemical Protocols Used in the Analysis
| IHC | Primary antibody (Table 1) | Secondary antibody | Tertiary step | Quaternary step |
|---|---|---|---|---|
| CRABPII | CRABPII (1:300) | b-DαG1,2 | ABC3→DAB4 | |
| RALDH-1 | RALDH-1 (1:1000) | FITC-DαRb | ||
| RALDH-2 | RALDH-2 (1:1000) | FITC-DαRb | ||
| RALDH-2 + | RALDH-2 (1:1000) | FITC-DαRb | Rabbit αFITC | FITC-DαRb |
| CD31 | CD31 (1:50) | TxR-DαR | ||
| RALDH-2 + | RALDH-2 (1:10K) | b-DαRb | 5 TSA→6 FITC-SA | |
| CD54 | CD54 (1:20) | TxR-GαH | ||
| RALDH-2 + | RALDH-2 (1:500) | b-DαRb | TxR-SA | |
| F4/80 | F4/80 (1:100) | FITC-DαR | ||
| RALDH-2 + | RALDH-2 (1:1000) | b-DαRb | TxR-SA | FITC-DαM |
| OCAM | OCAM (1:50) | FITC-DαG | Mouse αFITC | |
| RALDH-2 + | RALDH-2 (1:10K) | b-DαRb | TSA→FITC-SA | TxR-DαRb |
| p75 | p75 (1:100) | TxR-DαRb | Rabbit αTxR | |
| RALDH-2 + | RALDH-2 (1:10K) | b-DαRb | TSA→TxR-SA | FITC-DαRb |
| PGP9.5 | PGP9.5 (1:1000) | FITC-DαRb | Rabbit αFITC | |
| RALDH-2 + | RALDH-2 (1:1000) | FITC-DαRb | Rabbit αFITC | FITC-DαRb |
| RALDH-3 | RALDH-3 (1:10K) | |||
| b-DαRb | TSA→TxR-SA | |||
| RALDH-2 + | RALDH-2 (1:1000) | b-DαRb | TSA→TxR-SA | |
| Vimentin | Vimentin (1:10) | FITC-DαG | ||
| RALDH-3 | RALDH-3 (1:1000) | FITC-DαRb | ||
| RALDH-3 + | RALDH-2 (1:1000) | FITC-DαRb | Rabbit αFITC | FITC-DαRb |
| CD31 | CD31 (1:50) | TxR-DαR | ||
| RALDH-3 + | RALDH-3 (1:10K) | b-DαRb | TSA→FITC-SA | |
| CD54 | CD54 (1:20) | TxR-GαH | ||
| RALDH-3 + | RALDH-3 (1:500) | b-DαRb | TxR-SA | |
| F4/80 | F4/80 (1:100) | FITC-DαR | ||
| RALDH-3 + | RALDH-3 (1:10K) | b-DαRb | TSA→TxR-SA | FITC-DαRb |
| GFP | GFP (1:5000) | FITC-DαRb | Rabbit αFITC | |
| RALDH-3 + | RALDH-3 (1:1000) | b-DαRb | TxR-SA | FITC-DαM |
| OCAM | OCAM (1:50) | FITC-DαG | Mouse αFITC | |
| RALDH-3 + | RALDH-3 (1:10K) | b-DαRb | TSA→TxR-SA | FITC-DαRb |
| PCNA | PCNA (1:1000) | FITC-DαRb | Rabbit αFITC | |
| RALDH-3 + | RALDH-3 (1:10K) | b-DαRb | TSA→FITC-SA | TxR-DαRb |
| p75 | p75 (1:100) | |||
| TxR-DαRb | Rabbit αTxR | |||
| RALDH-3 + | RALDH-3 (1:10K) | b-DαRb | TSA→TxR-SA | FITC-DαRb |
| PGP9.5 | PGP9.5 (1:1000) | FITC-DαRb | Rabbit αFITC | |
| RALDH-3 + | RALDH-3 (1:1000) | b-DαRb | TSA→TxR-SA | |
| Vimentin | Vimentin (1:10) | FITC-DαG |
b-DαG, biotinylated-donkey antigoat IgG; b-DαRb, biotinylated-donkey antirabbit IgG; FITC-DαG, FITC conjugated-donkey antigoat IgG; FITC-DαRb, FITC conjugated-donkey antirabbit IgG; FITC-DαR, FITC conjugated-donkey antirat IgG; TxR-DαG, Texas Red conjugated-donkey antigoat IgG; TxR-DαRb, Texas-Red conjugated-donkey antirabbit IgG; TxR-DαR, Texas-Red conjugated-donkey anti-rat IgG; TxR-GαH, Texas Red conjugated-goat anti-hamster IgG.
All secondary antibodies were used at a 1:50 dilution.
ABC, avidin (1:50) + biotinylated horseradish peroxidase (1:50).
DAB, 3,3′ diaminobenzedine.
TSA, Tyramide Signal Amplification Kit from Perkin-Elmer.
TxR-SA, Texas-Red conjugated-streptavidin; FITC-SA, FITC conjugated-streptavidin.
When colabeling experiments required the use of two rabbit antibodies, the concentration of one of the two antibodies was reduced 10-fold and visualized using the Tyramide Signal Amplification Kit (Perkin-Elmer, Waltham, MA). The secondary antibody was used according to standard protocols (Table 2).
Antibody specificity
All of the antibodies, with the exception of the RALDH antibodies, were used to identify specific cell types within the tissue. The staining pattern that was generated with each of the RALDH antibodies was validated by ISH results included in this study (RALDH-2 and -3) or by microarray analysis on highly purified populations of each epithelial cell type (RALDH-1) (Krolewski et al., submitted). In general, the antibodies chosen as tissue markers have all been well characterized, and each produced a staining pattern that was consistent with previously published reports. The information available from the manufacturer with regard to the specificity of each antibody is summarized below.
The anti-CD31 (Mec.13.3) antibody has been shown in vitro and in vivo to inhibit a variety of CD31-mediated functions (BD Biosciences, Franklin Lakes, NJ; technical data sheet, 550274). The anti-CD54 antibody blocks adhesion of target cells to ICAM-1 in the HSB2 adhesion assay (R&D Systems, Minneapolis, MN; product data sheet AF583). The anti-CRABP2 (K-13) antibody recognizes a single band of the correct molecular weight on western blot, from lysates of NIH/3T3, A-431, and HeLa cell nuclear extracts (Santa Cruz Biotechnology, Santa Cruz, CA; product data sheet sc-10065).
The anti-F4/80 (BM8) pan macrophage marker labels a majority of mature macrophages, and has been tested by flow cytometric analysis of mouse spleen and bone marrow cells suspension (eBiosciences, San Diego, CA; technical data sheet 14-4801). The anti-mamFasII/OCAM antibody has been tested in both direct enzyme-linked immunosorbent assays (ELISAs) and western blots, and has not been found to significantly (<1%) crossreact with recombinant human NCAM-L1, BCAM, MCAM, or ALCAM (R&D Systems; product data sheet AF778).
The anti-PGP9.5 antibody has been tested on western blot of mouse brain and rat pineal gland lysates and detects a single band of 27 kDa (Tsai et al., 2008). All species tested to date show crossreactivity with this antibody (Ultraclone, data sheet RA95101; Hasegawa and Wang, 2008). The anti-proliferating cell nuclear antigen (PCNA) antibody detects a band on western blot of ≈29 kDa (AbCam, Cambridge, MA; product data sheet ab2426). The anti-RALDH-1 antibody has been tested on western blot (AbCam; product data sheet ab23375) and we found that it produced a staining pattern similar to the expression of the raldh-1 mRNA as demonstrated by ISH of mouse olfactory mucosa (data not shown). The anti-vimentin antibody recognizes a single band of 55 kDa in whole-cell lysates of A-10 and KNRK cells (Santa Cruz; product data sheet sc-7557).
In situ hybridization
The Raldh-2 and Raldh-3 probes have been previously published (Chung et al., 2001). Raldh-2 was cloned into pBluescript II and Raldh-3 was cloned into pcDNA1/Amp. Antisense RNA probes were generated by linearizing the plasmid and transcribing with digoxigenin-labeled UTP (Roche Molecular Biochemicals, Indianapolis, IN) per the manufacturer’s recommendations. The resulting full-length probes were digested by alkaline hydrolysis to an average length of 225 bases. Sections were pretreated with 1 μg/ml proteinase K for 2 minutes at 25°C before hybridizing with riboprobes (≈1 μg/ml) overnight at 57°C. After hybridization, sections were washed twice for 30 minutes at moderate stringency (2× SSC at 25°C), followed by two 30-minute high-stringency washes (0.1× SSC at 60°C). Afterward, the hybridized sections were treated with blocking solution prior to incubation with an alkaline phosphatase conjugated anti-digoxigenin antibody (Roche Diagnostics, Indianapolis, IN). Bound anti-digoxigenin antibody was visualized by using a mixture of nitro-blue tetrazolium chloride and 5-bromo-4-chloro-3′-indolyphosphate p-toluidine as the chromogen. Sections were stored dry but rehydrated and cover-slipped with glycerol for microscopic examination and digital imaging.
Quantitative reverse-transcription polymerase chain reaction (RT-PCR)
RNA was extracted from olfactory mucosa dissected from either the dorsal recess or the ventrolateral turbinates. Quantitative PCR (qPCR) was then performed using an Mx3000P Real-Time PCR system (Stratagene, La Jolla, CA), in triplicate, on cDNA made from the dorsal recess RNA and ventrolateral turbinate RNA. The data were analyzed using the Q-Gene Core Module (Muller et al., 2002) and normalized against two separate housekeeping genes (h3f3b and mrp143, m < 0.5, geNorm; Vandesompele et al., 2002). For all determinations the assay was within the linear range. Primers were evaluated by dissociation curve and found to generate a single peak, and the product of the qPCR reaction produced a single band when separated on a gel (not shown).
Cloning and characterization of the pLIA-dnRARα403-IRES.GFP retrovirus
The dnRARα403 is a dominant-negative variant of the human RARα gene, formed by truncation at its C-terminal end, which renders it incapable of activating transcription (Damm et al., 1989). This variant is able to block the effects of RA because it retains the ability to bind its heterodimeric binding partner, RXR, and to bind to the RA-responsive element upstream of RA-responsive genes (Damm et al., 1993).
The dnRARα403 insert (Damm et al., 1993) was PCR-amplified from the RCASDNhRARα (a gift from Dr. Connie Cepko) using GCTAGAATTCATGGCCAGCAACAGCAG as the forward primer and TTCGCCTAAACACACCC-TAGTCCCC as the reverse primer. The RCAS-DNhRARα contained an EcoRI site 3′ to the insert, and the forward primer was designed to add an EcoRI site onto the 5′ end of the insert, allowing the insert to be cloned into the EcoRI site of the pLIA-IRES.GFP (a gift from Dr. Connie Cepko) to generate pLIA-dnRARα403-IRES.GFP (see Fig. 13). The sequence was confirmed and orientation of the insert assessed using the pBABE forward sequencing primer (CTTTATCCAGCCCTCAC) (Weinberg, R.A: unpublished). Efficacy of the pLIA-dnRARα403-IRES.GFP (dnRARα403-RV) was determined using a cell-based lucif-erase assay. HEK-293 cells were cotransfected in phenol-red free, serum-containing media with the pGL3-RARE.luc construct (Hoffman et al., 2006) (Addgene plasmid 13458) and either dnRARα403-RV or the control pLIA-IRES.GFP construct. At 48 hours posttransfection serum was removed from the cells and at 72 hours posttransfection the cells were incubated with/without 0.5 μM RA for 3 hours. The cells were then lysed and read for luciferase activity using the Luciferase Assay System (Promega, Madison, WI) according to the manufacturers protocol on a luminometer.
Figure 13.
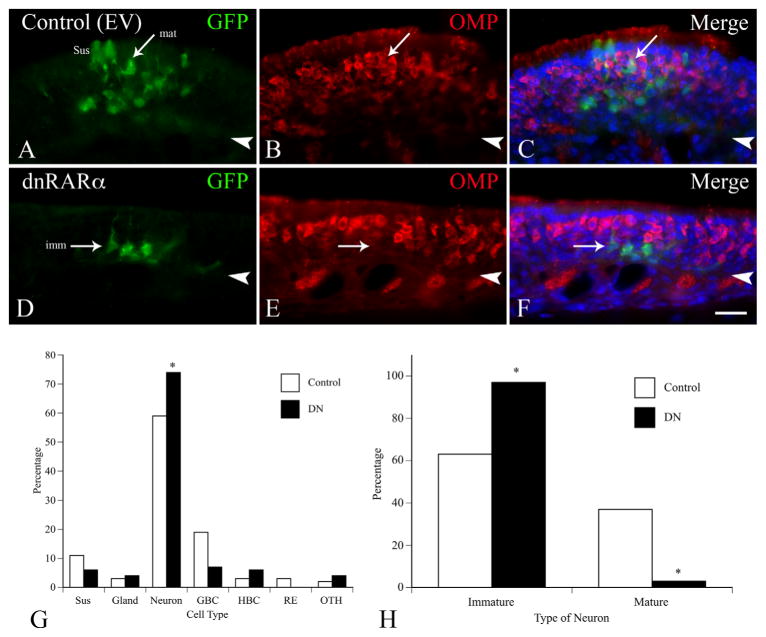
Results of retroviral transduction in vivo 3 weeks after MeBr lesion and infection. A–C: Typical clone arising from transduction with control RV. GFP-labeled neurons are prominent in this clone, including some that stain for OMP (arrow labeled “mat” for mature). In C the staining for each of the antibodies is merged with Hoechst labeling of nuclei. D–F: Typical clone arising from transduction with RV encoding dnRARα403. Neurons are present, but they are limited to the deeper aspects of the epithelium and do not label with OMP (an example is marked by the arrow labeled “imm” for immature). G: Plot summarizing the cell distribution among the clones analyzed (control: 18 clones encompassing 154 cells; dnRARα403: 17 clones representing 139 cells). The dnRARα403 clones had a significantly higher percentage of neurons overall (74% vs. 59%, respectively, P = 0.01, chi-square analysis). H: Percentage of neurons that are mature vs. immature neurons in the clones. The clones transduced by dnRARα403-RV infection had a significantly lower percentage of mature neurons (3% vs. 37%, respectively, P < 0.001, chi-square analysis). Scale bar = 20 μm in F (also applies to A–E).
Standard western blotting techniques were used to monitor transfection equivalency among the samples. Briefly, equal volumes of the protein lysate generated for the luciferase assay were separated on an 8% polyacrylamide gel and then transferred to a PVDF membrane. The membrane was blocked for 1 hour in 5% nonfat dry milk (Carnation) in PBS-T followed by overnight incubation at 4°C with a rabbit anti-GFP antibody (AbCam; 1:5,000) in 1% nonfat dry milk in PBS-T. The blots were washed in PBS-T, incubated with goat-horseradish peroxidase (HRP) (1:5,000), and detected with SuperSignal West Pico Chemiluminescent Substrate (Pierce, Rockford, IL).
Photography
Sections were imaged with a Spot RT2 color digital camera attached to Nikon 800 E microscope. Image preparation, assembly, and analysis were performed in Photo-shop CS3 (Adobe Systems, San Jose, CA). In all of the photos only balance, contrast, and evenness of the illumination were altered.
RESULTS
Immunolocalization of RALDH-1, -2, and -3
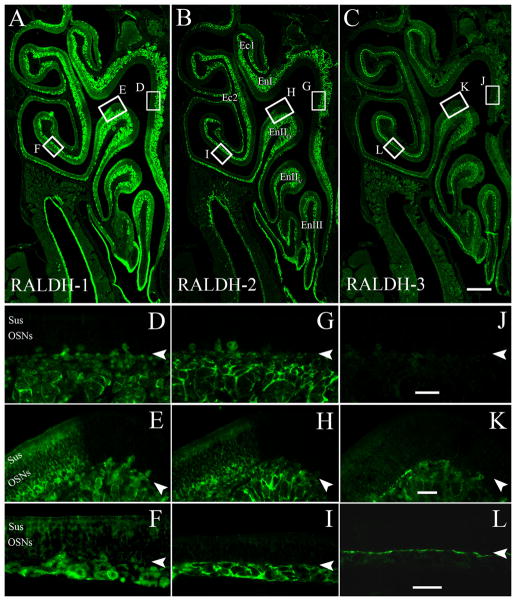
We used IHC to detect the expression of the three major RALDH enzymes in the adult mouse OM (consisting of the OE and the lamina propria underlying it), all of which were more highly expressed in the ventral and lateral OM as compared with the dorsomedial regions. RALDH-1 (Fig. 1A,D–F) was expressed by the sustentacular (Sus) cells of the ventrolateral OE, but not in dorsomedial OE (cf. Fig. 1D,F), and the boundary between RALDH-1-expressing Sus cells vs. unlabeled Sus cells was sharply defined (Fig. 1E). In addition, RALDH-1 was differentially expressed in the lamina propria (which term includes the fascicles of the olfactory nerve, the Bowman glands, and the mesenchyme/stroma, which fills the remainder of the lamina propria). RALDH-1 labeling of the mesenchyme closely apposed and underlying the OE is heavier in the ventrolateral mucosa, and in the olfactory ensheathing cells (OECs) of the smaller fascicles that are superficial in the lamina propria by comparison with dorsomedial mucosa. In contrast, OECs found within the larger, deeper fascicles were labeled for RALDH-1 in both dorsomedial and ventrolateral mucosa (Fig 1F). In both the dorsomedial region (Fig. 1D) and ventrolateral region RALDH-1 (Fig. 1F) was also expressed in the deep mesenchyme within the OECs. In contrast, OECs directly subjacent to the basement membrane, in the superficial mesenchyme, were positive for RALDH-1 only in the ventrolateral area (Fig. 1F).
Figure 1.
All three major RALDH enzymes are differentially expressed in the adult OM. A: Low-power image of RALDH-1 expression. Note that RALDH-1 is found in the Sus cells in the ventral and lateral epithelium, and that the boundary is sharply defined. D–F: Insets from (A) show that in the dorsomedial region (D) RALDH-1 is absent from the superficial mesenchyme, but it is present in the OECs in the olfactory nerve fascicles (on). The boundary between dorsal and ventral is sharply delimited (E), and in the ventrolateral region RALDH-1 staining is apparent in the OECs and the Sus cells (F). B: Low-power image of RALDH-2 expression. G–I: Insets from (B) show that like RALDH-1, RALDH-2 is found only in the deep mesenchyme in the dorsomedial region (G). The boundary matches that of RALDH-1 (H). In the ventrolateral region, RALDH-2 is expressed both by cells in the superficial mesenchyme and the deep mesenchyme (I). C: Low-power image of RALDH-3 expression. J–L: Insets from (C) show that in the dorsomedial region RALDH-3 is not present (J). The boundary between dorsal and ventral is sharply delimited (K), and in the ventrolateral region RALDH-3 staining is apparent in cells directly beneath the basement membrane (L). In these images arrowheads mark the basal lamina. Scale bars = 50 μm in A–C; 20 μm in J–L.
The pattern of RALDH-2 expression (Fig. 1B,G–I) was similar to that of RALDH-1. RALDH-2 labeled Sus cells of the ventrolateral epithelium only, and the boundary between the expression domain of ventrolateral OE and the absence of labeling dorsomedially was sharp (Fig. 1H). Similar to RALDH-1, RALDH-2 was also differentially expressed in the more superficial parts of the lamina propria, labeling a kind of fibroblastic cell in that stratum of the lamina propria of the ventrolateral mucosa (which will be described further below), but not in the dorsomedial domain (Fig. 1G). The staining difference between dorsomedial and ventrolateral mucosa is not, however, evident when the deeper part of the lamina propria is examined. Unlike RALDH-1, RALDH-2 did not label OECs.
RALDH-3 labeling (Fig. 1C,J–L) was also concentrated in the ventrolateral domain of the OM, but unlike either RALDH-1 or RALDH-2, the expression of RALDH-3 was much more discrete. The cells that expressed RALDH-3 were entirely confined to the most superficial aspect of the lamina propria of the ventrolateral domain (Fig. 1L), and were directly apposed to the deep surface of the basement membrane for the most part (Fig. 1L). Additionally, a small population of cells in the basal stratum of the epithelium expressed RALDH-3; these cells will be described in more detail below. The expression for RALDH-3 was sharply demarcated (Fig. 1K) at the same boundary as RALDH-1 and RALDH-2.
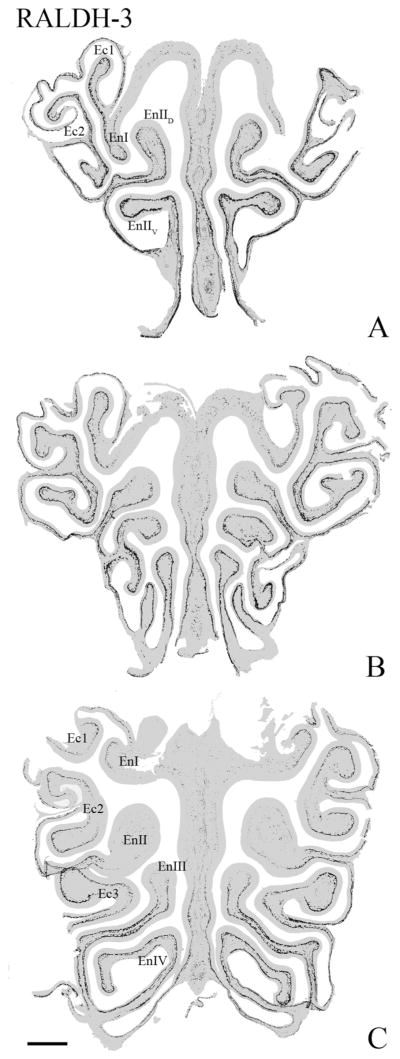
The foregoing pattern of differential expression—high in ventral and lateral mucosa and low in dorsomedial with a sharp boundary between the territories—was evident at all anteroposterior levels of the olfactory mucosa for each of the three enzymes. The pattern of differential RALDH-3 expression is the easiest of the three to appreciate when examining the mucosa as a whole at low magnification (Fig. 2). However, close examination of the staining with RALDH-1 and RALDH-2 on multiple AP-spaced sections also reveals the same general features described above.
Figure 2.
The differential expression of RALDH-3 is evident along the anteroposterior axis of the mucosa. A–C: Progressively more posterior sections through the nose. This representation of RALDH-3 staining was constructed by pasting those pixels where DAB is deposited above background onto a grayed-out image of the section. RALDH-3 staining is largely limited to the ventral and lateral portions of the mucosa, and the boundary between areas with labeling immediately subjacent to the basal lamina are sharply bounded along the traverse from ventrolateral to the more dorsomedial areas. En, endoturbinate; Ec, ectoturbinate. Scale bar = 0.5 mm.
Although the expression pattern of the three RALDH enzymes is coextensive in the lamina propria of the ventrolateral mucosa, different populations of lamina propria cells were labeled by the three antisera. No double-labeled cells were observed in either the dorsomedial (Fig. 3A–C) or the ventrolateral (Fig. 3D–F) regions of the normal OM when IHC was performed with both antisera to RALDH-2 and to RALDH-3. We conclude that, at least in the uninjured tissue, the expression of RALDH-2 and RALDH-3 is found in mutually exclusive cells.
Figure 3.
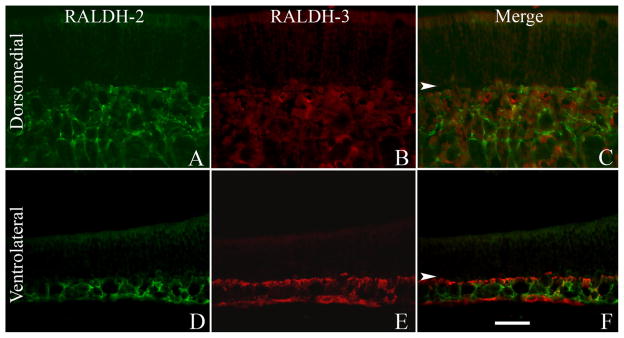
The expression of RALDH-2 and RALDH-3 is mutually exclusive. A: RALDH-2 is expressed by cells in the deeper aspects of the normal dorsomedial mucosa. B: RALDH-3 is completely absent from this region. C: Merged image of staining for both. D: In the ventrolateral mucosa RALDH-2 is expressed throughout the depth of the mucosa but less prominent in the regions directly subjacent to the basement membrane. E: RALDH-3 is confined to the cell layer directly subjacent to the basal lamina (arrowheads) and, additionally, to the periosteum at the deeper edge of the tissue. F: RALDH-2 and RALDH-3 are not expressed by the same cells in the unlesioned mucosa. In these images, arrowheads mark the basal lamina. A magenta-green version of this figure may be found online as Supporting Figure 3. Scale bar = 20 μm.
In situ hybridization with RALDH-1, -2, -3 antisense probes
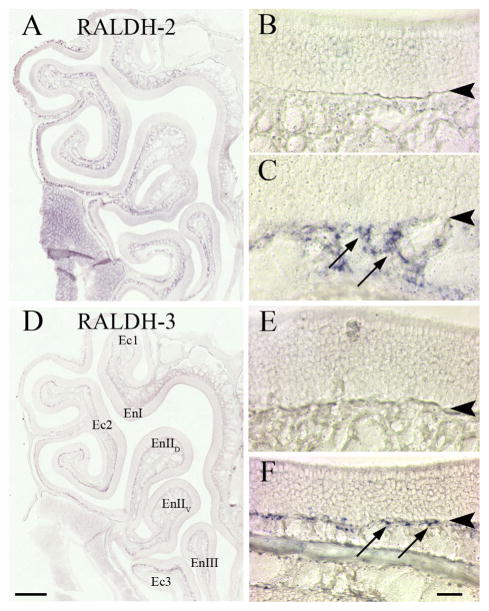
We performed ISH to document whether the mRNA for each of the three RALDH enzymes was coextensive with the protein distribution determined by IHC, and to affirm that the unique immunolabeling with each of the three RALDH antisera could be attributed to each of the individual enzymes. The ISH for RALDH-2 (Fig. 4A–C) and RALDH-3 (Fig. 4D–F) very closely resembled their immunohistochemical counterparts. The ISH label for RALDH-2 was evident throughout the ventrolateral mesenchyme (Fig. 4C), but was undetectable in the dorsomedial mesenchyme (Fig. 4A). Similarly, the mRNA for RALDH-3 mirrored the IHC result; it was absent from the dorsomedial region of the mucosa (Fig. 4E), but it was found in cells that were subjacent to the basement membrane, and only in the ventrolateral domain (Fig. 4F). It is important to note that, as is true of ISH in general, the hybridization signal is much weaker than observed by immunohistochemical analysis (e.g., contrast the distribution of RALDH-2 protein with RALDH ISH signal here and in Norlin et al., 2001). In the case of RALDH-1 the signal obtained by ISH, while it did match some of the features of the IHC analysis, in others it did not; thus, we saw weak signal in Sus cells, but none was detectable in OECs. It is important to note that the identification of RALDH1 in Sus cells is confirmed by microarray analysis of their gene profile after purification on the basis of high level expression of GFP as a knockin allele of the Sox2 locus (Krolewski et al., submitted); post-hoc analysis indicates a purity in excess of 90% using this strategy. In this population, RALDH-1 was enriched by more than 3-fold relative to whole mucosa and 5.5-fold relative to olfactory marker protein (OMP) (+) OSNs; in this case, there was no effort to separate ventrolateral from dorsomedial mucosa. Thus, the level of differential expression of RALDH-1 in Sus cells relative to other cell types is very likely to be greater than the fold-changes listed in its expression domain. Thus, we conclude that the unique pattern of expression for each of the three RALDH enzymes, shown by IHC, is indeed attributable to the antigen intended.
Figure 4.
The pattern of RALDH-2 and RALDH-3 mRNA expression matches the pattern of RALDH-2 and RALDH-3 IHC staining. ISH with DIG-labeled riboprobes designed against the full-length mRNA of the RALDH enzymes. A: Low-power view of the epithelium showing the general labeling pattern of RALDH-2, which fills the lamina propria in ventral mucosa, but is less prevalent in much of the dorsomedial mucosa and absent from the dorsal recess, in keeping with previously published results (Norlin et al., 2001). B,C: Higher-power view to illustrate the labeling pattern in the dorsomedial (B) vs. ventrolateral (C) mucosa. The arrows in C mark stained cells within the lamina propria. D: Low-power view of the mucosa showing the pattern of RALDH-3 ISH label, which is situated immediately deep to the basal lamina. E: High-power view of the dorsal recess. F: High-power view of ventrolateral mucosa to show that the labeling pattern of this gene matches the pattern seen with IHC. Once again, arrows are used in F to indicate stained cells. Note that for both RALDH-2 and RALDH-3 ISH label the staining is less extensive than the IHC pattern, which is likely to be the consequence of the lower sensitivity of ISH (cf. Fig. 1). Arrowheads indicate the basal lamina. Scale bars = 0.5 mm in A,D; = 20 μm in B,C,E,F.
Relationship of RALDH and OCAM/mamFasII expression
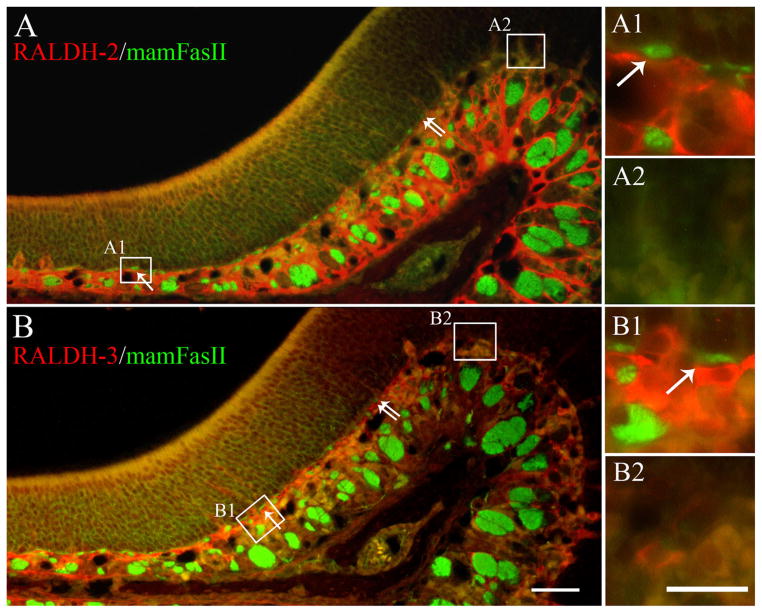
It has been reported that the mRNA for RALDH-2 in the adult mouse OE matched closely with the boundary defined by OCAM/mamFasII expression (Norlin et al., 2001). We therefore wished to determine whether the RALDH-2 and RALDH-3 protein also mapped to this boundary. OCAM/mamFasII is a member of the Ig-super-family of cell adhesion molecules that several laboratories, including ours, have shown to be expressed strongly and uniformly in the ventrolateral regions of the OE and very little, if at all, in the dorsomedial OE (Schwob and Gottlieb, 1986; Hamlin et al., 2004). It is thought to divide the epithelium into two broad zones, and to aid in fasciculation as axons move back toward the olfactory bulb (Treloar et al., 2003; Hamlin et al., 2004; Walz et al., 2006). Indeed, the double immunolabeling demonstrates that both RALDH-2 and RALDH-3 expression in the cells of the superficial part of the lamina propria of the ventrolateral mucosa falls sharply at the OCAM/mamFasII-defined boundary in the epithelium (Fig. 5A,B, double arrows). That boundary can be drawn precisely with reference to the low level of OCAM/mamFasII staining of neuronal cell bodies in the epithelium and the dense staining of the small axon fascicles subjacent to the basal lamina, both of which drop sharply during the traverse from ventrolateral to dorsomedial at that point (Fig. 5A,B).
Figure 5.
The boundary of RALDH-2 and RALDH-3 expression by IHC matches the boundary defined by OCAM/mamFasII. A: IHC analysis using antibodies against both OCAM/mamFasII (green), and RALDH-2 (red). The boundary marked by RALDH-2 can be placed by the sharp decline in red label of both the epithelium and by the abrupt fall-off in the staining of the cells in the superficial aspects of the lamina propria. The boundary marked by OCAM/mamFasII is marked best by the abrupt decline in the staining of the small nerve fascicles (examples indicated by the single arrows) immediately subjacent to the basal lamina, as shown previously (Schwob and Gottlieb, 1986). The boundary for each expression domain corresponds closely and that common boundary is marked by the double arrows. A1,A2: The insets provide a higher magnification view of the differences in the superficial lamina propria. B: Likewise, OCAM/mamFasII (green) and RALDH-3 (red) also share a common boundary as defined above (double arrows). Again, note the relation of RALDH-3 expression to the heavily labeled OCAM/mamFasII (+) nerve fascicles that are evident as they exit the epithelium (B1 arrows). A magenta-green version of this Figure may be found online as Supporting Figure 5. Scale bars = 50 μm in A,B; 20 μm in insets.
Markers of RA function: cellular-RA-binding protein-II, RA-degradative enzymes
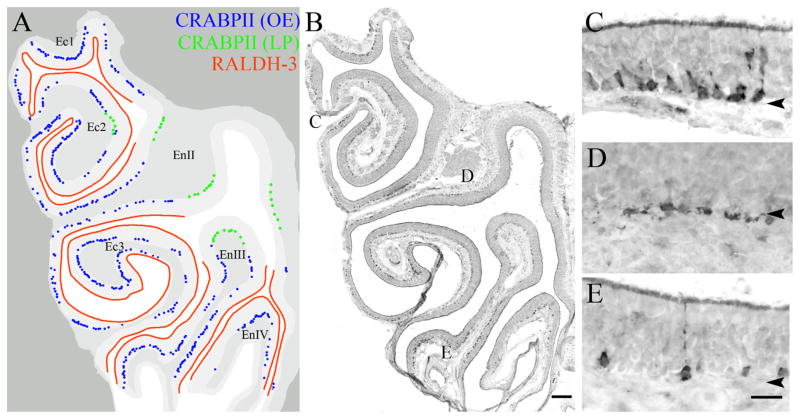
Because the differential distribution of cellular RA-binding proteins or CRABPs might contribute to differences in effective RA signaling (Delva et al., 1999), we assessed the expression of CRABP2 by IHC. In particular, CRABP2 protein is thought to enhance RA signaling by binding RA and facilitating its interaction with the RA receptors (Budhu and Noy, 2002; Delva et al., 1999). In the OE, the CRABP2 protein was limited to a population of basal cells in the ventrolateral OE, which were located superficial and adjacent to the lamina propria cells that express RALDH-3 (blue dots, Fig. 6A). Some CRABP2 (+) cells extended dorsal-ward past the RALDH-3 boundary, but these are found deep to the basal lamina and are not basal cells (green dots, Fig. 6A). By shape and position the CRABP2 (+) cells are a kind of globose basal cells. The presence of CRABP2 (+) basal cells suggest that certain cells of the ventrolateral epithelium may have an increased sensitivity to RA compared to like cells of the dorsomedial epithelium.
Figure 6.
The CRABPII protein is expressed by basal cells in the ventral and lateral epithelium in parallel with the expression of RALDH-3. Immunohistochemistry was performed with antibodies to both proteins on adjacent sections to compare the distributions of CRABPII and RALDH-3. A: Cartoon illustrating the staining pattern of CRABPII (blue and green dots) and relative to the territory characterized by intense expression of RALDH-3 (A, red line). Lightest grey designates epithelium. Medium grey indicates lamina propria and deeper tissue. B–E: Low-power (B), and high-power insets (C–E) of the mucosa stained for CRABPII. CRABPII is predominately found above the basement membrane (A, blue dots; C), and the labeling by CRABPII in the epithelium matches well with the distribution of RALDH-3 label. However, some cells in the superficial lamina propria in the region just dorsal to the RALDH-3-defined boundary are also CRABPII (+) as designated by the green dots in A and in the higher-power micrograph in D. Some of the CRABPII (+) cells appear to be neurons (E). Arrowheads mark the basal lamina. En, endoturbinate; Ec, ectoturbinate. Scale bars = 50 μm in A,B; 20 μm in C–E.
In other tissues, a gradient of RA is established both by the differential expression of the RALDHs and by the complementary, differential expression of the degradative enzymes of the CYP26 family (Sakai et al., 2001, 2004). We used qPCR to assay for differences in levels of expression of between dorsal vs. ventral mucosa. Levels of CYP26a1 and Cyp26b1 mRNA did not differ significantly between the two areas of the mucosa, while levels of OCAM/mamFasII message were more than 10-fold higher in ventral mucosa (a highly significant difference, Student’s t-test, P = 0.03, n = 3).
Taken together, the two sets of results suggest that any differential influence of RA between dorsal vs. ventral parts of the mucosa is more likely exerted as a consequence of differences in CRABPII expression than differential breakdown between the two regions.
Identity of RALDH-2 and RALDH-3-expressing cells found in the lamina propria
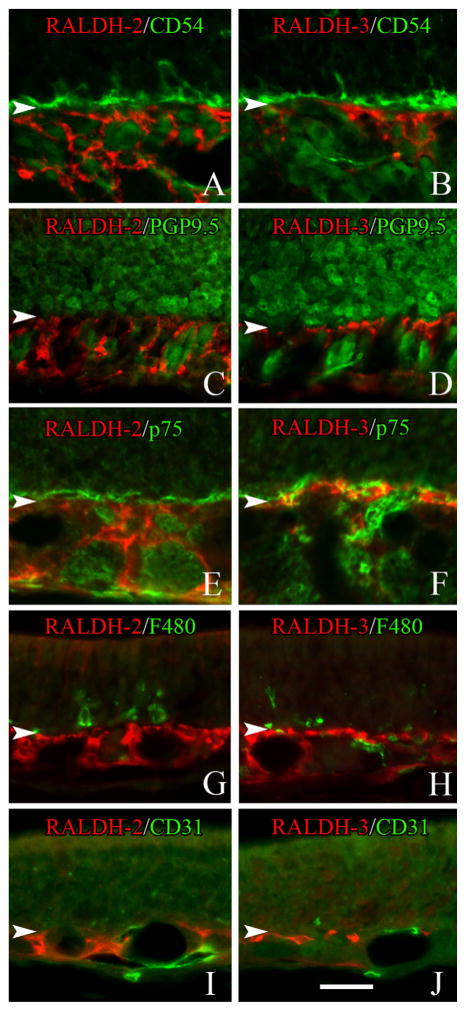
The identity of the RALDH-expressing cells in the OM is of obvious import. The identification of RALDH-1 (+) and RALDH-2 (+) Sus cells is based on cell-shape and position within the epithelium. With regard to the mutually exclusive populations of RALDH-2 (+) and RALDH-3 (+) cells below the basement membrane (Fig. 3C,F) we compared RALDH expression with a set of markers that differentiate specific cell types within the mesenchyme. On the basis of immunohistochemical analysis, RALDH expression was absent from a number of different cell types: HBCs marked by CD54 (Carter et al., 2004) (Fig. 7A,B); neurons marked by a high level of PGP9.5 (Weiler and Benali 2005) (Fig. 7C,D); glial cells marked by p75 (Ramon-Cueto and Nieto-Sampedro, 1992) (Fig. 7E,F); macrophages marked by F4/80 (Leenen et al., 1994) (Fig. 7G,H); and endothelial cells marked by CD31 (Vanzulli et al., 1997) (Fig. 7I,J). However, the cells that express RALDH-2 and RALDH-3 also expressed vimentin (Fig. 8), which suggests that both types of RALDH (+) cells are a kind of fibroblast.
Figure 7.
Identification of the cell types that express RALDH-2 (A,C,E,G,I) and RALDH-3 (B,D,F,H,J) in the lamina propria of the unlesioned mucosa. A,C,E,G,I: RALDH-2-expressing cells (red) do NOT express detectable levels of CD54 (which labels horizontal basal cells) (A), the neural marker PGP9.5 (C), the olfactory glial marker p75 (E), the macrophage marker F480 (G) or the endothelial cell marker CD31 (I). B,D,F,H,J: Likewise, RALDH-3 expressing cells (red) do not express detectable levels of CD54 (B), PGP9.5 (D), the p75 (F), F480 (H) or CD31 (H). Arrowheads mark the basal lamina. A magenta-green version of this Figure may be found online as Supporting Figure 7. Scale bar = 20 μm.
Figure 8.
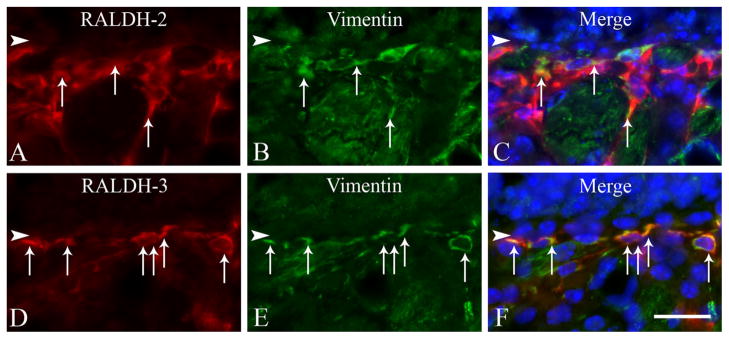
The RALDH-2 and RALDH-3 expressing cells do express a fibroblast marker, vimentin. A–C: Colabeling with the RALDH-2 antisera (red), with an antibody against vimentin suggests that that these cells are fibroblasts. D–F: Colabeling with the RALDH-3 antisera (red), with vimentin (green) indicates that these cells are also fibroblasts. Double-labeled cells are indicated with white arrows. Arrowheads mark the basal lamina. Scale bar = 20 μm.
Identity of RALDH-3-expressing cells found in the epithelium
The small population of RALDH-3 (+) cells that are seen in the basal layer of the ventrolateral OE was also characterized with reference to markers that differentiate basal cell types. Within the unlesioned, control OE, the RALDH3 (+) cells were also marked by the expression of SOX2, a transcription factor expressed by HBCs and the more upstream categories of GBCs (Guo et al., 2010) (Fig. 9A–C), as well as with PCNA, a marker for dividing cells (Fig. 9G), and, rarely, of the late neuronal progenitor-early neural marker PGP9.5 (Packard et al., 2011) (Fig. 9D–F). Taken together, the results suggest that the RALDH3 (+) basal cells in the normal OE are best categorized as GBCs.
Figure 9.
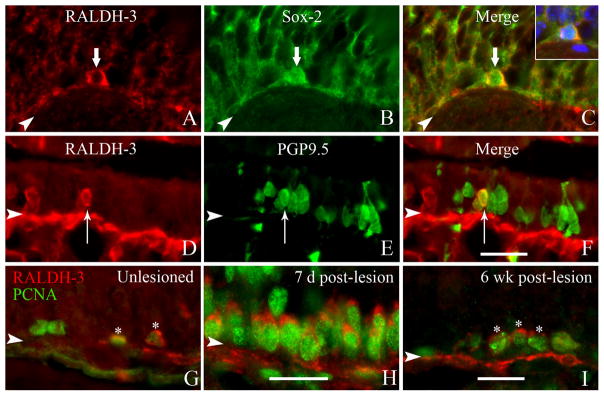
The RALDH-3 (+) cells in the epithelium are dividing and share characteristics with GBCs. A–C: Section from an unlesioned ΔSox-2:GFP mouse colabeled with the antisera against RALDH-3 (A, red) and GFP (B, green); the merged (C) image with the Hoechst channel in the inset indicates that the cells are Sox2 (+), which is a marker for upstream and transit-amplifying GBCs (Guo et al., 2010) (thick arrows). D–F: Colabeling with RALDH-3 antisera (D, red) and the neuronal marker PGP9.5 (E, green); the merged image (F) at 7 days post-MeBr lesion illustrate that some of these cells have the morphology of neurons (thin arrows). Arrowheads mark the basal lamina. G–I: Colabeling with the antisera against RALDH-3 (red) and PCNA (green) in the unlesioned epithelium (A), at 7 days post-MeBr lesion (B), and at 6 weeks post-MeBr lesion (C) suggests that these cells are dividing. Arrowheads mark the basal lamina. Scale bars = 20 μm.
Expression of RALDH-2 and RALDH-3 during recovery after MeBr lesion
In an attempt to clarify the identity of the RALDH-expressing cells of the OE and the lamina propria, we undertook an analysis of RALDH-2 and RALDH-3 staining during the recovery of the mucosa from the damage caused by exposure to the selective olfactotoxin, MeBr. The number of RALDH-3-expressing basal cells increased substantially during the recovery period. The number of RALDH-3 (+) cells was increased at 7 days postlesion (3.5 ± 1.0 cells/mm) as compared to uninjured control (0.59 ± 0.4 cells/mm), a difference that was statistically significant (P < 0.0001, unpaired Student’s t-test) (Fig. 9G–H). Their number remained somewhat elevated, even after 6 weeks of recovery following injury (Fig. 9I). The marked increase at 7 days and the lesser but still substantial increase at 6 months were also evident when focusing on the mitotically active, PCNA (+)/RALDH-3 (+) basal cells (Fig. 9G–I). In parallel, the total number of RALDH-3 (+) cells that expressed PGP9.5 increased concurrently with the expansion of the overall population of RALDH-3 (+) cells in the basal layer of the OE, but the percentage of cells that expressed both RALDH-3 and PGP9.5 remained a constant, a small fraction of the total (8.3% unlesioned, and 5.2% at 7 days postlesion; not significant by chi-square analysis).
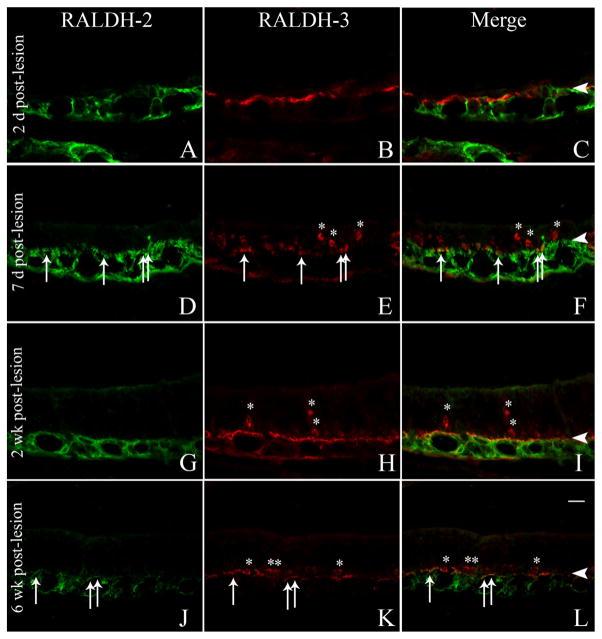
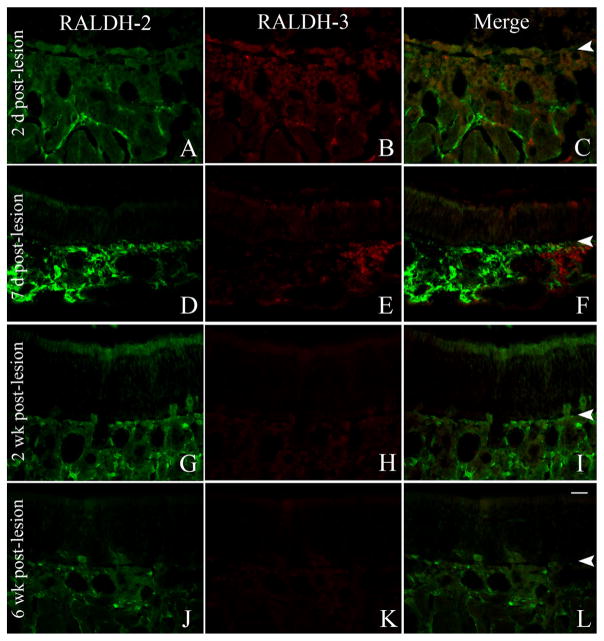
The pattern of expression of RALDH-2 and RALDH-3 in the lamina propria was also subtly different as a consequence of lesion. In ventrolateral parts of the mucosa the expression of RALDH-2 increased between 2 and 7 days after lesion, such that RALDH-2 (+) expression extended closer to the basal lamina and occasionally colocalized with RALDH-3; the coexpression of both by the same fibroblast was never observed in the normal mucosa (Fig. 10). RALDH-2 remained more prominent superficially through the second week after lesion before regressing to the deeper part of the lamina propria by 6 weeks post-MeBr (Fig. 10).
Figure 10.
RALDH-2/RALDH-3 expression is maintained in the lamina propria of the ventrolateral mucosa after MeBr lesion. A–L: Immu-nolabeling with RALDH-2 antisera (A,D,G,J; green) and RALDH-3 antisera (B,E,H,K; red) and merged (C,F,I,L) at 2 days (A–C), 7 days (D–F), 2 weeks (G–I), and 6 weeks post-MeBr lesion (J–L). At 7 days post-MeBr lesion some cells in the lamina propria express both proteins (D–F, arrows), and there are many more cells within the epithelium that express RALDH-3 than at the earlier timepoint. The RALDH-3 (+) epithelial cells persist in the epithelium at 2 and 6 weeks after lesion (asterisks, G–I, and J–L). Arrowheads mark the basal lamina. A magenta-green version of this figure may be found online as Supporting Figure 10. Scale bar = 20 μm.
In dorsomedial parts of the mucosa, RALDH-2 staining also became heavier in the superficial aspects of the lamina propria at 7 days after lesion by comparison with normal control and 2 days post-MeBr, and then regressed as observed ventrolaterally (Fig. 11). The expression of RALDH-3 never expanded into the dorsomedial domain at any of the timepoints examined (Fig. 11).
Figure 11.
The pattern of RALDH-2/RALDH-3 expression in the dorsomedial mucosa after lesion. A–L: Immunolabeling with the RALDH-2 antisera (A,D,G,J; green) and the RALDH-3 antisera (B,E,H,K; red) and the merged images (C,F,I,L) at 2 days (A–C), 7 days (D–F), 2 weeks (G–I), and 6 weeks post-MeBr lesion (J–L). At 2 days postlesion the level of RALDH-2 remains relatively low (A–C), as is characteristic of the unlesioned mucosa. However, at 7 days post-MeBr lesion the level of RALDH-2 increases to peak levels (D–F), before subsiding by 2 weeks (G–I) and returning to essentially the prelesion state 6 weeks post-MeBr lesion RALDH-2 (J–L). In contrast, RALDH-3 remains undetectable in the dorsomedial mucosa. Arrowheads mark the basal lamina. A magenta-green version of this figure may be found online as Supporting Figure 11. Scale bar = 20 μm.
Effect of blocking RA signaling during epithelial regeneration after MeBr lesion
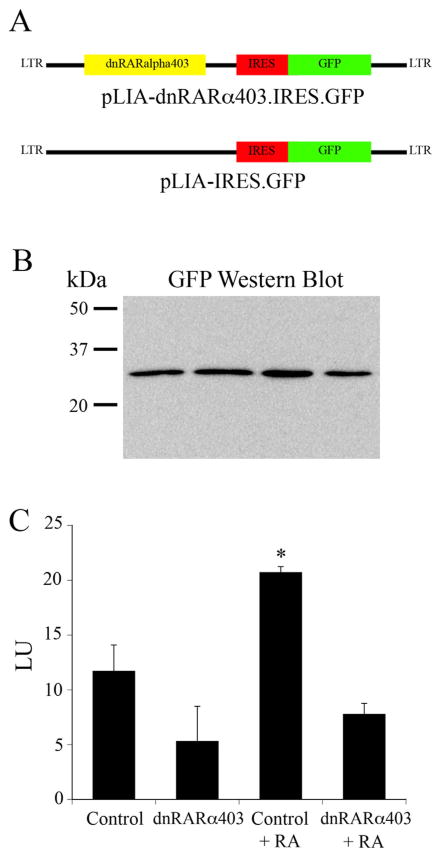
The foregoing anatomical analysis suggests that RA signaling plays a role in the differentiation of the epithelium, specifically with respect to those features of olfactory neuronal biology that differ from one part of the epithelium to another. Given the redundancy in distribution among the three RALDH enzymes, a more potent disruption of the apparent role of RA can be achieved by interfering with the signaling pathway downstream of synthesis. Accordingly, we used a replication-incompetent, retrovirally-derived vector to drive the expression of a truncated, dominant-negative form of the alpha isotype of the RA receptor (dnRARα403) in progenitor cells and their progeny (Fig. 12). With this construct, we can block RA signaling as the epithelium is repopulated in response to MeBr lesion and examine its role in neuronal differentiation.
Figure 12.
Retroviral constructs used for in vivo transduction. A: Map of the two RV constructs; top: encoding a truncated, dominant negative form of the alpha RA receptor (dnRARα403) along with an IRES motif and GFP in a bicistronic message; bottom: IRES-GFP alone. B: Western blot demonstrating the equivalence of GFP expression in HEK cells for the four samples illustrated in C (in order from left to right, control, dnRARα403, control + RA, dnRARα403 + RA). C: Luciferase levels for each of the four conditions indicated.
To ensure efficacy of blockade we used a cell-based assay to ensure that the dnRARα403-RV was able to block RA signaling by comparing the vector plus insert with the control vector alone in the ability to stop expression of a RARE-luciferase construct in HEK293 cells (see Materials and Methods for more detail). Transfection equivalence for the two constructs was shown by normalizing GFP, as determined by western blot, to total protein as measured by Coomassie. The ratios of GFP to total protein were closely comparable between the two vectors (Fig. 12), such that no significant differences were seen between them with analysis of variance (ANOVA), indicating that they were equivalently effective at driving expression of the transfected gene. When transfected into the HEK cells, the pLIA dnRARα403 construct was effective at blocking luciferase production both at baseline and in response to exogenous RA. Indeed, RA-driven luciferase levels after cotransfection with the dnRARα were less than half those observed with the “empty” vector control. (Fig. 12, ANOVA, P < 0.05). Thus, dnRARα403-RV provides a functional block of RA signaling in vitro and thus is likely to be effective in vivo.
Mice were MeBr-lesioned and then received an intra-nasal infusion of RV the following day (see Materials and Methods). The vast majority of clones that derive from either the control or dnRARα403-RV infection are limited to the ventrolateral epithelium, i.e., that territory in which RALDHs, the RA-synthesizing enzymes, are more highly expressed. The spatial restriction, while fortuitous, seems to reflect the differential sensitivity of dorsomedial vs. ventral and lateral OE to the effects of the toxin in certain strains of mice, and the restricted distribution is true of the control RV as well. Our initial inspection of the clones suggested that all cell types were represented in clones that derived from infection with the dnRARα403-RV as was true of the control vector (Fig. 13). Moreover, the numbers of the various cell types summed across all clones, with the exception of neurons, were equivalent (Fig. 13). However, the neuronal population of the clones derived from progenitors infected/transduced by the dnRARα403-RV differed in composition from that of clones arising from transduction with the control vector, either on an individual clone basis (cf. Fig. 13A–C vs. 13D–F) or when comparing the groups summed across all clones (Fig. 13G,H). In dnRARα403-RV derived clones, neurons were present and indeed more numerous as compared with the control vector (Fig. 13G). Nonetheless, there were morphological differences between neurons expressing the dnRARα403 as compared to control: dnRARα403-expressing neurons looked disorganized with oddly shaped somata and what appear to be misshapen dendrites (Fig. 13D). The clones were immunostained for OMP (a marker for mature olfactory sensory neurons) to determine whether there were any differences in the maturational status of dnRARα403-expressing OSNs. Examination of individual clones (cf. Fig 13A–C vs. 13D–F) or a detailed analysis and summation across clones (Fig. 13H) demonstrates that the clones arising from dnRARα403-RV infection had a significantly lower percentage of mature neurons when compared to control clones (3% and 37%, respectively, P < 0.001 chi-square analysis), despite the increased percentage of neurons overall in the dnRARα403 clones (74% vs. 59%, P = 0.01, chi-square analysis) (Fig. 13H). The paucity of OMP-expressing neurons among the clones derived from dnRARα-transduced progenitors could be due to aborted differentiation and/or abbreviated survival. Staining with activated caspase C to identify dying cells did not show a difference between the control vector and the dnRARα (data not shown). However, the relative rarity of the two events (infected clones and caspase (+) neurons) makes it impossible to distinguish these alternatives at the present time.
DISCUSSION
In the work presented here, we used ISH and IHC to demonstrate that all three RALDH enzymes are expressed differentially in ventral and lateral vs. dorsomedial OM, and that the shift from high to low expression of the RALDH enzymes in and near the epithelium is abrupt and maps to the boundary defined by the transition from high to no/low expression of OCAM/mamFasII. In addition, we have shown that, in the uninjured state, each of the three RALDH enzymes is expressed by a different specific subset of cells in the OM. Further, CRABP2 is also differentially expressed across the OE, such that CRABP2 (+) epithelial cells are concentrated ventrolaterally; however, the distribution of such cells is less sharply bounded than for the RALDHs. We have also shown that following recovery from lesion of the OM by MeBr the expression patterns of the RALDHs are maintained and that, in some cases, cells that are making RALDH-3 are also contributing to the neuronal cell lineage. Finally, we have demonstrated by RV transduction that a dominant-negative form of the RARα when expressed in the neuronal lineage that is newly generated in the MeBr-lesioned/ recovering OE that RA signaling is required for the terminal differentiation or survival of OSNs.
The pattern of expression illustrated here shows some similarities to and some differences from previous reports. The most substantial point of agreement is with the results of the Bohm group, who reported that the mRNA for RALDH-2 was concentrated in ventrolateral, as opposed to dorsomedial, olfactory mucosa (Norlin et al., 2001); using ISH on mouse tissue, they described a gradient of RALDH-2 expression in the lamina propria, increasing from dorsomedial to ventrolateral. Our IHC staining, although broadly consistent with the previous ISH results (Norlin et al., 2001), leads us to a slightly different interpretation. By focusing on the labeling in the olfactory epithelium and in the most superficial part of the lamina propria (i.e., that part closest to the epithelium), we find that there is a sharp transition—rather than a gradient—in the pattern and intensity of staining, both of which drop off precipitously at the boundary defined by mamFasII/ OCAM labeling. Some of the differences in interpretation may be due to the lesser sensitivity of ISH. IHC allows us to recognize clearly RALDH-2 staining above background in Sus cells; our ISH for RALDH-2 also shows differential labeling of dorsomedial vs. ventral and lateral epithelium but the labeling of ventral epithelium is light, and the fall-off in dorsal epithelium is correspondingly much more subtle. In addition, we were, no doubt, sensitized to the putative existence of a sharp boundary by comparison with the other RALDHs, which have not been described previously.
In contrast to our agreement with Norlin et al. (2001), our conclusions vary substantially from another report, which suggested that in the rat, at least, no gradations in the expression of any of the RALDHs enzymes existed (Asson-Batres and Smith, 2006). On closer examination, however, the pattern of expression that they show for RALDH-2 in the rat is similar to what we have shown for RALDH-2 in the mouse, as they also show that the heaviest labeling in the dorsal recess is in the deepest part of the lamina propria (Asson-Batres and Smith, 2006). Further, they report that they find only scant amounts of RALDH-3 by RT-PCR relative to the other isoforms of RALDH, and no specific pattern by IHC (Asson-Batres and Smith, 2006). In mice, however, RALDH-3 is heavily expressed in a specific small subset of fibroblasts, a minor component of the overall tissue mass, which would result in a relatively lower signal on RT-PCR when compared to the other RALDHs. Thus, our data again are relatively consistent with their reported findings. While the article from Asson-Batres and Smith suggests that the absence of graded expression implies functional redundancy to protect against vitamin A deficiency, our data suggest instead that all three of the RALDHs would serve to reinforce the same differential pattern of expression,.
The differential pattern of RALDH expression and its correlation with the pattern of gene expression certainly suggests that RA is exerting differential effects on ventrolateral OE as compared with dorsomedial, and that implication is reinforced by the differences in expression of CRABP2 across the plane of the mucosa. Furthermore, the correlation between RALDH-2 and Msx1, which is a purported RA target, although generally found to respond to RA by being downregulated, is also suggestive (Brown et al., 1997; Nugent and Greene, 1998). We did not observe a gross difference in active RA between the dorsomedial and ventrolateral mucosa using HEK293 cells transfected with a RARE-Luc promoter (data not shown), but that assay may be insensitive to local concentration of RA in the vicinity of its target cells, which is more likely to be critical to the behavior of the cells. Certainly, the basal cells of the epithelium are in close proximity to both RALDH (+) lamina propria cells as well as those basal cells themselves that express RALDH-3. Thus, localized changes in RA concentration may be contributing to the patterning of the tissue, rather than acting in a functionally redundant manner to ensure a steady-state level of RA across the epithelial plane.
A further potential means for achieving local regulation of RA concentration may be reflected in the expression of CRABP2. We find that a population of cells in the basal layer of the ventral and lateral epithelium proper expresses the CRABP2 protein, which is thought to facilitate the transport of RA into the nucleus and thus enhance its interaction with its receptors (Budhu and Noy, 2002). Importantly, these cells were concentrated in the region of the epithelium defined by the expression of RALDH-3 in the underlying lamina propria, placing the CRABP2 (+) cells in close apposition to the mesenchymal fibroblasts that are synthesizing RA. Thus, close proximity to a local source of RA coupled with increased sensitivity of cells in the ventral and lateral region may result in a net positive RA effect here when compared to the dorsomedial mucosa.
Since the adult epithelium is continuously generating new neurons and is capable of recovery after profound injury, any factor that might convey a sense of spatial order on the neural field during lesion-induced neurogenesis is most likely to be found in a relatively protected location, such as the lamina propria. In keeping with that notion, the role of RA in other systems makes it an attractive candidate for patterning OSNs across the epithelial field. Furthermore, terminally differentiated neurons of the OE depend on RA for their long-term survival. For example, when a dominant-negative RA receptor (dnRARα403) was driven selectively in mature neurons, by use of the OMP promoter, it was shown that mature neurons die by apoptosis (Hagglund et al., 2006). Furthermore, in adult rats vitamin A deprivation led to the selective loss of mature neurons. In this case, gross abnormalities in epithelial thickness were not observed, as there was a compensatory increase in progenitor-cell proliferation, which resulted in a greater number of immature neurons, and thus no overall change in cell-number (Asson-Batres et al., 2003). These studies illustrate that RA is required to support the fully differentiated neuron, and thus the fully differentiated sensory map.
Our results demonstrate that RV transduction with dnRARα403 also results in a failure of emergence and/or persistence of mature, OMP (+) OSNs that derive from the infected progenitor. Thus, they are similar in outcome to the foregoing manipulations. However, by virtue of our examination of the regenerating OE, with its synchronization of neurogenesis, we provide a better sense of when RA signaling is necessary in the differentiation program of olfactory neurons, and our results suggest that RA is required at some point around the time that terminal differentiation occurs. Since OR gene expression lags the onset of neuronal differentiation (Iwema and Schwob, 2003), the demonstration that blocking RA signaling during neurogenesis produces a depleted pool of mature neurons may still reflect an influence on OR expression or other spatially restricted feature of the olfactory periphery.
The studies described above suggest that there may be more than one distinct role for RA in the mature OE. First, the expanded population of immature neurons observed here are also compatible with an effect of RA on the proliferative activity of progenitor cells. Second, the observation that the mature neurons die in the absence of RA or when RA is blocked after terminal differentiation illustrates that RA is required to support the fully differentiated neuron, and thus the fully differentiated sensory map. Third, the data presented here showing that RA is required for the OSN to become terminally differentiated lends support to the idea that RA may indirectly control OR expression by affecting upstream genes that are required for OR choice and ultimately for terminal differentiation to occur.
In conclusion, the differential expression of the RA synthetic enzymes, as well as elements of the RA machinery, may be necessary to set up patterns of RA concentration/responsiveness across the epithelial plane. Further, these local differences in RA concentration may act on neural progenitor cells to elicit specific cell-fate decisions that lead to the maturation of the individual neuron and that are potentially relevant for the proper formation of the olfactory neural field as a whole.
Supplementary Material
Acknowledgments
Grant sponsor: National Institute on Deafness and Other Communication Disorders; Grant numbers: F31 DC007373, R01 DC000467, R01 DC002167.
Footnotes
Additional Supporting Information may be found in the online version of this article.
LITERATURE CITED
- Appel B, Eisen JS. Retinoids run rampant: multiple roles during spinal cord and motor neuron development. Neuron. 2003;40:461–464. doi: 10.1016/s0896-6273(03)00688-3. [DOI] [PubMed] [Google Scholar]
- Asson-Batres MA, Smith WB. Localization of retinaldehyde dehydrogenases and retinoid binding proteins to sustentacular cells, glia, Bowman’s gland cells, and stroma: potential sites of retinoic acid synthesis in the postnatal rat olfactory organ. J Comp Neurol. 2006;496:149–171. doi: 10.1002/cne.20904. [DOI] [PMC free article] [PubMed] [Google Scholar]
- Asson-Batres MA, Zeng MS, Savchenko V, Aderoju A, McKanna J. Vitamin A deficiency leads to increased cell proliferation in olfactory epithelium of mature rats. J Neurobiol. 2003;54:539–554. doi: 10.1002/neu.10192. [DOI] [PMC free article] [PubMed] [Google Scholar]
- Bhasin N, Maynard TM, Gallagher PA, LaMantia AS. Mesenchymal/epithelial regulation of retinoic acid signaling in the olfactory placode. Dev Biol. 2003;261:82–98. doi: 10.1016/s0012-1606(03)00295-1. [DOI] [PubMed] [Google Scholar]
- Brown JM, Robertson KE, Wedden SE, Tickle C. Alterations in Msx 1 and Msx 2 expression correlate with inhibition of outgrowth of chick facial primordia induced by retinoic acid. Anat Embryol (Berl) 1997;195:203–207. doi: 10.1007/s004290050039. [DOI] [PubMed] [Google Scholar]
- Budhu AS, Noy N. Direct channeling of retinoic acid between cellular retinoic acid-binding protein II and retinoic acid receptor sensitizes mammary carcinoma cells to retinoic acid-induced growth arrest. Mol Cell Biol. 2002;22:2632–2641. doi: 10.1128/MCB.22.8.2632-2641.2002. [DOI] [PMC free article] [PubMed] [Google Scholar]
- Carter LA, MacDonald JL, Roskams AJ. Olfactory horizontal basal cells demonstrate a conserved multipotent progenitor phenotype. J Neurosci. 2004;24:5670–5683. doi: 10.1523/JNEUROSCI.0330-04.2004. [DOI] [PMC free article] [PubMed] [Google Scholar]
- Chen X, Fang H, Schwob JE. Multipotency of purified, transplanted globose basal cells in olfactory epithelium. J Comp Neurol. 2004;469:457–474. doi: 10.1002/cne.11031. [DOI] [PubMed] [Google Scholar]
- Chess A, Simon I, Cedar H, Axel R. Allelic inactivation regulates olfactory receptor gene expression. Cell. 1994;78:823–834. doi: 10.1016/s0092-8674(94)90562-2. [DOI] [PubMed] [Google Scholar]
- Chung J, Liu C, Smith DE, Seitz HK, Russell RM, Wang XD. Restoration of retinoic acid concentration suppresses ethanol-enhanced c-Jun expression and hepatocyte proliferation in rat liver. Carcinogenesis. 2001;22:1213–1219. doi: 10.1093/carcin/22.8.1213. [DOI] [PubMed] [Google Scholar]
- Damm K, Thompson CC, Evans RM. Protein encoded by v-erbA functions as a thyroid-hormone receptor antagonist. Nature. 1989;339:593–597. doi: 10.1038/339593a0. [DOI] [PubMed] [Google Scholar]
- Damm K, Heyman RA, Umesono K, Evans RM. Functional inhibition of retinoic acid response by dominant negative retinoic acid receptor mutants. Proc Natl Acad Sci U S A. 1993;90:2989–2993. doi: 10.1073/pnas.90.7.2989. [DOI] [PMC free article] [PubMed] [Google Scholar]
- Delva L, Bastie JN, Rochette-Egly C, Kraiba R, Balitrand N, Despouy B, Chambon P, Chomienne C. Physical and functional interactions between cellular retinoic acid binding protein II and the retinoic acid-dependent nuclear complex. Mol Cell Biol. 1999;19:7158–7167. doi: 10.1128/mcb.19.10.7158. [DOI] [PMC free article] [PubMed] [Google Scholar]
- Dupe V, Matt N, Garnier JM, Chambon P, Mark M, Ghyselinck NB. A newborn lethal defect due to inactivation of retinaldehyde dehydrogenase type 3 is prevented by maternal retinoic acid treatment. Proc Natl Acad Sci U S A. 2003;100:14036–14041. doi: 10.1073/pnas.2336223100. [DOI] [PMC free article] [PubMed] [Google Scholar]
- Hagglund M, Berghard A, Strotmann J, Bohm S. Retinoic acid receptor-dependent survival of olfactory sensory neurons in postnatal and adult mice. J Neurosci. 2006;26:3281–3291. doi: 10.1523/JNEUROSCI.4955-05.2006. [DOI] [PMC free article] [PubMed] [Google Scholar]
- Hamlin JA, Fang H, Schwob JE. Differential expression of the mammalian homologue of fasciclin II during olfactory development in vivo and in vitro. J Comp Neurol. 2004;474:438–452. doi: 10.1002/cne.20133. [DOI] [PubMed] [Google Scholar]
- Hasegawa H, Wang F. Visualizing mechanosensory endings of TrkC-expressing neurons in HS3ST-2-hPLAP mice. J Comp Neurol. 2008;511:543–556. doi: 10.1002/cne.21862. [DOI] [PMC free article] [PubMed] [Google Scholar]
- Hernandez RE, Putzke AP, Myers JP, Margaretha L, Moens CB. Cyp26 enzymes generate the retinoic acid response pattern necessary for hindbrain development. Development. 2007;134:177–187. doi: 10.1242/dev.02706. [DOI] [PMC free article] [PubMed] [Google Scholar]
- Hoffman LM, Garcha K, Karamboulas K, Cowan MF, Drysdale LM, Horton WA, Underhill TM. BMP action in skele-togenesis involves attenuation of retinoid signaling. J Cell Biol. 2006;174:101–113. doi: 10.1083/jcb.200604150. [DOI] [PMC free article] [PubMed] [Google Scholar]
- Iwema CL, Schwob JE. Odorant receptor expression as a function of neuronal maturity in the adult rodent olfactory system. J Comp Neurol. 2003;459:209–222. doi: 10.1002/cne.10583. [DOI] [PubMed] [Google Scholar]
- Iwema CL, Fang H, Kurtz DB, Youngentob SL, Schwob JE. Odorant receptor expression patterns are restored in lesion-recovered rat olfactory epithelium. J Neurosci. 2004;24:356–369. doi: 10.1523/JNEUROSCI.1219-03.2004. [DOI] [PMC free article] [PubMed] [Google Scholar]
- LaMantia AS, Colbert MC, Linney E. Retinoic acid induction and regional differentiation prefigure olfactory pathway formation in the mammalian forebrain. Neuron. 1993;10:1035–1048. doi: 10.1016/0896-6273(93)90052-s. [DOI] [PubMed] [Google Scholar]
- LaMantia AS, Bhasin N, Rhodes K, Heemskerk J. Mesenchymal/epithelial induction mediates olfactory pathway formation. Neuron. 2000;28:411–425. doi: 10.1016/s0896-6273(00)00121-5. [DOI] [PubMed] [Google Scholar]
- Leenen PJ, de Bruijn MF, Voerman JS, Campbell PA, van Ewijk W. Markers of mouse macrophage development detected by monoclonal antibodies. J Immunol Methods. 1994;174:5–19. doi: 10.1016/0022-1759(94)90005-1. [DOI] [PubMed] [Google Scholar]
- Miyamichi K, Serizawa S, Kimura HM, Sakano H. Continuous and overlapping expression domains of odorant receptor genes in the olfactory epithelium determine the dorsal/ventral positioning of glomeruli in the olfactory bulb. J Neurosci. 2005;25:3586–3592. doi: 10.1523/JNEUROSCI.0324-05.2005. [DOI] [PMC free article] [PubMed] [Google Scholar]
- Mombaerts P. Odorant receptor gene choice in olfactory sensory neurons: the one receptor-one neuron hypothesis revisited. Curr Opin Neurobiol. 2004;14:31–36. doi: 10.1016/j.conb.2004.01.014. [DOI] [PubMed] [Google Scholar]
- Muller PY, Janovjak H, Miserez AR, Dobbie Z. Processing of gene expression data generated by quantitative real-time RT-PCR. Biotechniques. 2002;32:1372–1374. 6, 8–9. [PubMed] [Google Scholar]
- Niederreither K, Fraulob V, Garnier JM, Chambon P, Dolle P. Differential expression of retinoic acid-synthesizing (RALDH) enzymes during fetal development and organ differentiation in the mouse. Mech Dev. 2002;110:165–171. doi: 10.1016/s0925-4773(01)00561-5. [DOI] [PubMed] [Google Scholar]
- Norlin EM, Alenius M, Gussing F, Hagglund M, Vedin V, Bohm S. Evidence for gradients of gene expression correlating with zonal topography of the olfactory sensory map. Mol Cell Neurosci. 2001;18:283–295. doi: 10.1006/mcne.2001.1019. [DOI] [PubMed] [Google Scholar]
- Nugent P, Greene RM. MSX-1 gene expression and regulation in embryonic palatal tissue. In Vitro Cell Dev Biol Anim. 1998;34:831–835. doi: 10.1007/s11626-998-0038-5. [DOI] [PubMed] [Google Scholar]
- Ramon-Cueto A, Nieto-Sampedro M. Glial cells from adult rat olfactory bulb: immunocytochemical properties of pure cultures of ensheathing cells. Neuroscience. 1992;47:213–220. doi: 10.1016/0306-4522(92)90134-n. [DOI] [PubMed] [Google Scholar]
- Rawson NE, LaMantia AS. A speculative essay on retinoic acid regulation of neural stem cells in the developing and aging olfactory system. Exp Gerontol. 2007;42:46–53. doi: 10.1016/j.exger.2006.05.021. [DOI] [PubMed] [Google Scholar]
- Ressler KJ, Sullivan SL, Buck LB. A zonal organization of odorant receptor gene expression in the olfactory epithelium. Cell. 1993;73:597–609. doi: 10.1016/0092-8674(93)90145-g. [DOI] [PubMed] [Google Scholar]
- Ross SA, McCaffery PJ, Drager UC, De Luca LM. Retinoids in embryonal development. Physiol Rev. 2000;80:1021–1054. doi: 10.1152/physrev.2000.80.3.1021. [DOI] [PubMed] [Google Scholar]
- Sakai Y, Meno C, Fujii H, Nishino J, Shiratori H, Saijoh Y, Rossant J, Hamada H. The retinoic acid-inactivating enzyme CYP26 is essential for establishing an uneven distribution of retinoic acid along the anterio-posterior axis within the mouse embryo. Genes Dev. 2001;15:213–225. doi: 10.1101/gad.851501. [DOI] [PMC free article] [PubMed] [Google Scholar]
- Sakai Y, Luo T, McCaffery P, Hamada H, Dräger UC. CYP26A1 and CYP26C1 cooperate in degrading retinoic acid within the equatorial retina during later eye development. Dev Biol. 2004;276:143–157. doi: 10.1016/j.ydbio.2004.08.032. [DOI] [PubMed] [Google Scholar]
- Schwob JE, Gottlieb DI. The primary olfactory projection has two chemically distinct zones. J Neurosci. 1986;6:3393–3404. doi: 10.1523/JNEUROSCI.06-11-03393.1986. [DOI] [PMC free article] [PubMed] [Google Scholar]
- Tsai MH, Wei IH, Jiang-Shieh YF, Jou MJ, Ko MH, Chen HM, Wu CH. Expression of protein gene product 9.5, tyrosine hydroxylase and serotonin in the pineal gland of rats with streptozotocin-induced diabetes. Neurosci Res. 2008;60:233–243. doi: 10.1016/j.neures.2007.11.003. [DOI] [PubMed] [Google Scholar]
- Vandesompele J, De Preter K, Pattyn F, Poppe B, Van Roy N, De Paepe A, Speleman F. Accurate normalization of real-time quantitative RT-PCR data by geometric averaging of multiple internal control genes. Genome Biol. 2002;3:RESEARCH0034. doi: 10.1186/gb-2002-3-7-research0034. [DOI] [PMC free article] [PubMed] [Google Scholar]
- Vanzulli S, Gazzaniga S, Braidot MF, Vecchi A, Mantovani A, Wainstok de Calmanovici R. Detection of endothelial cells by MEC 13.3 monoclonal antibody in mice mammary tumors. Biocell. 1997;21:39–46. [PubMed] [Google Scholar]
- Vassar R, Ngai J, Axel R. Spatial segregation of odorant receptor expression in the mammalian olfactory epithelium. Cell. 1993;74:309–318. doi: 10.1016/0092-8674(93)90422-m. [DOI] [PubMed] [Google Scholar]
- Weiler E, Benali A. Olfactory epithelia differentially express neuronal markers. J Neurocytol. 2005;34:217–240. doi: 10.1007/s11068-005-8355-z. [DOI] [PubMed] [Google Scholar]
- Whitesides J, Hall M, Anchan R, LaMantia AS. Retinoid signaling distinguishes a subpopulation of olfactory receptor neurons in the developing and adult mouse. J Comp Neurol. 1998;394:445–461. [PubMed] [Google Scholar]
- Zhang X, Firestein S. The olfactory receptor gene superfamily of the mouse. Nat Neurosci. 2002;5:124–133. doi: 10.1038/nn800. [DOI] [PubMed] [Google Scholar]
Associated Data
This section collects any data citations, data availability statements, or supplementary materials included in this article.


