Abstract
OBJECTIVES:
The objective of this study was to investigate whether ingestion of fructose and fructans (such as inulin) can exacerbate irritable bowel syndrome (IBS) symptoms. The aim was to better understand the origin of these symptoms by magnetic resonance imaging (MRI) of the gut. METHODS: A total of 16 healthy volunteers participated in a four-way, randomized, single-blind, crossover study in which they consumed 500 ml of water containing 40 g of either glucose, fructose, inulin, or a 1:1 mixture of 40 g glucose and 40 g fructose. MRI scans were performed hourly for 5 h, assessing the volume of gastric contents, small bowel water content (SBWC), and colonic gas. Breath hydrogen (H2) was measured and symptoms recorded after each scan.
RESULTS:
Data are reported as mean (s.d.) (95% CI) when normally distributed and median (range) when not. Fructose increased area under the curve (AUC) from 0–5 h of SBWC to 71 (23) l/min, significantly greater than for glucose at 36 (11–132) l/min (P<0.001), whereas AUC SBWC after inulin, 33 (17–106) l/min, was no different from that after glucose. Adding glucose to fructose decreased AUC SBWC to 55 (28) l/min (P=0.08) vs. fructose. Inulin substantially increased AUC colonic gas to 33 (20) l/min, significantly greater than glucose and glucose+fructose (both P<0.05). Breath H2 rose more with inulin than with fructose. Glucose when combined with fructose significantly reduced breath H2 by 7,700 (3,121–12,300) p.p.m./min relative to fructose alone (P<0.01, n=13).
CONCLUSIONS:
Fructose but not inulin distends the small bowel with water. Adding glucose to fructose reduces the effect of fructose on SBWC and breath hydrogen. Inulin distends the colon with gas more than fructose, but causes few symptoms in healthy volunteers.
INTRODUCTION
Although many patients with irritable bowel syndrome (IBS) believe that diet is important (1) and there has been some success with empirical diet therapy (2,3) it is only recently that a therapeutic diet with a clear rationale, which patients can easily understand, has been widely publicized (4,5,6,7,8). The low-FODMAP diet excludes FODMAPs (Fermentable Oligo- Di-, Mono-saccharides And Polyols). FODMAPs include short-chain carbohydrates such as fructose and lactose, fructo- and galacto-oligosaccharides such as fructans and galactans, and polyhydric alcohols such as sorbitol and mannitol (9). The term fructans includes carbohydrates with a chain length longer than 10, which are generally called inulins. They are also excluded from the low-FODMAP diet. The current understanding is that these dietary short-chain carbohydrates are poorly absorbed in the small intestine, enter the colon, and are fermented, producing gas and distension (10,11,12,13). Furthermore, as glucose is known to enhance the absorption of fructose (14,15), dietary sources in which glucose is associated with equal amounts of fructose are allowed, whereas those with more fructose than glucose are excluded. There is considerable interest in this diet as FODMAP intake (specifically fructose) has increased in Western diets over the past three decades owing to increased availability of fruit and concentrated fruit juices and the extensive use of high-fructose corn syrup in a wide variety of processed foods and beverages, ranging from soft drinks to yogurts and breads (16). The low-FODMAP diet has been shown to be effective in improving IBS symptoms, with one study reporting symptom improvements in 74% of patients with IBS and fructose malabsorption (7), shown in a placebo controlled trial to be due to restriction of fructose and/or fructans (6). More recent studies have confirmed these initial findings, with 76% of patients responding well to a restricted FODMAP intake compared with a historical cohort treated by conventional dietary restrictions in whom ∼50% responded (4). Similarly, a recent small open-label randomized controlled trial showed a response rate of 68% for the diet vs. 23% on usual diet (5).
Although successful in many patients, the low-FODMAP diet is highly restrictive and requires intensive dietician input. Furthermore, in practice it is only a minority of the initially excluded foods that are ultimately excluded in the final diet. This is likely because of variance in individual severity of malabsorption and bacterial fermentation of malabsorbed carbohydrate. Although the impact of oral ingestion of some FODMAPs (e.g., lactose (17) and mannitol (18) on increasing small bowel water has been demonstrated using a range of techniques, as has their malabsorption using breath hydrogen, it is desirable to link these events and understand more about the underlying mechanism. The ultimate aim would be to define the mode of action of the diet and hopefully to simplify and tailor it better to individual patients. This requires an understanding of how the very different components of the diet are handled by the intestine and hence cause symptoms.
A previous investigation using an ileostomy model has shown increased output of water and fermentable substrate after ingesting a high-FODMAP diet, but did not distinguish the effects of the differing components (11). Furthermore, ileostomists differ in many ways from intact humans as the terminal ileum undergoes adaptation responding to chronic dehydration associated with ileostomy formation. There is also a change in ileal bacteria that become more “colonic” in type (19). We therefore wanted to investigate the action of fructose and inulin on the small bowel and colon in intact humans using our noninvasive magnetic resonance imaging (MRI) technique. MRI can accurately measure the small bowel water content (SBWC) and diameter (13), and can also visualize gaseous distension in the colon, thereby potentially providing a unique correlation between symptoms and mechanisms. We have previously observed that the osmotically active nonabsorbable disaccharide lactulose and the polyol mannitol both cause a marked increase in SBWC (13,20). We hypothesized that the poorly absorbed osmotically active fructose would similarly increase small bowel water and, given the known effect of glucose on enhancing the absorption of fructose (21,22), we further hypothesized that adding glucose to the fructose would attenuate this increase in small bowel water. In contrast, the polymeric and osmotically inactive inulin, which is also not absorbed in the small bowel but fermented in the colon (23,24), would be predicted to not alter small bowel water but to lead to increased colonic gas volumes.
Our aims were therefore to investigate whether (i) fructose alone will increase SBWC compared with an equivalent mass of glucose; (ii) adding glucose 1:1 to fructose will reduce its effect on SBWC; and (iii) inulin would exert its greatest effect on the colon, having little effect on the small bowel. We aimed to improve our understanding of how fructose and inulin influence small and large bowel volumes that are potentially important in understanding how diets high in FODMAPs cause IBS symptoms.
METHODS
Study participants
A total of 17 healthy subjects (13 male and 4 female) with no history of gastrointestinal disorders were recruited. Of these, 1 withdrew and 16 (13 male, 3 female; aged 24±5 years with body mass index 23.3±2.1 kg/m2) completed the study. All subjects also completed the Patient Health Questionnaire 15 (PHQ 15) and the Hospital Anxiety and Depression Scale (HADS). Subjects were screened using a MRI safety questionnaire before randomization.
Study design
This study was a four-way randomized single-blind crossover study, with three volunteers attending on each study day. All subjects visited the study center on four separate occasions with 1 week between each visit. They were asked to fast from 20:00 h the previous day, and refrain from alcohol, caffeine, and strenuous exercise for 18 h before. Participants were further asked to refrain from eating bran, wheat, rye, high-FODMAP fruit and vegetables, beans, pulses, lentils, and excessively spicy foods on the day before the study, as these could stimulate bowel secretions. They completed questionnaires on arrival at the center to confirm adherence to study day restrictions. In keeping with previous studies (12,25), subjects were also asked to rinse their mouth with mouthwash (Corsodyl Daily, GlaxoSmithKline Consumer Healthcare, Brentford, UK) on arrival. This was to ensure that subsequent breath tests would not be affected by fermentation of the ingested saccharides by oral bacteria.
Volunteers underwent a baseline fasted scan 45 min before ingestion of the test meals. They received the unlabeled test drink (t=0 min) and underwent a second scan 15 min later (t=15 min). This was followed by a scan every hour up to t=315 min. After each scan, breath hydrogen (H2) tests were performed using a portable hand-held breath H2 meter (Gastro+ Gastrolyzer, Bedfont Scientific, Kent, UK). At that time, they also completed the four-point symptoms questionnaires scoring their feelings of abdominal gas, bloating, belching, nausea, abdominal pain, and diarrhea as “none” (score=1), mild (score=2), moderate (score=3), or “severe” (score=4). A final symptoms questionnaire was collected on the day after the study. After all procedures at the end of each study day, subjects were asked to swallow 75 g sweet corn (Green giant, General Mills UK, Uxbridge, UK) with water without chewing. The sweet corn was used as a transit marker and volunteers were asked to report at what time the sweet corn first appeared in their stool.
Test drinks
The unlabeled FODMAPs test drinks were given to each volunteer using a random assignment. Drinks consisted of 500 ml of water containing 40 g of either glucose (Dextrose monohydrate, Thronton & Ross, Huddersfield, UK), fructose (Holland & Barrett, Nuneaton, UK), inulin (Orafti HP, gifted by DKSH Great Britain, Wimbledon, UK), or a mixture of 40 g glucose with 40 g fructose. The glucose and fructose drinks were prepared by dissolving 40 g of sugar in boiling water (200 ml), followed by cold water (300 ml). The glucose and fructose drink mixture was prepared by mixing 40 g of each sugar and dissolving the mixture in 200 ml of boiling water, then making up to 500 ml with cold water. The inulin drink was prepared by adding 40 g of inulin to boiling water (500 ml) with constant stirring after which it was left to chill. With the exception of the inulin drink, the drinks were sweet tasting, and a teaspoonful of PLj lemon juice (Healthy Food Brands, West Sussex, UK) was added to improve palatability, as well as to minimize the differences in taste. All drinks were served chilled at ∼4 °C. Osmolality of each of the four test drinks was measured using a freezing point depression osmometer (Table 1).
Table 1. The osmolality and composition of the four drinks consumed by the volunteers during the study.
| Composition | Osmolality (mOsmol/kg) | Caloric value (kcal) | |
|---|---|---|---|
| Glucose | Dextrose monohydrate | 429 | 156 |
| Fructose | Fructose | 462 | 156 |
| Fructan | Inulina | 36 | 60 |
| Glucose+fructose | 50% dextrose monohydrate+50% fructose | 917 | 312 |
Inulin >99.5%, glucose+fructose+sucrose ≤0.5%, average degree of polymerization (DP) of inulin ≥23.
Other assessments
All volunteers were asked to note the form and frequency of their bowel movements on a Bristol stool diary starting from 3 days before the study began to 3 days after the 4-week study ended. The study design and protocol were approved by the Ethics Committee of the University of Nottingham (Nottingham, UK) on 19 July 2011, and volunteers gave written informed consent. The study was carried out according to Good Clinical Practice principles and registered on clinical trials.gov, identifier NTC 01459406.
MRI protocol
Images were acquired on a whole-body 1.5T scanner (Achieva, Philips Medical System, Best, The Netherlands). Volunteers were positioned supine, head first in the scanner with a 16-element SENSE (Philips Medical System) receive torso coil wrapped around the abdomen. Gastric emptying was measured using a balanced gradient echo sequence that acquired 50 contiguous axial slices under 1 expiration breath hold of 16.5 s (TR/TE=2.98/1.49 ms, flip angle 80° 256 × 256 reconstructed matrix, reconstructed in-plane resolution 1.56 × 1.56 × 5 mm3, SENSE 2.0). This imaging sequence yielded good contrast between the stomach's contents and the other surrounding organs. The amount of freely mobile water in the small bowel (SBWC) was measured as described and validated previously (20) with a sequence that produces high-intensity signals from liquid regions of the body and dark signals for other tissues and organs. A coronal single-short turbo spin-echo sequence was used to acquire 24 slices with a single expiration breath hold of 24 s (TR/TE=8,000/320 ms, 512 × 512 reconstructed matrix, voxel size 0.78 × 0.78 × 7 mm3). Colonic gas was determined using a coronal dual-echo gradient echo sequence that acquired 24 contiguous slices 1.76 × 1.76 × 7 mm3 with one expiration breath hold of 15 s (TR/TE1/TE2=157/2.30/4.60 ms, 256 × 256 reconstructed matrix, voxel size 1.76 × 1.76 × 7 mm3). This sequence allowed simultaneous collection of both in-phase and out-of-phase images, where voxels containing both water and fat are either bright or dark, respectively, and hence edges of different organs had black outlining, making it easier to identify the intestinal outline. Each period of imaging lasted between 5 and 10 min, after which volunteers were removed from the scanner and allowed to sit upright.
Data analysis
Volumes of liquid and gas in the stomach were defined using an intensity-based region-growing algorithm developed in-house (IDL, Research Systems, Boulder, CO). The program identifies pixels within a range of intensity levels connected to a user-defined starting point called a seed, with gaps filled using a morphological closing filter. The operator places the initial seed point, chooses the appropriate minimum (liquid) or maximum (air) intensity levels, and performs manual adjustments needed to define the regions of interest fully. This was performed slice by slice and at each time point, and the total gastric volume was reported as the sum of liquid volume and intragastric gas. SBWC was measured using validated methods that have been previously described (20). Colonic gas was determined after measuring colonic volumes. The in-phase and out-of-phase coronal images were first summed using in-house software written in C. Regions of interest were manually traced around the ascending, transverse, and descending segments of the colon on each image slice using Analyze 9 software (Biomedical Imaging Resource, Mayo Foundation, Rochester, MN) and the regions were summed across the slices. Colonic gas was qualitatively identified as regions that were completely black on the sum of the in-phase and out-of-phase images, and their total volume was assessed using histograms generated across the entire colon, with a maximum cutoff threshold level for gas determined as the mean+1 s.d. of the gas regions manually identified. For all data, the averaged data sets of volume against time were analyzed by calculating areas under the curves (AUCs) using the trapezoidal method. The diameter of the colon was assessed using a program developed in-house (IDL 6.4, Research Systems, Boulder, CO). The object maps of the three segments of the colon defined for colonic volume measurements (AC, TC, and DC) were loaded into the software and a maximum-intensity projection of each segment was generated in the coronal plane. The analyzer then selected each individual segment and drew a central axis, along the length of the segment. Diameters of the colon were then generated perpendicular to this axis, along its whole length. The average of the largest 5% diameters across each segment of the colon was then determined. The percent change from baseline was computed for the diameters of the ascending and transverse regions of the colon, and these values were compared with symptom scores for gas and bloating as obtained from the volunteers. The diameter of the small bowel was also assessed by drawing line profiles using Analyze 9 in the D4 region of the duodenum by the ligament of Treitz. Although the investigator was not blinded to the solutions on the study day, the scans were coded with nonsequential numbers for analysis and there was therefore no indication as to the solution consumed. The analysis was therefore effectively blinded.
Power and statistical analysis
The primary end point of the study was the postprandial AUC for SBWC for the four test meals. Previous work using mannitol and glucose (18) indicated that a 43% increase in postprandial SBWC could be detected with α=0.05 and 90% power using n=12. We studied five more to allow for dropouts and incomplete scans.
Data are reported as mean (s.d.) (95% CI) when normally distributed and median (range) for nonnormal distributions. Statistical tests were carried out using Prism 5 (GraphPad Software, La Jolla, CA). Data normality was first assessed using Shapiro–Wilk test of normality. Subsequent comparisons were performed using paired t-tests and multicomparison rank tests. One-way and two-way analysis of variance was used to assess the significance of differences between means, and statistical differences were considered significant at P<0.05.
RESULTS
Gastric volumes
The drinks consumed were easily visualized in the stomach using the imaging sequence. The AUC for gastric volume for each of the drinks is summarized in Table 2. As expected from its lower osmolality and reduced energy available for absorption based on caloric value (26) (Table 1), of all the solutions tested, the inulin drink emptied from the stomach the quickest, with a significantly lower AUC than glucose (P<0.01) and the mixture of glucose and fructose (P<0.001). However, the difference between the AUCs of fructose and inulin was not significant, nor was the mean AUC for fructose different from the AUC for glucose, the two solutions that had similar osmolalities and available energy.
Table 2. Mean AUCs for gastric contents, small bowel water content, breath H2, and colonic gas.
| Glucose | Fructose | Inulin | Glucose+fructose | |
|---|---|---|---|---|
| Gastric contents, median AUC (range; l/min; N=16) | 56 (47–79) | 48 (39–68) | 37 (31–57)** | 65 (51–82) |
| SBWC, median AUC (range; l/min; N=16) | 36 (11–132) | 67 (37–111)** | 33 (17–106) | 46 (32–130)* |
| Breath H2, mean AUC (s.d.; p.p.m./min; N=13) | 3,009 (3,000) | 10,200 (7,800)** | 18,000 (9,000)**** | 2,500 (2,000) |
| Colonic gas, mean AUC (s.d.; l/min; N=15) | 19 (14) | 25 (17) | 33 (20)* | 21 (19) |
AUC, area under the curve; H2, hydrogen; SBWC, small bowel water content.
*P<0.05 vs. glucose; **P<0.005 vs. glucose; ***P<0.001 vs. glucose; ****P<0.0001 vs. glucose.
All data were collected over 5 h from volunteers who drank glucose, fructose, inulin, and a mixture of glucose and fructose.
Breath H2
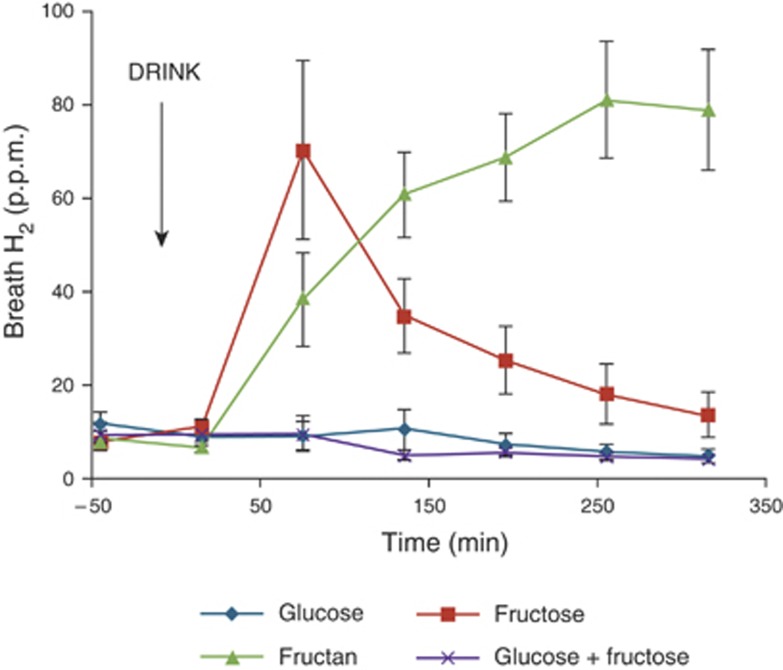
Of the 16 volunteers, 8 (50%) showed an increase in breath H2 of at least 20 p.p.m. after drinking fructose, whereas 13/16 (81%) showed a rise after drinking inulin. Inulin is poorly absorbed by everyone, and should have induced a breath H2 response in all participants, unless they were non-H2 or low H2 producers. The three volunteers who showed no rise in breath H2 were therefore excluded from subsequent analysis linking breath H2 with MRI parameters. The breath H2 concentration of the 13 H2 producers across the study day is shown in Figure 1. Drinking fructose led to an immediate increase in average breath H2 concentration that peaked at 75 min postprandial, after which concentrations returned to just above baseline. Drinking glucose did not have any effect on breath H2 concentrations, and addition of an equivalent amount of glucose to fructose significantly reduced the concentration measured relative to fructose (mean (95% CI) difference 7,800 (3,120–12,500) p.p.m./min, n=13 P=0.002) The trend across the study day for inulin was different, rising slowly throughout the day without returning to baseline at the end of the study day. Indeed, inulin was the largest producer of breath H2 over the study period , significantly greater than both glucose (mean (95% CI) difference 15,000 (9,500–20,400) p.p.m./min, n=13 P<0.0001) and fructose (mean (95% CI) difference 7,800 (940–3,300) p.p.m./min, n=13 P=0.027). Of the 16 volunteers, 5 showed no increase in breath H2 with fructose, whereas they showed an increase for inulin.
Figure 1.
Breath hydrogen (H2) concentrations throughout the study day for the 13 H2 producers after drinking each of the four drinks: glucose, fructose, fructan, and glucose+fructose mix. The time of drinking (t=0 min) is highlighted in the chart. Values are mean concentration (p.p.m.)±s.e.m.
Small bowel water content
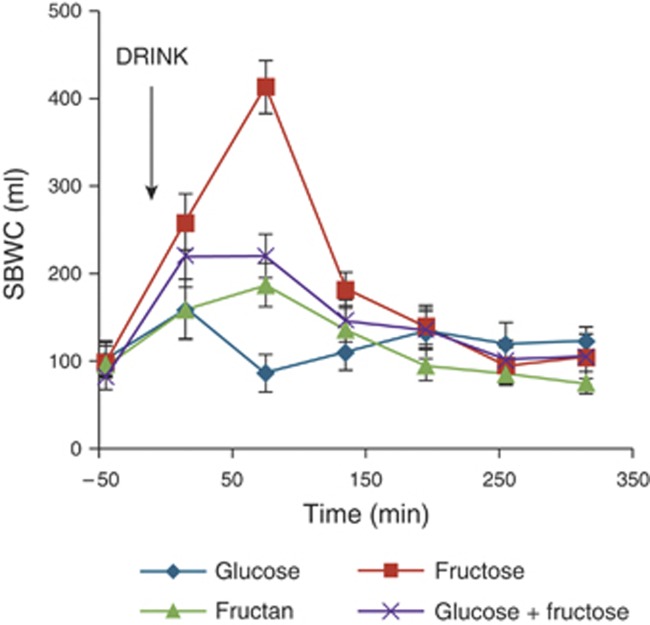
The volume of water in the small bowel increased after the fructose-containing drinks, peaking at 75 min postprandial, and returning to baseline by t=195 min (Figures 2 and 3). After glucose and inulin, the small bowel water changed little. As indicated in Table 2, fructose significantly increased the SBWC relative to glucose (mean (95% CI) difference being 28 (17–40) l/min, P<0.001), whereas inulin had little effect (mean (95% CI) difference being 2 (−7 to 10) l/min, P>0.7) compared with glucose. The addition of an equivalent amount of glucose to fructose reduced the SBWC, but this decrease failed to reach conventional statistical significance (mean (95% CI) difference being 16 (−2 to 35) l/min, P=0.08) compared with fructose.
Figure 2.
Small bowel water content (SBWC) throughout the study day for 16 volunteers after drinking each of the four drinks: glucose, fructose, fructan, and glucose+fructose mix. The time of drinking (t=0 min) is highlighted in the chart. Values are mean volume (ml)±s.e.m.
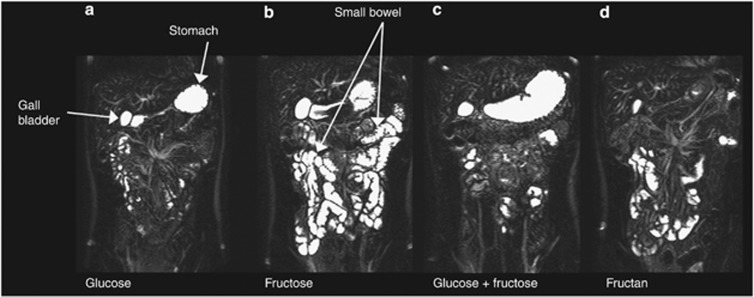
Figure 3.
A representative example of coronal images of the small bowel from a single volunteer at 75 min after drinking each of the test drinks: (a) glucose, (b) fructose, (c) glucose+fructose, and (d) fructan. The stomach and gall bladder are also visualized in these images.
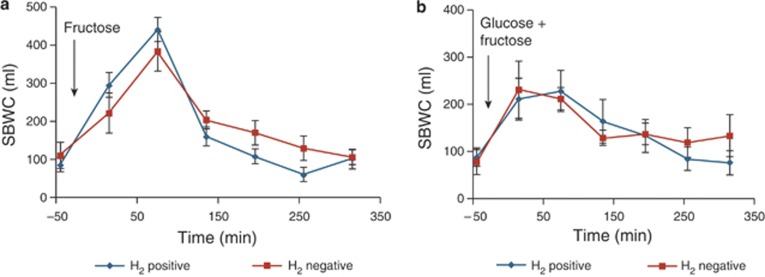
Based on breath H2 responses, the volunteers were then split into two groups, 8 fructose H2 negative and 8 fructose H2 positive, and the differences in their SBWC after drinking both the fructose and the mixture of glucose and fructose were examined. Figure 4a,b illustrates that there is no significant difference in SBWC between the two groups after fructose alone (mean (95% CI) difference being 3,500 (−22,000 to 29,000) l/min, P=0.77) or after drinking the mixture of glucose and fructose (mean (95% CI) difference being 1,800 (−29,000 to 33,000) l/min, P=0.90).
Figure 4.
The comparison between small bowel water content (SBWC) for 8 subjects who produced hydrogen (H2 positive) after fructose and 8 who did not (H2 negative) after drinking (a) fructose and (b) glucose+fructose. Values are mean concentration (ml)±s.e.m.
Colonic gas
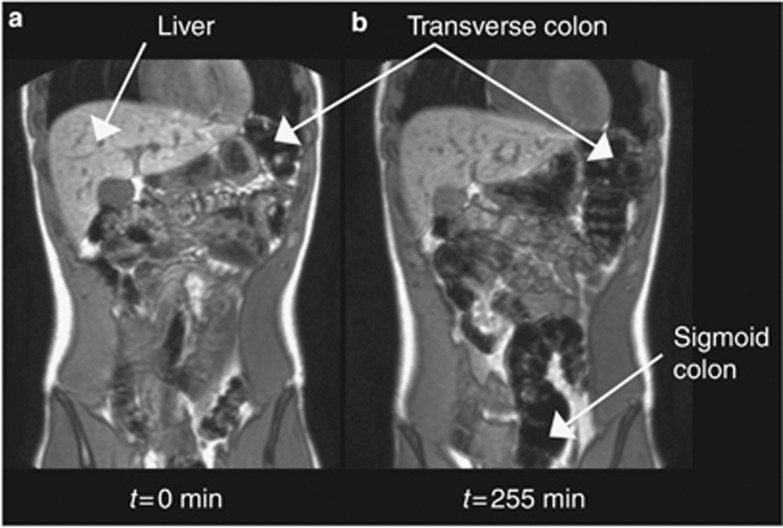
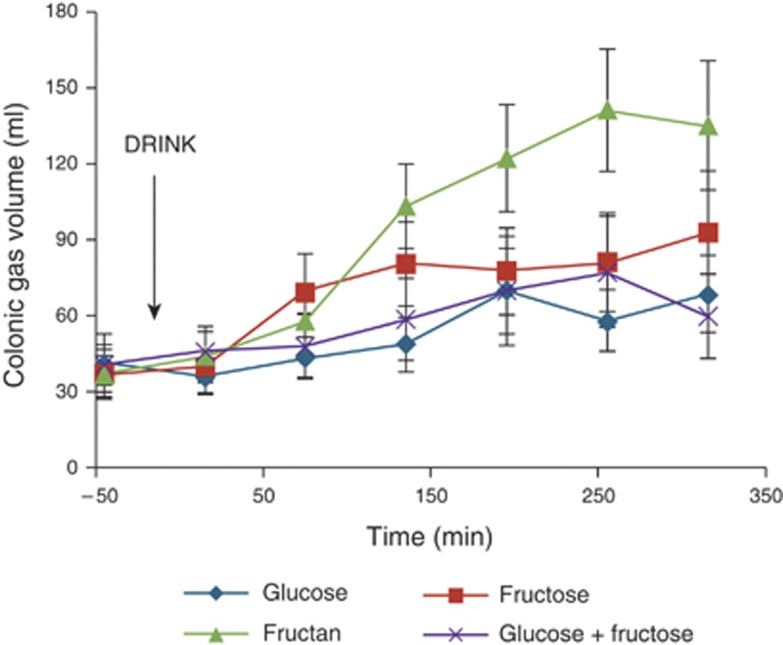
Colonic gas analyses were performed on a data set of 15 volunteers, as the colon of 1 volunteer could not be segmented reliably from the images. The increase of gas in the colon after drinking inulin is easily visualized on the MR images 255 min postprandial (Figure 5), as well as in the volumes across the study day (Figure 6). In Figure 5, some regions of the colon such as the sigmoid colon are not well seen initially (Figure 5a), but can be seen later at t=255 min (Figure 5b) as a result of luminal distension via gas production. The area under the curves (AUCs) for each drink over the entire study day are shown in Table 2. Inulin consumption led to the greatest production of colonic gas, significantly greater than both glucose (mean (95% CI) difference being 15 (2–28) l/min, n=15, P<0.05) and the mixture of glucose and fructose (mean (95% CI) difference being 12 (2–23) l/min, n=15, P<0.05). There was no significant difference between fructose and inulin (mean (95% CI) difference being 8 (−5 to 22) l/min, n=15, P>0.20).
Figure 5.
A representative example of coronal images through the large bowel of a single volunteer, comparing the visibility of gas in the colon at (a) baseline t= −45 min and (b) 255 min after drinking the fructan test meal.
Figure 6.
Colonic gas volumes through the study day for the volunteers. The time of drinking (t =0 min) is highlighted in the chart. Values are mean volume (ml)±s.e.m.
Small and large bowel diameters
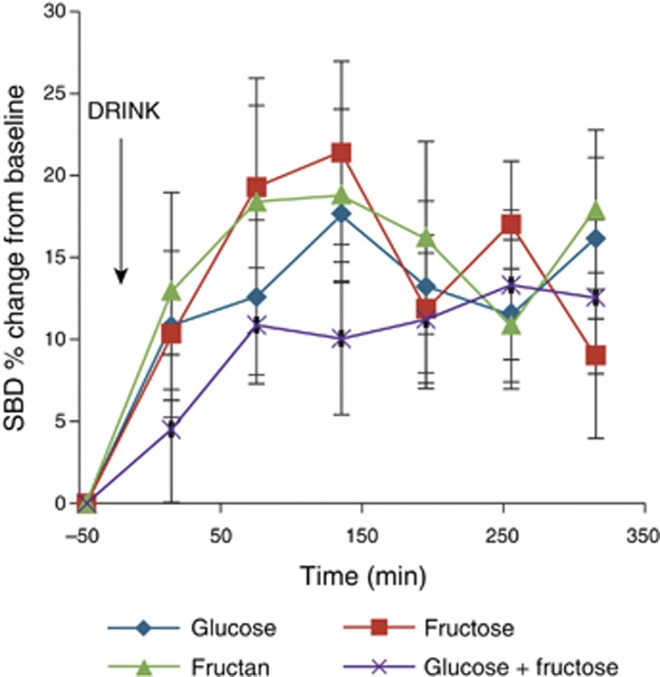
The percent change from baseline for the diameter of the small bowel and the ascending and transverse regions of the large bowel was assessed for each of the drinks. For the small bowel, this value increased across the study day (Figure 7), but no significant difference between the drinks was found using two-way analysis of variance (P>0.7). The percent change from baseline of the colon peaked at 30% (43%) in the transverse region at 255 min after drinking fructan as compared with glucose 8% (21%) at the same time. There was less change noticed in the ascending colon: the highest change from baseline was 18% (20%) at 75 min after drinking fructose as compared with 4% (26%) at the same time for glucose. Using Spearman's rank correlation coefficient, there were no correlations between bloating, pain, and gas and the percent change from baseline of the diameter of any region of the colon for any of the drinks.
Figure 7.
The percent change from baseline of the small bowel diameters (SBDs) of the volunteers. The time of drinking is highlighted in the chart. Values are mean percent change ±s.e.m.
Other assessments
Data for stool diaries, sweet corn transit, and results from symptoms, HADS, and PHQ15 questionnaires are all summarized in Table 3. No significant between-drink differences were found in the symptoms questionnaires (P>0.5), although a quarter of the volunteers reported a single episode of loose stools after the inulin. Closer examination of the “gas” symptoms showed 2 groups of subjects: one (“asymptomatic”) who reported none (score of 1), and the other (“symptomatic”) who reported mild (score of 2), moderate (score of 3), and, in a single instance, severe (score of 4) symptoms. For the second group, a correlation was observed between the volume of gas in the colon and gas symptom (r=0.59, P<0.0001). There was no correlation between bloating and SBWC. Stool form on the study day and the day after was averaged and reported for each drink. Baseline values were obtained from an average of the stool form 5 days before the study. No significant differences were found with stool data, including form (P>0.7) or transit (P>0.2). With the exception of 1 volunteer, the scores for the HADS questionnaires were ≤7. Similarly, all volunteers scored <6 on the PHQ15, with the exception of 1 volunteer who had had a car crash shortly before completing the questionnaire.
Table 3. Other assessments carried out during the study (N=16).
| Glucose | Fructose | Inulin | Glucose+fructose | |
|---|---|---|---|---|
| Stool forma (average±s.e.m.) | 3±0.2 | 4±0.2 | 4±0.4 | 4±0.3 |
| Transit time average±s.e.m. (h) | 20±5 | 21±11 | 22±5 | 19±6 |
| Symptoms (average±s.e.m.) | ||||
| Gas | 1.03±0.01 | 1.11±0.02 | 1.26±0.04 | 1.11±0.04 |
| Bloating | 1.06±0.02 | 1.06±0.02 | 1.03±0.01 | 1.07±0.04 |
| Belching | 1.07±0.02 | 1.04±0.01 | 1.02±0.01 | 1.07±0.02 |
| Nausea | 1±0 | 0.01 | 1±0 | 1.03±0.02 |
| Abdominal pain | 1.02±0.01 | 1.08±0.01 | 1.01±0.01 | 1.03±0.02 |
| Diarrhea | 1±0 | 1.03±0.02 | 1.05±0.02 | 1.03±0.02 |
| HADS anxiety | 3±0.8 | |||
| HADS depression | 2±0.7 | |||
| PHQ15 | 2±0.5 | |||
HADS, Hospital Anxiety and Depression Scale; PHQ15, Patient Health Questionnaire 15.
Averaged over the study day and subsequent day.
DISCUSSION
This study was designed to investigate the volumes of the different regions of the gastrointestinal tract after a FODMAP challenge using unique MRI measures to make the assessment without disturbing the normal physiology, a feature that previous intubation techniques could not avoid. The data confirmed the initial hypothesis that fructose, being both osmotically active and relatively poorly absorbed, substantially increases small bowel water, nearly doubling the volume compared with the well-absorbed glucose drink. The drinks compared had very different osmolalities and, based on the AUCs for gastric volume, emptied at different rates. This did not account for the difference in SBWC as Tables 1 and 2 show that the inulin drink with the lowest osmolality and lowest gastric AUC had the smallest SBWC.
All test drinks had zero sodium content and although this would have been increased a little by endogenous secretions, on entering the small bowel they would create a steep sodium gradient between the lumen and the interstitial fluid, down which sodium and associated chloride and water would pass as clearly shown by previous perfusion studies (27). Although glucose will then stimulate sodium absorption by co-transport, the poorly absorbed osmotically active fructose cannot do this, thus increasing the water and sodium content of the small intestine that is trapped by the high osmolality. There are no studies of intestinal fluid in humans after fructose alone. However lactose in lactase-deficient individuals would be expected to behave similarly to fructose in normal subjects, being of similar molecular size and poorly absorbed. Intubation studies in such individuals showed a profound dilution of intestinal contents after a lactose drink as fluid enters the small intestine along with sodium (17). Inulin, being of low osmolality, allows rapid absorption of water down the osmotic gradient to the interstitial fluid and hence would not be expected to increase small bowel water.
The majority of ingested inulin, being relatively unabsorbable in the small intestine, enters the colon and hence had the greatest effect on breath hydrogen concentration, with 13 of the 16 volunteers showing a rise of >20 p.p.m. in breath hydrogen. Five of those 13 volunteers who had colonic bacteria capable of producing hydrogen from inulin showed no increase after drinking fructose, suggesting they did not malabsorb fructose. Surprisingly, these volunteers did not show any smaller rise in the volume of water in the small bowel compared with those who displayed a rise in breath hydrogen after fructose, nor was their response to drinking the glucose+fructose drink different. The hydrogen response is of course an indirect assessment of fructose malabsorption that assumes all microbiota do produce hydrogen from fructose. The similarity in the small bowel water response of those who did and did not produce hydrogen after fructose suggests that either hydrogen production is an unreliable guide to malabsorption or that fructose may increase fluid volume in the small bowel without overflowing into the colon, presumably because the terminal ileum can compensate for poor absorption more proximally. Fructose is transported across the intestinal epithelium via the facilitative transporter GLUT5 (28), a low-affinity but high-capacity transporter specific to fructose, and also GLUT2, a hexose facilitative transporter (21). Previous reports have highlighted that the addition of glucose to fructose improves its absorption (14,15,29), although the mechanism has not been definitively determined. These observations led to the second hypothesis that adding an equivalent amount of glucose to fructose would reduce malabsorption of fructose in the small bowel. We found that there was a reduction in small bowel water content, and although this was not statistically significant, there was a significant reduction in the breath H2 levels, possibly indicating a reduction in malabsorbed fructose reaching the colon.
The study was designed to investigate the effect of the nonosmotically active inulin compared with the osmotically active fructose on the small bowel and colon. Although inulin is restricted in the low-FODMAP diet, its intake is negligible in a normal diet compared with fructans of shorter-chain length such as kestose and nystose. Inulin-type fructans, such as the ones used in this study, resist digestion in the upper gastrointestinal tract because of the lack of an enzyme to break their fructosyl–fructose glucosidic linkages (30). As a result, they pass through to the colon where they are fermented to a mixture of gases and short-chain fatty acids. Although shorter-chain fructans are expected to exert an osmotic effect on the small bowel, we hypothesized that unlike fructose, inulin would exert its main effect in the colon rather than the small bowel. The noninvasive MRI methods showed this was correct, as the water in the small bowel after drinking inulin did not differ significantly from that produced after drinking glucose, but the volume of gas in the colon and the concentration of breath H2 rose the most after drinking inulin, and was significantly higher than after glucose ingestion. It would be of interest in the future to examine fructans of shorter chain length more typical of dietary constituents to determine their differing effects on small and large bowel contents.
It has been hypothesized that FODMAPs are able to trigger gastrointestinal symptoms by luminal distension, predominantly through gas production (10). This study has demonstrated that FODMAPs had a significant impact on the production of gastrointestinal gas, with fructose and inulin producing significantly more gas than glucose and the mixture of glucose and fructose. Assuming that colonic gas causes luminal distension, the percent changes from baseline of diameter of the ascending and transverse regions of the colon were calculated, and an attempt was made to correlate this luminal diameter with the volunteers' reported symptoms of abdominal gas, bloating, and abdominal pain. There were no correlations, similar to previous studies where comparisons of gas volume with abdominal pain and distension showed no correlation with both patients and healthy volunteers (31,32). This suggests that the normal colon relaxes and accommodates gas without causing symptoms. There was a weak but significant correlation between the volume of gas in the colon and the gas symptom score for the “symptomatic” subset of the volunteers, presumably reflecting gas passed through the colon and expelled. In a study investigating the relationships among lactulose breath test, intestinal gas volume and gastrointestinal symptoms (bloating, pain, and flatulence) in patients (33), it was noted that although there were correlations between symptoms and gas volume score, this correlation was weak. Interestingly, it has been reported that abdominal discomfort is determined by the distribution of gas within the gut, based on a study that suggests that distending the small bowel produces more abdominal symptoms, whereas the colon seems able to accommodate large volumes of gas without causing abdominal discomfort (34), which may explain why few correlations were noted between symptoms and colonic measurements. In addition, most healthy subjects seem able to tolerate large gas loads unlike patients with functional gastrointestinal disorders (34,35), suggesting a further reason for the weak correlations in healthy volunteers. The known increased sensitivity of IBS patients to intestinal distension makes it likely that pain and discomfort after a FODMAP challenge might well correlate with increases in colonic diameters.
The MRI technique used to measure the colonic gas volumes has not been validated, and it is likely that the absolute volumes are not accurate as smaller gas volumes will have been overestimated because of partial volume errors when setting a signal threshold on small pockets of gas. However, trends in gas volume changes will still be valid, particularly as each subject acted as their own control, although variations in scanner adjustment between scan sessions or interobserver variability in the analysis will have acted to reduce the power with which the parameter could detect changes. Further validation work is required to determine the accuracy and interobserver variability of the gas volume measurements.
MRI offered an advantage in this study, as it allowed us to visualize fructose and inulin malabsorption that had previously only been observed in ileostomists. It shows the very different behavior of fructose and inulin. Future studies will focus on how these changes relate to symptoms following ingestion of fructose and fructans of varying molecular weight in sufferers of functional gastrointestinal disorders with the aim of tailoring diets more specifically to individual patients.
STUDY HIGHLIGHTS
Acknowledgments
We are grateful for the support from the NIHR Biomedical Research Unit in Gastrointestinal and Liver Diseases at Nottingham University. The views expressed are those of the authors and not necessarily those of the NHS, the NIHR, or the Department of Health.
Guarantor of the article: Robin C. Spiller, MD, FRCP.
Specific author contributions: R.C. Spiller: conception, data interpretation, and editing manuscript; K. Murray: drafting the manuscript, study planning, volunteer recruitment, data collection, analysis, and interpreting; V. Wilkinson-Smith: data collection and analysis and volunteer recruitment; C. Hoad: wrote data analysis programs and created MRI scanning card; C. Costigan: chief radiographer, responsible for scanner operation; E. Cox: scanner operation; L. Marciani: gastrointestinal MRI consultations and statistical analysis consultation; P. Gowland: MRI consultations; C. Lam: study medic, GI consultations. All authors participated in manuscript writing and gave their approval of the final version.
Financial support: None.
Potential competing interests: None.
References
- Francis CY, Whorwell PJ. Bran and irritable-bowel-syndrome - time for reappraisal. Lancet. 1994;344:39–40. doi: 10.1016/s0140-6736(94)91055-3. [DOI] [PubMed] [Google Scholar]
- Nanda R, James R, Smith H, et al. Food intolerance and the irritable bowel syndrome. Gut. 1989;30:1099–1104. doi: 10.1136/gut.30.8.1099. [DOI] [PMC free article] [PubMed] [Google Scholar]
- Parker TJ, Naylor SJ, Riordan AM, et al. Management of patients with food intolerance in irritable bowel syndrome - the development and use of an exclusion diet. J Hum Nutr Diet. 1995;8:159–166. [Google Scholar]
- Staudacher HM, Whelan K, Irving PM, et al. Comparison of symptom response following advice for a diet low in fermentable carbohydrates (FODMAPs) versus standard dietary advice in patients with irritable bowel syndrome. J Hum Nutr Diet. 2011;24:487–495. doi: 10.1111/j.1365-277X.2011.01162.x. [DOI] [PubMed] [Google Scholar]
- Staudacher HM, Lomer MCE, Anderson JL, et al. Fermentable carbohydrate restriction reduces luminal bifidobacteria and gastrointestinal symptoms in patients with irritable bowel syndrome. J Nutr. 2012;142:1510–1518. doi: 10.3945/jn.112.159285. [DOI] [PubMed] [Google Scholar]
- Shepherd SJ, Parker FC, Muir JG, et al. Dietary triggers of abdominal symptoms in patients with irritable bowel syndrome: randomized placebo-controlled evidence. Clin Gastroenterol Hepatol. 2008;6:765–771. doi: 10.1016/j.cgh.2008.02.058. [DOI] [PubMed] [Google Scholar]
- Shepherd SJ, Nut M, Gibson PR. Fructose malabsorption and symptoms of irritable bowel syndrome: guidelines for effective dietary management. J Am Diet Assoc. 2006;106:1631–1639. doi: 10.1016/j.jada.2006.07.010. [DOI] [PubMed] [Google Scholar]
- de Roest RH, Dobbs BR, Chapman BA, et al. The low FODMAP diet improves gastrointestinal symptoms in patients with irritable bowel syndrome: a prospective study. Int J Clin Pract. 2013;67:895–905. doi: 10.1111/ijcp.12128. [DOI] [PubMed] [Google Scholar]
- Shepherd SJ, Lomer MCE, Gibson PR. Short-chain carbohydrates and functional gastrointestinal disorders. Am J Gastroenterol. 2013;108:707–717. doi: 10.1038/ajg.2013.96. [DOI] [PubMed] [Google Scholar]
- Ong DK, Mitchell SB, Barrett JS, et al. Manipulation of dietary short chain carbohydrates alters the pattern of gas production and genesis of symptoms in irritable bowel syndrome. J Gastroenterol Hepatol. 2010;25:1366–1373. doi: 10.1111/j.1440-1746.2010.06370.x. [DOI] [PubMed] [Google Scholar]
- Barrett JS, Gearry RB, Muir JG, et al. Dietary poorly absorbed, short-chain carbohydrates increase delivery of water and fermentable substrates to the proximal colon. Aliment Pharmacol Ther. 2010;31:874–882. doi: 10.1111/j.1365-2036.2010.04237.x. [DOI] [PubMed] [Google Scholar]
- Rumessen JJ, Gudmand-Hoyer E. Fructans of chicory: intestinal transport and fermentation of different chain lengths and relation to fructose and sorbitol malabsorption. Am J Clin Nutr. 1998;68:357–364. doi: 10.1093/ajcn/68.2.357. [DOI] [PubMed] [Google Scholar]
- Marciani L, Cox EF, Hoad CL, et al. Postprandial changes in small bowel water content in healthy subjects and patients with irritable bowel syndrome. Gastroenterology. 2010;138:469–U90. doi: 10.1053/j.gastro.2009.10.055. [DOI] [PubMed] [Google Scholar]
- Rumessen JJ, Gudmandhoyer E. Absorption capacity of fructose in healthy adults-comparison with sucrose and its constituent monosaccharides. Gut. 1986;27:1161–1168. doi: 10.1136/gut.27.10.1161. [DOI] [PMC free article] [PubMed] [Google Scholar]
- Truswell AS, Seach JM, Thorburn AW. Incomplete absorption of pure fructose in healthy subjects and the facilitating effect of glucose. Am J Clin Nutr. 1988;48:1424–1430. doi: 10.1093/ajcn/48.6.1424. [DOI] [PubMed] [Google Scholar]
- Parker K, Salas M, Nwosu VC. High fructose corn syrup: production, uses and public health concerns. Biotechnol Mol Biol Rev. 2010;5:71–78. [Google Scholar]
- Christopher NL, Bayless TM. Role of the small bowel and colon in lactose-induced diarrhea. Gastroenterology. 1971;60:845–852. [PubMed] [Google Scholar]
- Placidi E, Marciani L, Hoad CL, et al. The effects of loperamide, or loperamide plus simethicone, on the distribution of gut water as assessed by MRI in a mannitol model of secretory diarrhoea. Aliment Pharmacol Ther. 2012;36:64–73. doi: 10.1111/j.1365-2036.2012.05127.x. [DOI] [PubMed] [Google Scholar]
- van den Bogert B, de Vos WM, Zoetendal EG, et al. Microarray analysis and barcoded pyrosequencing provide consistent microbial profiles depending on the source of human intestinal samples. Appl Environ Microbiol. 2011;77:2071–2080. doi: 10.1128/AEM.02477-10. [DOI] [PMC free article] [PubMed] [Google Scholar]
- Hoad CL, Marciani L, Foley S, et al. Non-invasive quantification of small bowel water content by MRI: a validation study. Phys Med Biol. 2007;52:6909–6922. doi: 10.1088/0031-9155/52/23/009. [DOI] [PubMed] [Google Scholar]
- Jones HF, Butler RN, Brooks DA. Intestinal fructose transport and malabsorption in humans. Am J Physiol Gastrointest Liver Physiol. 2011;300:G202–G206. doi: 10.1152/ajpgi.00457.2010. [DOI] [PubMed] [Google Scholar]
- Gouyon F, Caillaud L, Carriere V, et al. Simple-sugar meals target GLUT2 at enterocyte apical membranes to improve sugar absorption: a study in GLUT2-null mice. J Physiol London. 2003;552:823–832. doi: 10.1113/jphysiol.2003.049247. [DOI] [PMC free article] [PubMed] [Google Scholar]
- Rumessen JJ, Bode S, Hamberg O, et al. Fructans of Jerusalem artichokes - intestinal transport, absorption, fermentation and influence on blood glucose, insulin and c-peptide responses in healthy subjects. Am J Clin Nutr. 1990;52:675–681. doi: 10.1093/ajcn/52.4.675. [DOI] [PubMed] [Google Scholar]
- Cherbut C. Inulin and oligofructose in the dietary fibre concept. Br J Nutr. 2002;87:S159–S162. doi: 10.1079/BJNBJN2002532. [DOI] [PubMed] [Google Scholar]
- Bond JH, Levitt MD. Investigation of small bowel transit-time in man utilizing pulmonary hydrogen (H2) measurements. J Lab Clin Med. 1975;85:546–555. [PubMed] [Google Scholar]
- Roberfroid MB. Caloric value of inulin and oligofructose. J Nutr. 1999;129:1436S–1437S. doi: 10.1093/jn/129.7.1436S. [DOI] [PubMed] [Google Scholar]
- Spiller RC, Jones BJM, Silk DBA. Jejunal water and electrolyte absorption from 2 proprietary enteral feeds in man-importance of sodium content. Gut. 1987;28:681–687. doi: 10.1136/gut.28.6.681. [DOI] [PMC free article] [PubMed] [Google Scholar]
- Douard V, Ferraris RP. Regulation of the fructose transporter GLUT5 in health and disease. Am J Physiol Endocrinol Metabol. 2008;295:E227–E237. doi: 10.1152/ajpendo.90245.2008. [DOI] [PMC free article] [PubMed] [Google Scholar]
- Wasserman D, Hoekstra JH, Tolia V, et al. Molecular analysis of the fructose transporter gene (GLUT5) in isolated fructose malabsorption. J Clin Invest. 1996;98:2398–2402. doi: 10.1172/JCI119053. [DOI] [PMC free article] [PubMed] [Google Scholar]
- Roberfroid MB. Inulin-type fructans: functional food ingredients. J Nutr. 2007;137:2493S–2502S. doi: 10.1093/jn/137.11.2493S. [DOI] [PubMed] [Google Scholar]
- Koide A, Yamaguchi T, Odaka T, et al. Quantitative analysis of bowel gas using plain abdominal radiograph in patients with irritable bowel syndrome. Am J Gastroenterol. 2000;95:1735–1741. doi: 10.1111/j.1572-0241.2000.02189.x. [DOI] [PubMed] [Google Scholar]
- Morken MH, Berstad AE, Nysaeter G, et al. Intestinal gas in plain abdominal radiographs does not correlate with symptoms after lactulose challenge. Eur J Gastroenterol Hepatol. 2007;19:589–593. doi: 10.1097/MEG.0b013e328133f2e7. [DOI] [PubMed] [Google Scholar]
- Youn YH, Park JS, Jahng JH, et al. Relationships among the lactulose breath test, intestinal gas volume, and gastrointestinal symptoms in patients with irritable bowel syndrome. Dig Dis Sci. 2011;56:2059–2066. doi: 10.1007/s10620-011-1569-2. [DOI] [PubMed] [Google Scholar]
- Harder H, Serra J, Azpiroz F, et al. Intestinal gas distribution determines abdominal symptoms. Gut. 2003;52:1708–1713. doi: 10.1136/gut.52.12.1708. [DOI] [PMC free article] [PubMed] [Google Scholar]
- Spiller R. New insights into bloating and abdominal distension: is it all outlet obstruction. Am J Gastroenterol. 2010;105:888–889. doi: 10.1038/ajg.2010.57. [DOI] [PubMed] [Google Scholar]


