Abstract
Long-term consumption of artificial sweeteners (AS) has been the recent focus of safety concerns. However, the potential risk of the AS in cardiovascular disease and lipoprotein metabolism has not been investigated sufficiently. We compared the influence of AS (aspartame, acesulfame K, and saccharin) and fructose in terms of functional and structural correlations of apolipoprotein (apo) A-I and high-density lipoproteins (HDL), which have atheroprotective effects. Long-term treatment of apoA-I with the sweetener at physiological concentration (3 mM for 168 h) resulted in loss of antioxidant and phospholipid binding activities with modification of secondary structure. The AS treated apoA-I exhibited proteolytic cleavage to produce 26 kDa-fragment. They showed pro-atherogenic properties in acetylated LDL phagocytosis of macrophages. Each sweetener alone or sweetener-treated apoA-I caused accelerated senescence in human dermal fibroblasts. These results suggest that long-term consumption of AS might accelerate atherosclerosis and senescence via impairment of function and structure of apoA-I and HDL.
Keywords: apolipoprotein A-I, artificial sweetener, atherosclerosis, high-density lipoprotein, senescence
NTRODUCTION
Artificial sweeteners (ASs) have been widely used to make a variety of foods, drinks, drugs, and hygiene products. However, many ASs, including saccharin and aspartame, the so-called first generation sweeteners, have safety issues (Olney et al., 1996; Reuber, 1978; Van den Eeden et al., 1994). Although new generation sweeteners, such as acesulfame K (Mukherjee and Chakrabarti, 1997) and sucralose (Sasaki et al., 2002), have recently been approved, the potential risks to human health have not been firmly established. Over the past 3 decades, the potential hazard of carcinogenicity has been raised, but remains controversial (Weihrauch and Diehl, 2004). However, the risk of chronic metabolic diseases, such as cardiovascular disease, obesity, and aging, has not been investigated sufficiently, even though the production and consumption of ASs has rapidly increased in developed countries (Odegaard et al., 2010).
High-density lipoprotein (HDL) exerts many beneficial effects for the maintenance of a healthy physiologic system, including antioxidant, anti-inflammatory, and anti-thrombotic effects (Cho, 2009a; Rye and Barter, 2008). Other beneficial functions of HDL include anti-aging activities, as recently suggested by Walter (2009). HDL may modulate the aging process by interfering with an aging signaling factor. It has been proposed that HDL is involved in processes related to senescence (Nofer et al., 2005) and dementia (Scarmeas, 2007), as well as coronary artery disease. ApoA-I is the major protein component of HDL, and several mutants and mimetic peptides have been developed to maximize the therapeutic potential against cardiovascular disease. We recently reported that fructose-mediated apoA-I glycation results in severe loss of several beneficial functions of apoA-I and HDL regarding anti-senescence and anti-atherosclerosis activities due to a lack of anti-oxidant activity with increased susceptibility of protein degradation and structural modification (Park et al., 2010a). Additionally, we reported that an elevated level of advanced glycated end products in lipoproteins and fragmentation of apoA-I were present in the elderly group (average age, 71 ± 4 years; n = 26), with detected lower apoA-I level and more multimerized apoA-I in HDL (Park et al., 2010b). HDL from elderly (E-HDL) and HDL containing glycated apoA-I (gA-I-rHDL) share similar physiologic properties in macrophages and HDFs. E-HDL and gA-I-rHDL exacerbated cellular senescence and atherosclerosis with increased cellular cholesterol influx (Park and Cho, 2011).
Although it is still controversial, the potential hazard of ASs has received much attention due to the carcinogenicity (Olney et al., 1996; Reuber, 1978; Weihrauch and Diehl, 2004) and brain damage (Oliveira-da-Silva et al., 2009) of saccharin and aspar tame, respectively. However, there have been no reports to determine the physiologic roles of ASs in serum lipoprotein metabolism. Since fructose can deteriorate anti-atherogenic function of apoA-I, as in our previous report (Park et al., 2010a), there is a possibility that ASs might influence serum proteins in the circulation. In this report, we compared the modification of apoA-I in terms of functional and structural features following treatment with ASs and fructose. The potential risks of ASs, especially with respect to atherosclerosis and senescence, were compared in an in vitro and human cellular model using macrophages and dermal fibroblasts.
MATERIALS AND METHODS
AS and reagents
Aspartame (catalog #A5139), acesulfame K (#O4054), saccharin (#S1002), and fructose (#F0127) were purchased from Sigma (USA). Dimyristoyl phosphatidylcholine (DMPC, #850345) and palmitoyloleoyl phosphatidylcholine (POPC, #850457) was obtained from Avanti Polar Lipids (USA). Bis-sulfosuccinimidyl suberate (BS3, #S5799) and sodium cholate (#C1254) were purchased from Sigma (USA).
Purification of apoA-I
ApoA-I was purified from human plasma using ultracentrifugation, column chromatography, and organic solvent extraction following the method described by Brewer et al. (1986) and our recent report (Park et al., 2010a). The purified apoA-I was lyophilized at -80℃ until use.
Treatment of AS
Each AS (aspartame, acesulfame K, and saccharin) and fructose was used to treat apoA-I and determination of apoA-I modification was based on our recent report (Park et al., 2010a). In order to avoid excess treatment with sweetener, the determinations were performed in a dose-dependent manner from 0.3-30 mM of the sweetener (final concentration). Based on the results and calculations, we decided to treat with each sweetener at 3 mM because the concentration of saccharin in the blood would be approximately 3 mM after consumption of 1 bottle of yogurt. For example, one bottle of yogurt (30 g of net weight) contains 90 mg of saccharin (F.W. = 205.1), which would result in a final concentration of 2.9 mM in the blood (4.9 L) of a human with a body weight of 70 kg. We assumed the blood volume would be approximately 4.9 L for a 70 kg human and 100% efficiency of gastrointestinal absorption.
Since saccharin has a hydrolytic stability during gastrointestinal absorption (DeGarmo et al., 1952), we assumed that there was no body clearance during the short term incubation time.
Briefly, the purified lipid-free apoA-I (1 mg/ml) was incubated with each AS (final concentration, 3 mM) in 200 mM potassium phosphate/0.02% sodium azide buffer (pH 7.4) for up to 7 days under gas with air containing 5% CO2 at 37℃. The extent of modification of the apoA-I was determined from reading the fluorometric intensities at 370 nm (excitation) and 440 nm (emission). Fructose treated-apoA-I (final concentration, 3 mM) served as a control for glycated apoA-I.
Ferric-reducing ability of plasma assay
The ferric-reducing ability (FRA) was determined using the method described by Benzie and Strain (1996) with slight modifications. Briefly, the FRA reagents were freshly prepared by mixing 25 ml of 0.2 M acetate buffer (pH 3.6), 2.5 ml of 10 mM 2,4,6, tripyridyl-s-triazine (TPTZ; Fluka Chemicals), and 2.5 ml of 20 mM FeCl3 6H2O. The antioxidant activities of each treated apoA-I were then estimated by measuring the increase sorbance at 593 nm induced by the generated ferrous ions for a 40- min period at 25℃ using a DU800 spectrophotometer (Beckman Coulter, USA) equipped with a MultiTemp III thermocirculator (Amersham, Sweden).
Purification of LDL
Low-density lipoprotein (LDL; 1.019 < d < 1.063) was purified by ultracentrifugation (Beckman L8-M) using a 70.1 Ti rotor from human plasma after a density adjustment with the addition of NaBr. After centrifugation, the LDL was extensively dialyzed against Tris-buffered saline [TBS; 10 mM Tris-HCl, 5 mM EDTA, and 140 mM NaCl (pH 7.4)] for 24 h. The protein concentration was determined according to the Lowry protein assay, as modified by Markwell et al. (1978) or by using a Bradford assay reagent (BioRad, Korea) with bovine serum albumin as a standard.
Cupric ion-mediated oxidation of LDL
To compare the susceptibility of cupric ion-mediated LDL oxidation, LDL (300 μg of protein) was incubated with 5 μM CuSO4 for up to 2 h under presence of rHDL containing sweetener treated apoA-I. During the incubation, the quantity of formed conjugated dienes was monitored by following the absorbance at 234 nm (Abs234) at 37℃ (Esterbauer et al., 1989) using a Beckman DU 800 spectrophotometer equipped with a Multi- Temp III thermocirculator.
Acetylation of LDL
The acetylation of LDL (acLDL) was performed using saturated sodium acetate and acetic anhydride according to the method previously described (Fraenkal-Conrat, 1957). After the acetylation and subsequent dialysis, the acLDL protein content was determined and filtered through a 0.22 μm filter (Millex; Millipore, USA).
DMPC-clearance assay
Interactions of the AS-treated apoA-I and DMPC were monitored by the method described by Pownall et al. (1978), with slight modifications. The mass ratio of DMPC to protein was 2:1 (w/w) in a total reaction volume of 0.76 ml. The measurements were initiated after addition of DMPC and monitored at 325 nm every 1 min using a Beckman DU 800 spectrophotometer at 25℃.
Synthesis of reconstituted HDL
Discoidal reconstituted HDL (rHDL) was prepared by the sodium cholate dialysis method (Cho, 2009b; Cho et al., 2007) using initial molar ratios of POPC:cholesterol:apoA-I:sodium cholate of 95:5:1:150. The rHDL particles were used without further purification because the particles had high homogeneity and the sizes were determined from 8-25% native polyacrylamide gradient gel electrophoresis (PAGGE, Pharmacia Phast System; GE Healthcare, Sweden) by comparison with standard globular proteins (GE Healthcare). The number of apoA-I molecules per rHDL particle, as well as the self-association properties of lipid-free proteins, were determined by cross-linking with BS3, as described by Staros (1982), then analyzing the products of the reaction by sodium dodecyl sulfate-PAGE on precasted 8-25% gradient gels (Amersham Pharmacia, Sweden).
Circular dichroism and fluorospectroscopy
The average alpha-helix content of each apoA-I in the lipid-free and -bound states was measured by circular dichroism (CD) spectroscopy, using a J-715 Spectropolarimeter (Jasco, Japan) at Yeungnam University (Korea). The spectra were obtained from 250-190 nm at 25℃ in a 0.1-cm path-length quartz cuvette, using a 1.0-nm bandwidth, a speed of 50 nm/min, and a 4 s response time. The protein samples, which were dialyzed against TBS to remove any residual fructose of the lipid-free proteins, were diluted to 0.07 mg/ml to avoid self-association of the apolipoproteins, while lipid-bound proteins were diluted to 0.1 mg/ml. Four scans were accumulated and averaged. The α-helical content was calculated from the molar ellipticity at 222 nm (Chen et al., 1972).
The wavelengths of maximum fluorescence (WMF) of tryptophan residues in native and glycated apoA-I were determined from uncorrected spectra obtained on a LS55 spectrofluorometer (Perkin-Elmer, USA) using WinLab software package 4.00 (Perkin-Elmer) and a 1-cm path-length suprasil quartz cuvette (Fisher Scientific, USA). The samples were excited at 295 nm to avoid tyrosine fluorescence, and the emission spectra were scanned from 305-400 nm at room temperature.
Cell cultures
THP-1 cells, a human monocyte cell line, were obtained from the American Type Culture Collection (ATCC, #TIB-202™; USA) and maintained in RPMI-1640 medium (Hyclone, USA) supplemented with 10% fetal bovine serum (FBS) until needed. Cells that had undergone no more than 20 passages were incubated in medium containing phorbol 12-myristate 13-acetate (PMA; final concentration, 150 nM) in 24-well plates for 48 h at 37℃ in a humidified incubator (5% CO2, 95% air) to induce differentiation into macrophages, as described in previous reports (Seo et al., 2008; Zeng et al., 2010).
Primary human dermal fibroblasts (HDFs) were cultured in Dulbecco’s modified Eagle Medium (DMEM; Hyclone, USA). HDFs in DMEM were plated at 1 × 10⁵ cells per 100-mm culture plate and cultured at 37℃ in a 5% CO2-humidified incubator. When sub-cultures reached 80-90% confluence, serial passaging was performed by trypsinization, and the number of population doublings (PDs) was monitored, as previously described (Park et al., 2010a). For experiments, cells at passage 6 (PD < 24) were sub-cultured to prepare a sufficient number of cells which had the same age to exclude experimental bias of a different cell status. PD was calculated using the geometric equation:
PD = log 2 F /log 2 I (F = final population number, I = initial population number).
Cells at passage 9 (approximately 40% confluence) were exposed to the indicated concentrations of each sweetener (final concentration, 0.6 mM) or sweetener-treated apoA-I (final concentration, 2 μM apoA-I and 0.6 mM AS) for 30 days with subculture to reach until passage 16.
LDL phagocytosis into macrophages
In order to test anti-atherosclerotic activity, as described previously (Seo et al., 2008), the differentiated and adherent macrophages were incubated with 400 μl of fresh RPMI-1640 medium containing 1% FBS, 50 μl of oxLDL (1 mg of protein/ml in PBS), and 50 μl of the sweetener-treated apoA-I (final concentration, 2 μM protein and 0.6 mM of each sweetener) for 48 h at 37℃ in a humidified incubator. After incubation, the cells were washed with PBS 3 times, then fixed in 4% paraformaldehyde for 10 min. Next, the fixed cells were rinsed with 100% polypropylene glycol, stained with oil-red O staining solution (0.67%), then washed with distilled water. THP-1 macrophagederived foam cells were then observed and photographed using a Nikon Eclipse TE2000 microscope (Japan) at 600× magnification. Quantification of red-intensity in the cell was carried out via computer-assisted morphometry using the Image Proplus software (version 4.5.1.22; Media Cybernetics, USA).
SA-β-gal activity assay
To compare the extent of aging, cellular senescence associated (SA)-β-gal activity was compared, as previously described (Dimri et al., 1995; Park et al., 2010a). Cells were fixed for 5 min in 3% paraformaldehyde in PBS, washed 3 times in PBS, and incubated in SA-β-gal staining solution [40 mM citric acid/phosphate (pH 6.0), 5 mM potassium ferrocyanide, 5 mM potassium ferricyanide, 150 mM NaCl, 2 mM MgCl2, and 1 mg/ml of 5-bromo-4-chloro-3-indolyl-X-galactosidase] for 16 h at 37℃. The percentage of blue cells was calculated under phase contrast light microscopic observation. After staining, cell size was quantified from a randomly selected equal number of cells by computer-assisted morphometry using the Image Proplus software.
For Western blot analysis, the cells were harvested at the designated passage and lysed by treatment in lysis buffer [50 mM Tris (pH 8.0) and 1% NP-40/0.5% deoxycholate/0.1% SDS/150 mM NaCl]. After centrifugation and protein determination, an equal amount of supernatant protein (18 μg of total protein) was loaded per lane. ApoA-I antibody (ab7613; Abcam, UK) was used as the primary antibody to detect uptake of apoA-I into the HDFs.
Data analysis
All data are expressed as the mean ± SD from at least three independent experiments with duplicate samples. Two-group comparisons were carried out by independent t-tests using SPSS (version 14.0; SPSS, Inc., USA). Statistical significance was defined as a p < 0.05.
RESULTS
ApoA-I structure was modified by AS treatment
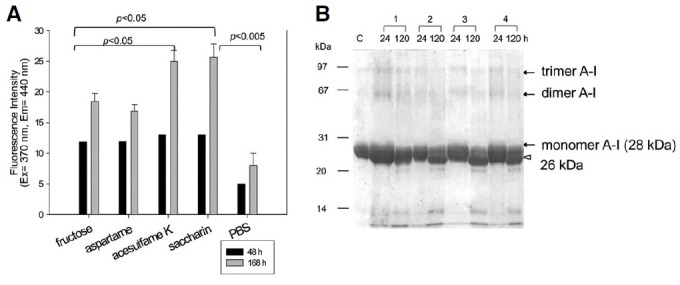
Modification of apoA-I by the sweetener treatment during 48 h occurred in a dose-dependent manner (as shown in Supplementary Fig. 1). Since 3 mM AS is a physiologic concentration after consumption of processed food (for example, a bottle of yogurt), we extended the incubation to 168 h at 3 mM sweetener (final concentration). As shown in Fig. 1A, saccharin- and acesulfame K-treated apoA-I showed the highest increase of FI, up to 25, while fructose and aspartame treatment showed a lower FI (Benzie and Strain, 1996; Esterbauer et al., 1989; Markwell et al., 1978). Figure 1B shows the electrophoretic patterns of the incubated apoA-I at the designated times. Although all apoA-I showed a single 28 kDa band with stronger multi-merization at 24 h of incubation, the AS-treated apoA-I showed a severe cleavage pattern of apoA-I (26 kDa) with less multi-merization of apoA-I at 120 h of incubation. This result suggests that proteolytic cleavage of apoA-I by AS treatment is linked to failure of spontaneous multimerization.
Fig. 1. Characterization of sweetener [fructose and artificial sweetener (AS)]-treated apoA-I by fluorescence and electro-phoresis. (A) Time-dependent fluorescence intensity of apoA-I after incubation with the sweetener (final concentration, 3 mM). The data shown represent the mean ± SD from three independent measurements. (B) Electrophoretic pattern of AStreated apoA-I at 24 and 120 h of incubation. Multimerized bands (indicated by arrow) were detected after 24 h, however, it largely disappeared and was cleaved to pro- duce 26 kDa (indicated by open arrow head) at 120 h. lane C, control apoA-I in native state; lane 1, fructose treated apoA-I; lane 2, aspartame treated apoA-I; lane 3, acesulfame K treated apoA-I; lane 4, saccharin treated apoA-I.
As shown in Table 1, sweetener-treated apoA-I showed a 4-8 nm increase in the wavelength of maximum fluorescence (WMF) in the Trp fluorescence determination, indicating that the Trp was more exposed to the aqueous phase under the presence of AS. Among the ASs, saccharin-treated apoA-I showed the largest increase (8 nm) in red shift WMF (354 nm) than control apoA-I (346 nm), suggesting that saccharin caused the most Trp exposure in the aqueous phase via alteration of the tertiary structure. Aspartame- and acesulfame-K treated apoA-I showed a 4 and 6 nm increased red shift in the lipid-free state, respectively (Table 1). In the presence of 1.5 M Gnd-HCl (final concentration), all apoA-I revealed an increase in WMF due to denaturation, except the saccharin-treated apoA-I, which showed no change. This result suggests that saccharin-treated apoA-I was already completely denatured, thus indicating that no secondary structure remained to respond to the chaotropic agents. However, in the presence of 1.5 M Gnd-HCl (final concentration), saccharin-treated apoA-I showed the biggest WMF (354 nm), while the other treated apoA-Is showed a WMF of approximately 351 nm. Interestingly, aspartame-treated apoA-I had a relatively higher content of alpha-helicity (36%), and showed less of an increase in WMF under the presence of Gnd-HCl, indicating that it might have less modification and more resistant properties under a denaturation process.
Table 1.
Compositional properties and spectroscopic data of apoA-I in lipid-free and rHDL states
| Lipid-free apoA-I | rHDL apoA-I | |||||||||
|---|---|---|---|---|---|---|---|---|---|---|
| WMF (nm) | α-Helicity (%) | Sizea (Å) | Number of apoA-I/particleb | WMF (nm) | α-Helicity (%) | |||||
| Gnd-HCl (0 M) | Gnd-HCl (1.5 M) | Gnd-HCl (0 M) | Gnd-HCl (1.5 M) | Gnd-HCl (0 M) | Gnd-HCl (3 M) | Gnd-HCl (0 M) | Gnd-HCl (3 M) | |||
| Fructose- treated | 350 | 355 | 12.0 | ND | 70-83 | 2, 3 | 346 | 352 | 56.5 | 30.3 |
| Aspartame- treated | 350 | 352 | 36.4 | 5.9 | 86-89 | 2, 3, 4 | 346 | 351 | 56.2 | 31.5 |
| Acesulfame K-treated | 352 | 353 | 12.6 | ND | 73-77 | 2, 3 | 346 | 351 | 43.0 | 18.8 |
| Saccharin- treated | 354 | 354 | 12.3 | ND | 68-74 | 2, 3 | 349 | 354 | 44.7 | 21.8 |
| PBS-treated | 346 | 354 | 50.8 | 5.8 | 87-92 | 2, 3, 4 | 345 | 351 | 65.7 | 31.7 |
aDetermined from 8-25% native gradient gel electrophoresis with densitometric scanning analysis
bDetermined from BS3-cross-linking and 8-25% SDS-PAGGE
Wavelength maximum fluorescence (WMF) of the Trp of apoA-I was determined. Emission spectra of each sample was scanned from 305-500 nm, after excitation by 295 nm to avoid Tyr fluorescence. Gnd-HCl, guanidine hydrochloride; WMF, wavelength maximum fluorescence; rHDL, reconstituted high density lipoprotein.
Loss of antioxidant ability
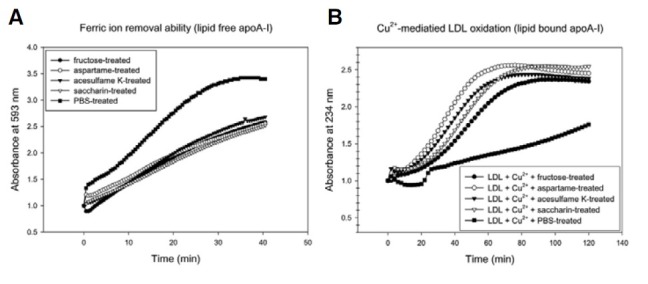
Each AS-treated apoA-I showed a loss of ferric ion reduction ability compared to PBS-treated apoA-I (Fig. 2A). AS-treated apoA-I did not prevent cupric ion-mediated LDL oxidation with an increase of conjugated dienes, while the PBS-treated apoA-I suppressed the increase of absorbance at 234 nm (Fig. 2B). Although there was no remarkable difference between the AStreated apoA-I, saccharin-treated apoA-I showed the least antioxidant ability.
Fig. 2. Anti-oxidant assay with AStreated apoA-I. The data shown represent the mean from three independent measurements. (A) Comparison of the anti-oxidant ability based on the ferric-reducing ability potential (FRAP) during 40 min of incubation. (B) Cupric ion-mediated LDL oxidation under the presence of the same amount of the eluted fractions. The same amount of each eluted fractions (50 μl, 0.1 mg/ml) and LDL (300 μg) was mixed in the presence of Cu2+ (final concentration, 10 μM).
Phospholipid binding ability
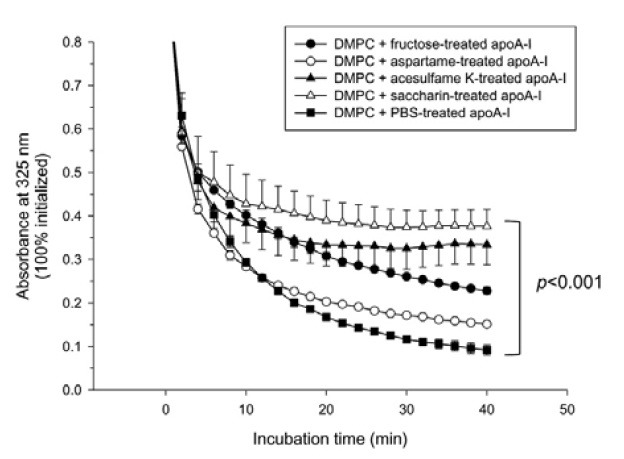
As shown in Fig. 3, PBS-treated apoA-I showed the fastest DMPC clearance ability, with a 90% increase in reduced absorbance at 325 nm following 40 min of incubation, indicating that phospholipid binding and the apoA-I via interaction with an amphipathic domain had occurred. However, AS-treated apoA-I showed impaired binding ability; saccharin- or acesulfame Ktreated apoA-I showed the weakest binding ability (approximately 54 and 57% clearance, respectively). Aspartame-treated apoA-I showed relatively enhanced binding ability (approximately 85% clearance), while fructose-treated apoA-I showed 76% clearance.
Fig. 3. Phospholipid-binding ability of sweetener-treated apoA-I. Interactions of the modified apoA-I with dimyristyol phosphatidylcholine multilamellar liposomes. The reaction was initiated by the addition of 0.7 ml of apoA-I (glycated or native, 0.15 mg/ml) to the multilamellar DMPC liposomes (0.06 ml, 3.5 mg/ml) in TBS (pH 8.0). The mass ratio of DMPC to protein was 2:1 (w/w) in a total reaction volume of 0.76 ml. The absorbance at 325 nm was monitored at 24.5℃ at 2-min intervals. The data shown represent the mean ± SD from three independent measurements.
Secondary structure
As shown in Table 1 and Supplementary Fig. 2, in the lipid-free state, fructose-, acesulfame K-, or saccharin-treated apoA-I had severe loss of alpha-helicity (< 13%), while aspartame-treated apoA-I had relatively higher alpha-helicity (approximately 36%) in the lipid-free and native states. However, all sweetenertreated apoA-I showed lower α-helicity than the PBS-treated control (approximately 50%). In the presence of Gnd-HCl (final concentration, 1.5 M), alpha-helicity was not detected in sweet-ener-treated apoA-I, indicating that collapse of alpha-helicity was accelerated by treatment with acesulfame K and saccharin (final concentration, 3 mM) in the denatured state, but not aspartame treatment (approximately 6% of α-helicity remained).
Native electromobility and BS3-crosslinking in the lipid-free state
In the lipid-free state, PBS-treated apoA-I had a broader band appearance than sweetener-treated apoA-I on 8-25% nativepolyacrylamide gradient gel electrophoresis (PAGGE), and the migration ability of AS-treated apoA-I was significantly enhanced to the bottom of the gel without a broad band, as shown in Fig. 4A. Acesulfame K- and saccharin-treated apoA-I showed faster mobility than aspartame, suggesting that different structural and mobility changes occurred between the saccharinand aspartame-treated apoA-I.
Fig. 4. Electrophoretic mobility and cross-linking of sweetenertreated apoA-I in a lipid-free state. Lane 1, fructose + apoA-I; lane 2, aspartame + apoA-I; lane 3, acesulfame K + apoA-I; lane 4, saccharin + apoA-I; lane C, PBS + apoA-I. (A) Electrophoretic mobility on 8-25% native polyacrylamide gradient gel electrophoresis. (lane M, high-range molecular weight marker, GE Healthcare). (B) Bissulfosuccinimidyl suberate (BS3)-crosslinked apoA-I (8-25% SDSPAGGE), which was sweetener-treated. Each apoA-I migrated on an 8-25% native gradient gel electrophoresis without denaturation (lane M, low-range molecular weight marker, GE Healthcare).
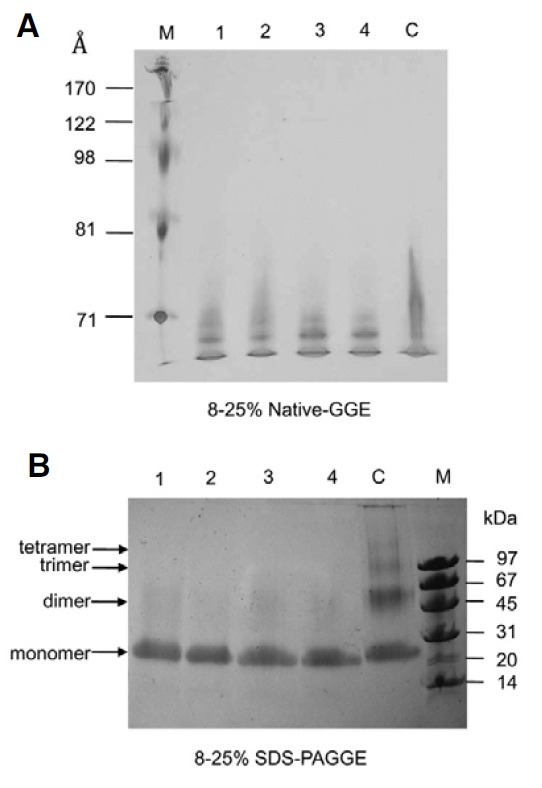
In order to compare the extent of modification of Lys, BS3- crosslinking revealed that sweetener-treated apoA-I remained a monomer due to failure of cross-linking. However, PBS-treated apoA-I made a cross-link up to a tetrameric product (Fig. 4B).
Synthesis of rHDL
As shown in Table 1, in the rHDL preparations using the same molar ratio, PBS- and aspartame-treated apoA-I showed a major band of 86-92 Å based on the densitometric analysis, while saccharin- and acesulfame K-treated apoA-I formed a smaller particle size with more smear band intensity and broad band distribution (68-77 Å), as shown in Fig. 5A.
Fig. 5. Electrophoretic mobility and crosslinking of AS-treated apoA-I in a lipid-bound state. Lane 1, fructose + apoA-I; lane 2, aspartame + apoA-I; lane 3, acesulfame K + apoA-I; lane 4, saccharin + apoA-I; lane C, PBS + apoA-I. (A) Each POPC-rHDL migrated on an 8-25% native gradient gel electrophoresis without denaturation. Lane M, high-range molecular weight marker (GE Healthcare). (B) BS3-crosslinked POPC-rHDL was electrophoresed on 8-25% SDS-PAGGE. Lane M, molecular weight marker (GE Healthcare).
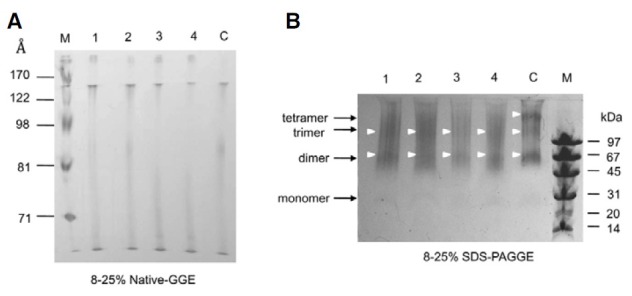
The number of apoA-I molecules in the rHDL state from BS3-cross-linking differed depending on sweetener, as shown in Table 1, Acesulfame K- or saccharin-treated apoA-I had a lower number of apoA-I molecules than aspartame- and PBStreated apoA-I. As shown in Fig. 5B, acesulfame K or saccharin treatment had up to three apoA-I per rHDL particle, while rHDL containing aspartame- or PBS-treated A-I had up to four apoA-I per particle, as we previously reported (Park et al., 2010c).
AcLDL uptake by macrophages
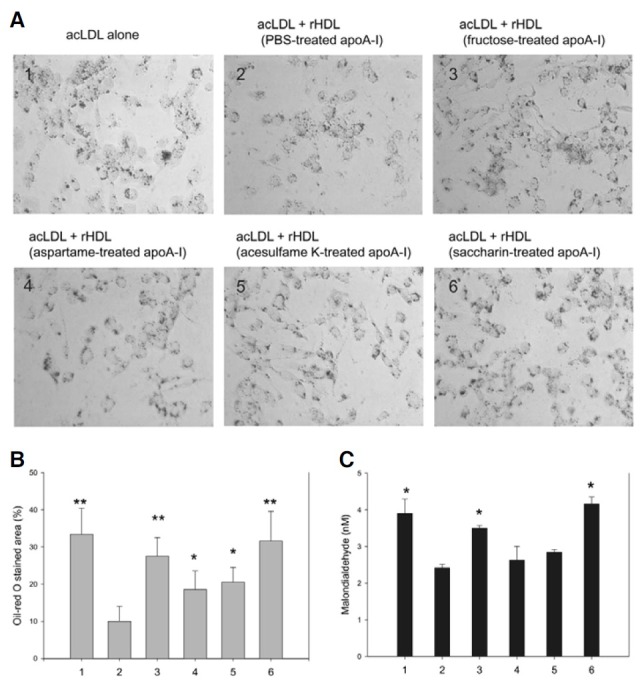
As shown in Fig. 6A, the uptake of acLDL in THP-1 cells in the presence of AS-treated apoA-I via phagocytosis was visualized by oil-red O staining. AcLDL-treated cells showed strong red intensity (Fig. 6A1), while control rHDL-treated cells (containing PBS-treated apoA-I; Fig. 6A2) had a reduced oil-red O-stained area (Fig. 6A). However, rHDL containing fructated apoA-I (Fig. 6A3) or AS-treated apoA-I (Figs. 6A4-6A6) did not prevent phagocytosis of acLDL with strong red intensity. In particular, rHDL-containing saccharin-treated apoA-I showed the strongest red color intensity in THP-1 cells. Computer-assisted morphometry also support that saccharin treated apoA-I induced the most severe acLDL phagocytosis with the highest percentage of oil-red O stained area among the sweetener treated apoA-I (Fig. 6B). These results suggest that modified apoA-I by AS stimulates oxLDL uptake by macrophages, which is the initiating mechanism of atherosclerosis. As shown in Fig. 6C, TBARS determination with cell culture medium revealed that the control rHDL-treated cells (bar # 2) showed a much reduced MDA level (2.4 nM) under the presence of acLDL than acLDL-alone treated cells (bar # 1, 3.9 nM). However, rHDLcontaining saccharin-treated apoA-I-treated cell (bar # 6) culture medium showed the highest amount of oxidized species (approximately 4.1 nM MDA), while rHDL containing other AStreated apoA-I showed less MDA (bars # 4 and 5, 2.6-2.8 nM).
Fig. 6. Cellular uptake of acetylated LDL (acLDL) in the presence of rHDLcontaining sweetener-treated apoA-I. PMA differentiated macrophages were incubated with 50 μl of acLDL (1 mg/ ml), 50 μl of each rHDL (28 μg/ml of apoA-I), and 400 μl of RPMI-1640 media. 1, acLDL alone; 2, acLDL + PBS-treated apoA-I-rHDL; 3, acLDL + fructose-treated apoA-I-rHDL; 4, acLDL + aspartame-treated apoA-IrHDL; 5, acLDL + acesulfame K-treated apoA-I-rHDL; 6, acLDL + saccharin- treated apoA-I-rHDL. (A) The extent of cellular uptake of lipids or LDL by macrophages was then compared by oil-red O staining, as described in the text. The cells were then photographed using a Nikon Eclipse TE2000 microscope (Japan) at 400x magnification. (B) Percentage of oilred O stained area per total cell area. The stained area was calculated using computer-assisted morphometry as described in text. *p < 0.05 versus bar # 2; **p < 0.01 versus bar # 2. (C) The cell culture media (0.2 ml) were analyzed by TBARS assay to determine the production of oxidized species. Malondialdehyde (MDA) was used as a standard and the extent of oxidation was expressed as MDA concentration (nM). The data shown represent the mean ± SD from three independent measurements. *p < 0.05 versus bar # 2.
Saccharin-treated cells showed severe cellular senescence
In order to compare induction ability of cellular senescence, each sweetener (final concentration, 0.6 mM to make equal with residual amount in AS-treated apoA-I) and sweetenertreated apoA-I (final concentration, 2 μM apoA-I and containing 0.6 mM AS) were supplied to the equal passage of HDFs. During cell growth and sub-culture at the designated incubation times, every cell was stained by the SA-β-gal. Although all cells remained healthy, saccharin- and acesulfame K-treated apoA-I had stronger blue color intensity than fructose- and aspartametreated apoA-I (Figs. 7 and 8). As shown in Figs. 7A and 7B, saccharin-alone or saccharin-treated apoA-I showed the highest number of SA-β-gal-positive cells in a passage-dependent manner. Saccharin- or acesulfame K-treated apoA-I induced the highest number of positive cells (approximately 49 and 43%, respectively, Fig. 7B).
Fig. 7. Induction of cellular senescence in human dermal fibroblasts (HDFs) treated with sweetener alone or sweetener-treated apoA-I. Senescence- associated β-galactosidase (SA-β-gal) staining. 1, fructose-treated; 2, aspartame-treated; 3, acesulfame K-treated; 4, saccharintreated; 5, PBS-treated. (A) The graph shows percentage of SA-β-gal-positive cells per 7.4 mm2 of cell culture area after treatment with each sweetener (final concentration, 0.6 mM). *p < 0.05 versus PBS-treated. (B) The graph shows percentage of SA-β-gal-positive cells per 7.4 mm2 of cell culture area after treatment with rHDL containing sweetener-treated apoA-I (final concentration, 0.6 mM sweetener and 2 μM apoA-I). **p < 0.01 versus PBS-treated; ***p < 0.005 versus PBS-treated. (C) Comparison of cell size at passage 14 after treatment with sweetener alone or rHDL containing sweetener-treated apoA-I. The cell size area was measured from randomly selected cell (n = 20) by computer- assisted morphometry, as described in the text. #p <0.05 versus PBS alone; *p < 0.05 versus PBS-treated apoA-I; **p < 0.01 versus PBS-treated apoA-I; ***p < 0.001 versus PBS-treated apoA-I. (D) Immunodetection of apoA-I (28 kDa) in cell lysate, which was harvested on passage 15. The apoA-I taken up in the HDFs was detected as the cleavaged form, especially in the fructose-treated (lane 2) and saccharintreated (lane 5) apoA-Is.
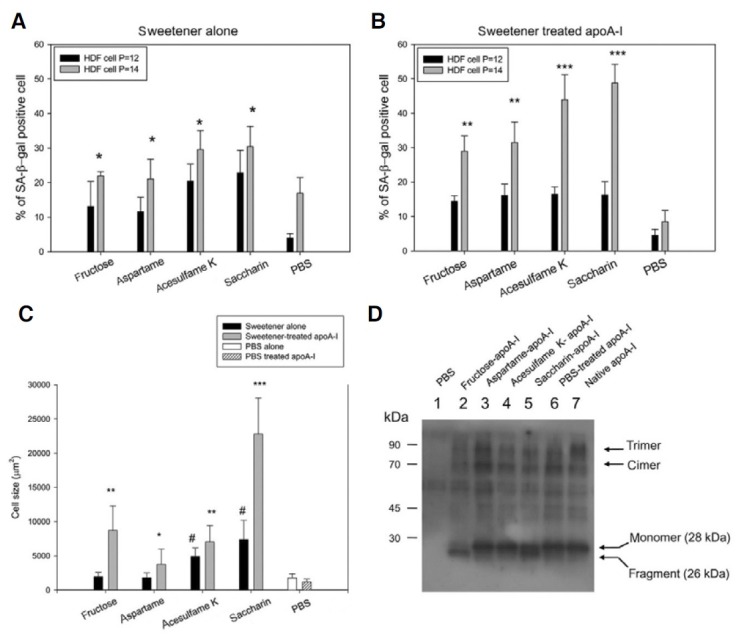
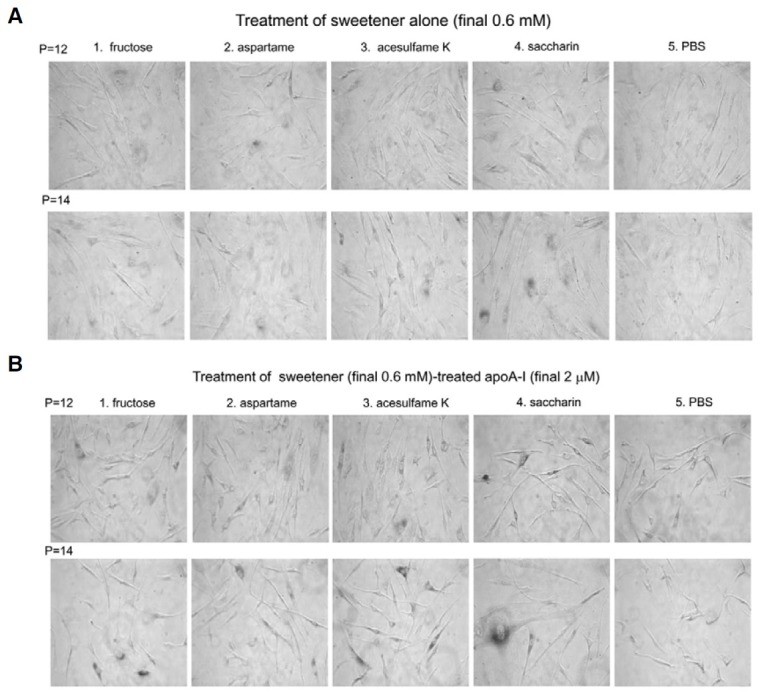
Fig. 8. Representative cell image was captured after treatment of sweetener alone [(A), final 0.6 mM of sweetener] or sweetener-treated apoAI [(B), final 0.6 mM of sweetener and 2 μM of apoA-I]. At the designated passage number, SA-β-gal activity (stained as blue color) was measured. The cell image was captured using a Nikon Eclipse TE2000 microscope (Japan) at 400× magnification.
At passage 14, saccharin or saccharin-treated apoA-I caused the greatest enlargement of cell size, as shown in Figs. 7C and 8. Cell size was also increased by treatment of AS or modified apoA-I, as shown in Fig. 7C. Saccharin-treated apoA-I caused the greatest enlargement of cells (up to 22,820 μm2), while native apoA-I-treated cells (PBS-treated) increased to approximately 1,185 μm2. An approximate 19-fold increase in cell size by saccharin-treated apoA-I treatment compared with native apoA-I treatment, whereas fructated apoA-I and AS-treated apoA-I resulted in enlargement of cells (approximately a 3-7- fold increase in cell size). On the other hand, saccharin alone treatment caused a 4-fold increase in cell size compared with PBS-treated cells, while treatment with fructose and aspartame did not cause cell enlargement (Fig. 7C). Taken together, these results suggest that treatment of modified apoA-I (Fig. 7) induces more severe cellular senescence than treatment of sweetener alone with respect to lysosomal changes, and cell size and shape.
Western blot analysis with the cell lysates revealed that each AS-treated apoA-I was detected in the cell, as shown in Fig. 7D. Interestingly, fructose- and saccharin-treated apoA-I were detected as fragments of apoA-I (26 kDa), while the other apoA-Is were detected as 28 kDa. This result indicates that the modified apoA-Is could be taken up into the cell and cleavage of apoA-I (appearance of 26 kDa) might be associated with exacerbation of senescence. Furthermore, the cleavaged apoA-I in fructosetreated (lane 2), acesulfame K-treated (lane 4), and saccharintreated cells (lane 5) showed decreased multimerized bands (indicated by dimers and trimers). This result correlated well with the results shown in Fig. 1B, in which there was less multimerization in the cleavaged apoA-I following a 120-h incubation.
As shown in Fig. 8, saccharin-alone treated cell (Fig. 8A, final 0.6 mM) and modified apoA-I by saccahrin, which had been treated with saccharin, (Fig. 8B, final 0.6 mM of sweetener and 2 μM of apoA-I) resulted the most severe extent of SA-β-gal positive cells.
DISCUSSION
It has been proposed that HDL is involved in processes related to senescence (Upmeier et al., 2009). ApoA-I is the major protein constituent of HDL; however, the function and structure of apoA-I and HDL can be modified by non-enzymatic glycation to form advanced glycated end (AGE) products. It has been reported that fructose reacts with proteins at 37℃ to produce colored, fluorescent derivatives (McPherson et al., 1988). In a previous report, we have shown that fructose-mediated apoA-I modification results in severe loss of several beneficial functions of apoA-I and HDL, producing pro-atherogenic and proaging molecules (Park et al., 2010a).
In the current report, AGE products were also produced by treatment with ASs, which were detected by fluorescence, indicating that a glycation-like reaction had occurred (Fig. 1A) with multimerization and protein cleavage (Fig. 1B). It can be postulated that ASs also cause a similar reaction to the Maillard reaction to produce detectable fluorescence. This result suggests that long-term consumption of ASs may cause modification of apoA-Is and protein cleavage, even though in lower concentrations, similar to non-enzymatic glycation. The cleavage was associated with impaired multimerization ability, as shown in Figs. 1B and 7D, indicating that important amino acids for cross-linking, such as Lys, are modified. The electrophoretic pattern of AS-treated apoA-I at 24- and 120-h incubation revealed that multimerized bands were detected after 24 h, however, largely disappeared by 120 h.
The modification of apoA-I is associated with loss of antioxidant ability (Fig. 2) and impairment of phospholipid binding ability (Fig. 3), suggesting that functional and structural correlations could be impaired by sweetener treatment at a lower concentration. Additionally, this result indicates that artificial sweetener- mediated modification is very similar to the chemical reaction of fructose. ApoA-I is well-known for its antioxidant ability in both lipid-free and lipid-bound states (Cho et al., 2006). Similarly, Liz et al. (2007) reported that cleavage of apoA-I (26 kDa) by transthyretin is associated with loss of unique features of dysfunctional HDL and an increase in amyloidogenicity. They showed loss of C-terminal (226-243) in apoA-I is associated with a severe decrease in the alpha-helix and an increase in beta-strands and random coils in apoA-I.
Modification of apoA-I, such as cleavage, oxidation, nitration, and chlorination, could lead to the production of dysfunctional apoA-I and HDL (Cho, 2009a; Feng and Li, 2009). Truncation of apoA-I at the C-terminus, yielding apoA-I (1-192), results in decreased lipid-binding ability (Ji and Jonas, 1995). These results suggest that all AS in this study, especially saccharin, could cause modification of tertiary structures to make easier proteolytic attack in serum, in a similar manner with fructosemediated glycation, as in our previous report (Park et al., 2010a). This result correlates well with interfered phospholipid binding ability (Fig. 3) and smaller rHDL formation (Fig. 5) with collapse of the alpha-helical structure of apoA-I, in the case of saccharinor acesulfame K-treated apoA-I.
Proteolysis is thought to play an important role in most types of amyloidoses, such as atherosclerosis and neurodegenerative diseases. Eberini et al. (2002) reported that macrophage MMP degrades HDL-associated apoA-I at both the N-and Ctermini in coronary patients. Moreover, the cleavage of apoA-I is induced by thrombolysis in coronary patients (Eberini et al., 2007). In addition, similarly, other research group reported that poor glycemic control in type-1 diabetes is associated with acceleration of oxidative damage to apoA-I (Jaleel et al., 2010). These reports raised the possibility that cleavage of apoA-I is closely correlated with the incidence of chronic degenerative disease with aging, such as diabetes and atherosclerosis. Interestingly, more severe senescence was observed in HDFs in the presence of modified apoA-I than HDFs in the presence of AS (Figs. 7 and 8). We previously showed that cellular senescence was suppressed by lipid-free and native A-I treatment (Park et al., 2010a).
Excitotoxicity of aspartame is a well-known side effect; overstimulation of the nerve cells and brain cells becomes excited to death. The role of ASs on cancer risk has been widely debated for several decades (Weihrauch and Diehl, 2004); however, there have been no reports to compare their atherogenic risk on lipoprotein metabolism.
Interestingly, in the current report, saccharin- or acesulfame K-treated apoA-I showed similar characteristics in lipid-free and -bound states as modified apoA-I and dysfunctional HDL, respectively. Saccharin- or acesulfame K-treated apoA-I showed impairment of phospholipid binding ability (Fig. 3), similar electromobility on native gel in a lipid-free state (Fig. 4), smaller rHDL synthesis (Fig. 5A), and acceleration of cellular senescence (Fig. 7). These results allow us to postulate that saccharin- or acesulfame K-treated apoA-I might have a similar physiologic role with a coincidental mechanism of action in lipoprotein metabolism. Indeed, acesulfame-K is similar to saccharin in structure. Cleavage of apoA-I to produce 26-28 kDa (Fig. 1) was correlated with loss of antioxidant ability (Fig. 2), phospholipid binding ability (Fig. 3), faster electromobility (Fig. 4A), and smaller rHDL formation (Fig. 5A).
Although we reported recently that high-dose fructose-treated apoA-I (final concentration, 250 mM) caused senescence (Park et al., 2010a), AS-treated apoA-I showed even more severe pro-aging activity than treatment of AS alone (Figs. 7 and 8). The current report suggests that serum apoA-I could also be modified by a lower dose of sweetener (final concentration, 3 mM) is enough to cause atherosclerosis and senescence. Among AS, saccharin-treated cells had the highest number of SA-β-gal-positive cells (Fig. 7A), and saccharin-treated apoA-I caused even a greater number of SA-β-gal-positive cells than AS treatment alone, in a passage-dependent manner (Fig. 7B). These results suggest that modified apoA-I by the sweetener causes more severe senescence than AS treatment.
Thus, the results of the current study suggest that long-term use of ASs, even though in lower dose, may exacerbate senescence and atherosclerosis via impairment of apoA-I and production of dysfunctional HDL.
Note: Supplementary information is available on the Molecules and Cells website (www.molcells.org).
Acknowledgments
This research was supported by the Aging-associated Vascular Disease Research Center at Yeungnam University (R13-2005- 005-01003-0 [2010]) and the Basic Science Research Program through the National Research Foundation of Korea (NRF) of the Ministry of Education, Science and Technology (2010- 0020910).
References
- 1.Benzie I.F., Strain J.J. The ferric reducing ability of plasma (FRAP) as a measure of antioxidant power: the FRAP assay. Anal. Biochem. (1996);239:70–76. doi: 10.1006/abio.1996.0292. [DOI] [PubMed] [Google Scholar]
- 2.Brewer H.B. Jr., Ronan R., Meng M., Bishop C. Isolation and characterization of apolipoprotein A-I, A-II, and A-IV. Methods Enzymol. (1986);128:223–246. doi: 10.1016/0076-6879(86)28070-2. [DOI] [PubMed] [Google Scholar]
- 3.Chen Y.H., Yang J.T., Martinez H.M. Determination of the secondary structures of proteins by circular dichroism and optical rotatory dispersion. Biochemistry. (1972);11:4120–4131. doi: 10.1021/bi00772a015. [DOI] [PubMed] [Google Scholar]
- 4.Cho K.H. Biomedicinal implications of high-density lipoprotein: its composition, structure, functions, and clinical applications. BMB Rep. (2009a);42:393–400. doi: 10.5483/bmbrep.2009.42.7.393. [DOI] [PubMed] [Google Scholar]
- 5.Cho K.H. Synthesis of reconstituted high-density lipoprotein (rHDL) containing apoA-I and apoC-III: the functional role of apoC-III in rHDL. Mol. Cells. (2009b);27:291–297. doi: 10.1007/s10059-009-0037-8. [DOI] [PubMed] [Google Scholar]
- 6.Cho K.H., Park S.H., Han J.M., Kim H.C., Choi Y.K., Choi I. ApoA-I mutants V156K and R173C promote anti-inflammatory function and antioxidant activities. Eur. J. Clin. Invest. (2006);36:875–882. doi: 10.1111/j.1365-2362.2006.01737.x. [DOI] [PubMed] [Google Scholar]
- 7.Cho K.H., Park S.H., Han J.M., Kim H.C., Chung Y.J., Choi I., Kim J.R. A point mutant of apolipoprotein A-I, V156K, exhibited potent anti-oxidant and anti-atherosclerotic activity in hypercholesterolemic C57BL/6 mice. Exp. Mol. Med. (2007);39:160–169. doi: 10.1038/emm.2007.18. [DOI] [PubMed] [Google Scholar]
- 8.DeGarmo O., Ashworth G.W., Eaker C.M., Munch R.H. Hydrolytic stability of saccharin. J. Am. Pharm. Assoc. Am. Pharm. Assoc. (1952);41:17–18. doi: 10.1002/jps.3030410108. [DOI] [PubMed] [Google Scholar]
- 9.Dimri G.P., Lee X., Basile G., Acosta M., Scott G., Roskelley C., Medrano E.E., Linskens M., Rubelj I., Pereira-Smith O., et al. A biomarker that identifies senescent human cells in culture and in aging skin in vivo. Proc. Natl. Acad. Sci. USA. (1995);92:9363–9367. doi: 10.1073/pnas.92.20.9363. [DOI] [PMC free article] [PubMed] [Google Scholar]
- 10.Eberini I., Calabresi L., Wait R., Tedeschi G., Pirillo A., Puglisi L., Sirtori C.R., Gianazza E. Macrophage metalloproteinases degrade high-density-lipoprotein-associated apolipoprotein A-I at both the N- and C-termini. Biochem. J. (2002);362:627–634. doi: 10.1042/0264-6021:3620627. [DOI] [PMC free article] [PubMed] [Google Scholar]
- 11.Eberini I., Gianazza E., Breghi L., Klugmann S., Calabresi L., Gomaraschi M., Mombelli G., Brusoni B., Wait R., Sirtori C.R. Apolipoprotein A-I breakdown is induced by thrombolysis in coronary patients. Ann. Med. (2007);39:306–311. doi: 10.1080/07853890701288760. [DOI] [PubMed] [Google Scholar]
- 12.Esterbauer H., Striegl G., Puhl H., Rotheneder M. Continuous monitoring of in vitro oxidation of human low density lipoprotein. Free Radic. Res. Commun. (1989);6:67–75. doi: 10.3109/10715768909073429. [DOI] [PubMed] [Google Scholar]
- 13.Feng H., Li X.A. Dysfunctional high-density lipoprotein. Curr. Opin. Endocrinol. Diabetes Obes. (2009);16:156–162. doi: 10.1097/med.0b013e32832922fc. [DOI] [PMC free article] [PubMed] [Google Scholar]
- 14.Fraenkal-Conrat H. Methods for investigating essential groups for enzyme activity. Meth. Enzymol. (1957);4:247–269. [Google Scholar]
- 15.Jaleel A., Henderson G.C., Madden B.J., Klaus K.A., Morse D.M., Gopala S., Nair K.S. Identification of de novo synthesized and relatively older proteins: accelerated oxidative damage to de novo synthesized apolipoprotein A-1 in type 1 diabetes. Diabetes. (2010);59:2366–2374. doi: 10.2337/db10-0371. [DOI] [PMC free article] [PubMed] [Google Scholar]
- 16.Ji Y., Jonas A. Properties of an N-terminal proteolytic fragment of apolipoprotein AI in solution and in reconstituted high density lipoproteins. J. Biol. Chem. (1995);270:11290–11297. doi: 10.1074/jbc.270.19.11290. [DOI] [PubMed] [Google Scholar]
- 17.Liz M.A., Gomes C.M., Saraiva M.J., Sousa M.M. ApoA-I cleaved by transthyretin has reduced ability to promote cholesterol efflux and increased amyloidogenicity. J. Lipid Res. (2007);48:2385–2395. doi: 10.1194/jlr.M700158-JLR200. [DOI] [PubMed] [Google Scholar]
- 18.Markwell M.A., Haas S.M., Bieber L.L., Tolbert N.E. A modification of the Lowry procedure to simplify protein determination in membrane and lipoprotein samples. Anal. Biochem. (1978);87:206–210. doi: 10.1016/0003-2697(78)90586-9. [DOI] [PubMed] [Google Scholar]
- 19.McPherson J.D., Shilton, B.H., Walton D.J. Role of fructose in glycation and cross-linking of proteins. Biochemistry. (1988);27:1901–1907. doi: 10.1021/bi00406a016. [DOI] [PubMed] [Google Scholar]
- 20.Mukherjee A., Chakrabarti J. In vivo cytogenetic studies on mice exposed to acesulfame-K-a non-nutritive sweetener. Food Chem. Toxicol. (1997);35:1177–1179. doi: 10.1016/s0278-6915(97)85469-5. [DOI] [PubMed] [Google Scholar]
- 21.Nofer J.R., Walter M., Assmann G. Current understanding of the role of high-density lipoproteins in atherosclerosis and senescence. Expert Rev. Cardiovasc. Ther. (2005);3:1701–1086. doi: 10.1586/14779072.3.6.1071. [DOI] [PubMed] [Google Scholar]
- 22.Odegaard A.O., Koh W.P., Arakawa K., Yu M.C., Pereira M.A. Soft drink and juice consumption and risk of physician- diagnosed incident type 2 diabetes: the Singapore Chinese Health Study. Am. J. Epidemiol. (2010);171:701–708. doi: 10.1093/aje/kwp452. [DOI] [PMC free article] [PubMed] [Google Scholar]
- 23.Oliveira-da-Silva A., Vieira F.B., Cristina-Rodrigues F., Filgueiras C.C., Manhães A.C., Abreu-Villaça Y. Increased apoptosis and reduced neuronal and glial densities in the hippocampus due to nicotine and ethanol exposure in adolescent mice. Int. J. Dev. Neurosci. (2009);27:539–548. doi: 10.1016/j.ijdevneu.2009.06.009. [DOI] [PubMed] [Google Scholar]
- 24.Olney J.W., Farber N.B., Spitznagel E., Robins L.N. Increasing brain tumor rates: is there a link to aspartame? J. Neuropathol. Exp. Neurol. (1996);55:1115–1123. doi: 10.1097/00005072-199611000-00002. [DOI] [PubMed] [Google Scholar]
- 25.Park K.H., Cho K.H. High-density lipoproteins (HDL) from elderly and reconstituted HDL containing glycated apolipoproteins A-I share pro-atherosclerotic and pro-senescent properties with increased cholesterol influx. J. Gerontol. A. Biol. Sci. Med. Sci. (2011);66:511–520. doi: 10.1093/gerona/glr016. [DOI] [PubMed] [Google Scholar]
- 26.Park K.H., Jang W., Kim K.Y., Kim J.R., Cho K.H. Fructated apolipoprotein A-I showed severe structural modification and loss of beneficial functions in lipid-free and lipid-bound state with acceleration of atherosclerosis and senescence. Biochem. Biophys. Res. Commun. (2010a);392:295–300. doi: 10.1016/j.bbrc.2009.12.179. [DOI] [PubMed] [Google Scholar]
- 27.Park K.H., Shin D.G., Kim J.R., Cho K.H. Senescence- related truncation and multimerization of apolipoprotein AI in high-density lipoprotein with an elevated level of advanced glycated end products and cholesteryl ester transfer activity. J. Gerontol. A Biol. Sci. Med. Sci. (2010b);65:600–610. doi: 10.1093/gerona/glq034. [DOI] [PubMed] [Google Scholar]
- 28.Park K.H., Yun C.O., Kwon O.J., Kim C.H., Kim J.R., Cho K.H. Enhanced delivery of an adenovirus using proteoliposomes containing WT or V156K apolipoproteinA-I and dimyristoylphosphatidylcholine. Hum. Gene Ther. (2010c);21:579–587. doi: 10.1089/hum.2008.207. [DOI] [PubMed] [Google Scholar]
- 29.Pownall H.J., Massey J.B., Kusserow S.K., Gotto A.M. Jr. Kinetics of lipid-protein interactions: interaction of apolipoprotein A-I from human plasma high density lipoproteins with phosphatidylcholines. Biochemistry. (1978);17:1183–1188. doi: 10.1021/bi00600a008. [DOI] [PubMed] [Google Scholar]
- 30.Reuber M.D. Carcinogenicity of saccharin. Environ. Health Perspect. (1978);25:173–200. doi: 10.1289/ehp.7825173. [DOI] [PMC free article] [PubMed] [Google Scholar]
- 31.Rye K.A., Barter P.J. Antiinflammatory actions of HDL: a new insight. Arterioscler. Thromb. Vasc. Biol. (2008);28:1890–1891. doi: 10.1161/ATVBAHA.108.173575. [DOI] [PubMed] [Google Scholar]
- 32.Sasaki Y.F., Kawaguchi S., Kamaya A., Ohshita M., Tsuda S. The comet assay with 8 mouse organs: results with 39 currently used food additives. Mutat. Res. (2002);519:103–119. doi: 10.1016/s1383-5718(02)00128-6. [DOI] [PubMed] [Google Scholar]
- 33.Scarmeas N. Invited commentary: lipoproteins and dementia - Is it the apolipoprotein A-I? Am. J. Epidemiol. (2007);165:993–997. doi: 10.1093/aje/kwm033. [DOI] [PMC free article] [PubMed] [Google Scholar]
- 34.Seo S.J., Park K.H., Cho K.H. Apolipophorin III from Hyphantria cunea shows different anti-oxidant ability against LDL oxidation in the lipid-free and lipid-bound state. Comp. Biochem. Physiol. B Biochem. Mol. Biol. (2008);151:433–439. doi: 10.1016/j.cbpb.2008.09.081. [DOI] [PubMed] [Google Scholar]
- 35.Staros J.V. N-hydroxysulfosuccinimide active esters: bis(Nhydroxy- sulfosuccinimide) esters of two dicarboxylic acids are hydrophilic, membrane-impermeant, protein cross-linkers. Biochemistry. (1982);21:3950–3955. doi: 10.1021/bi00260a008. [DOI] [PubMed] [Google Scholar]
- 36.Upmeier E., Lavonius S., Lehtonen A., Viitanen M., Isoaho H., Arve S. Serum lipids and their association with mortality in the elderly: a prospective cohort study. Aging Clin. Exp. Res. (2009);21:424–430. doi: 10.1007/BF03327441. [DOI] [PubMed] [Google Scholar]
- 37.Van den Eeden S.K., Koepsell T.D., Longstreth W.T. Jr., van Belle G., Daling J.R., McKnight, B. Aspartame ingestion and headaches: a randomized crossover trial. Neurology. (1994);44:1787–1793. doi: 10.1212/wnl.44.10.1787. [DOI] [PubMed] [Google Scholar]
- 38.Walter M. Interrelationships among HDL metabolism, aging, and atherosclerosis. Arterioscler. Thromb. Vasc. Biol. (2009);29:1244–1250. doi: 10.1161/ATVBAHA.108.181438. [DOI] [PubMed] [Google Scholar]
- 39.Weihrauch M.R, Dieh V. Artificial sweeteners-do they bear a carcinogenic risk? Ann. Oncol. (2004);15:1460–1465. doi: 10.1093/annonc/mdh256. [DOI] [PubMed] [Google Scholar]
- 40.Zeng R.Z., Kim H.G., Kim N.R., Lee H.Y., Jung B.J., Ko M.Y., Lee S.Y., Chung D.K. Protein expression changes in human monocytic THP-1 cells treated with lipoteichoic acid from Lactobacillus plantarum and Staphylococcus aureus. Mol. Cells. (2010);29:585–594. doi: 10.1007/s10059-010-0073-4. [DOI] [PubMed] [Google Scholar]


