

Abstract
Cellular senescence is characterized by cell-cycle arrest accompanied by various cell biological changes. Although these changes have been heavily relied on as senescence markers in numerous studies on senescence and its intervention, their underlying mechanisms and relationship to each other are poorly understood. Furthermore, the depth and the reversibility of those changes have not been addressed previously. Using flow cytometry coupled with confocal microscopy and Western blotting, we quantified various senescence-associated cellular changes and determined their time course profiles in MCF-7 cells undergoing DNA damage-induced senescence. The examined properties changed with several different kinetics patterns. Autofluorescence, side scattering, and the mitochondria content increased progressively and linearly. Cell volume, lysosome content, and reactive oxygen species (ROS) level increased abruptly at an early stage. Meanwhile, senescence associated β-galactosidase activity increased after a lag of a few days. In addition, during the senescence progression, lysosomes exhibited a loss of integrity, which may have been associated with the accumulation of ROS. The finding that various senescence phenotypes matured at different rates with different lag times suggests multiple independent mechanisms controlling the expression of senescence phenotypes. This type of kinetics study would promote the understanding of how cells become fully senescent and facilitate the screening of methods that intervene in cellular senescence.
Keywords: lipofuscin, lysosome, mitochondria, ROS, SA β-Gal, senescence phenotype
INTRODUCTION
Normal cells enter a state of replicative senescence after a prolonged division. Short and unprotected telomeres resulting from prolonged DNA replication trigger a continuous DNA damage response, which leads to permanent arrest of the cell cycle (Campisi et al., 2001). Senescence results in specific cell biological changes, which include enlargement and flattening of the cytoplasm, increased production of reactive oxygen species (ROS), accumulation of lipofuscins, increased mitochondrial and lysosomal mass and their cellular contents, and loss of mitochondrial membrane potential (MMP) (Hwang et al., 2009). Senescent cells also express cytosolic and nuclear markers such as senescence-associated β-galactosidase (SA β-Gal) activity (Dimri et al., 1995) and senescence-associated heterochromatin foci (SAHF) (Nakata et al., 2006). These have been referred to as senescence phenotypes, but their underlying mechanisms and relevance to aging physiology have only been discussed recently (Adams et al., 2009; Campisi and d’Adda di Fagagna, 2007; Krizhanovsky et al., 2008).
Cells can be driven to enter a state of senescence through ways that do not involve continuous cell division. Normal cells can be acutely induced to enter senescence by the overexpression of oncogenic Ras or Raf genes (Serrano et al., 1997; Zhu et al., 1998). This ‘oncogene-induced premature senescence’ has led the hypothesis that senescence might have developed as a cellular device to suppress tumor development (Campisi et al., 2007). In addition, cells can undergo senescence after exposure to a DNA-damaging insult (Toussaint et al., 2000). This ‘stress-induced senescence’ can be induced in normal as well as cancer cells. Both premature senescence and stress-induced senescence are generally assumed to express the same panel of phenotypes that are expressed in replicative senescence. The only difference may be that, in the induced cases, the phenotypes are acutely expressed within several days of the oncogene expression or stress imposition. Interest in induced senescence has recently increased because of its potential physiological role. First, for oncogene-induced senescence, the hypothesis regarding its tumor-suppressive role has been well supported by the finding that cells express senescence phenotypes in tumor masses or nevi in model animals (Mooi and Peeper, 2006). Second, the DNA damageinduced senescence of cancer cells suggests that, in addition to apoptosis, senescence may play a role in the cancer treatment effects of chemotherapeutic drugs or radiation. While apoptosis is a dominant mode of tumor cell death during the treatment of certain cancers such as leukemia and lymphoma, it is becoming more apparent that senescence is the predominant fate of cells in the treatment of solid-type tumors (Elmore et al., 2005; Gewirtz et al., 2008). Importantly, these findings suggest a possibility that accelerating the onset or the process of senescence may be beneficial for protecting against cancer development as well as for cancer therapy.
For effective senescence modulation, a better understanding of the properties of senescent cells is required. However, so far, senescence phenotypes have rarely been studied for their expression kinetics or analyzed in quantitative terms. Therefore, it is not known whether all senescence phenotypes are fully expressed once cells are growth arrested or after a certain incubation period and whether their pattern of expression is abrupt or progressive. Quantitative measures of the expression levels of the phenotypes may help grading the depth or matureness of the senescence of a population of cells. This information may be utilized in determining the effectiveness of an intervening treatment, improving the methods used to detect senescent cells in tissues, and facilitating identification of the pathological and physiological roles of senescence in vivo. In addition, such studies are practically important. Most studies on cellular senescence have examined only one or two phenotypes at a single time point without quantitative measures. Such approach may easily lead to under- or over-estimations of the properties related to the senescence of the cells in the study. For example, an assumption that a population of cells is senescent based solely on SA β-Gal activity, which is positive in only a fraction of the cells, can provide misleading results.
MCF-7 cells, a human breast cancer line, undergo senescence after a pulse of a moderate dose of adriamycin (doxorubicin) (Elmore et al., 2002; Song and Hwang, 2005). In the present study, a time-course study was carried out on the levels of the senescence phenotypes expressed in the adriamycin- treated MCF-7 cells. In response to the DNA damage, MCF-7 cells were immediately arrested, and various senescence phenotypes were subsequently expressed during the chase period. The quantitative changes of the cell volume, SA β-Gal activity, and the cellular content and morphology of mitochondria and lysosomes were determined through flow cytometry. This study reveals that senescence indeed quantitatively matures with time. Interestingly, the various cell biological changes did not follow a single pattern of kinetics, but rather were grouped into several different patterns. This study, although restricted to a case of DNA damage-induced senescence, can serve as a model for future studies aiming to understand the cell biology of senescence and its manipulation.
MATERIALS AND METHODS
Cell culture
MCF-7 cells were cultured in Dulbecco’s modified Eagle’s medium (DMEM) supplemented with 10% fetal bovine serum (FBS; Lonza, USA). To induce senescence, cells were pulsed with 0.25 μM adriamycin (doxorubicin hydrochloride; Sigma- Aldrich Co., USA) for 4 h and chased in fresh medium which was replaced every two days.
Analysis of cell cycle distribution
At each time point, 1 × 10⁶ cells were collected and stored in 70% ethanol. Cells were then stained with 10 μg/ml of propidium iodide in phosphate-buffered saline (PBS) containing 1 mM of EDTA and 0.2 mg/ml RNaseA. The raw data from flow cytometry were analyzed by CellQuest 3.2 software (BD Biosciences, USA).
In situ staining of SA β-Gal activity and β-galactosidase assay in solution
For the SA β-Gal assay, the protocol reported by Dimri et al. (Dimri et al., 1995) was used. Briefly, cells that had been fixed with 3% formaldehyde were washed in PBS (pH 6.0) containing 2 mM of MgCl2. After incubation overnight at 37℃ in β-galactosidase- staining solution [1 mg/ml of X-gal (5-bromo-4-chloro- 3-indolyl β-D-galactopyranoside), 5 mM K3Fe[CN]6, 5 mM K4Fe[CN]6, and 2 mM MgCl2], cells were observed with brightfield microscopy. To determine the β-galactosidase activity per cell, cells were lysed in PBS by freeze-thawing. The supernatant was incubated at 37℃ for 6 h in reaction buffer [5 mM MgCl2, 0.55 mg/ml chlorophenolred-β-D-galactopyranoside (CPRG) in 0.1 M phosphate buffer (pH 6.0)]. The reaction was stopped by adding 1 M Na2CO3, and the transmittance of light at 570 nm was measured.
Measurement of autofluorescence and contents of lysosomes and mitochondria
For measurement of autofluorescence, cells that were collected in PBS containing 1 mM EDTA were applied to flow cytometry (488 nm excitation and 530 nm emission; BD FACS Canto II, BD Biosciences, USA). For the measurement of lysosome and mitochondria content, the washed cells were incubated with 50 nM of LysoTracker Red or 30 nM MitoTracker Green (Invitrogen/ Molecular Probes, USA) for 30 min and then applied to flow cytometry with 488 nm excitation/585 nm emission or 488 nm excitation/530 nm emission, respectively.
Assessment of lysosomal integrity
An acridine orange (AO) uptake and relocation assay (Erdal et al., 2005; Kokkonen et al., 2004) was used to determine lysosomal integrity. Briefly, cells cultured on a cover slip were treated with 20 μg/ml AO for 15 min. Confocal microscopy was carried out with excitation at 488 nm and emission through the filter for either Texas red (for red emission) or FITC (for green emission).
Measurement of ROS and mitochondrial membrane potential (MMP; ΔΨm)
For quantification of the superoxide anions produced in the mitochondria, cells were incubated with 0.1 μM MitoSox (Invitrogen/ Molecular Probes) for 30 min and applied to flow cytometry. For the measurement of MMP, cells were incubated with 0.3 μg/ml JC-1 (5,5′,6,6′-tetrachloro-1,1′,3,3′-tetraethylbenzimidalohylcarbocyanine iodide) for 30 min and applied to flow cytometric analysis with excitation at 488 nm radiation. The emissions at 530 nm (FL-1; for fluorescence from monomeric JC-1) and at 585 nm (FL-2; for that from JC-1 aggregates) were monitored, and the FL2/FL1 ratio of the individual cells was calculated by using WEASEL software (http://www.wehi.edu.au/cytometry/WEASELv2.html). The mean values of the FL2/FL1 ratio of the samples were plotted by using SigmaPlot 9.01 software (Systat Software, Inc.).
Western blotting
Cells were lysed in RIPA buffer [50 mM Tris-HCl (pH 7.5), 150 mM NaCl, 1% Nonidet P-40, 0.5% sodium deoxycholate, 0.1% SDS] supplemented with NaF, NaVO4, and a protease-inhibitor mixture (Sigma). Typically 30-40 μg of proteins were separated by SDS-PAGE, transferred to nitrocellulose membranes (Hybond ECL; Amersham, USA), and blotted with one of the following primary antibodies: human ERK 1/2 (C-16) (Santa Cruz Biotechnology, Inc., USA), p53 (DO-1) (Santa Cruz Biotechnology, Inc.), p21WAF1 (C-19) (Santa Cruz Biotechnology, Inc.), E2F1 (C-20) (Santa Cruz Biotechnology, Inc.), 4E-BP1 (Cell Signaling Technology, Inc.), phospho-4E-BP1 (Cell Signaling Technology, Inc.), p70 S6Kinase (Cell Signaling Technology, Inc.), and phospho-p70 S6Kinase (Thr421/Ser424) (Cell Signaling Technology, Inc.).
RT-PCR
Total RNA was isolated using TRIzol reagent (Invitrogen) following the manufacturer’s protocol. A total of 5 μg of RNA was converted to cDNA by using MuLV reverse transcriptase and oligo (dT) primer (Promega, USA), and 1/40 volume of the cDNA reaction was applied to PCR using primers for human PGC-1α, TFAM, NRF-1, Lamp1 and β-actin.
Confocal microscopy
Cells seeded on microscope cover slips were fixed with 3.7% formaldehyde in PBS for 10 min, permeabilized with 0.1% Triton X-100 in PBS for 15 min, and blocked with 10% FBS in PBS for 1 h. The cover slips were incubated with primary antibody (diluted with 10% FBS in PBS for 1:500) overnight at 4℃ and then incubated with fluorescence-labeled secondary antibody (diluted with 10% FBS in PBS at 1:500).
RESULTS AND DISCUSSION
Cell cycle arrest
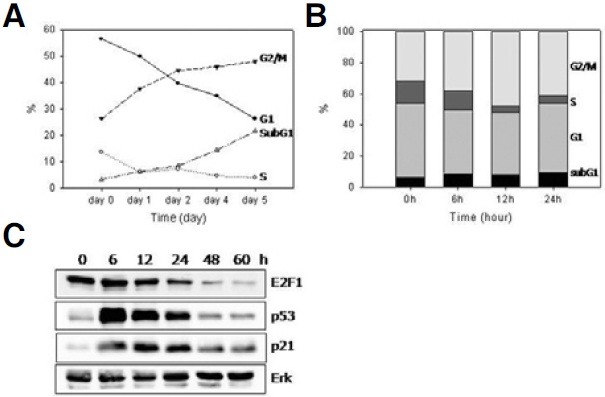
Previously, it was shown that a 4 h pulse of 0.25 μM of adriamycin induced senescence in MCF-7 cells (Song and Hwang, 2005). Adriamycin is a chemical that induces DNA scission through the generation of hydroxyl radicals (Berlin and Haseltine, 1981), and it has been reported to induce both G1 and G2/M arrest (De Vincenzo et al., 1996; Fornari et al., 1994). Indeed, the adriamycin-pulsed cells were arrested at either the G1 or the G2/M phases with the latter being the progressively dominant phase (Fig. 1A). A decrease in the S phase population (Fig. 1B) was quite rapid and apparent at 12 h postadriamycin treatment when the population levels dropped from 17% to 3.5%). These results were in good accordance with the changes in the level of E2F1, a transcription factor responsible for the expression of key proteins necessary for S phase entry (Johnson et al., 1993). By the first 12 h, the E2F1 protein levels became substantially low (Fig. 1C). The levels of p53 and p21WAF1 increased with similar rapidity and were maintained at high levels for the first 24 h. Meanwhile, the G1 fraction continuously decreased throughout the chase period, while the sub- G1 fraction changed in the opposite direction (Fig. 1A). This suggests that a substantial portion of the cells that were arrested at G1 phase became progressively unstable and underwent apoptotic death. The observation that DNA damagetriggered apoptosis occurred in a delayed manner in the condition used to set up senescence is interesting.
Fig. 1. Cell cycle arrest in the adriamycin-pulsed MCF-7 cells. MCF- 7 cells were treated with 0.25 μM adriamycin for 4 h and further incubated in fresh medium. At indicated time points, cells were collected and stored in 70% ethanol before being stained with propidium iodide and applied to flow cytometry. (A) The change during the 5-day chase period in the percentage of G1 (—•—), G2/M (---▲---), S (-·-△-·-), and subG1 (···◇···) phases, respectiGely, was plotted. (B) The portions of the G2GM, G, G1, and subG1 phases at 0, 6, 12, 24 h after the adriamycin pulse were plotted in bars. An increase in the number of cells at G2GM phases as well as a dramatic decrease in the G phase were apparent at 12 h point. (C) Cells were lysed in RIPA buffer and the extracts were applied to Western blotting for p53, p21WAF1, E2F1, and Erk (a loading control). Both the time course analyses on the cell cycle distribution and Western blottings were carried out for three biological samples, and representatiGe figures were presented.
Increase of the SA β-Gal-positive cells and β-galactosidase activity
Next, the expression pattern of SA β-Gal activity was determined. The number of cells positive for the activity in situ increased in a sigmoidal curved pattern with a lag of 2-3 days, which was followed by an increase during the next 2 days and a plateau after day 6 (Figs. 2A and 2B). The presence of the lag suggests that the expression of SA β-Gal activity did not occur immediately but took place sometime after the cell cycle arrest had been initiated. Since SA β-Gal originates from the upregulated lysosomal β-galactosidase activity (Lee et al., 2006), these results suggest that the upregulation of the β- galactosidase gene (GLB1) upregulation required a period of induction in the cells that were already in the arrest state. However, one cannot rule out other possibilities such as a change in lysosome functionality (See below). Interestingly, the number of positive cells increased slowly during a period of 2-3 days rather than increasing quickly in a short period of time. This indicates that, although the majority of the cells were in the arrest state, the upregulation of the GLB1 gene occurred not at once but with a lag, the duration of which was different among cells. This suggests that a heterogeneity that is reminiscent of what was found in the population of cells undergoing replicative senescence exists in conditions involving acutely induced senescence. In addition, it was apparent that not 100% of the cells of the adriamycin-treated MCF-7 population expressed SA β-Gal activity, even after a prolonged incubation, because a plateau was reached at around 60% (Fig. 2B). However, it should be noted that the SA β-Gal positivity is subjective, and the positivity of the activity was determined in a rather conservative way in this study. However, there was a significant fraction of cells that were not positively stained even after a prolonged incubation.
Fig. 2. Expression of GA β-Gal actiGity. (A) The adriamycin-treated MCF-7 cells were stained for GA β-Gal actiGity in situ at day 8. A group of cells stained well in a bright field were taken photo. From this photo, it is clear that a majority of the chased cells underwent remarkable change in size and shape as well as the positiGity for GA β-Gal actiGity clearly demonstrating their being at senescence. (B) GA β-Gal assay was carried out at the indicated time points, and the number of cells positiGe for the actiGity was counted, and the percentage was plotted. The decision on the positiGity is a subjectiGe matter, and therefore, the percentage may get higher, but, the shape of the curGe does not change in a more generous decision on the positiGity. (C) During the chase, 1.8 × 10⁵ cells were collected at indicated time points and lysed, and the extracts were applied to β-galactosidase assay in solution (pH 6.0) using CPRG. The obser- Gance of light at 570 nm was plotted. For both (B, C), more than three independent biological samples were analyzed, and the most representatiGe figures were presented.
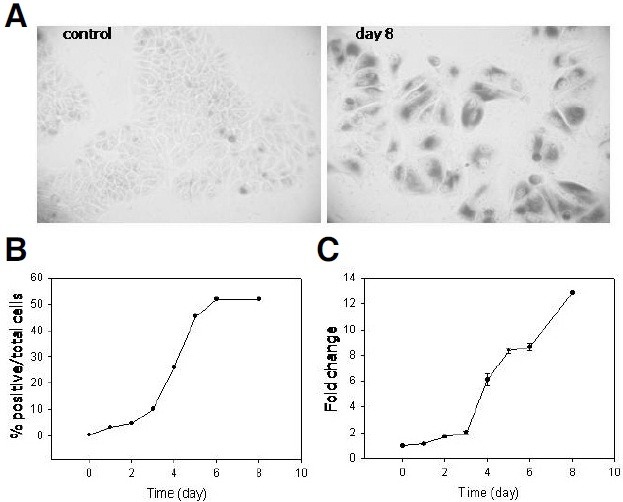
The change in the lysosomal β-galactosidase activity per cell was examined. During the chase, proteins from an equal number of cells were applied to an assay that measured the cleavage of CPRG as a substrate at pH 6.0 (Fig. 2C). The β-galactosidase activity remained low until day 3 supporting the idea that the expression of SA β-Gal activity requires an induction period after the onset of cell cycle arrest. Interestingly, the β-galactosidase activity continuously increased and did not reach a plateau at day 6. This discrepancy between the changes in the number of SA β-gal-positive cells and the activity per cell suggests that, during the chase period, the β-galactosidase activity continued to increase in the cells that were already determined to be positive for SA β-Gal activity. In fact, the green stain, which is an outcome of the SA β-Gal activity in situ, became substantially darker when the cells were incubated for longer periods (Sohee Cho, unpublished data).
Increase of cell volume
Senescent cells are notably bigger and flatter compared to actively proliferating ones (Hwang et al., 2009). For example, IMR-90 fibroblasts undergoing either replicative or H2O2-induced senescence reportedly had an over 4-fold bigger volume (Chen et al., 2000). It has been hypothesized that growth factor signals coming in a cell whose cell cycle progression is blocked causes continued macromolecular synthesis in the absence of mitosis and leads to an uncoordinated cell growth, i.e., hypertrophy (Blagosklonny, 2006). This hypothesis predicts that sustained activity of the mTOR pathway, a major regulator of protein synthesis, would cause continued cell growth in senescent cells (Demidenko and Blagosklonny, 2008).
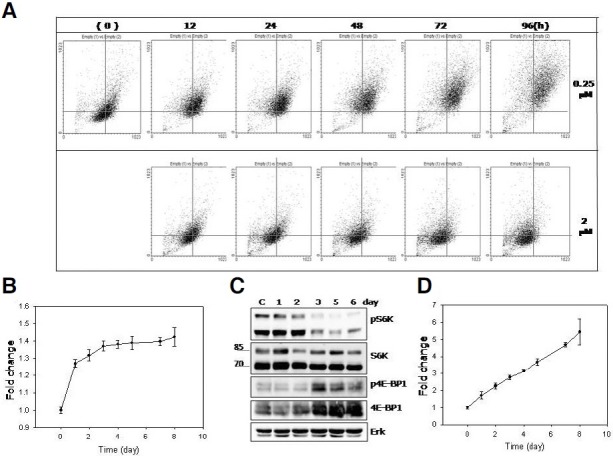
A change in cell size (or surface area) can be assessed in flow cytometry by comparing the forward scattering (FSC) of the cells (Fig. 3A, X-axis). A rightward shift in FSC of the MCF-7 cells was already apparent at 12 h, and kept increasing until day 1 or 2 after the adriamycin pulse. In addition, in a small fraction of cells, FSC still increased even after day 3. This change is quite different from that of the population treated with 1 μM adriamycin, which underwent apoptotic death (Song and Hwang, 2005). In the latter, FSC did not increase or get heterogeneous at all (Fig. 3A, lower boxes). This is another example of cell biology that proceeds differently in senescence and apoptosis, even though they were induced by the same chemical treatment. Importantly, the rapid increase in the cell size continued only for the first two days at best (Fig. 3B). The slowdown of the cell-size increase after day 3 may be due in large part to a decrease in protein synthesis. The active (phosphorylated) S6K protein, which is a downstream effector of mTOR and plays a key role in protein translation (Kawasome et al., 1998; Ruvinsky and Meyuhas, 2006), was maintained at high levels only until the first 2 days (Fig. 3C). Meanwhile, both the phosphorylated (active) form and the whole protein of 4E-BP1, a negative regulator of protein translation (Haghighat et al., 1995), changed in the opposite direction with low levels until day 2 and substantially higher levels after day 3. The total protein content per single cell also showed a rapid increase at the early time points, which was followed by a small change later (Sohee Cho, data not shown). Meanwhile, the degree of the cell volume increase (1.4 fold) was smaller compared to that occurred during the replicative senescence of human fibroblasts (Chen et al., 2000; Sohee Cho, unpublished results). This may be attributed to a possible difference in cell plasticity or volume between cells of epithelial (MCF-7 cells) and mesenchymal (fibroblasts) origins.
Fig. 3. Increase in cell volume (FSC) and cellular granule content (SSC). (A) MCF-7 cells were pulsed either with 0.25 μM (upper boxes) or 2 μM (lower boxes) adriamycin and chased in its absence for indicated time period and applied to flow cytometry. (A) Dot scatter plots show an increase in both FSC (X-axis) and SSC (Y-axis) in the population pulsed with 0.25 μM, but not in the population pulsed with 2 μM adriamycin. (B, D) Relative mean values of the FSC (B) or SSC (D) of the cells collected at the indicated points were plotted. The graphs were plotted with the numbers averaged from three independent biological repeats. (C) Cells were collected at the indicated time points and their extracts were applied to Western blotting analysis for phosphorylated- or total proteins of S6K and 4EB-BP1. Western analyses were repeated for three independent biological samples, and a typical blot was presented.
Finally, as mentioned above, the cell size increase became quite heterogeneous at later time points (Fig. 3A). In the case of the replicative senescence of fibroblasts, the increase in size is extremely heterogeneous, and this is likely due to the heterogeneity in the timing of the cells’ entry into the arrest state (Martin- Ruiz et al., 2004). Since such timing differences did not exist in induced senescence, the population was expected to change rather homogenously. However, to a lesser degree, the senescence induced in the adriamycin-pulsed MCF-7 cells proceeded with a substantial heterogeneity in cell size (as well as cellular granule content, as shown in Fig. 3A, Y-axis. And, see below). Therefore, it is possible that size increases differently among different cells during senescence progression, and this can be attributed, in part, to the difference in the timing of the entry into cell cycle arrest.
Lipofuscin accumulation
During replicative and stress-induced senescence, an increase in side scattering (SSC) also takes place (Hwang et al., 2009), and, in fact, is more prominent than FSC as shown in Fig. 3A (Y-axis). SSC is caused by intracellular electron-dense particles including storage or secretory vesicles, various organelles, and macromolecular particles. In the adriamycin-pulsed MCF-7 cells, the increase in SSC started from the beginning of the chase and formed a straight line reaching a 5-fold level in 8 days (Fig. 3D). This indicates that granules accumulated when the cells stopped dividing, and their content kept increasing continuously even after the cell had slowed down protein synthesis. The precise nature of the accumulating granules has not been determined yet, but it is certain that protein translation is not required for their continued increase.
Lipofuscin is a component of the granule content that is high in senescent cells (Hwang et al., 2009), and its accumulation is a well-documented marker of senescence as well as aging (Sitte et al., 2001). Lipofuscins emit fluorescence, and therefore, their accumulation is represented by an increase in autofluorescence (Cho and Hwang, 2011). In the adriamycin-pulsed MCF-7 cells, autofluorescence increased with a pattern that resembled that of the change in SSC in that the increase was prompt and linear (Fig. 4A). This result supports the possibility that lipofuscins themselves or lipofuscin-containing lysosomes (see below) are the main components of the granules that increase in cells undergoing DNA-damage induced senescence.
Fig. 4. Increase in autofluorescence and lysosome content. (A, C) The adriamycin-pulsed cells were collected at indicated time points during the chase and applied to flow cytometry either directly or after staining with LysoTracker Red for 30 min. In (C), typical fields were photographed. The graphs were plotted with the numbers averaged from three independent biological repeats. (B) Untreated cells or the cells adriamycin-pulsed and chased for 6 days (day 6) were stained with LysoTracker Red, and applied to confocal microscopy.
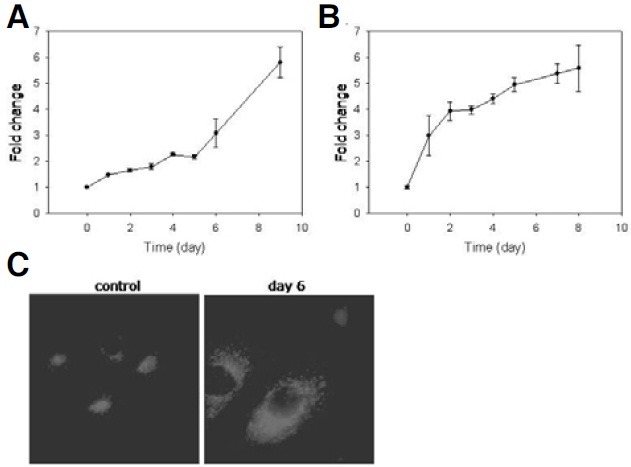
Increase in lysosome content
Lipofuscins are complexes of oxidized proteins and lipids that are formed in lysosomes (Brunk et al., 1992), and the accumulation of these undegradable materials is believed to turn lysosomes into residual bodies (Brunk and Terman, 2002). An increase in lysosome content has been noticed in senescent cells (Comings and Okada, 1970; Park et al., 2007), and this is likely attributed to the increase in the lipofuscin-containing residual bodies (Brunk and Terman, 2002). Indeed, in the adriamycin- pulsed cells, the lysosome content substantially increased as seen with confocal microscopy and as quantitatively determined by flow cytometry of the cells stained with Lyso- Tracker Red (Figs. 4B and 4C). An apparent increase in lysosome content has also been demonstrated by immunofluorescence using LAMP2A, a lysosomal membrane protein (Park et al., 2007; Sohee Cho, data not shown). Interestingly, the change in the lysosome content appeared to happen in two different phases: a rapid increase until day 2 and then a slow increase thereafter (Fig. 4C). This pattern is more like that of the increase in cell volume (FSC) than that of the increase in SSC and autofluorescence. It is possible that the increase in the lysosome content was not solely attributed to the accumulation of the lipofuscin-loaded residual bodies, and the increase in SSC was not likely due solely to the increase of lysosome content at least at a later period. It is possible that lysosomes underwent certain structural or chemical changes during the later period and became stained (or detected) less efficiently by the LysoTracker probes (or immunofluorescence).
Lysosome rupture
Lysosomal membrane permeabilization (LMP), a form of lysosomal integrity loss, has been observed during apoptosis that was induced by oxidative stress (Castino et al., 2007; Erdal et al., 2005; Ostenfeld et al., 2005; Roberg and Ollinger, 1998) or TNF-α treatment (Werneburg et al., 2002). Whether MCF-7 cells experience loss of their lysosomal integrity during senescence progression was determined by assaying for LMP using acridine orange (AO). AO accumulates in acidic compartments where it emits red fluorescence, but also localizes in neutral compartments (cytosol and nucleus) where it emits green fluorescence (Olsson et al., 1989; Robbins and Marcus, 1963). When control MCF-7 cells were treated with AO, green fluorescence was emitted from the nucleus as well as the cytosol as expected, and at the same time, red fluorescence was emitted strongly and exclusively from the cytosol (likely the intact lysosomes) in most cells (Fig. 5A, control). However, in the cells treated with NH4Cl, a lysosomotropic base known to cause lysosome leak, the emission of red fluorescence was severely attenuated, indicating that lysosomes with poor integrity indeed failed to emit red fluorescence (Fig. 5A, NH4Cl). In the cells undergoing induced senescence, red fluorescence was dim in most cells at day 3 and almost disappeared in most cells by day 6 (Fig. 5A, 3 day and 6 day). This suggests that the lysosome acidity was gradually lost during the senescence progression in MCF-7 cells. LMP was also observed in fibroblasts undergoing replicative senescence. A significant fraction of the cells in a late-passage culture did not emit red fluorescence although they emitted quite prominent cytosolic and nuclear green fluorescence (passage 38.5 vs 13 in Fig. 5B). Overall, these findings suggest that, during the progression of both induced and replicative senescence, lysosomes are subject to rupture and lose their acidity. Lysosome rupture is induced during apoptosis upon exposure to a high level oxidative stress. Since ROS levels are high (or even higher) in senescent cells (Hwang et al., 2009; Song and Hwang, 2005; and see Fig. 6D), it is conceivable that senescence accompanies lysosome integrity loss.
Fig. 5. Loss of lysosomal integrity. (A) MCF-7 cells treated with NH4Cl or pulse-chased with 0.25 μM adriamycin for 3 or 5 days were stained with acridine orange for 15 min, and processed for confocal microscopy after excitation at 488 nm. Fluorescence emission was observed either through the channels for FITC (for green fluorescence) or Texas Red (for red fluorescence). (B) Human fibroblasts at either an early passage (13) or a late passage (38.5) were processed in the same way.
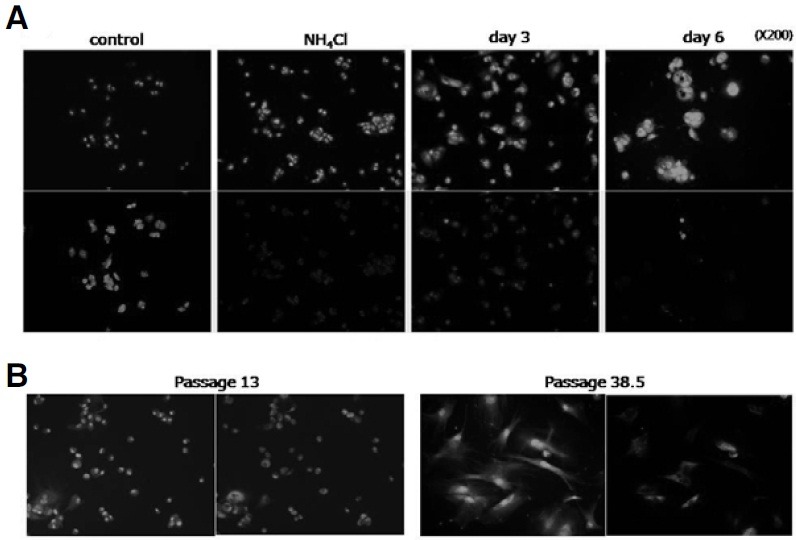
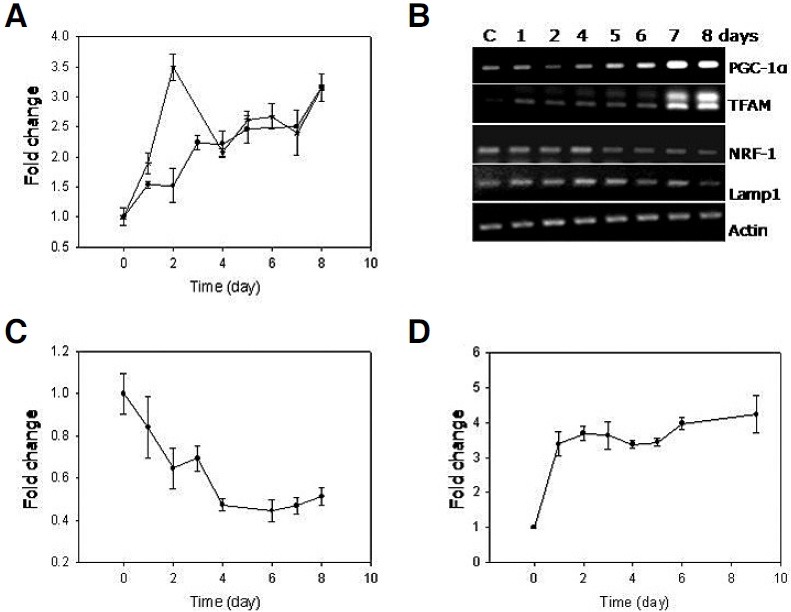
Fig. 6. Increase in mitochondrial content and superoxide level, and a decrease in MMP. (A) The adriamycin-pulsed MCF-7 cells were chased for indicated time period, and stained with either MTG (—•—) or NAO (—*—) and applied to flow cytometry to monitor cellular content of mitochondria. MTG and NAO gave rise to the kinetics curves similar to each other except for the abruptly high value for the NAO measurement at day 2 point. This value might have originated from an experimental error since no such high value was obtained in repetition. (B) mRNA isolated from the cells chased for the indicated time points were converted to cDNA. And, the same volume of the cDNA reaction was applied to PCR using primers for PGC-1α, TFAM, NRF-1. The levels of the bands for Lamp1 and β-actin, nonmitochondrial genes, did not change serving as control. (C) MCF-7 cells were chased for indicated time period, stained with JC-1 or MitoSox, and applied to flow cytometry. In the case of the JC-1-stained cells, the ratio of FL2/FL1 was obtained, and mean values were plotted to monitor the change in MMP (C), and for the cells stained with MitoSox, the mean values were directly applied to plot a kinetics curve to monitor the change of the mitochondrial superoxide level (D). All the graphs were plotted with the numbers averaged from three independent biological repeats.
Increase in mitochondria content
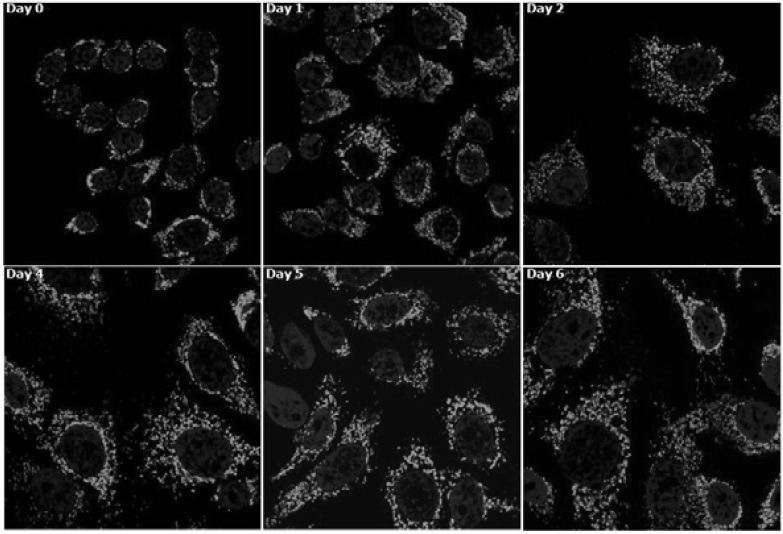
Another organelle that may contribute to the increase in SSC is mitochondrion. Cellular mitochondria content has been shown to be high in senescent cells as well as in cells isolated from older individuals (Lee et al., 2002; Passos et al., 2007). In this study, flow cytometry using MitoTracker fluorescence dye (MTG) showed that mitochondria content increaseed continuously approaching a near three-fold level during senescence progression. A similar increase of the mitochondria content was observed in the analysis using 10-nonyl acridine orange (NAO) which interacts with cardiolipin that is specifically present in the mitochondrial membrane (Petit et al., 1992) (Fig. 6A). An increase of mitochondria content, especially at an early period, was also apparent in confocal images (Fig. 7; Day 0 vs Days 1, 2, and 4). Along with the increase in the cell size, the mitochondria content rapidly increased until day 4. Further increase of the green fluorescence was not so apparent at days 5 and 6. DNA damage has been reported to activate signal pathway to mitochondria biogenesis that involves ATM-dependent activation of PGC-1α (Fu et al., 2008), a master regulator of mitochondria biogenesis (Jager et al., 2007). However, the increase of the mitochondria content in MCF-7 cells at least during the early period of chase was not likely due to an increase in the ATM-mediated mitochondrial biogenesis for the following reasons. First, the mRNA levels of TFAM, a PGC-1α-dependent regulator of mitochondrial DNA replication and transcription (Wu et al., 1999), increased, but did so only at day 7 and later (Fig. 6B). Second, mitochondrial biogenesis should repopulate functional mitochondria, and thereby, an increase in mitochondria content is expected to accompany an increase in the mitochondrial membrane potential (MMP) (Fu et al., 2008; Nisoli et al., 2004). However, in the MCF-7 cells undergoing senescence, MMP dropped continuously during the first 4 days and remained at significantly lower levels thereafter (Fig. 6C). Therefore, at least in the early phase, the increase in the mitochondria mass was not likely due to biogenesis. It may rather be attributed to other possibilities such as the arrest of cell division. The increase at later period may have been due to increased biogenesis as suggested by the increased levels of PGC-1α and TFAM. Meanwhile, the drop in MMP indicates that the mitochondria that were present at higher quantity in the cells undergoing senescence were functionally less intact.
Fig. 7. Confocal images of the increased mitochondria content and their size of the adriamycinpulsed MCF-7 cells. The adriamycin-pulsed cells were stained with MTG (and counter-stained with DAPI) at indicated time points during the chase period and processed for confocal microscopy.
The level of superoxide radicals present in mitochondria increased rapidly in day 1 but did not show any further increase thereafter (Fig. 6D). This abrupt increase in mitochondrial superoxide levels was quite different from the steady change of the mitochondria content and membrane potential. Therefore, the mitochondrial superoxide burst was not an event that progressively matured during senescence progression but an event that might have taken place as a direct response to the drug treatment or DNA damage (induced cell cycle arrest). Adriamycin itself is reduced to a free radical (semiquinone form), which, then, converts oxygen to a superoxide radical (Berlin and Haseltine, 1981). Therefore, the rapid increase of superoxide levels may be attributed to the ones directly produced by adriamycin.
Finally, compared to the rather long and filamentous mitochondria in human fibroblasts (Kang and Hwang, 2009), mitochondria exist as dots and short fragments in MCF-7 cells (Fig. 7A, day 0). In addition, it appears that they experience no dramatic change in morphology during the adriamycin-induced senescence.
Acknowledgments
This work was supported by Mid-career Researcher Program through NRF grant funded by the Ministry of Education, Science and Technology (No. 2009-0086432).
References
- 1.Adams P.D. Healing and hurting: molecular mechanisms, functions, and pathologies of cellular senescence. Mol. Cell. (2009);36:2–14. doi: 10.1016/j.molcel.2009.09.021. [DOI] [PubMed] [Google Scholar]
- 2.Berlin V., Haseltine W.A. Reduction of adriamycin to a semiquinone-free radical by NADPH cytochrome P-450 reductase produces DNA cleavage in a reaction mediated by molecular oxygen. J. Biol. Chem. (1981);256:4747–4756. [PubMed] [Google Scholar]
- 3.Blagosklonny M.V. Cell senescence: hypertrophic arrest beyond the restriction point. J. Cell Physiol. (2006);209:592–597. doi: 10.1002/jcp.20750. [DOI] [PubMed] [Google Scholar]
- 4.Brunk U.T., Terman A. The mitochondrial-lysosomal axis theory of aging: accumulation of damaged mitochondria as a result of imperfect autophagocytosis. Eur. J. Biochem. (2002);269:1996–2002. doi: 10.1046/j.1432-1033.2002.02869.x. [DOI] [PubMed] [Google Scholar]
- 5.Brunk U.T., Jones C.B., Sohal R.S. A novel hypothesis of lipofuscinogenesis and cellular aging based on interactions between oxidative stress and autophagocytosis. Mutat. Res. (1992);275:395–403. doi: 10.1016/0921-8734(92)90042-n. [DOI] [PubMed] [Google Scholar]
- 6.Campisi J. Aging and cancer cell biology. Aging Cell. (2007);6:261–263. doi: 10.1111/j.1474-9726.2007.00292.x. [DOI] [PubMed] [Google Scholar]
- 7.Campisi J., d’Adda di Fagagna F. Cellular senescence: when bad things happen to good cells. Nat. Rev. Mol. Cell Biol. (2007);8:729–740. doi: 10.1038/nrm2233. [DOI] [PubMed] [Google Scholar]
- 8.Campisi J., Kim S.H., Lim C.S., Rubio M. Cellular senescence, cancer and aging: the telomere connection. Exp. Gerontol. (2001);36:1619–1637. doi: 10.1016/s0531-5565(01)00160-7. [DOI] [PubMed] [Google Scholar]
- 9.Castino R., Bellio N., Nicotra G., Follo C., Trincheri N.F., Isidoro C. Cathepsin D-Bax death pathway in oxidative stressed neuroblastoma cells. Free Radic. Biol. Med. (2007);42:1305–1316. doi: 10.1016/j.freeradbiomed.2006.12.030. [DOI] [PubMed] [Google Scholar]
- 10.Chen Q.M., Tu V.C., Catania J., Burton M., Toussaint O., Dilley T. Involvement of Rb family proteins, focal adhesion proteins and protein synthesis in senescent morphogenesis induced by hydrogen peroxide. J. Cell Sci. (2000);113:4087–4097. doi: 10.1242/jcs.113.22.4087. [DOI] [PubMed] [Google Scholar]
- 11.Cho S.H., Hwang E.S. Fluorescence-based detection and quantification of features of cellular senescence. Meth. Cell Biol. (In press). (2011) doi: 10.1016/B978-0-12-385493-3.00007-3. [DOI] [PubMed]
- 12.Comings. D.E., Okada T.A. Electron microscopy of human fibroblasts in tissue culture during logarithmic and confluent stages of growth. Exp. Cell Res. (1970);61:295–301. doi: 10.1016/0014-4827(70)90451-9. [DOI] [PubMed] [Google Scholar]
- 13.De Vincenzo R., Scambia G., Benedetti Panici P., Fattorossi A., Bonanno G., Ferlini C., Isola G., Pernisco S., Mancuso S. Modulatory effect of tamoxifen and ICI 182,780 on adriamycin resistance in MCF-7 human breast-cancer cells. Int. J. Cancer. (1996);68:340–348. doi: 10.1002/(SICI)1097-0215(19961104)68:3<340::AID-IJC12>3.0.CO;2-C. [DOI] [PubMed] [Google Scholar]
- 14.Demidenko Z.N., Blagosklonny M.V. Growth stimulation leads to cellular senescence when the cell cycle is blocked. Cell Cycle. (2008);7:3355–3361. doi: 10.4161/cc.7.21.6919. [DOI] [PubMed] [Google Scholar]
- 15.Dimri G.P., Lee X., Basile G., Acosta M., Scott G., Roskelley C., Medrano E.E., Linskens M., Rubelj I., Pereira-Smith O., et al. A biomarker that identifies senescent human cells in culture and in aging skin in vivo. Proc. Natl. Acad. Sci. USA. (1995);92:9363–9367. doi: 10.1073/pnas.92.20.9363. [DOI] [PMC free article] [PubMed] [Google Scholar]
- 16.Elmore L.W., Rehder C.W., Di X., McChesney P.A., Jackson- Cook C.K., Gewirtz D.A., Holt S.E. Adriamycininduced senescence in breast tumor cells involves functional p53 and telomere dysfunction. J. Biol. Chem. (2002);277:35509–35515. doi: 10.1074/jbc.M205477200. [DOI] [PubMed] [Google Scholar]
- 17.Erdal H., Berndtsson M., Castro J., Brunk U., Shoshan M.C., Linder S. Induction of lysosomal membrane permeabilization by compounds that activate p53-independent apoptosis. Proc. Natl. Acad. Sci. USA. (2005);102:192–197. doi: 10.1073/pnas.0408592102. [DOI] [PMC free article] [PubMed] [Google Scholar]
- 18.Fornari F.A. Jr., Jarvis W.D., Grant S., Orr M.S., Randolph J.K., White F.K., Mumaw V.R., Lovings E.T., Freeman R.H., Gewirtz D.A. Induction of differentiation and growth arrest associated with nascent (nonoligosomal) DNA fragmentation and reduced c-myc expression in MCF-7 human breast tumor cells after continuous exposure to a sublethal concentration of doxorubicin. Cell Growth Differ. (1994);5:723–733. [PubMed] [Google Scholar]
- 19.Fu X., Wan S., Lyu Y.L., Liu L.F., Qi H. Etoposide induces ATM-dependent mitochondrial biogenesis through AMPK activation. PLoS One. (2008);3:e2009. doi: 10.1371/journal.pone.0002009. [DOI] [PMC free article] [PubMed] [Google Scholar]
- 20.Gewirtz D.A., Holt S.E., Elmore L.W. Accelerated senescence: an emerging role in tumor cell response to chemotherapy and radiation. Biochem. Pharmacol. (2008);76:947–957. doi: 10.1016/j.bcp.2008.06.024. [DOI] [PubMed] [Google Scholar]
- 21.Haghighat A., Mader S., Pause A., Sonenberg N. Repression of cap-dependent translation by 4E-binding protein 1: competition with p220 for binding to eukaryotic initiation factor-4E. EMBO J. (1995);14:5701–5709. doi: 10.1002/j.1460-2075.1995.tb00257.x. [DOI] [PMC free article] [PubMed] [Google Scholar]
- 22.Hwang E.S., Yoon G., Kang H.T. A comparative analysis of the cell biology of senescence and aging. Cell Mol. Life Sci. (2009);66:2503–2524. doi: 10.1007/s00018-009-0034-2. [DOI] [PMC free article] [PubMed] [Google Scholar]
- 23.Jager S., Handschin C., St-Pierre J.S., Piegelman B.M. AMP-activated protein kinase (AMPK) action in skeletal muscle via direct phosphorylation of PGC-1alpha. Proc. Natl. Acad. Sci. USA. (2007);104:12017–12022. doi: 10.1073/pnas.0705070104. [DOI] [PMC free article] [PubMed] [Google Scholar]
- 24.Johnson D.G., Schwarz J.K., Cress W.D., Nevins J.R. Expression of transcription factor E2F1 induces quiescent cells to enter S phase. Nature. (1993);365:349–352. doi: 10.1038/365349a0. [DOI] [PubMed] [Google Scholar]
- 25.Kawasome H., Papst P., Webb S., Keller G.M., Johnson G.L., Gelfand E.W., Terada N. Targeted disruption of p70(s6k) defines its role in protein synthesis and rapamycin sensitivity. Proc. Natl. Acad. Sci. USA. (1998);95:5033–5038. doi: 10.1073/pnas.95.9.5033. [DOI] [PMC free article] [PubMed] [Google Scholar]
- 26.Krizhanovsky V., Xue W., Zender L., Yon M., Hernando E., Lowe S.W. Implications of cellular senescence in tissue damage response, tumor suppression, and stem cell biology. Cold Spring Harb. Symp. Quant. Biol. (2008);73:513–522. doi: 10.1101/sqb.2008.73.048. [DOI] [PMC free article] [PubMed] [Google Scholar]
- 27.Lee H.C., Yin P.H., Chi C.W., Wei Y.H. Increase in mitochondrial mass in human fibroblasts under oxidative stress and during replicative cell senescence. J. Biomed. Sci. (2002);9:517–526. doi: 10.1007/BF02254978. [DOI] [PubMed] [Google Scholar]
- 28.Lee B.Y., Han J.A., Im J.S., Morrone A., Johung K., Goodwin E.C., Kleijer W.J., DiMaio D., Hwang E.S. Senescence- associated beta-galactosidase is lysosomal beta-galactosidase. Aging Cell. (2006);5:187–195. doi: 10.1111/j.1474-9726.2006.00199.x. [DOI] [PubMed] [Google Scholar]
- 29.Martin-Ruiz C., Saretzki G., Petrie J., Ladhoff J., Jeyapalan J., Wei W., Sedivy J., von Zglinicki T. Stochastic variation in telomere shortening rate causes heterogeneity of human fibroblast replicative life span. J. Biol. Chem. (2004);279:17826–17833. doi: 10.1074/jbc.M311980200. [DOI] [PubMed] [Google Scholar]
- 30.Mooi W.J., Peeper D.S. Oncogene-induced cell senescence - halting on the road to cancer. N. Engl. J. Med. (2006);355:1037–1046. doi: 10.1056/NEJMra062285. [DOI] [PubMed] [Google Scholar]
- 31.Nisoli E., Falcone S., Tonello C., Cozzi V., Palomba L., Fiorani M., Pisconti A., Brunelli S., Cardile A., Francolini M., et al. Mitochondrial biogenesis by NO yields functionally active mitochondria in mammals. Proc. Natl. Acad. Sci. USA. (2004);101:16507–16512. doi: 10.1073/pnas.0405432101. [DOI] [PMC free article] [PubMed] [Google Scholar]
- 32.Ollinger K., Brunk U.T. Cellular injury induced by oxidative stress is mediated through lysosomal damage. Free Radic. Biol. Med. (1995);19:565–574. doi: 10.1016/0891-5849(95)00062-3. [DOI] [PubMed] [Google Scholar]
- 33.Olsson G.M., Rungby J., Rundquist I., Brunk U.T. Evaluation of lysosomal stability in living cultured macrophages by cytofluorometry. Effect of silver lactate and hypotonic conditions. Virchows Arch. B Cell Pathol. Incl. Mol. Pathol. (1989);56:263–269. doi: 10.1007/BF02890025. [DOI] [PubMed] [Google Scholar]
- 34.Ostenfeld M.S., Fehrenbacher N., Høyer-Hansen M., Thomsen C., Farkas T., Jäättelä M. Effective tumor cell death by sigma-2 receptor ligand siramesine involves lysosomal leakage and oxidative stress. Cancer Res. (2005);65:8975–8983. doi: 10.1158/0008-5472.CAN-05-0269. [DOI] [PubMed] [Google Scholar]
- 35.Park J.H., Yi H.W., DiMaio D., Hwang E.S. Heterogeneous upregulation of lysosomal genes in human fibroblasts and cancer cells undergoing senescence. Korean J. Genet. (2007);29:521–527. [Google Scholar]
- 36.Passos J.F., Saretzki G., Ahmed S., Nelson G., Richter T., Peters H., Wappler I., Birket M.J., Harold G., Schaeuble K., et al. Mitochondrial dysfunction accounts for the stocha-stic heterogeneity in telomere-dependent senescence. PLoS Biol. (2007);5:e110. doi: 10.1371/journal.pbio.0050110. [DOI] [PMC free article] [PubMed] [Google Scholar]
- 37.Petit J.M., Maftah A., Ratinaud M.H., Julien R. 10Nnonyl acridine orange interacts with cardiolipin and allows the quantification of this phospholipid in isolated mitochondria. Eur. J. Biochem. (1992);209:267–273. doi: 10.1111/j.1432-1033.1992.tb17285.x. [DOI] [PubMed] [Google Scholar]
- 38.Robbins E., Marcus P.I. Dynamics of acridine orangecell interaction. I. Interrelationships of acridine orange particles and cytoplasmic reddening. J. Cell Biol. (1963);18:237–250. doi: 10.1083/jcb.18.2.237. [DOI] [PMC free article] [PubMed] [Google Scholar]
- 39.Roberg K., Ollinger K. Oxidative stress causes relocation of the lysosomal enzyme cathepsin D with ensuing apoptosis in neonatal rat cardiomyocytes. Am. J. Pathol. (1998);152:1151–1156. [PMC free article] [PubMed] [Google Scholar]
- 40.Ruvinsky I., Meyuhas O. Ribosomal protein S6 phosphorylation: from protein synthesis to cell size. Trends Biochem. Sci. (2006);31:342–348. doi: 10.1016/j.tibs.2006.04.003. [DOI] [PubMed] [Google Scholar]
- 41.Serrano M., Lin A.W., McCurrach M.E., Beach D., Lowe S.W. Oncogenic ras provokes premature cell senescence associated with accumulation of p53 and p16INK4a. Cell. (1997);88:593–602. doi: 10.1016/s0092-8674(00)81902-9. [DOI] [PubMed] [Google Scholar]
- 42.Sitte N., Merker K., Grune T., von Zglinicki T. Lipofuscin accumulation in proliferating fibroblasts in vitro: an indicator of oxidative stress. Exp. Gerontol. (2001);36:475–486. doi: 10.1016/s0531-5565(00)00253-9. [DOI] [PubMed] [Google Scholar]
- 43.Song Y.S., Lee B.Y., Hwang E.S. Dinstinct ROS and biochemical profiles in cells undergoing DNA damage-induced senescence and apoptosis. Mech. Ageing Dev. (2005);126:580–590. doi: 10.1016/j.mad.2004.11.008. [DOI] [PubMed] [Google Scholar]
- 44.Toussaint O., Medrano E.E., von Zglinicki T. Cellular and molecular mechanisms of stress-induced premature senescence (SIPS) of human diploid fibroblasts and melanocytes. Exp. Gerontol. (2000);35:927–945. doi: 10.1016/s0531-5565(00)00180-7. [DOI] [PubMed] [Google Scholar]
- 45.Werneburg N.W., Guicciardi M.E., Bronk S.F., Gores G.J. Tumor necrosis factor-alpha-associated lysosomal permeabilization is cathepsin B dependent. Am. J. Physiol. Gastrointest. Liver Physiol. (2002);283:G947–956. doi: 10.1152/ajpgi.00151.2002. [DOI] [PubMed] [Google Scholar]
- 46.Wu Z., Puigserver P., Andersson U., Zhang C., Adelmant G., Mootha V., Troy A., Cinti S., Lowell B., Scarpulla R.C., et al. Mechanisms controlling mitochondrial biogenesis and respiration through the thermogenic coactivator PGC-1. Cell. (1999);98:115–124. doi: 10.1016/S0092-8674(00)80611-X. [DOI] [PubMed] [Google Scholar]
- 47.Xuan F., Yi W., Lyu L., Leroy F.L., Haiyan Q.I. Etoposide induces ATM-dependent mitochondrial biogenesis through AMPK activation. PLoS ONE. (2008);3:e2009. doi: 10.1371/journal.pone.0002009. [DOI] [PMC free article] [PubMed] [Google Scholar]
- 48.Zhu J., Woods D., McMahon M., Bishop J.M. Senescence of human fibroblasts induced by oncogenic Raf. Genes Dev. (1998);12:2997–3007. doi: 10.1101/gad.12.19.2997. [DOI] [PMC free article] [PubMed] [Google Scholar]