

Abstract
The extracellular matrix (ECM) provides an essential structural framework for cell attachment, proliferation, and differentiation, and undergoes progressive changes during senescence. To investigate changes in protein expression in the extracellular matrix between young and senescent fibroblasts, we compared proteomic data (LTQ-FT) with cDNA microarray results. The peptide counts from the proteomics analysis were used to evaluate the level of ECM protein expression by young cells and senescent cells, and ECM protein expression data were compared with the microarray data. After completing the comparative analysis, we grouped the genes into four categories. Class I included genes with increased expression levels in both analyses, while class IV contained genes with reduced expression in both analyses. Class II and Class III contained genes with an inconsistent expression pattern. Finally, we validated the comparative analysis results by examining the expression level of the specific gene from each category using Western blot analysis and semiquantitative RT-PCR. Our results demonstrate that comparative analysis can be used to identify differentially expressed genes.
Keywords: extracellular matrix, microarray, proteomics
INTRODUCTION
Most human cells are capable of only a finite number of cell divisions before entering a non-dividing state, referred to as replicative senescence (Hayflick and Moorhead, 1961). In contrast to dividing cells, senescent cells display characteristic phenotypic alterations such as an increase in the expression of cell cycle inhibitory molecules (Demidenko and Blagosklonny, 2008), a large and flat morphology (Cho et al., 2004), higher senescence-associated β-galactosidase activity (SA-β-gal) (Dimri et al., 1995; Kang et al., 2009), accumulation of oxidative damage (Harman, 1956), hypo-responsiveness to growth factors (Kim et al., 2010) and apoptotic resistance (Ryu et al., 2008). In various cellular processes, morphological changes play an important role in cellular function. However, the mechanisms underlying these morphological changes have not been determined, even though these morphological changes may limit the intrinsic functions of the cells. Furthermore, cellular senescence has been suggested to reduce the risk for neoplastic transformation by preventing cell proliferation (Campisi, 2005).
Recently, however, senescent cells have been proposed to have an effect on surrounding tissues. Secretion of vascular endothelial growth factor (VEGF) by senescent fibroblasts at much higher levels than those seen in presenescent fibroblasts was demonstrated to stimulate tumor vascularization in aged mice, facilitating age-associated cancer development (Coppe et al., 2006). Additionally, other secreted factors (e.g., senescence- associated secretary phenotype, IL-6, IL-8, and MMP3) from senescent fibroblasts have been shown to induce a proinflammatory state in the cellular environment (Rodier et al., 2009). An inflammatory microenvironment might affect the development of cancer in vivo via an innate immune response (Ren et al., 2009). In addition, cells can influence their own or their neighbor’s microenvironment through the synthesis and secretion of a variety of extracellular matrix (ECM) components. In the early 1980s, Bissell et al. proposed that the ECM contains key signaling molecules that are crucial for normal cellular function (Bissell et al., 1982). The ECM functions as a critical source for cell growth, survival, and motility (Bissell et al., 1982; Fidler, 2002). Furthermore, it has been demonstrated that in supplemented ECM cultures, healthy breast cells changed morphologically, whereas cancerous cells formed a tumorous mass (Petersen et al., 1992).
During aging, changes occur in the ECM, which provides a structural framework for cell attachment and determines cellular morphology. For example, during senescence, the ECM becomes less soluble and proteolytically digestible and heat denaturation takes longer (Sell and Monnier, 1989). These changes are thought to result from the formation of age-related intermolecular cross-links. Because senescence is associated with changes in the ECM, it is important to define these changes to determine their effects on cell attachment, differentiation, and phenotype. Although changes in cells that occur as a result of aging have been investigated by many researchers, few groups have focused on evaluating changes in ECM components during aging (Pagani et al., 1991).
Comparative proteomics is an exciting new research approach that utilizes mass spectrometry data. Comparative proteomic analysis of primary biological materials would benefit from uncomplicated experimental work-flows capable of evaluating an unlimited number of samples. In this report, we describe how we applied label-free proteomics to quantitatively analyze the cell matrix of young and senescent cells. This type of research enables genomic and proteomic annotations on a genomic scale. Several comparative proteomic methods such as Differential Gel Electrophoresis (DIGE) (Capitanio et al., 2009), labeling, and label-free methods have been developed. Numerous independent studies have shown that label-free approaches that use the inherent quantitative information in LC-MS/ MS data are suitable for quantitative proteomics. In this study, we applied one of the label-free methods, namely “peptide counting”, to search databases (Wienkoop et al., 2006). Due to the higher abundance of peptide analysis results obtained with LC-MS/MS, proteins are more likely to be detected in database searches. Peptides are identified by the fragmented ions obtained from the collision cell of a tandem mass spectrometer, and the amino acid sequences are identified using database search engines such as MASCOT.
High-throughput screening methods including microarray or proteomic analysis are commonly used to elucidate global gene expression profiling; however, the screening results are not often consistent with conventional analysis results such as Western blot. To obtain more reliable data, the screening results from microarray and proteomic analysis can be combined. In this study, to identify changes in the expression of extracellular matrix proteins between young and senescent fibroblasts, we compared proteomic results with microarray results, and validated our findings for a subset of differentially expressed genes using Western blot analysis and semi-quantitative PCR.
MATERIALS AND METHODS
Reagents and antibodies
DMEM, FBS, penicillin, and streptomycin were purchased from Gibco/BRL Life Technologies, Inc. (USA). Monoclonal antibodies against Tropomyosin 3 (TPM3) and Microtubule-actin crosslinking factor 1 (MACF1) were obtained from Santa Cruz Bio-technology, Inc. (USA). Fibrillin 2 (FBN2), dynein axonemal heavy chain 9 (DNAH9) antibodies were purchased from Chemicon (USA). HRP-conjugated anti-rabbit and anti-mouse secondary antibodies were acquired from Vector Laboratories (USA). A protein assay kit was purchased from Bio-Rad Laboratories (USA) and the ECL system and Amersham hyperfilm™ ECL were obtained from GE Healthcare (UK). Protease inhibitor cocktail set I was purchased from Calbiochem (Germany), the BCA™ Protein Assay Kit was purchased from Pierce (USA), and the 1 kDa cut-off Centricon filter was obtained from Millipore (USA). NuPAGE® Novex 3-8% Tris-Acetate gels were obtained from Invitrogen (USA).
Cell culture and ECM protein preparation
Primary human fibroblasts were isolated from newborn foreskins as described previously (Boyce and Ham, 1983), and maintained in Dulbecco’s modified Eagle’s medium containing 10% fetal bovine serum and antibiotics. Intracellular components of young cells from the early stage of culture (passaged less than 9 times) were compared with those of senescent cells (cells at passage 31 or higher). Senescent cells had an altered morphology, enhanced β-galactosidase activity, and a reduced rate of proliferation (Yeo et al., 2000). ECM extracts were prepared from cultured young and senescent human diploid fibroblast cells (HDF) as described previously (Pflieger et al., 2006). In brief, the matrices that remained after removing HDF cells by trypsinization were scraped off the culture plate and resuspended in 10 mM Tris-HCl buffer (pH 7.2) containing 1% Triton X-100, 10% glycerol, 5% SDS, 100 mM DTT, and 1% protease inhibitor cocktail set I. Protein concentration was estimated using the BCA™ Protein Assay Kit. Filtrates were passed through a 1-kDa cut-off Centricon filter, dried using a speed vacuum dryer, and stored at -70℃ prior to LC-MS analysis.
Senescence-associated β-galactosidase staining
Senescent cells were washed with phosphate-buffered saline (PBS) and fixed for 35 min at room temperature in 3% formaldehyde in PBS. After washing with PBS, cells were incubated at 37℃ with fresh senescence-associated β-galactosidase staining solution (1 mg/ml 5-bromo-4-chloro-3-indolyl-D-galactopyranoside (X-gal), 40 mM citric acid/sodium phosphate, pH 6.0, 5 mM potassium ferrocyanide, 5 mM potassium ferricyanide, 150 mM NaCl, 2 mM MgCl2). Sixteen hours later, senescent cells were identified under a light microscope.
Microarray analysis of the ECM
Human twin 8 K cDNA chip (Digital Genomics, Korea) was used for the transcription profiling analysis. RNA from senescent cells was labeled with Cy5-dUTP by reverse transcription and RNA from young cells with Cy3-dUTP. Labeled products were set onto cDNA chips and hybridized at 65℃ for 16 h using a hybridization oven. Following wash, fluorescent images were quantified and normalized, as described previously Rhim et al., 2009).
Proteomic analysis of ECM extracts
Aliquots of 50 μg of protein per group were loaded onto Nu- PAGE® Novex 3-8% Tris-Acetate gels. After electrophoresis, gels were fixed in 30% ethanol/7.5% acetic acid for 2 h followed by staining with CBB R250. Each gel lane was cut into 12 pieces according to band intensity and molecular weight. Gel pieces were excised with a razor knife and transferred to new eppendorf tubes. Sliced gel pieces were washed with 10 mM ammonium bicarbonate (ABC) and 50% acetonitrile and incubated in tryptic digestion buffer containing 50 mM ABC, 5 mM CaCl2, and 1 mg/ml trypsin at 37℃ for 16 h. Peptides were recovered by two cycles of extraction with 50 mM ABC and 100% acetonitrile. The resulting peptide extracts for each band were pooled, lyophilized, and stored at -20℃ prior to LCMS/ MS analysis. Lyophilized peptide extracts were dissolved in 0.1% formic acid and analyzed by LC-MS/MS as described previously (Kim et al., 2005). A microcapillary column (75 μm × 150 mm) packed with C18 silica resin was used for LC separation. Eluted peptides were applied to a 7-Tesla Fourier Transform- Ion Cyclotron Resonance (FT-ICR) MS (Thermo, USA). The MS peptides were identified by searching against the human database of the International Protein Index (IPI) hosted by the European Bioinformatics Institute (http://www.ebi.ac.uk/IPI) using MASCOT program version 2.2 (http://www.matrixscience.com, Matrixscience, UK). Peptide MS/MS assignments were filtered according to the following criteria: the peptide tolerance of the parental ion was set at 50 ppm and the MS/MS tolerance was set at 0.8 Da. The carbamidomethylation of cysteine (+57 Da) and the oxidation of methionine (+16 Da) were chosen as variable modifications. In addition, one missed cleavage of a trypsin was allowed for peptide identification.
Semi-quantitative RT-PCR confirmation
Total RNA was extracted from young and senescent cells using an acid guanidinium thiocyanate phenol-chloroform extractionbased method. To compare the relative amounts of mRNA in young and senescent cells, semi-quantitative reverse transcription- polymerase chain reaction (RT-PCR) was performed as described by Nicoletti and Sassy-Prigent [17]. A series of mix-tures were prepared by mixing RNA from young and senescent cells as indicated, so that each mixture had the same total amount of RNA (2 μg) in a constant volume (12 μl). The RT reaction was carried out in a final volume of 20 μl using Superscript II reverse transcriptase according to the manufacturer’s protocol, and 4 μl of the final RT product mix was then PCR amplified. The primer sets used were 5′- CAG TCA GGA GAC CCT ATT CAC- 3′ and 5′- CTG ACA TAT CCC CTG ATT CCC-3 for MACF1, 5′-GGC GAG GAC AGC AGG AC-3′ and 5′-TGA TAT TTG CCC ACT GGA ACA-3′ for FBN2, 5′- CCA GCT GGT TGA AGA AGA GC -3′ and 5′- GAG TAC TTC TCC GCC TGA GC -3′ for TPM3, and 5′- AAG AGC CCT AGA TTT TGC AAC CTC -3′ and 5′- CAC TCA TGA AGA CCC TGA ACT CTG -3′ for DNAH9.
RESULTS
Comparative analysis of young and senescent HDF cells
To analyze the expression of extracellular matrix proteins in senescent fibroblast cells, we used a combined proteomics and cDNA microarray analysis approach, as outlined in Fig. 1A. Young and senescent fibroblast cells were cultured and the extracellular matrix proteins were separated by 1D SDS gel electrophoresis. To analyze all matrix proteins, gel lanes were divided into fractions, digested with trypsin, and the digested peptide products were then analyzed using the LTQ-FT shotgun method. MASCOT software was used to convert the experimental MS/MS data into predicted peptides. To analyze gene expression using microarrays, mRNA was prepared from young and senescent fibroblast cells and dual 8 k human cDNA microarrays were used to identify genes differentially expressed between young and senescent fibroblasts. Proteomic data and microarray data were filtered and combined using gene symbols, and we then performed comparative analyses.
Fig. 1. Comparative analysis scheme. (A) Young cells at passage 9 or lower and senescent cells at passage 31 or higher were used. Total RNA was isolated, converted to cDNA, and then microarray analyses were performed using a DNA chip (8k human cDNA). Matrix proteins were prepared as described in “Materials and Methods”, and proteomic analysis were performed using LTQ-FT shotgun methods. (B) Young cells and senescent cells were stained for β-gal to detect senescent cells.
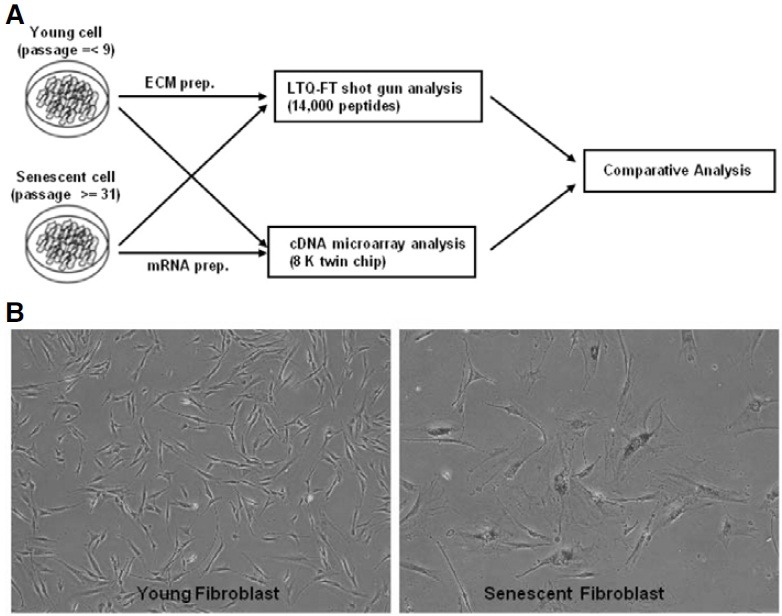
Human diploid fibroblast cells at passage 31 or higher were used as senescent fibroblast cells, and HDF cells at passage 9 or lower were used as young control cells. To verify the cellular senescence of HDF cells, senescence-associated β-gal staining was performed; the senescent fibroblast cells showed elevated SA β-gal activity (Fig. 1B).
Proteomic analysis of extracellular matrix proteins
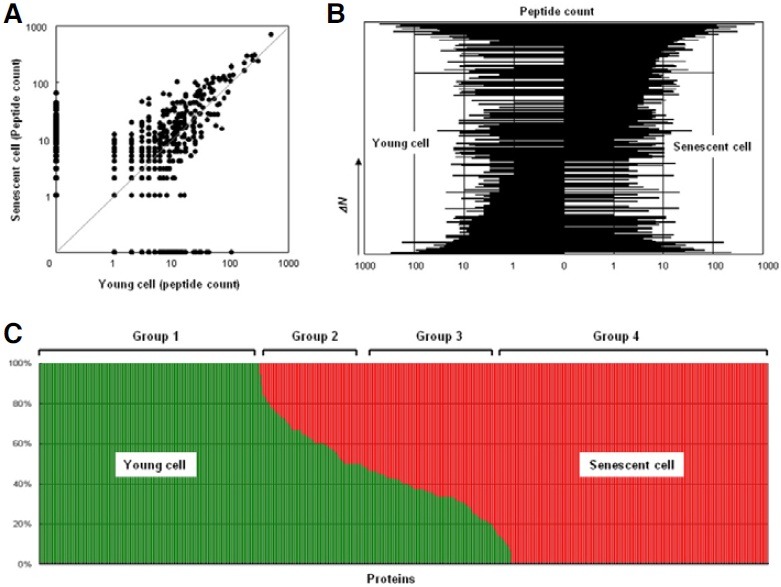
LTQ-FT shotgun proteomic methods were applied to identify matrix proteins differentially expressed between young and senescent fibroblast cells. Our in silico analysis with MASCOT software identified more than 20,000 peptides, corresponding to up to 1,000 proteins. A scatter plot of peptide counts revealed a linear correlation between young and senescent cells, as well as differentially expressed proteins (Fig. 2A) (Fu et al., 2008). We aligned the peptide counts of each protein based on the difference in peptide number between senescent cells and young cells; the converted graph represents the relative protein abundance in young and senescent cells (Fig. 2B). Finally, we calculated the relative distribution of each protein as a percentage (Fig. 2C). Group 1 proteins (350 proteins) were detected only in young fibroblasts, while Group 4 proteins (417 proteins) were detected only in senescent cells. Group 2 comprised 107 proteins with higher peptide counts in young cells, while Group 3 comprised 208 proteins with higher peptide counts in senescent fibroblasts. Twenty-three proteins had equal peptide counts in young and senescent cells.
Fig. 2. Proteomic analysis of matrix proteins in young and senescent cells. (A) The peptide counts of senescent cells were plotted against the corresponding peptide counts of young cells. (B) The peptide counts of young cells and senescent cells were analyzed based on the difference in peptide number (ΔN). (C) The relative distribution of each protein as a percentage is shown.
Combined analysis of proteomic and microarray data
Because high-throughput proteomic analysis often results in biased data due to the limited number of peptide fragments, we combined the proteomic results with microarray analysis data. We analyzed gene expression using a human 8 k dual cDNA microarray and compared this data with peptide counts in a 2D graph (Fig. 3A). We filtered the data by focusing only on genes detected by both microarray and proteomic analysis. Although we used experimentally equivalent cell samples, the 2D graph did not reveal any correlation patterns between the microarray and proteomic data. We examined the pairwise comparisons using Venn diagrams. Total 185 genes showed the increased expression in at least one method, only 55 genes (~30%) showed the increased expression in both analyses. Only 63 out 194 (~33%) showed the reduced expression in both analyses (Fig. 3B).
Fig. 3. Comparative analysis of proteomic and microarray data. (A) The microarray expression data were plotted against the corresponding proteomic data. (B) Venn diagrams show the following: i) genes up-regulated in proteomic analysis versus genes up-regulated in microarray analysis, ii) genes down-regulated in proteomic analysis versus genes down-regulated in microarray analysis.
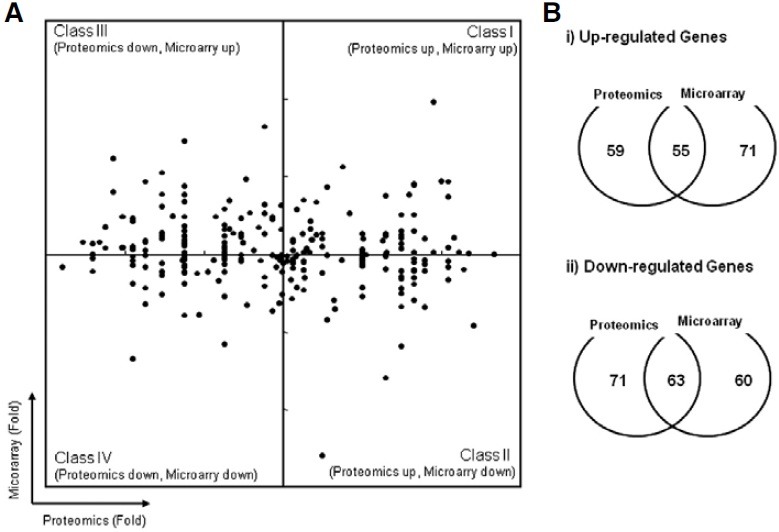
After completing the comparative analysis, we grouped the genes into four categories. Class I included genes with increased expression levels in both analyses, while class IV contained genes with reduced expression in both analyses. Class II and Class III contained genes with an inconsistent expression pattern; Class II consisted of genes with higher proteomic counts, while Class III contained genes with higher expression levels in microarray analysis. Among these, we selected genes whose expression was markedly different between senescent and young fibroblasts for further analyses (Table 1).
Table 1.
Genes differentially expressed from young and senescent cells
| Gene | Putative function | Proteomics results | Microarray results | ||
|---|---|---|---|---|---|
| Younga (No. of Pep.) | Senescentb (No. of Pep.) | Fold changec (Log scale) | Fold change (Log scale) | ||
| Class I | |||||
| CD163 | Protein_binding | 0 | 9 | 4.17 | 0.74 |
| CIT | Structural_molecular_activity | 0 | 8 | 4.00 | 0.95 |
| COL1A1 | Structural_molecular_activity | 0 | 3 | 2.58 | 0.75 |
| LRRFIP1 | DNA_binding | 0 | 4 | 3.00 | 0.51 |
| MAP3K11 | Protein_binding | 0 | 5 | 3.32 | 0.51 |
| MLL2 | Protein_binding | 0 | 9 | 4.17 | 0.94 |
| MT1F | Ion_binding | 8 | 32 | 1.51 | 1.12 |
| MYH9 | Protein_binding | 1 | 3 | 1.10 | 0.87 |
| PRKDC | Protein_binding | 27 | 67 | 0.83 | 0.66 |
| RYR2 | Protein_binding | 7 | 31 | 1.66 | 0.52 |
| TPM3 | Protein_binding | 4 | 17 | 1.60 | 0.9 |
| TYMS | Catalytic_activity | 0 | 7 | 3.81 | 1.96 |
| VIL2 | Structural_molecular_activity | 0 | 7 | 3.81 | 0.9 |
| Class II | |||||
| ADAMTS2 | Ion_binding | 0 | 6 | 3.58 | -0.68 |
| AFP | Transporter_activity | 0 | 4 | 3.00 | -0.67 |
| C3 | Structural_molecular_activity | 4 | 12 | 1.10 | -0.85 |
| CTGF | Protein_binding | 0 | 4 | 3.00 | -1.19 |
| DSP | Structural_molecular_activity | 4 | 18 | 1.68 | -1.59 |
| MACF1 | Protein_binding | 8 | 46 | 2.04 | -0.59 |
| MLL5 | Protein_binding | 0 | 5 | 3.32 | -0.59 |
| NDN | Protein_binding | 0 | 4 | 3.00 | -0.50 |
| VAT1 | Ion_binding | 2 | 7 | 1.32 | -0.31 |
| Class III | |||||
| ANXA2 | Protein_binding | 23 | 16 | -1.01 | 0.91 |
| DDX21 | Protein_binding | 4 | 0 | -3.49 | 0.93 |
| FBN2 | Structural_molecular_activity | 91 | 66 | -0.95 | 0.97 |
| HSPA8 | Protein_binding | 7 | 0 | -4.29 | 0.80 |
| HSPD1 | Protein_binding | 3 | 0 | -3.07 | 0.77 |
| MTMR4 | Ion_binding | 7 | 0 | -4.29 | 1.23 |
| PCDHA9 | Protein_binding | 3 | 0 | -3.07 | 0.62 |
| TUBB | Structural_molecular_activity | 3 | 0 | -3.07 | 1.04 |
| Class IV | |||||
| DNAH9 | Motor_activity | 25 | 8 | -2.13 | -0.78 |
| GOLGA4 | Protein_binding | 3 | 0 | -3.07 | -0.52 |
| LRMP | NA | 4 | 3 | -0.90 | -0.66 |
| TNC | Protein_binding | 5 | 0 | -3.81 | -1.35 |
| TNFAIP3 | Protein_binding | 4 | 0 | -3.49 | -0.64 |
cFold change is Log2 (bNormalized/anormalized), when the protein is not identified in either cell line, the peptide count, 0.5 applied.
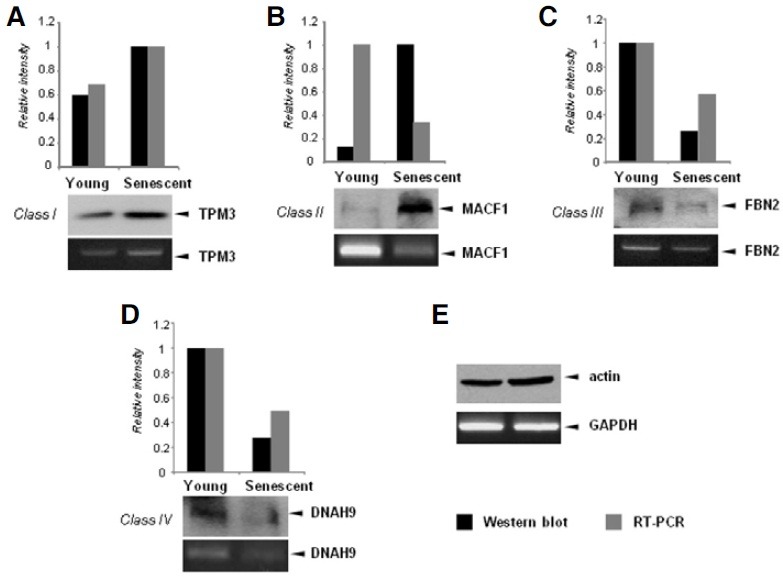
Fig. 4. Validation of comparative analysis results by Western blot and reverse transcription (RT)-PCR. (A) Expression of TPM3, a representative class I gene, was examined by Western blot analysis with an anti-TPM3 antibody (upper panel) and RT-PCR analysis (bottom panel). The density of the TPM3 band was quantitated and plotted on a bar graph. (B-D) Expression of MACF1 (class II gene), FBN2 (class III gene), and DNAH9 (class IV gene) were examined as described above. (E) β-actin protein was used as a loading control for Western blots and GAPDH was used as a normalization control for semi-quantitative PCR.
Validation of the comparative analysis results
High-throughput analyses may result in biased data, and inconsistent results are often obtained when different methods are used. Therefore, it is absolutely essential to validate the data with specific methods such as quantitative RT-PCR or Western blot. Because we used different analysis methods to measure gene expression, we wanted to validate our screening results with the conventional methods such as RT-PCR and Western blots. We selected one gene from each of the four classes of genes for validation by semi-quantitative RT-PCR and Western blot. Four genes were selected based on the peptide counts (a large number) in the proteomic analysis and the availability of commercial antibodies. TPM3 is an example of a Class I gene (Pieples and Wieczorek, 2000). mRNA levels of TPM3 were elevated in senescent cells, while protein levels of TPM3 were also increased. MACF1 is an example of a class II gene (Bernier et al., 2000), and the semi-quantitative PCR and Western blot results were consistent with the designation of this gene as a class II gene based on the proteomic and microarray analyses. DNAH9 was selected as a representative class IV gene (Yoshisue and Hasegawa, 2004), and its expression was decreased in both RT-PCR and Western blot experiments, indicating that the screening results for this gene were correct. FBN2 was selected as the class III gene for validation (Chen et al., 2005). We expected that that the mRNA expression of FBN2 would be elevated in senescent cells; however RT-PCR revealed that FBN2 mRNA expression was actually reduced in senescent cells.
DISCUSSION
Cells influence their microenvironment through the synthesis and secretion of a variety of autocrine, paracrine, and endocrine factors as well as ECM components. Cell-to-matrix interactions are involved in homeostatic regulation of normal tissues, and may be dysregulated in age-related diseases. During aging and degeneration, the ability of cells to synthesize the correct matrix components appears to be compromised (Zhao et al., 2007). The proportion of ECM components, especially crosslinked collagen fibers (Verzar, 1964), fibronectin (Colige et al., 1992), and laminin (Fodil-Bourahla et al., 1999), increases with age (Labat-Robert, 2004; Labat-Robert and Robert, 2007). However, quantitative and qualitative alterations of ECM components and their influence on cellular fate during aging have not been examined in detail. Aging-related changes in the ECM could involve age-dependent modification of ECM production, matrix components, and consequent alterations in cell-to-matrix interactions.
High-throughput screening systems including microarray or proteomic analysis are commonly used to elucidate global cell signaling networks; however, the results from these analyses are not often consistent with conventional analysis results. To obtain more robust data, we combined screening results from LTQ-FT proteomic analysis and cDNA microarray analysis. We compared the data obtained from these tools, and grouped genes into four classes based on the nature of their differential expression in young and senescent cells. To validate our results, we selected representative genes and examined their expression levels using RT-PCR and Western blot analyses. Expression patterns of three of the four genes were consistent with the screening results; however FBN2, a class III gene, showed an expression pattern inconsistent with the microarray result.
TPM3 is identified as one of the up-regulated genes during senescence by both mRNA and protein analysis. TPM3 gene encodes human tropomyosin isoforms, which localize in the lamella or stress fibers (Lin et al., 1988; 2008). One characteristic feature of senescent cells is flat and enlarged cell shapes, and the senescent cells may require large amount of cytoskeleton proteins (Nishio et al., 2001). For this reason, the level of TPM3 appears to be up-regulated to contribute to the senescent cell phenotype. DNAH9 expression is down-regulated during senescence. DNAH9 encodes dynein axonemal heavy chain 9, one subunit of dynein multiprotein complex, and dynein is involved in the cytoplasmic movement of chromosome and organelle and bending of cilia/flagella (Bartoloni et al., 2001). Because another subunit of dynein complex, dynein cytoplasmic heavy polypeptide 1 (DNCH1) is also repressed during senescence (Chen et al., 2004), it appears that the dynein component expressions are generally down-regulated in the senescent cells due to the lack of cytoplasmic movement.
Microarray analyses provide information about the levels of mRNA transcripts, whereas proteomics tools provide peptide mass fragment counts. mRNA expression patterns are often divergent from protein expression patterns because of post-transcriptional or post-translational regulation. For example, if a protein is a target of ubiquitination, that protein will be rapidly degraded despite a higher mRNA abundance. Likewise, low levels of stable mRNA can translate to higher protein expression, as is often seen for housekeeping genes. When we analyzed gene expression patterns in young and senescent fibroblasts using both microarray and proteomic analysis, we detected only a few genes that were common to both assays. These results indicate a discrepancy between protein levels and mRNA levels. Nevertheless, we argue that our results indicate that combining proteomic data with microarray data can provide more dependable screening data for the identification of differentially expressed genes.
Acknowledgments
This work was supported by a Korea Basic Science Grant (KBSI-T31614) and the Mid-career Researcher Program through an NRF Grant funded by Ministry of Education, Science and Technology (No. RO1-2008-000-20253-0). We special thank K-Mep team for technical assistance.
References
- 1.Bartoloni L., Blouin J.L., Maiti A.K., Sainsbury A., Rossier C., Gehrig C., She J.X., Marron M.P., Lander E.S., Meeks M., et al. Axonemal beta heavy chain dynein DNAH9: cDNA sequence, genomic structure, and investigation of its role in primary ciliary dyskinesia. Genomics. (2001);72:21–33. doi: 10.1006/geno.2000.6462. [DOI] [PubMed] [Google Scholar]
- 2.Bernier G., Pool M., Kilcup M., Alfoldi J., De Repentigny Y., Kothary R. Acf7 (MACF) is an actin and micro-tubule linker protein whose expression predominates in neural, muscle, and lung development. Dev. Dyn. (2000);219:216–225. doi: 10.1002/1097-0177(2000)9999:9999<::AID-DVDY1041>3.0.CO;2-O. [DOI] [PubMed] [Google Scholar]
- 3.Bissell M.J., Hall H.G., Parry G. How does the extracellular matrix direct gene expression? J. Theor. Biol. (1982);99:31–68. doi: 10.1016/0022-5193(82)90388-5. [DOI] [PubMed] [Google Scholar]
- 4.Boyce S.T., Ham R.G. Calcium-regulated differentiation of normal human epidermal keratinocytes in chemically defined clonal culture and serum-free serial culture. J. Invest. Dermatol. (1983);81:33s–40s. doi: 10.1111/1523-1747.ep12540422. [DOI] [PubMed] [Google Scholar]
- 5.Campisi J. Senescent cells, tumor suppression, and organismal aging: good citizens, bad neighbors. Cell. (2005);120:513–522. doi: 10.1016/j.cell.2005.02.003. [DOI] [PubMed] [Google Scholar]
- 6.Capitanio D., Vasso M., Fania C., Moriggi M., Vigano A., Procacci P., Magnaghi V., Gelfi C. Comparative proteomic profile of rat sciatic nerve and gastrocnemius muscle tissues in ageing by 2-D DIGE. Proteomics. (2009);9:2004–2020. doi: 10.1002/pmic.200701162. [DOI] [PubMed] [Google Scholar]
- 7.Chen H.L., Lu C.Y., Hsu Y.H., Lin J.J. Chromosome positional effects of gene expressions after cellular senescence. Biochem. Biophys. Res. Commun. (2004);313:576–586. doi: 10.1016/j.bbrc.2003.11.146. [DOI] [PubMed] [Google Scholar]
- 8.Chen H., Suzuki M., Nakamura Y., Ohira M., Ando S., Iida T., Nakajima T., Nakagawara A., Kimura H. Aberrant methylation of FBN2 in human non-small cell lung cancer. Lung Cancer. (2005);50:43–49. doi: 10.1016/j.lungcan.2005.04.013. [DOI] [PubMed] [Google Scholar]
- 9.Cho K.A., Ryu S.J., Oh Y.S., Park J.H., Lee J.W., Kim H.P., Kim K.T., Jang I.S., Park S.C. Morphological adjustment of senescent cells by modulating caveolin-1 status. J. Biol. Chem. (2004);279:42270–42278. doi: 10.1074/jbc.M402352200. [DOI] [PubMed] [Google Scholar]
- 10.Colige A.C., Lambert C.A., Nusgens B.V., Lapiere C.M. Effect of cell-cell and cell-matrix interactions on the response of fibroblasts to epidermal growth factor in vitro. Expression of collagen type I, collagenase, stromelysin and tissue inhibitor of metalloproteinases. Biochem. J. (1992);285:215–221. doi: 10.1042/bj2850215. [DOI] [PMC free article] [PubMed] [Google Scholar]
- 11.Coppe J.P., Kauser K., Campisi J., Beausejour C.M. Secretion of vascular endothelial growth factor by primary human fibroblasts at senescence. J. Biol. Chem. (2006);281:29568–29574. doi: 10.1074/jbc.M603307200. [DOI] [PubMed] [Google Scholar]
- 12.Demidenko Z.N., Blagosklonny M.V. Growth stimulation leads to cellular senescence when the cell cycle is blocked. Cell Cycle. (2008);7:3355–3361. doi: 10.4161/cc.7.21.6919. [DOI] [PubMed] [Google Scholar]
- 13.Dimri G.P., Lee X., Basile G., Acosta M., Scott G., Roskelley C., Medrano E.E., Linskens M., Rubelj I., Pereira-Smith O., et al. A biomarker that identifies senescent human cells in culture and in aging skin in vivo. Proc. Natl. Acad. Sci. USA. (1995);92:9363–9367. doi: 10.1073/pnas.92.20.9363. [DOI] [PMC free article] [PubMed] [Google Scholar]
- 14.Fidler I.J. The organ microenvironment and cancer metastasis. Differentiation. (2002);70:498–505. doi: 10.1046/j.1432-0436.2002.700904.x. [DOI] [PubMed] [Google Scholar]
- 15.Fodil-Bourahla I., Drubaix I., Robert L., Labat-Robert J. Effect of in vitro aging on the modulation of protein and fibronectin biosynthesis by the elastin-laminin receptor in human skin fibroblasts. Gerontology. (1999);45:23–30. doi: 10.1159/000022051. [DOI] [PubMed] [Google Scholar]
- 16.Fu X., Gharib S.A., Green P.S., Aitken M.L., Frazer D.A., Park D.R., Vaisar T., Heinecke J.W. Spectral index for assessment of differential protein expression in shotgun proteomics. J. Proteome Res. (2008);7:845–854. doi: 10.1021/pr070271+. [DOI] [PubMed] [Google Scholar]
- 17.Harman D. Aging: a theory based on free radical and radiation chemistry. J. Gerontol. (1956);11:298–300. doi: 10.1093/geronj/11.3.298. [DOI] [PubMed] [Google Scholar]
- 18.Hayflick L., Moorhead P.S. The serial cultivation of human diploid cell strains. Exp. Cell Res. (1961);25:585–621. doi: 10.1016/0014-4827(61)90192-6. [DOI] [PubMed] [Google Scholar]
- 19.Kang J.Y., Kim J.J., Jang S.Y., Bae Y.S. The p53- p21Cip1/WAF1 pathway is necessary for cellular senescence induced by the inhibition of protein kinase CKII in human colon cancer cells. Mol. Cells. (2009);28:489–494. doi: 10.1007/s10059-009-0141-9. [DOI] [PubMed] [Google Scholar]
- 20.Kim J.Y., Lee J.H., Park G.W., Cho K., Kwon K.H., Park Y.M., Cho S.Y., Paik Y.K., Yoo. J.S. Utility of electrophoretically derived protein mass estimates as additional constraints in proteome analysis of human serum based on MS/MS analysis. Proteomics. (2005);5:3376–3385. doi: 10.1002/pmic.200401220. [DOI] [PubMed] [Google Scholar]
- 21.Kim S.Y., Ryu S.J., Ahn H.J., Choi H.R., Kang H.T., Park S.C. Senescence-related functional nuclear barrier by down-regulation of nucleo-cytoplasmic trafficking gene expression. Biochem. Biophys. Res. Commun. (2010);391:28–32. doi: 10.1016/j.bbrc.2009.10.154. [DOI] [PubMed] [Google Scholar]
- 22.Labat-Robert J. Cell-matrix interactions in aging: role of receptors and matricryptins. Ageing Res. Rev. (2004);3:233–247. doi: 10.1016/j.arr.2003.10.002. [DOI] [PubMed] [Google Scholar]
- 23.Labat-Robert J., Robert L. The effect of cell-matrix interactions and aging on the malignant process. Adv. Cancer Res. (2007);98:221–259. doi: 10.1016/S0065-230X(06)98007-5. [DOI] [PubMed] [Google Scholar]
- 24.Lin J.J., Hegmann T.E., Lin J.L. Differential localization of tropomyosin isoforms in cultured nonmuscle cells. J. Cell Biol. (1988);107:563–572. doi: 10.1083/jcb.107.2.563. [DOI] [PMC free article] [PubMed] [Google Scholar]
- 25.Lin J.J., Eppinga R.D., Warren K.S., McCrae K.R. Human tropomyosin isoforms in the regulation of cytoskeleton functions. Adv. Exp. Med. Biol. (2008);644:201–222. doi: 10.1007/978-0-387-85766-4_16. [DOI] [PubMed] [Google Scholar]
- 26.Nishio K., Inoue A., Qiao S., Kondo H., Mimura A. Senescence and cytoskeleton: overproduction of vimentin induces senescent-like morphology in human fibroblasts. Histochem. Cell Biol. (2001);116:321–327. doi: 10.1007/s004180100325. [DOI] [PubMed] [Google Scholar]
- 27.Pagani F., Zagato L., Vergani C., Casari G., Sidoli A., Baralle F.E. Tissue-specific splicing pattern of fibronectin messenger RNA precursor during development and aging in rat. J. Cell Biol. (1991);113:1223–1229. doi: 10.1083/jcb.113.5.1223. [DOI] [PMC free article] [PubMed] [Google Scholar]
- 28.Petersen O.W., Ronnov-Jessen L., Howlett A.R., Bissell M.J. Interaction with basement membrane serves to rapidly distinguish growth and differentiation pattern of normal and malignant human breast epithelial cells. Proc. Natl. Acad. Sci. USA. (1992);89:9064–9068. doi: 10.1073/pnas.89.19.9064. [DOI] [PMC free article] [PubMed] [Google Scholar]
- 29.Pflieger D., Chabane S., Gaillard O., Bernard B.A., Ducoroy P., Rossier J., Vinh J. Comparative proteomic analysis of extracellular matrix proteins secreted by two types of skin fibroblasts. Proteomics. (2006);6:5868–5879. doi: 10.1002/pmic.200402040. [DOI] [PubMed] [Google Scholar]
- 30.Pieples K., Wieczorek D.F. Tropomyosin 3 increases striated muscle isoform diversity. Biochemistry. (2000);39:8291–8297. doi: 10.1021/bi000047x. [DOI] [PubMed] [Google Scholar]
- 31.Ren J.L., Pan J.S., Lu Y.P., Sun P., Han J. Inflammatory signaling and cellular senescence. Cell Signal. (2009);21:378–383. doi: 10.1016/j.cellsig.2008.10.011. [DOI] [PMC free article] [PubMed] [Google Scholar]
- 32.Rhim J.H., Jang I.S., Choi J.S., Kwon H.J., Yeo E.J., Park S.C. Time-dependent differential gene expression in lysophosphatidic acid-treated young and senescent human diploid fibroblasts. Mech. Ageing Dev. (2009);130:648–651. doi: 10.1016/j.mad.2009.06.007. [DOI] [PubMed] [Google Scholar]
- 33.Rodier F., Coppe J.P., Patil C.K., Hoeijmakers W.A., Munoz D.P., Raza S.R., Freund A., Campeau E., Davalos A.R., Campisi J. Persistent DNA damage signalling triggers senescenceassociated inflammatory cytokine secretion. Nat. Cell Biol. (2009);11:973–979. doi: 10.1038/ncb1909. [DOI] [PMC free article] [PubMed] [Google Scholar]
- 34.Ryu S.J., An H.J., Oh Y.S., Choi H.R., Ha M.K., Park S.C. On the role of major vault protein in the resistance of senescent human diploid fibroblasts to apoptosis. Cell Death Differ. (2008);15:1673–1680. doi: 10.1038/cdd.2008.96. [DOI] [PubMed] [Google Scholar]
- 35.Sell D.R., Monnier V.M. Structure elucidation of a senescence cross-link from human extracellular matrix. Implication of pentoses in the aging process. J. Biol. Chem. (1989);264:21597–21602. [PubMed] [Google Scholar]
- 36.Verzar F. Ageing of connective tissue. G. Gerontol. (1964);12:915–921. [PubMed] [Google Scholar]
- 37.Wienkoop S., Larrainzar E., Niemann M., Gonzalez E.M., Lehmann U., Weckwerth W. Stable isotope-free quantitative shotgun proteomics combined with sample pattern recognition for rapid diagnostics. J. Sep. Sci. (2006);29:2793–2801. doi: 10.1002/jssc.200600290. [DOI] [PubMed] [Google Scholar]
- 38.Yeo E.J., Hwang Y.C., Kang C.M., Choy H.E., Park S.C. Reduction of UV-induced cell death in the human senescent fibroblasts. Mol. Cells. (2000);10:415–422. [PubMed] [Google Scholar]
- 39.Yoshisue H., Hasegawa K. Effect of MMP/ADAM inhibitors on goblet cell hyperplasia in cultured human bronchial epithelial cells. Biosci. Biotechnol. Biochem. (2004);68:2024–2031. doi: 10.1271/bbb.68.2024. [DOI] [PubMed] [Google Scholar]
- 40.Zhao C.Q., Wang L.M., Jiang L.S., Dai L.Y. The cell biology of intervertebral disc aging and degeneration. Ageing Res. Rev. (2007);6:247–261. doi: 10.1016/j.arr.2007.08.001. [DOI] [PubMed] [Google Scholar]