

Abstract
Breast cancer is a clinically heterogeneous disease characterized by distinct molecular aberrations. Understanding the heterogeneity and identifying subgroups of breast cancer are essential to improving diagnoses and predicting therapeutic responses. In this paper, we propose a classification scheme for breast cancer which integrates data on differentially expressed genes (DEGs), copy number variations (CNVs) and microRNAs (miRNAs)-regulated mRNAs. Pathway information based on the estimation of molecular pathway activity is also applied as a postprocessor to optimize the classifier. A total of 250 malignant breast tumors were analyzed by k-means clustering based on the patterns of the expression profiles of 215 intrinsic genes, and the classification performances were compared with existing breast cancer classifiers including the BluePrint and the 625-gene classifier. We show that a classification scheme which incorporates pathway information with various genetic variations achieves better performance than classifiers based on the expression levels of individual genes, and propose that the identified signature serves as a basic tool for identifying rational therapeutic opportunities for breast cancer patients.
Keywords: breast cancer, classification, copy number variation, differentially expressed gene, microRNA, pathway
INTRODUCTION
Breast cancer is a clinically heterogeneous disease, so breast tumors which show a similar histology may entail markedly different prognoses and treatment responses (Henderson and Patek, 1998; Perou et al., 2000; van’t Veer et al., 2002). This clinical heterogeneity can be explained by molecular differences between tumors (Sørlie et al., 2001); as such, several promising techniques for coping with the problem of heterogeneity in breast cancer have been introduced (Ross et al., 2008). Recently, microarray-based gene expression profiling has been extensively used in the evaluation of breast cancer samples (Kim et al., 2012; Pusztai et al., 2007).
The precise definition of breast cancer subtypes is still a subject of debate (Sontrop et al., 2011). In a seminal study by Perou et al. (2000), a molecular taxonomy of breast cancers was introduced as luminal, HER2-enriched (ERBB2), basal and normal breast-like subtypes based on their intrinsic gene set. More recent studies, however, have suggested that the fourth subtype, i.e., the normal breast-like group, is a less clear subtype (Desmedt et al., 2008; Parker et al., 2009). Despite these debates, it is widely accepted that breast cancer subtypes are associated with differences in terms of prognosis and treatment response.
For a more reliable and precise classification of breast cancer tumors, which is important for the proper selection of therapy, several intrinsic gene sets have been introduced (Ross, 2009). BluePrint, a commercialized multi-gene predictor, was developed, enabling rationalization in patient selection for either chemotherapy or hormone therapy prescription (Krijgsman et al., 2011). More recently, another molecular subtyping profile based on 798 probe-sets was developed using 327 breast cancer patient specimens (Kao et al., 2011). These excellent studies adopted microarray-based analysis and selected marker genes by scoring each individual gene (Kao et al., 2011; Krijgsman et al., 2011).
In this study, we describe a pathway-based classification of breast cancer which integrates data on differentially expressed genes (DEGs), copy number variations (CNVs) and microRNA (miRNA)-regulated mRNAs. Abnormal gene expression in cancer cells may be due to genomic or epigenomic alterations such as CNVs and miRNAs. Therefore, these multidimensional approaches are needed to identify and refine cancer-related genes (Donahue et al., 2012; Taylor et al., 2010). Pathway information was incorporated in a condition-specific manner (Pathway Activity inference using Condition-responsive genes, PAC) (Chuang et al., 2007; Lee et al., 2008). In a training set of 327 tumors, a 215-gene signature, which is not encoded as individual genes, but rather as subnetworks within larger biological pathways, was identified. Finally, the classification performances of the gene signature were compared with those of BluePrint and Kao et al. (2011) using an independent data set (Dedeurwaerder et al., 2011; Lu et al., 2008; Richardson et al., 2006; Turashvili et al., 2007).
MATERIALS AND METHODS
Breast tumor samples
The 327 patient samples with clinical data (GSE20685) were used for identifying DEGs and training our classification model (Kao et al., 2011). The validation data set (n = 250), which was used for evaluating the classification performances of the classifiers, was also derived from four independent data sets (GSE3744, GSE5460, GSE5764, GSE20711) (Dedeurwaerder et al., 2011; Lu et al., 2008; Richardson et al., 2006; Turashvili et al., 2007). All samples were characterized by use of the Affymetrix Human Genome U133 Plus 2.0 array and normalized using the Robust Multi-array Average (RMA) method in R/BioConductor (http://www.bioconductor.org).
Identification of DEGs
The 866 candidate genes were selected from the literature and converted into Affymetrix probe identifiers using the DAVID GENE ID conversion tool. Centroids for each subtype were computed using the 327 training set. During cross-validation, we performed k-means clustering with the centroids and identified the probes that best discriminate between the four molecular subtypes. In each iteration of the cross-validation, an SD, which describes the difference for each probe over a series of samples, was increased by 0.1 and adopted that shows high prediction accuracy with a minimal set of genes (Fig. 2).
Fig. 2.

Breast cancer-related gene selections based on DEG analysis. A gene signature (646 genes, 1,340 probes) selected with an SD of 0.8 showed the highest accuracy, and was chosen for further analysis.
Identification of CNV-driven DEGs
The 516 breast invasive carcinoma samples containing clinical information with matched normal blood samples were downloaded from the TCGA. CNV and gene expression data across all samples were characterized by use of the Affymetrix SNP 6.0 array and Agilent 244K Custom Gene Expression G4502A-07-3 array, respectively. GISTIC analysis was then performed on the 516 CNV tumor data to identify any CNV regions that were significantly amplified or deleted.
Identification of putative miRNA target genes
The 22 data sets, which contain both 1,265 miRNA and 1,568 gene expression profiles, were collected from the GEO. Additional information related to the samples is available in Table S3. For the identification of miRNA-regulated mRNAs related in breast cancer, we calculated Pearson’s correlations for all combinations of miRNA-mRNA pairs over a series of samples in each data set and compiled co-expressed miRNA-mRNA pairs that show significant correlations. (For a description of the association analysis between miRNA-mRNA pairs in detail, please refer to Cho et al., 2011)
Incorporation of pathway information
A total of 225 control samples, which were used in the calculation of molecular pathway activity, were collected from seven independent data sets (GSE5764, GSE7904, GSE8977, GSE-10780, GSE10810, GSE15043, GSE17907) (Chen et al., 2010; Gu et al., 2009; Karnoub et al., 2007; Pedraza et al., 2010; Richardson et al., 2006; Sircoulomb et al., 2010; Turashvili et al., 2007). 1,340 pathway information were also downloaded from the Pathway Commons database. We integrated the expression and pathway data sets by overlaying the expression values of each gene on its corresponding protein in each pathway, and searched for subnetworks whose activities between tumors and controls were highly discriminative (Chuang et al., 2007; Lee et al., 2008).
RESULTS
Overview of a classification scheme for breast cancer
861 breast cancer-related genes were collected by integrating the results from three different genetic analyses, including the identification of DEGs, CNV-driven DEGs, and putative miRNA target genes (data not shown). Subsequently, unnecessary genes containing redundant information, which may lead to decreased classification performance, were sequentially eliminated by incorporating pathway information with different threshold values (Chuang et al., 2007; Lee et al., 2008). (See Fig. 1 for an overview of the analyses performed.) To derive the intrinsic gene list, a 327-tumor training set (GSE20685) with clinical data, which deposited in the Gene Expression Omnibus (GEO) (www.ncbi.nlm.gov/geo/) (Barrett et al., 2011), was used.
Fig. 1.

A schematic procedure for identifying a gene signature. (A) Identification of candidate genes associated with breast cancer. (B) Identification of subnetworks comprising breast cancer-related genes that have a discriminative power in the classification of breast tumors. (C) A gene signature enabling the molecular classification of breast tumors (see Supplementary Table S1).
Identification of differentially expressed genes (DEGs)
866 candidate genes, which had previously been adopted in the prognosis, grading and classification of breast cancers, were selected from the literature, and the mean expression value for each candidate gene in each subtype, called a centroid, was computed using the 327-tumor training set. For the development of optimized centroids, only those tumors which showed the highest correlation with each other within a given subtype were adopted for this calculation.
Subtype predictions were performed by using k-means clustering (Kaufmann and Rousseeu, 1990) with the calculated centroids. For the selection of probes with the most discriminating power, a standard deviation (SD) that describes the difference for each probe over a series of samples was calculated. During cross-validation, a SD was iteratively increased by 0.1, and a minimal set of probes that showed high prediction accuracy was chosen for the identification of DEGs. In this study, a 646-gene signature comprising 1,340 probes with an SD of 0.8 showed improved accuracy, with 82.42% for breast cancer subtyping compared to 866-gene signature comprising 2,373 probes with an SD of 0.0 (Fig. 2).
Identification of CNV-driven DEGs
516 breast invasive carcinoma samples, which contain both CNV and gene expression data, were obtained from The Cancer Genome Atlas (TCGA) (http://cancergenome.nih.gov) for the identification of CNV-driven DEGs. CNV frequency and amplitude were examined to determine the significance of CNVs using GISTIC analysis (Beroukhim et al., 2007), and 324 significant CNV regions comprising 327 genes were identified from the tumor samples. Among these significant CNV regions, chromosomal amplification (1q21.3, 6p21.3, 7p11.2, 8q24.3) and deletion (8q23.3, 11q22, 22q13) have been proposed as loci for breast cancer susceptibility genes (Hawthorn et al., 2010).
Subsequently, by calculating Pearson’s correlation between the DNA copy number and gene expression level, 73 CNV-driven genes, which differentially expressed between tumor and normal samples, were selected from the 327 candidate genes (see Supplementary Table S2). ERBB2, MYC, GSTT1, PIK3CA and CWF19L2, which have also been reported to be related to chances of developing breast cancer (Figueiredo et al., 2007; Loi et al., 2010; Nordgard et al., 2008; Oliveira et al., 2010; Qu et al., 2008), were included in the CNV-driven genes.
Identification of putative miRNA target genes
22 data sets, which contain both 1,265 miRNA and 1,568 gene expression profiles, were collected from the GEO (see Supplementary Table S3), and Pearson’s correlation for all combinations of miRNA-mRNA pairs over a series of samples in each data set were calculated. Accordingly, Pearson’s correlation coefficients were determined for all possible pairs between 685 miRNAs and 27,830 mRNAs, and 23 correlation values for each miRNA-mRNA pair were generated due to the GSE21032 data set that was run on two different platforms. The correlation coefficients were normalized by z-score transformation. We compiled co-expressed miRNA-mRNA pairs, which show significant negative-correlations or positive-correlations at cut off ≤ −1 or ≥ 1, respectively, and obtained 8,171 miRNA-mRNA pairs. Subsequently, for the identification of breast cancer-related miRNA-mRNA pairs, 38 breast cancer-related miRNAs were adopted from previous studies (Blenkiron et al., 2007). We predicted 264 mRNAs that highly co-expressed with the 38 miRNAs.
Pathway-based gene selection for breast cancer classification
For the selection of genes based on biological pathways (Fig. 1B), 1,340 pathway data were downloaded from the Pathway Commons database (released in October 2011) (www.pathwaycommons.org/pc/) (Cerami et al., 2011), and a pathway activity inference scheme was adopted with different p-values (Chuang et al., 2007; Lee et al., 2008). During the cross-validation of classification with different condition-responsive genes (CORGs), the 215-gene signature with a p-value of 0.01 showed the highest accuracy, with 94.8% for breast cancer classification (see Supplementary Table S1, Fig. 3).
Evaluation of classification performances (1)
An 80-gene molecular subtyping profile known as BluePrint was developed with consideration estrogen receptor (ER), progesterone receptor (PR), and HER2 status of the tumors and was designed to classify breast tumors into Basal-type, Luminal-type and ERBB2-type subgroups (Krijgsman et al., 2011). Figure 4 is a Venn diagram comparing the genes in BluePrint, the gene set used by Kao et al. (2011), and the genes present in our gene signature.
Fig. 4.

Comparison of genes in the three different classifiers. Vann diagram between three different classifiers: the 625-gene classifier (Kao et al., 2011), the BluePrint 80-gene classifier, and our own 215-gene classifier. Only nine genes overlap across the three classifiers.
Expression centroids for the 80 genes of BluePrint were calculated in the same manner as described above using the 327-tumor training set (Kao et al., 2011). For a direct comparison between BluePrint and the 215-gene classifier, an independent validation set comprising 250 malignant breast tumors (Dedeurwaerder et al., 2011; Lu et al., 2008; Richardson et al., 2006; Turashvili et al., 2007) was adopted and subtype predictions were performed by using k-means clustering with the calculated centroids. To guarantee a fair comparison between BluePrint and the 215-gene classifier under same conditions, the subdivision of luminal types into luminal-A and luminal-B was not considered for this evaluation (Krijgsman et al., 2011).
The performance results are summarized in Fig. 5, which shows the sensitivity and specificity of classification of each subtype. The overall prediction accuracy is also represented with two-dimensional multidimensional scaling (MDS) plotting. As described in Fig. 5, both classifiers clearly discriminated between basal and other subtypes, but in the discrimination between luminal and other subtypes, BluePrint was relatively less clear than the 215-gene classifier, with many of the luminal tumors clustering near basal or ERBB2 subtypes.
Fig. 5.

Comparison of classification performances between BluePrint and our classifier. (A) BluePrint. (B) Our 215-gene classifier. MDS plots of all 250 tumors were plotted in two-dimensional space and some plots overlapped. Color-coded shapes indicate tumor samples, as follows: red-diamond = ERBB2 subtype; black-circle = basal subtype; blue-diamond = luminal subtype.
Evaluation of classification performances (2)
A method of molecular classification based on the 783 probeset was established on the breast tumors of 327 patients (Kao et al., 2011). Non-redundant 625 gene names could be converted from 783 probe identifiers using the DAVID GENE ID conversion tool (Huang et al., 2008), and expression centroids for the 783 probes of the classifier were calculated using the same procedure described above. As shown in Fig. 6, there were no clear differences in the relative discriminatory ability of the 215-gene classifier and that of the 625-gene classifier. However, though less clear than the luminal/other subtypes distinction, there is significant discordance in the luminal-A/ luminal-B classification between these two classifiers.
Fig. 6.

Comparison of classification performances between Kao’s classifier and our classifier. (A) Kao’s 625-gene classifier. (B) Our 215-gene classifier. Color-coded shapes indicate tumor samples as follows: red-diamond = ERBB2 subtype; black-circle = basal subtype; blue-closed diamond = luminal-A subtype; blue-opened diamond = luminal-B subtype.
DISCUSSION
Previous clinical applications of molecular profiling-based prediction for the customization of breast cancer treatment were focused on predicting the likelihood of distant recurrence (Ross, 2009; Ross et al., 2008). Breast cancer is, however, a clinically heterogeneous disease so histologically similar tumors may entail different prognoses and responses to treatment (Rouzier et al., 2005). A promising solution for coping with the heterogeneity of breast cancers consists in identifying subgroups of patients who are most likely to respond to a given therapy. Recently, the molecular classification of breast cancer has been proposed based on gene expression profiles.
In this report, we describe the development and validation of a 215-gene classifier that classifies breast cancer tumors into Basal, Luminal-A, Luminal-B and ERBB2 subtypes. The classifier was developed by integrating the results from three different genetic analyses, including the identification of DEGs, CNV-driven DEGs and putative miRNA target genes. Integrated genetic variations can identify individually weak signals due to the heterogeneity of breast cancer. A pathway activity inference method based on CORGs was also adopted to optimize the molecular classifier. Grouping gene expression responses via functional linkages can eliminate potential redundancy of expression among genes associated with the same function.
During the process of integrating protein networks with cancer gene profiles, 215 genes which act coordinately in their subnetworks were identified and showed high discriminative power in the prediction of breast cancer subtypes. Among these discriminative subnetworks, a considerable number of subnet-works were identified as directly or indirectly related to the progression of breast cancers (see Supplementary Fig. S1). For instance, there is growing evidence to suggest that the downstream components of the Wnt signaling pathway, which regulates cell proliferation and differentiation, are activated in a significant proportion of breast tumors (Brown, 2001). Here, the downstream components of this pathway - including CTNNB1, APC, CCND1 and MYC - were also included as main components in the identified subnetworks and were up-regulated in the basal subtype (Smid et al., 2008). In another instance, several subnetworks, which are portions of the phosphoinositide-3 kinase (PI3K) pathway, were also identified. The PI3K pathway is one of the most important pathways in tumorigenesis, and downstream components activated by PI3CK mutation have a significant influence on cell growth, survival, proliferation and metabolism (Baselga, 2011). Eventually, the breast cancer classification scheme revealed those signature genes which have interactions with cancer hallmarks causing breast tumor heterogeneity.
We suggest that the integration of pathway information with various genetic data including DEGs, CNV-driven genes and miRNA-regulated mRNAs are effective in breast cancer classification. Moreover, correct classification of breast cancer patients on the basis of the gene signature may be a useful means of guiding adjuvant therapy in patients, thus reducing the rate of overtreatment.
Supplementary Material
Fig. 3.
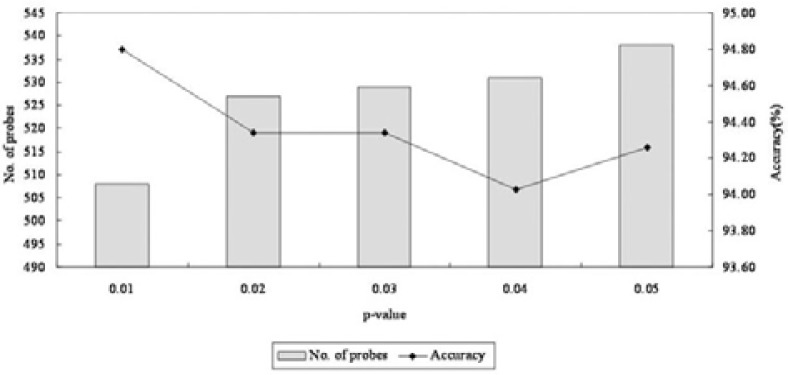
Estimation of classification performances with different CORGs. The gene signature (215 genes, 508 probes) selected with a p-value of 0.01 showed the highest accuracy and was chosen as marker genes.
Acknowledgments
This work was supported by the R&D program of MKE/KEIT (10040174, Multiple biomarker development through validation of useful markers generated by next generation bio-data based genome research).
Note:
Supplementary information is available on the Molecules and Cells website (www.molcells.org).
REFERENCES
- Barrett T., Troup D.B., Wilhite S.E., Ledoux P., Evangelista C., Kim I.F., Tomashevsky M., Marshall K.A., Phillippy K.H., Sherman P.M., et al. NCBI GEO: archive for functional genomics data sets-10 years on. Nucleic Acids Res. 2011;39:D1005–D1010. doi: 10.1093/nar/gkq1184. [DOI] [PMC free article] [PubMed] [Google Scholar]
- Baselga J. Targeting the phosphoinositide-3 (PI3) kinase pathway in breast cancer. Oncologist. 2011;16:12–19. doi: 10.1634/theoncologist.2011-S1-12. [DOI] [PubMed] [Google Scholar]
- Beroukhim R., Getz G., Nghiemphu L., Barretina J., Hsueh T., Linhart D., Vivanco I., Lee J.C., Huang J.H., Alexander A., et al. Assessing the significance of chromosomal aberrations in cancer: methodology and application to glioma. Proc. Natl. Acad. Sci USA. 2007;104:20007–20012. doi: 10.1073/pnas.0710052104. [DOI] [PMC free article] [PubMed] [Google Scholar]
- Blenkiron C., Goldstein L.D., Thorne N.P., Spiteri I., Chin S.F., Dunning M.J., Barbosa-Morais N.L., Teschendorff A.E., Green A.R., Ellis I.O., et al. MicroRNA expression profiling of human breast cancer identifies new markers of tumor subtype. Genome Biol. 2007;8:R214. doi: 10.1186/gb-2007-8-10-r214. [DOI] [PMC free article] [PubMed] [Google Scholar]
- Brown A.M. Wnt signaling in breast cancer: have we come full circle? Breast Cancer Res. 2001;3:351–355. doi: 10.1186/bcr321. [DOI] [PMC free article] [PubMed] [Google Scholar]
- Cerami E.G., Gross B.E., Demir E., Rodchenkov I., Babur O., Anwar N., Schultz N., Bader G.D., Sander C. Pathway Commons, a web resource for biological pathway data. Nucleic Acids Res. 2011;39:D685–D690. doi: 10.1093/nar/gkq1039. [DOI] [PMC free article] [PubMed] [Google Scholar]
- Chen D.T., Nasir A., Culhane A., Venkataramu C., Fulp W., Rubio R., Wang T., Agrawal D., McCarthy S.M., Gruidl M., et al. Proliferative genes dominate malignancy-risk gene signature in histologically-normal breast tissue. Breast Cancer Res. Treat. 2010;119:335–346. doi: 10.1007/s10549-009-0344-y. [DOI] [PMC free article] [PubMed] [Google Scholar]
- Cho S., Jun Y., Lee S., Choi H.S., Jung S., Jang Y., Park Kim S., Lee S., Kim W. miRGator v2.0 : an integrated system for functional investigation of microRNAs. Nucleic Acids Res. 2011;39:D158–162. doi: 10.1093/nar/gkq1094. [DOI] [PMC free article] [PubMed] [Google Scholar]
- Chuang H.Y., Lee E., Liu Y.T., Lee D., Ideker T. Network-based classification of breast cancer metastasis. Mol. Syst. Biol. 2007;3:140. doi: 10.1038/msb4100180. [DOI] [PMC free article] [PubMed] [Google Scholar]
- Dedeurwaerder S., Desmedt C., Calonne E., Singhal S.K., Haibe-Kains B., Defrance M., Michiels S., Volkmar M., Deplus R., Luciani J., et al. DNA methylation profiling reveals a predominant immune component in breast cancers. EMBO Mol. Med. 2011;3:726–741. doi: 10.1002/emmm.201100801. [DOI] [PMC free article] [PubMed] [Google Scholar]
- Desmedt C., Haibe-Kains B., Wirapati P., Buyse M., Larsimont D., Bontempi G., Delorenzi M., Piccart M., Sotiriou C. Biological processes associated with breast cancer clinical outcome depend on the molecular subtypes. Clin. Cancer Res. 2008;14:5158–5165. doi: 10.1158/1078-0432.CCR-07-4756. [DOI] [PubMed] [Google Scholar]
- Donahue T.R., Tran L.M., Hill R., Li Y., Kovochich A., Calvopina J.H., Patel S.G., Wu N., Hindoyan A., Farrell J.J., et al. Integrative survival-based molecular profiling of human pancreatic cancer. Clin. Cancer Res. 2012;18:1352–1363. doi: 10.1158/1078-0432.CCR-11-1539. [DOI] [PMC free article] [PubMed] [Google Scholar]
- Figueiredo J.C., Knight J.A., Cho S., Savas S., Onay U.V., Briollais L., Goodwin P.J., McLaughlin J.R., Andrulis I.L., Ozcelik H. Polymorphisms cMyc-N11S and p27-V109G and breast cancer risk and prognosis. BMC Cancer. 2007;7:99. doi: 10.1186/1471-2407-7-99. [DOI] [PMC free article] [PubMed] [Google Scholar]
- Gu L., Waliany S., Kane S.E. Darpp-32 and its truncated variant t-Darpp have antagonistic effects on breast cancer cell growth and herceptin resistance. PLoS One. 2009;4:e6220. doi: 10.1371/journal.pone.0006220. [DOI] [PMC free article] [PubMed] [Google Scholar]
- Hawthorn L., Luce J., Stein L., Rothschild J. Integration of transcript expression, copy number and LOH analysis of infiltrating ductal carcinoma of the breast. BMC Cancer. 2010;10:460. doi: 10.1186/1471-2407-10-460. [DOI] [PMC free article] [PubMed] [Google Scholar]
- Henderson I.C., Patek A.J. The relationship between prognostic and predictive factors in the management of breast cancer. Breast Cancer Res. Treat. 1998;52:261–288. doi: 10.1023/a:1006141703224. [DOI] [PubMed] [Google Scholar]
- Huang W., Sherman B.T., Stephens R., Baseler M.W., Lane H.C., Lempicki R.A. DAVID gene ID conversion tool. Bioinformation. 2008;2:428–430. doi: 10.6026/97320630002428. [DOI] [PMC free article] [PubMed] [Google Scholar]
- Kao K.J., Chang K.M., Hsu H.C., Huang A.T. Correlation of microarray-based breast cancer molecular subtypes and clinical outcomes: implications for treatment optimization. BMC Cancer. 2011;11:143. doi: 10.1186/1471-2407-11-143. [DOI] [PMC free article] [PubMed] [Google Scholar]
- Karnoub A.E., Dash A.B., Vo A.P., Sullivan A., Brooks M.W., Bell G.W., Richardson A.L., Polyak K., Tubo R., Wein-berg R.A. Mesenchymal stem cells within tumour stroma promote breast cancer metastasis. Nature. 2007;449:557–563. doi: 10.1038/nature06188. [DOI] [PubMed] [Google Scholar]
- Kaufmann L.A.R., Rousseeu P.J. Finding Groups in Data: An Introduction to Cluster Analysis. New York: Wiley Inc.; 1990. [Google Scholar]
- Kim J.H., Kang S., Kim T.W., Yin L., Liu R., Kim S.J. Expression profiling after induction of demethylation in MCF-7 breast cancer cells identifies involvement of TNF-α mediated cancer pathways. Mol Cells. 2012;33:127–133. doi: 10.1007/s10059-012-2182-8. [DOI] [PMC free article] [PubMed] [Google Scholar]
- Krijgsman O., Roepman P., Zwart W., Carroll J.S., Tian S., de Snoo F.A., Bender R.A., Bernards R., Glas A.M. A diagnostic gene profile for molecular subtyping of breast cancer associated with treatment response. Breast Cancer Res. Treat. 2012;133:37–47. doi: 10.1007/s10549-011-1683-z. [DOI] [PubMed] [Google Scholar]
- Lee E., Chuang H.Y., Kim J.W., Ideker T., Lee D. Inferring pathway activity toward precise disease classification. PLoS Comput. Biol. 2008;4:e1000217. doi: 10.1371/journal.pcbi.1000217. [DOI] [PMC free article] [PubMed] [Google Scholar]
- Loi S., Haibe-Kains B., Majjaj S., Lallemand F., Durbecq V., Larsimont D., Gonzalez-Angulo A.M., Pusztai L., Symmans W.F., Bardelli A., et al. PIK3CA mutations associated with gene signature of low mTORC1 signaling and better outcomes in estrogen receptor-positive breast cancer. Proc. Natl. Acad. Sci USA. 2010;107:10208–10213. doi: 10.1073/pnas.0907011107. [DOI] [PMC free article] [PubMed] [Google Scholar]
- Lu X., Lu X., Wang Z.C., Iglehart J.D., Zhang X., Richardson A.L. Predicting features of breast cancer with gene expression patterns. Breast Cancer Res. Treat. 2008;108:191–201. doi: 10.1007/s10549-007-9596-6. [DOI] [PubMed] [Google Scholar]
- Nordgard S.H., Johansen F.E., Alnaes G.I., Bucher E., Syvänen A.C., Naume B., Børresen-Dale A.L., Kristensen V.N. Genome-wide analysis identifies 16q deletion associated with survival, molecular subtypes, mRNA expression, and germ-line haplotypes in breast cancer patients. Genes Chromosomes Cancer. 2008;47:680–696. doi: 10.1002/gcc.20569. [DOI] [PubMed] [Google Scholar]
- Oliveira A.L., Rodrigues F.F., Santos R.E., Aoki T., Rocha M.N., Longui C.A., Melo M.B. GSTT1, GSTM1, and GSTP1 polymorphisms and chemotherapy response in locally advanced breast cancer. Genet. Mol. Res. 2010;9:1045–1053. doi: 10.4238/vol9-2gmr726. [DOI] [PubMed] [Google Scholar]
- Parker J.S., Mullins M., Cheang M.C., Leung S., Voduc D., Vickery T., Davies S., Fauron C., He X., Hu Z., et al. Supervised risk predictor of breast cancer based on intrinsic subtypes. J. Clin. Oncol. 2009;27:1160–1167. doi: 10.1200/JCO.2008.18.1370. [DOI] [PMC free article] [PubMed] [Google Scholar]
- Pedraza V., Gomez-Capilla J.A., Escaramis G., Gomez C., Torné P., Rivera J.M., Gil A., Araque P., Olea N., Estivill X., et al. Gene expression signatures in breast cancer distinguish phenotype characteristics, histologic subtypes, and tumor invasiveness. Cancer. 2010;116:486–496. doi: 10.1002/cncr.24805. [DOI] [PubMed] [Google Scholar]
- Perou C.M., Sørlie T., Eisen M.B., van de Rijn M., Jeffrey S.S., Rees C.A., Pollack J.R., Ross D.T., Johnsen H., Akslen L.A., et al. Molecular portraits of human breast tumours. Nature. 2000;406:747–752. doi: 10.1038/35021093. [DOI] [PubMed] [Google Scholar]
- Pusztai L., Cristofanilli M., Paik S. New generation of molecular prognostic and predictive tests for breast cancer. Semin. Oncol. 2007;34:S10–S16. doi: 10.1053/j.seminoncol.2007.03.015. [DOI] [PubMed] [Google Scholar]
- Qu S., Cai Q., Gao Y.T., Lu W., Cai H., Su Y., Wang S.E., Shu X.O., Zheng W. ERBB2 genetic polymorphism and breast cancer risk in Chinese women: a population-based case-control study. Breast Cancer Res. Treat. 2008;110:169–176. doi: 10.1007/s10549-007-9691-8. [DOI] [PMC free article] [PubMed] [Google Scholar]
- Richardson A.L., Wang Z.C., De Nicolo A., Lu X., Brown M., Miron A., Liao X., Iglehart J.D., Livingston D.M., Ganesan S. X chromosomal abnormalities in basal-like human breast cancer. Cancer Cell. 2006;9:121–132. doi: 10.1016/j.ccr.2006.01.013. [DOI] [PubMed] [Google Scholar]
- Ross J.S. Multigene classifiers, prognostic factors, and predictors of breast cancer clinical outcome. Adv. Anat. Pathol. 2009;16:204–215. doi: 10.1097/PAP.0b013e3181a9d4bf. [DOI] [PubMed] [Google Scholar]
- Ross J.S., Hatzis C., Symmans W.F., Pusztai L., Hortobágyi G.N. Commercialized multigene predictors of clinical outcome for breast cancer. Oncologist. 2008;13:477–493. doi: 10.1634/theoncologist.2007-0248. [DOI] [PubMed] [Google Scholar]
- Rouzier R., Perou C.M., Symmans W.F., Ibrahim N., Cristofanilli M., Anderson K., Hess K.R., Stec J., Ayers M., Wagner P., et al. Breast cancer molecular subtypes respond differently to preoperative chemotherapy. Clin. Cancer Res. 2005;11:5678–5685. doi: 10.1158/1078-0432.CCR-04-2421. [DOI] [PubMed] [Google Scholar]
- Sircoulomb F., Bekhouche I., Finetti P., Adélaïde J., Ben Hamida A., Bonansea J., Raynaud S., Innocenti C., Charafe-Jauffret E., Tarpin C., et al. Genome profiling of ERBB2-amplified breast cancers. BMC Cancer. 2010;10:539. doi: 10.1186/1471-2407-10-539. [DOI] [PMC free article] [PubMed] [Google Scholar]
- Smid M., Wang Y., Zhang Y., Sieuwerts A.M., Yu J., Klijn J.G., Foekens J.A., Martens J.W. Subtypes of breast cancer show preferential site of relapse. Cancer Res. 2008;68:3108–3114. doi: 10.1158/0008-5472.CAN-07-5644. [DOI] [PubMed] [Google Scholar]
- Sontrop H.M., Verhaegh W.F., Reinders M.J., Moerland P.D. An evaluation protocol for subtype-specific breast cancer event prediction. PLoS One. 2011;6:e21681. doi: 10.1371/journal.pone.0021681. [DOI] [PMC free article] [PubMed] [Google Scholar]
- Sørlie T., Perou C.M., Tibshirani R., Aas T., Geisler S., Johnsen H., Hastie T., Eisen M.B., van de Rijn M., Jeffrey S.S., et al. Gene expression patterns of breast carcinomas distinguish tumor subclasses with clinical implications. Proc. Natl. Acad. Sci USA. 2001;98:10869–10874. doi: 10.1073/pnas.191367098. [DOI] [PMC free article] [PubMed] [Google Scholar]
- Taylor B.S., Schultz N., Hieronymus H., Gopalan A., Xiao Y., Carver B.S., Arora V.K., Kaushik P., Cerami E., Reva B., et al. Integrative genomic profiling of human prostate cancer. Cancer Cell. 2010;18:11–22. doi: 10.1016/j.ccr.2010.05.026. [DOI] [PMC free article] [PubMed] [Google Scholar]
- Turashvili G., Bouchal J., Baumforth K., Wei W., Dziechciarkova M., Ehrmann J., Klein J., Fridman E., Skarda J., Srovnal J., et al. Novel markers for differentiation of lobular and ductal invasive breast carcinomas by laser microdissection and microarray analysis. BMC Cancer. 2007;27:55. doi: 10.1186/1471-2407-7-55. [DOI] [PMC free article] [PubMed] [Google Scholar]
- van’t Veer L.J., Dai H., van de Vijver M.J., He Y.D., Hart A.A., Mao M., Peterse H.L., van der Kooy K., Marton M.J., Witteveen A.T., et al. Gene expression profiling predicts clinical outcome of breast cancer. Nature. 2002;415:530–536. doi: 10.1038/415530a. [DOI] [PubMed] [Google Scholar]
Associated Data
This section collects any data citations, data availability statements, or supplementary materials included in this article.