Abstract
Many solid tumor cells exhibit mitochondrial respiratory impairment; however, the mechanisms of such impairment in cancer development remain unclear. Here, we demonstrate that SNU human hepatoma cells with declined mitochondrial respiratory activity showed decreased expression of mitochondrial 8-oxoguanine DNA glycosylase/lyase (mtOGG1), a mitochondrial DNA repair enzyme; similar results were obtained with human hepatocellular carcinoma tissues. Among several OGG1-2 variants with a mitochondrial- targeting sequence (OGG1-2a, -2b, -2c, -2d, and -2e), OGG1-2a was the major mitochondrial isoform in all examined hepatoma cells. Interestingly, hepatoma cells with low mtOGG1 levels showed delayed cell growth and increased intracellular reactive oxygen species (ROS) levels. Knockdown of OGG1-2 isoforms in Chang-L cells, which have active mitochondrial respiration with high mtOGG1 levels, significantly decreased cellular respiration and cell growth, and increased intracellular ROS. Overexpression of OGG1-2a in SNU423 cells, which have low mtOGG1 levels, effectively recovered cellular respiration and cell growth activities, and decreased intracellular ROS. Taken together, our results suggest that mtOGG1 plays an important role in maintaining mitochondrial respiration, thereby contributing to cell growth of hepatoma cells.
Keywords: cell growth, hepatocellular carcinoma, mitochondrial defects, mtOGG1, reactive oxygen species
INTRODUCTION
Mitochondria are essential organelles for aerobic ATP production through mitochondrial oxidative phosphorylation (OXPHOS), which is accomplished by five membrane-anchored complexes, called complex I, II, III, IV, and V. Each OXPHOS complex comprises several subunits that are encoded by either nuclear DNA (ncDNA) or mitochondrial DNA (mtDNA). Properly balanced synthesis and well-coordinated assembly of these subunits are important to maintain OXPHOS activity (Smeitink et al., 2001; Wallace, 2012).
Human mtDNA is circular and remarkably small (16,569 bp) compared with the linear ncDNA (approximately 109 bp) (Anderson et al., 1981; Gardiner, 1995). Only 13 proteins are encoded from mtDNA and they all are OXPHOS subunits, implying that the existence of mtDNA is directly linked to cellular ATP production. Apart from the 13 protein-coding regions, mtDNA also contains the mtDNA replication origin, transfer RNA, and ribosomal RNA, which are essential for mtDNA replication and translation of the 13 proteins (DiMauro and Schon, 2003; Scarpulla, 2008; Taanman, 1999). Therefore, defective mutations in mtDNA can affect OXPHOS activity directly, by generating mutant OXPHOS subunits, or indirectly, by modulating mitochondria biogenesis.
Since Warburg’s pioneer research establishing mitochondrial respiratory dysfunction in the context of cancer (Warburg, 1956), many solid tumor cells have been characterized as exhibiting impaired mitochondrial respiratory capacity (Cuezva et al., 2002; Dang and Semenza, 1999; Pedersen, 1978). mtDNA damage, such as deletion and point mutations, has also been reported in many types of cancer (Brandon et al., 2006; Chatterjee et al., 2006; Czarnecka et al., 2010; Nishikawa et al., 2001; Petros et al., 2005). There several possible explanations have been suggested for the accumulation of mtDNA damage in cancer and other age-related diseases, including that mtDNA is highly vulnerable to oxidative damage due to its naked structure without histones, and that mitochondria do not possess sufficient DNA repair systems (Linnane et al., 1989; Shigenaga et al., 1994). However, it is unclear whether an insufficient mitochondrial repair system is truly linked with tumor-associated mitochondrial impairment. In the present study, we demonstrate that mtOGG1, a mitochondrial DNA repair enzyme, is linked with maintenance of cellular respiratory function and growth activity of hepatoma cells.
MATERIALS AND METHODS
Cell cultures, cell growth rate and tumor samples
Human hepatoma cells (SNU-354, SNU-387, and SNU-423) were purchased from Korean Cell Line Bank (Korea) and were cultured in GIBCO® RPMI1640 medium (Invitrogen, USA) supplemented with 10% GIBCO® fetal bovine serum (FBS) (Invitrogen) and GIBCO® antibiotics (Invitrogen) at 37°C in a humidified incubator with 5% CO2. Chang cell was obtained from American Tissue Culture Collections (ATCC, USA) and Chang cell clone, denoted as Chang-L, which has higher hepatic characteristics (albumin production and liver-specific carbamoylphosphate synthase-1 expression) were isolated by single cell dilution and expansion, and used for this study (Kim et al., 2011). Chang-L clones were cultured in GIBCO® Dulbecco’s modified Eagle’s medium (DMEM) (Invitrogen) supplemented with 10% GIBCO® fetal bovine serum (FBS). Cell growth rates were monitored by counting the trypan blue-negative viable cells.
HCC tumor samples and surrounding control tissues were obtained from 6 patients with hepatocellular carcinoma during the period of 2003 to 2005 at Ajou University Hospital after surgical resection with informed consent through Ajou Institutional Review Board. No patient in the current study received chemotherapy or radiation therapy before the surgery.
Reverse transcription-polymerase chain reaction (RT-PCR)
Total RNA was isolated using Trizol (Invitrogen) and cDNA was prepared using avian myeloblastosis virus (AMV) reverse transcriptase (Promega, USA). PCR was performed with 25–30 cycles of the reaction involving 95°C for 30 s, 55–62°C for 30 s, and 72°C for 60–90 s. The PCR primer sets were produced by Bioneer (Korea) to detect all variants of OGG1-1 (5′-CTGC TGCGACAAGAC-3′and 5′-GTCGGCACTGAACAGCAC-3′) and all variants of OGG1-2 (5′-CTGCTGCGACAAGAC-3′ and 5′-GTGCTAGTAAGCTGGCTTG-3′), and to detect OGG1-2a (mtOGG1, 5′-GACTGCATCTGCCTGATG-3′ and 5′-GTGC TAGTAAGCTGGCTTG-3′) and β-actin (5′-CCTTCCTGGGCA TGGAGTCCTGT-3′ and 5′-GGAGCAATGATCTTGATCTTC-3′).
Construction of mtOGG1 cDNA plasmids and transfection of cDNA plasmids and siRNAs
To generate a cDNA plasmid, pcDNA-mtOGG1-HA, conventional cloning procedures were applied. Briefly, pcDNA-mtOGG1- HA plasmid was constructed by TA cloning into pGEMT-easy (Promega) with mtOGG1 cDNA fragment amplified by PCR using total Chang-L cell cDNAs and the primer set (5′-TAGA ATTCACCATGCCTGCCCGCGCGC and 5′-TAAAGATCTAA GTGCTAGTAAGCTGGC). The mtOGG1 cDNA was inserted into EcoRI and BglII sites of the pcDNA3-HA vector previously constructed (Seo et al., 2008).
To introduce plasmids and small interfering RNAs (siRNAs) into cells, cells were transfected with the plasmids and siRNA duplexes using FuGENE HD (Roche Diagnostics, USA) and Oligofectamine™ Reagent (Invitrogen), respectively, according to the manufacturer’s instructions. To generate mtOGG1 stable cell line, transiently transfected Chang-L cells were selected in complete medium supplemented with 960 μg/ml G418 (Invitrogen) for 2 weeks. mtOGG1 siRNAs (#3, 5′-UGCAUUUGAU GGCCACCAG-3′ and 5′-CUGGUGGCCAUCAAAUGCA-3′; #4, 5′-GCGGGCCUCCUUGGCAAUG-3′ and 5′-CAUUGCCAAGG AGGCCCGC-3′) were obtained from Samchully Pharm. Co. (Korea). Negative control siRNAs (5′-CCUACGCCACCAAUU UCGU-3′ and 5′-ACGAAAUUGGUGGCGUAGG-3′) were obtained from Bioneer.
Endogenous cellular oxygen consumption rate
Endogenous cellular oxygen consumption rate (OCR) was measured by using Mitocell equipped with Clark oxygen electrode (782 Oxygen Meter, Strathkelvin Instrument, UK) or XF24 Extracellular Flux Analyzer (Seahorse Bioscience, USA) according to the protocol provided. Measurement of endogenous cellular respiration with Mitocell was performed as described previously with slight modification (Villani and Attardi, 2001; Yoon et al., 2003). Briefly, at indicated times, cells were washed with TD buffer (0.137 M NaCl, 5 mM KCl, 0.7 mM Na2HPO4, 25 mM Tris-HCl, pH 7.4), and collected by trypsinization. After resuspending the cells in medium without phenol red, the cells were transferred to the chamber of Mitocell equipped with Clark oxygen electrode (782 Oxygen Meter, Strathkelvin Instrument) for measurement of endogenous cellular O2 consumption rate.
OCR was also measured in situ with cultured cells using XF24 Extracellular Flux Analyzer (Seahorse Bioscience) according to the protocol provided. Briefly, cells were seeded on XF24 cell culture microplates (Seahorse Bioscience) at a density of 10,000 cells per well and preincubated with XF assay medium (Seahorse Bioscience) containing 1 mM pyruvate and 5 mM glucose. Its mitochondrial specificity was confirmed by adding 5 mM KCN.
Estimation of intracellular and mitochondrial ROS level
To determine intracellular and mitochondrial ROS levels, dichlorofluorescin diacetate (DCFH-DA) (Molecular probe, USA) and mitochondrial specific MitoSOX® (Invitrogen) fluorogenic probes were used, respectively (Yu and Kim, 2011). Briefly, cells were incubated in media containing 20 μM DCFH-DA (20 μM) and MitoSOX® (25 μM) for 20 min at 37°C. Stained cells were washed and resuspended in PBS, and analyzed by flow cytometry (FACS Vantage, Becton Dickinson Corp.). Mean values of arbitrary fluorescence units of 10,000 cells were used and expressed as percentage of negative control.
Subcellular fractionation
The nuclear, mitochondrial and cytosolic fractions were obtained from 90% confluent of 100 mm tissue culture dishes as described previously with slight modification (Byun et al., 2012). Briefly, cells were harvested by trypsinization and resuspended in medium A (250 mM sucrose, 0.1 mM EDTA, 2 mM HEPES, pH 7.4). The cell slurry was homogenized in a Dounce homogenizer (StedFast™ Stirrer, Fisher Scientific, USA), followed by spin at 500 rcf for 10 min to precipitate nuclei. The nuclei pellets were washed three times with buffer A (0.1 mM EDTA, 10 mM KCl, 10 mM HEPES, pH 7.9) containing 1% NP-40 and the final pellets were collected for nuclei fraction. The supernatant obtained after the first centrifugation at 500 rcf was further centrifuged at 7,000 rcf for 10 min. The supernatant (crude cytosolic fraction) and the pellet (mitochondrial fraction) were collected. Nuclei and mitochondrial fractions were subjected to lysis in RIPA buffer (150 mM NaCl, 1% NP-40, 0.5% Sodium deoxycholate, 0.1% Sodium dodecyl sulfate, and 50 mM Tris, pH 8.0) for Western blot analysis.
Total genomic DNA isolation and sequencing of mitochondrial DNA fragments
Total genomic DNA was isolated as described previously with slight modification (Yoon et al., 2006). Briefly, cell lysates were incubated at 37°C for 1 h with 0.1 mg/ml RNase A, and then at 55°C for 3 h with 0.1 mg/ml Proteinase K and 1% SDS. Phenol/chloroform/isoamyl alchol were treated for several times. Genomic DNA (gDNA) was precipitated by addition of a 2.5 volume of absolute ethanol and 1/10 volume of 3 M sodium acetate (pH 5.2), pelleted by centrifugation at 13,000 rpm for 20 min, and dissolved in 100 μl of TE buffer (10 mM Tris, 1 mM EDTA, pH 8.0).
To investigate mtDNA mutation, the isolated gDNA was subjected to PCR with the primer sets for ND2 (5′-AGGTTACCC AAGGCACCCCT-3′, 5′-AGTAGATTAGGCGTAGGTAG-3′), ND4 (5′-ACGACGCAGGCACATACT-3′, 5′-GTGGTGGGTGAGTGA- 3′), COX2 (5′-TGCCCTTTTCCTAACACTCAC-3′, 5′-GGTTTG CTCCACAGATTTCAG-3′), and some of tRNA regions (5′- CTTACCACGCTACTCCTACCT-3′, 5′-TTAGGTCTACGGAGG CTCCAG-3′). PCR products were purified by gel extraction kit (GeneAll Biotechnology, Korea) and sequenced (SolGent Co., Korea). The sequences were compared with the revised Cambridge reference sequence (NC_012920) (Andrews et al., 1999).
Southern blot analysis of mtDNA
Total gDNA was digested with restriction enzyme Nhe I (New England Biolabs, USA). Southern hybridization was performed with following a manual instruction (Roche Diagnostics). The digested DNA was electrophoresed in 0.8% agarose gels, and the gel was blotted onto Nylon Membranes (Roche Diagnostics), followed by fixation of the blotted DNA by baking. A digoxigenin (Dig)-labelled probe (ND2 probe) was then hybridized to the blotted membranes at 42°C in DIG Easy Hyb (Roche Diagnostics) on overnight, and the membrane was washed with 0.1 × SSC (1.5 mM NaCl, 1.5 mM sodium citrate buffer (pH 7.0) and 0.1% SDS for a few times. The dig-labelled ND2 probe was visualized with using chemiluminescent substrate CDP-Star (Roche Diagnostics).
Western blot analysis
Western blotting was performed using standard procedures. Antibodies against mtOGG1 (NB100-163) and OGG1 (NB100-106) were purchased from Novus Biologicals (Littleton, CO). Antibodies against hemagglutinin (HA, 2367), β-actin (A 5060) and GAPDH (LF-PA0018) were obtained from Cell Signaling Technology, Inc (USA), Sigma-Aldrich (USA) and Lab frontier (Seoul, Korea), respectively. Antibodies for α-tubulin (CP-06), VDAC (PC548) and lamin B (NA12) were purchased from Calbiochem (USA). PCNA antibody was from Leica Biosystem (UK). Antibodies against for NDUFA9 of complex I (A21344), flavoprotein (A11142) of complex II, UQCRC2 of complex III (A11143), and ATP5A1 of complex V (A21350) were from Molecular Probes Corp. (USA) and labeled as Comp I, II, III, IV, and V, respectively, in the figures.
RESULTS
Decreased mtOGG1 expression is associated with mitochondrial dysfunction in hepatoma cells and tissues
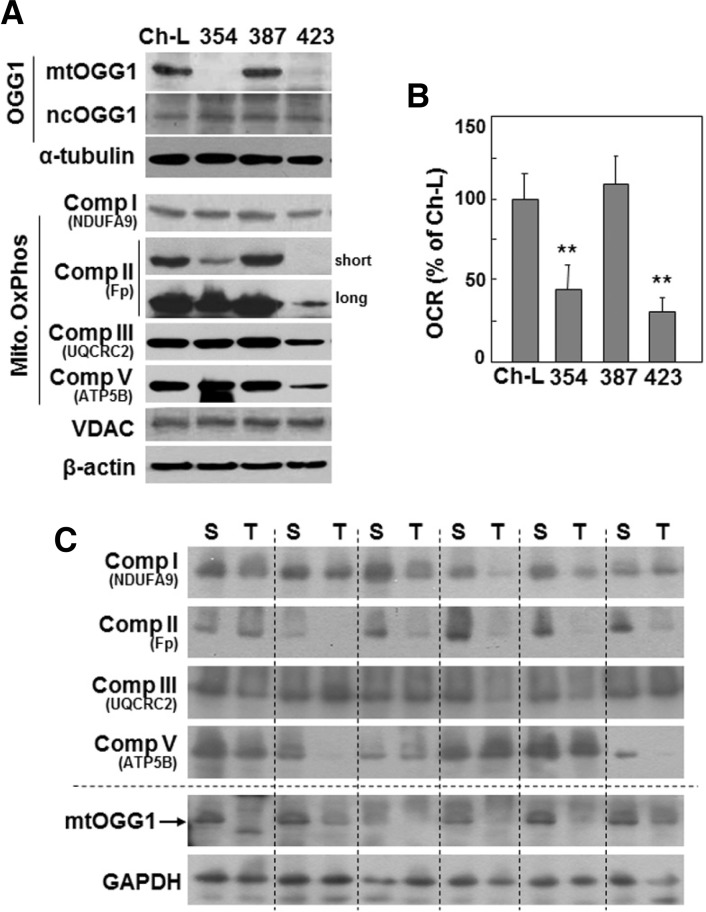
We previously classified hepatoma cells as being either active or defective in mitochondrial respiration (Kim et al., 2011). Here, we investigated the relationship between mitochondrial dysfunction and the mtDNA repair system. We first examined the expression levels of mitochondrial 8-oxoguanine DNA glycosylase/lyase (mtOGG1) in three types of SNU hepatoma cells (SNU-354, SNU-387, and SNU-423) derived from human hepatocellular carcinomas (Ku and Park, 2005; Park et al., 1995), and compared these levels to those of Chang-L clone, which was derived from Chang cell and were previously characterized as having certain liver-characteristics and active mitochondrial respiration (Kim et al., 2011). Interestingly, SNU354 and SNU423 cells, which have defective mitochondrial respiration, showed decreased mtOGG1 expression and unchanged nuclear OGG1 expression (Figs. 1A and 1B). In all four cells mitochondrial mass showed similar level, as evidenced by VDAC protein expression level (Fig. 1A). We also examined mtOGG1 expressions in six human HCC tumor tissue samples, and found decreased mtOGG1 expressions in the tumor tissues with decreased expressions of respiratory proteins (Fig. 1C).
Fig. 1.
Mitochondrial respiratory defects may be associated with decreased mtOGG1 expression. (A, B) Chang- L cells (Ch-L) and four different SNU hepatoma cell lines (SNU354, SNU387, SNU423) were cultured for 2 days to maintain exponentially growing state. (A) Cell lysates were subjected to Western blot analysis. (B) Cellular oxygen consumption rate (OCR) was measured using XF analyzer as described in “Materials and Methods”. **, < 0.01 vs. Chang-L. (C) Six human HCC tumor samples (T) and their surrounding tissues (S) were applied to Western blot analysis.
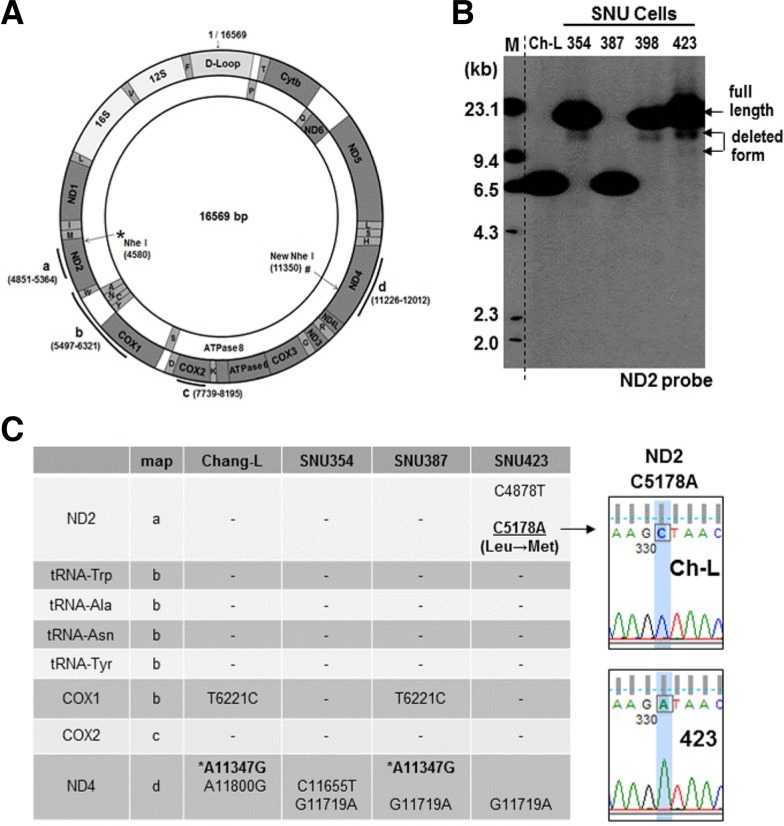
Next, we investigated whether the mitochondrial dysfunctions of SNU354 and SNU423 cells were related to mtDNA damage. We performed Southern blot analysis to monitor mtDNA integrity with an mtDNA-specific probe (dotted line of Fig. 2A). Genomic DNA was cut with the NheI restriction enzyme, which is known to be a unique site in mtDNA. We clearly observed deleted forms of mtDNA in SNU354, SNU398, and SNU423 cells (Fig. 2B). We also found mtDNA of an unexpectedly small size (around 6.7 kb) in Chang-L and SNU387 cells; mtDNA sequencing analysis revealed a silent mutation (A11347G) in Chang-L and SNU387 cells, resulting in an additional NheI site (# in Figs. 2A and 2C). Further examination of the sequences of additional mtDNA regions revealed a missense mutation (C5178A; Leu → Met) in SNU423, and several silent mutations that were detected in all cells (Fig. 2C). It is not clear whether these silent mutations are polymorphisms. Taken together, these results suggest that the mitochondrial respiratory defects of the two SNU hepatoma cell types may be linked to mtDNA damage and decreased mtOGG1 expression.
Fig. 2.
Decreased mtOGG1 expression occurs with mtDNA damage. (A) Schematic diagram of mtDNA. Bold lines with alphabets indicate the regions sequenced. Dotted line indicates the site for ND2 probe used for Southern blot analysis. * is the unique Nhe I site and # indicates the newly found Nhe I site in Chang-L and SNU387 cells. (B) Total genomic DNA was subjected to Southern blot analysis as described in “Materials and Methods” and integrity of mtDNA was detected with a mtDNA-specific probe which was generated against ND2 region (4851–5364 of mtDNA). (C) Several regions [bold lines a, b, c and d of (A)] of mtDNA were amplified and sequenced to examine mutation of mtDNA. Right panel comparison of representative sequence profiles between Chang-L and SNU423.
OGG1-2a is the major mitochondrial-targeting OGG1 in Chang-L and hepatoma cells
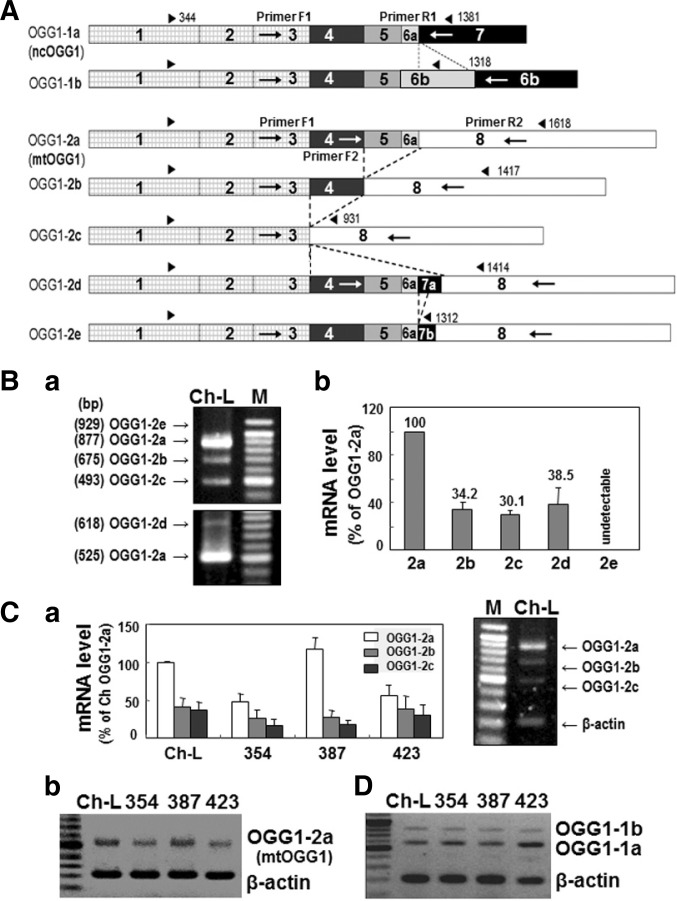
There are two OGG1 isoforms, OGG1-1 and OGG1-2, which differ based on their splicing pattern(Boiteux and Radicella, 2000; Nishioka et al., 1999), with splicing variants of OGG1-1 ending with exon 7 and those of OGG1-2 ending with exon 8 (Fig. 3A). The major variants spliced from OGG1-1 are OGG1- 1a and OGG 1-1b, whereas OGG1-2a, OGG1-2b, OGG1-2c, OGG1-2d, and OGG1-2e are generated from OGG1-2 (Fig. 3A and Supplementary S1). Among these major variants, only OGG1-1a has a protein structure with both mitochondrial-targeting and nuclear-targeting signals and is known to target to and play a role in the nucleus (Boiteux and Radicella, 2000). All OGG1-2 isoforms have an N-terminal mitochondrial-targeting signal (Supplementary Fig. S1), suggesting their potential mitochondrial localization. Here, we examined which variant was the major mitochondrial-targeting OGG1.
Fig. 3.
Decreased expression of mtOGG1 is mainly due to decreased OGG1-2a mRNA expression. (A) Schematic cDNA structure of OGG1 variants which were generated by alternative splicing. Each box represents exons and dotted lines indicate alternatively spliced joining between OGG1 variants. Blunted arrow pairs on the top of each cDNA structure indicate coding regions. Arrows on the box represent primer positions used for RTPCR. (B) Expression levels (a) of mRNAs of OGG1-2 isoforms in Chang-L cells were examined by RT-PCR with F1/R2 primer sets (upper panel) and F2/R2 primer sets (lower panel). Quantifications of the bands are shown (b). (C) Total mRNAs were isolated from Chang-L and SNU hepatoma cells and subjected to RT-PCR using F1/R2 primer set and primer set for β-actin and mRNA levels of three OGG1-2 (mtOGG1) isoforms were quantitated (a). Right panel shows a representative RT-PCR result. OGG1-2a mRNA levels of Chang- L and SNU hepatoma cells were compared by RTPCR with F2/R2 primer sets (b). (D) mRNA levels of OGG1-1 (ncOGG1) isoforms were detected by RT-PCR using F1/R1 primer set.
Using RT-PCR with isoform-specific primers, we monitored the mRNA expression levels of all major OGG1-1 and OGG1-2 variants in Chang-L cells (Fig. 3A), and found OGG1-2a to be the major mitochondrial-targeting OGG1 (mtOGG1) (Fig. 3B). Furthermore, OGG1-2a mRNA expression was decreased in SNU354 and SNU423 cells (Fig. 3C), implying that decreased mtOGG1 protein expression was mainly due to lower mRNA levels. Of the two OGG1-1 isoforms, OGG1-1a (ncOGG1) was the major variant, but its expression level did not change in any of the cells examined (Fig. 3D).
mtOGG1 suppression decreases mitochondrial respiration and cell growth rate, and increases intracellular ROS level
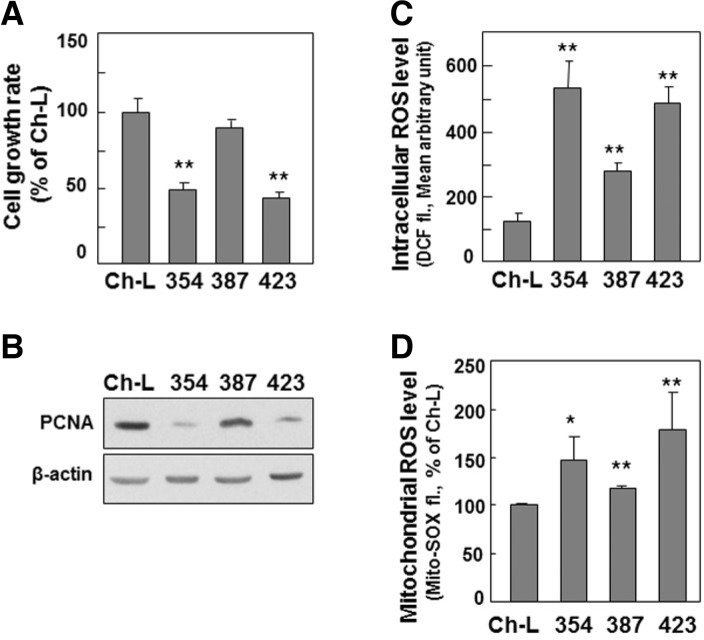
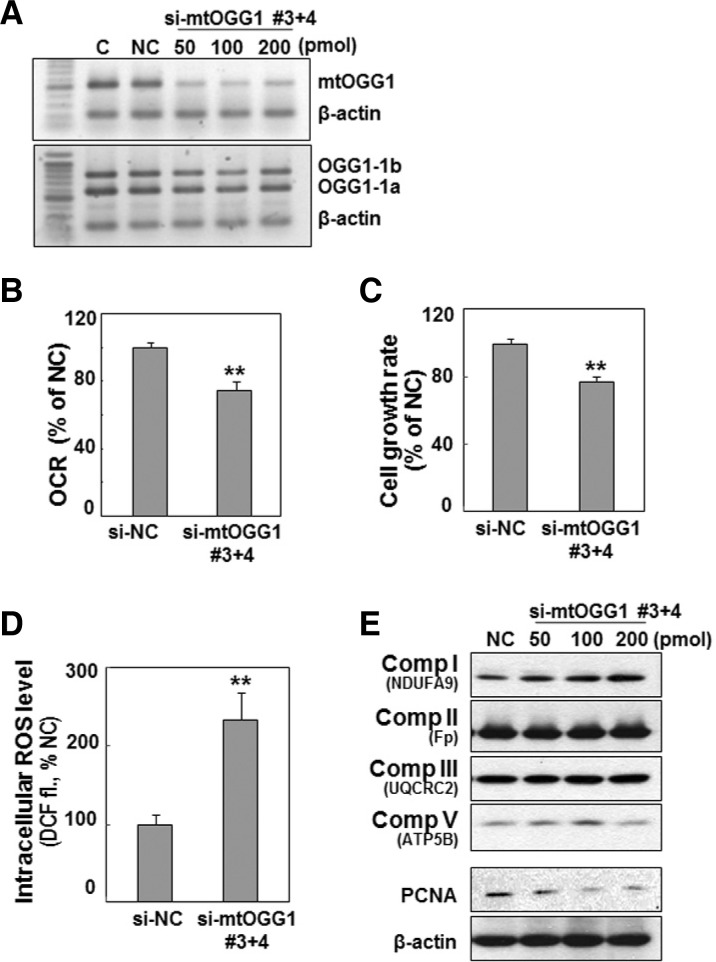
The SNU cells with mitochondrial dysfunction also showed a decreased cell growth rate and increased intracellular ROS level (Figs. 4A and 4C), implying that the mtOGG1-mediated mitochondrial defect may be linked with these two phenomena. Decreased cell growth rate was related to decreased cell proliferation, as evidenced by decreased protein expression of PCNA, a DNA replication marker (Fig. 4B). We also found increase in mitochondrial ROS level (Fig. 4D). This result suggests that increased intracellular ROS is mainly due to mitochondrial ROS generation. Therefore, we investigated whether decreased mtOGG1 was truly linked with deficient mitochondrial respiration, delayed cell growth, and increased ROS. We suppressed mtOGG1 expression in Chang-L cells by knockdown of OGG1-2 isoforms using siRNAs (Supplementary Fig. S2), which led to clearly decreased mitochondrial respiration and cellular growth, and increased intracellular ROS (Fig. 5 and Supplementary S3). However, there were no significant changes in the protein expressions of the examined respiratory complexes (Fig. 5E and Supplementary S3D).
Fig. 4.
Decreased mtOGG1 expression-associated mitochondrial dysfunction may also be associated to delayed cell growth and increased intracellular ROS. Chang-L cells (Ch-L) and four different SNU hepatoma cell lines (SNU354, SNU387, SNU423) were cultured for 2 days to maintain exponentially growing state. (A) Cell growth rates were measured by counting trypan blue positive cells. No clear dead cells were observed. (B) Western blot analysis. (C) Intracellular ROS levels were monitored by flow cytometric analysis after staining cells with DCFH-DA. (D) Mitochondrial ROS levels were monitored by flow cytometric analysis after staining cells with MitoSOX fluorescence dye. **, < 0.01 vs. Chang-L cell.
Fig. 5.
Knockdown of mtOGG1 expression decreases cellular respiration and cell growth. Chang-L cell was treated with the indicated amounts of siRNAs for OGG1-2a for 48 h. (A) mRNA levels were monitored by RT-PCR with the F1/R2 primer set (shown in Fig. 3A). (B) Cellular oxygen consumption rates were measured using Mitocell respirometer as described in “Materials and Methods”. (C) Cell growth rates were monitored by counting trypan blue positive cells. No clear dead cells were observed. (D) Intracellular ROS levels. (E) Western blot analysis. **, < 0.01 vs. negative control siRNA (si-NC).
mtOGG1 overexpression recovered mitochondrial respiration and cell growth rate, and decreased intracellular ROS level in SNU423 cells
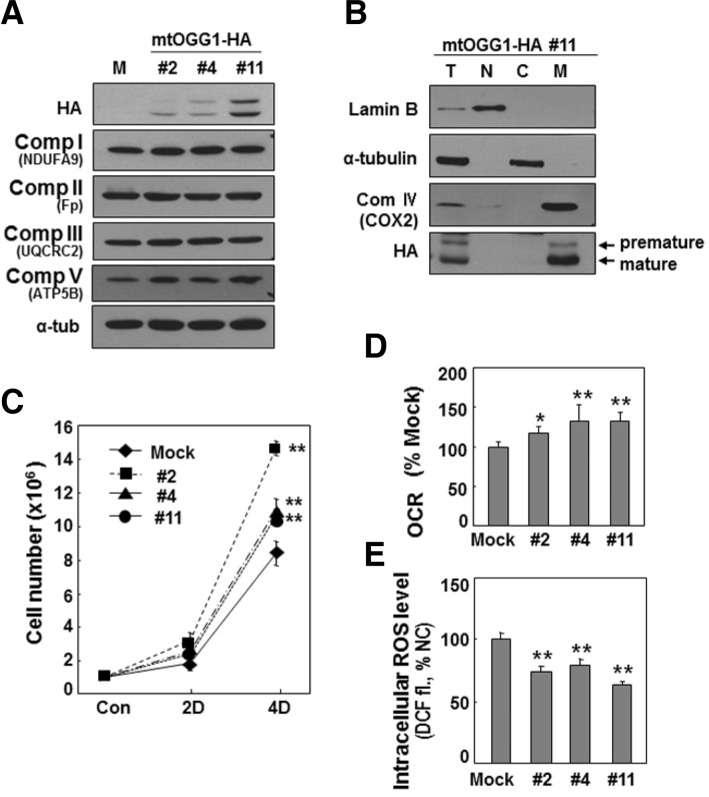
Finally, we tested whether mtOGG1 overexpression could reverse all of the mitochondrial dysfunction-related phenomena. We overexpressed OGG1-2a (mtOGG1) in SNU423 cells, which have an mtDNA missense mutation. Most overexpressed mtOGG1 was nicely targeted into the mitochondria of SNU423 cells (Figs. 6A and 6B), resulting in recovery of mitochondrial respiration and cellular growth rate, and decreased intracellular ROS level (Figs. 6C–6E). Unexpectedly, the extent of exogenous mtOGG1 expression level was not well correlated with the functional recovery. When we overexpressed mtOGG1 in SNU423 cells, low expressed cell line has mostly mature (mitochondrially targeted) mtOGG1 whereas higher expressed cell lines has more premature mtOGG1 which may be located in cytosol. Therefore, one possible explanation for the discrepancy between the ectopic expression level and the functional recovery is that well-processed mtOGG1 expression is required and excess or unprocessed proteins may play a negative role. On the other hands, SNU423 cells may have some defects in mitochondrial targeting process, thereby resulting in insufficient targeting of exogenously expressed mitochondrial protein. To explain this unexpected discrepancy, further detailed studies should be addressed.
Fig. 6.
Overexpression of mtOGG1 recovers cellular respiration and cell growth. OGG1-2a (mtOGG1) was stably expressed in SNU423 that has low level of mtOGG1 and a missense mutation on mtDNA. Three clones with different expression levels of mtOGG1 were selected. (A) Western blot analysis. To detect complex II flavoprotein (Fp), more sensitive antibody (#MS204, Mitoscience, USA) was used. (B) Total cell homogenates of mtOGG1 clone #11 was subjected to subcellular fractionation. Lamin B (nucleus), α-tubulin (cytosol) and COX2 (mitochondria) proteins were used as organellar markers (T, total; N, nuclear; C, cytosol; and M, mitochondria). (C) Cellular oxygen consumption rate were monitored using Mitocell respirometer. (D) Cell growth rates were measured by counting trypan blue positive cells. No clear dead cells were observed. (E) Intracellular ROS levels with DCFH-DA staining. **, < 0.01; *, < 0.05 vs. mock.
In addition, overexpression of mtOGG1 in SNU354 cells, which have a deleted form of mtDNA, did not lead to recovery of these phenomena (data not shown). This result implies that SNU354 may have additional mitochondrial damage which is not related to mtOGG1 suppression, and supports our prediction that the respiratory defect of SNU423 cells may be linked to mtOGG1-mediated mtDNA mutation. Taken together, our present results suggest that mtOGG1 suppression is an important event controlling cancer cell growth, which is linked with defects in mitochondrial respiration.
DISCUSSION
Alterations of mtDNA have long been implicated in aging and diverse human diseases, including cancer (Cortopassi and Wang, 1995; Mao et al., 2006; Pavicic and Richard, 2009). These alterations have been explained as resulting from the mtDNA’s high susceptibility to oxidative damage and from insufficient DNA repair activity in mitochondria (Larsen et al., 2005). However, it is not known why cells have insufficient mitochondrial DNA repair capacity despite the labile structure of mtDNA when faced with oxidative damage. One possible explanation is that defective mitochondria accompanying mtDNA damage are simply degraded through the mitophagy pathway and discarded, instead of being repaired (Ashrafi and Schwarz, 2013; Berneburg et al., 2006; Kubli and Gustafsson, 2012). However, recent studies have reported that mitochondria possess functional repair mechanisms, such as base excision repair (Bogenhagen et al., 2001; Sawyer and Van Houten, 1999) and mismatch repair (Dzierzbicki et al., 2004), implying that the mitochondrial DNA repair system may be critical in maintaining mitochondrial and cellular function. Our present results support the importance of the mtDNA repair system in maintaining mitochondrial and cellular integrity.
All OGG1 isoforms possess an N-terminal mitochondrial-targeting signal, while only the OGG1-1a variant also has a nuclear-targeting signal in its C-terminal region. This additional sequence makes OGG1-1a targeted to the nucleus, because the nuclear-targeting signal is dominant upon coexistence with a mitochondrial-targeting signal (Boiteux and Radicella, 2000). Based on the domain structures, the other seven OGG1 variants are presumed to exist in mitochondria. Our present results indicated OGG1-2a to be the major mitochondrial-targeting OGG1 in hepatoma cells. Mitochondrial presence of mtOGG1 was previously reported, but its functional activity has not yet been clarified (Boiteux and Radicella, 2000; Hashiguchi et al., 2004). Unexpectedly, suppression of mtOGG1 expression with siRNA did not show any mtDNA mutation (data not shown). A few possible explanations can be drawn: (1) minimal mtOGG1 activity is sufficient to maintain basal replicative error in normal growth conditions, and higher activity is only required for protecting against oxidative damage; (2) mtOGG1 deficiency cannot be found in an environment of active mitophagy; and (3) short-term cultivation for 3 to 4 cell divisions is insufficient to produce detectible mtDNA mutation.
We also found that mtOGG1 overexpression did not reverse the effects of the mutated mtDNA sequence in SNU423 cells (data not shown). SNU423 cells have higher levels of intracellular ROS, which were decreased by mtOGG1 overexpression, but the remaining ROS level was still high enough to damage DNA. Moreover, these cells may have lower expressions of most enzymes in the mitochondrial DNA repair system, such that mtOGG1 overexpression is insufficient to remove the preexisting mtDNA mutation. Nevertheless, mtOGG1 suppression was sufficient to diminish mitochondrial respiration and cellular growth rate, and its overexpression was reversed those activities.
Overall, our results suggest that mtOGG1 has an important role in maintaining mitochondrial respiration, and thereby contributes to hepatoma cell growth. The present results also raise the possibility that mtOGG1 may have a function besides DNA repair activity, which should be further evaluated in additional studies.
Acknowledgments
This work was supported by the National Research Foundation of Korea (2012R1A5A2051425 and 2012R1A2A2A01043185).
Note:
Supplementary information is available on the Molecules and Cells website (www.molcells.org).
REFERENCES
- Anderson S, Bankier AT, Barrell BG, de Bruijn MH, Coulson AR, Drouin J, Eperon IC, Nierlich DP, Roe BA, Sanger F, et al. (1981). Sequence and organization of the human mitochondrial genome. Nature. 290, 457–465 [DOI] [PubMed] [Google Scholar]
- Andrews RM, Kubacka I, Chinnery PF, Lightowlers RN, Turnbull DM, Howell N. (1999). Reanalysis and revision of the Cambridge reference sequence for human mitochondrial DNA. Nat Genet. 23, 147. [DOI] [PubMed] [Google Scholar]
- Ashrafi G, Schwarz TL. (2013). The pathways of mitophagy for quality control and clearance of mitochondria. Cell Death Differ. 20, 31–42 [DOI] [PMC free article] [PubMed] [Google Scholar]
- Berneburg M, Kamenisch Y, Krutmann J, Rocken M. (2006). ‘To repair or not to repair - no longer a question’: repair of mitochondrial DNA shielding against age and cancer. Exp Dermatol. 15, 1005–1015 [DOI] [PubMed] [Google Scholar]
- Bogenhagen DF, Pinz KG, Perez-Jannotti RM. (2001). Enzymology of mitochondrial base excision repair. Prog Nucleic Acid Res Mol Biol. 68, 257–271 [DOI] [PubMed] [Google Scholar]
- Boiteux S, Radicella JP. (2000). The human OGG1 gene: structure, functions, and its implication in the process of carcinogenesis. Arch Biochem Biophys. 377, 1–8 [DOI] [PubMed] [Google Scholar]
- Brandon M, Baldi P, Wallace DC. (2006). Mitochondrial mutations in cancer. Oncogene. 25, 4647–4662 [DOI] [PubMed] [Google Scholar]
- Byun HO, Jung HJ, Seo YH, Lee YK, Hwang SC, Hwang ES, Yoon G. (2012). GSK3 inactivation is involved in mitochondrial complex IV defect in transforming growth factor (TGF) beta1-induced senescence. Exp Cell Res. 318, 1808–1819 [DOI] [PubMed] [Google Scholar]
- Chatterjee A, Mambo E, Sidransky D. (2006). Mitochondrial DNA mutations in human cancer. Oncogene. 25, 4663–4674 [DOI] [PubMed] [Google Scholar]
- Cortopassi G, Wang E. (1995). Modelling the effects of age-related mtDNA mutation accumulation; complex I deficiency, superoxide and cell death. Biochim. Biophys. Acta. 1271, 171–176 [DOI] [PubMed] [Google Scholar]
- Cuezva JM, Krajewska M, de Heredia ML, Krajewski S, Santamaria G, Kim H, Zapata JM, Marusawa H, Chamorro M, Reed JC. (2002). The bioenergetic signature of cancer: a marker of tumor progression. Cancer Res. 62, 6674–6681 [PubMed] [Google Scholar]
- Czarnecka AM, Kukwa W, Krawczyk T, Scinska A, Kukwa A, Cappello F. (2010). Mitochondrial DNA mutations in cancer-from bench to bedside. Front Biosci. 15, 437–460 [DOI] [PubMed] [Google Scholar]
- Dang CV, Semenza GL. (1999). Oncogenic alterations of metabolism. Trends Biochem Sci. 24, 68–72 [DOI] [PubMed] [Google Scholar]
- DiMauro S, Schon EA. (2003). Mitochondrial respiratory-chain diseases. N Engl J Med. 348, 2656–2668 [DOI] [PubMed] [Google Scholar]
- Dzierzbicki P, Koprowski P, Fikus MU, Malc E, Ciesla Z. (2004). Repair of oxidative damage in mitochondrial DNA of Saccharomyces cerevisiae: involvement of the MSH1-dependent pathway. DNA Repair. 3, 403–411 [DOI] [PubMed] [Google Scholar]
- Gardiner K. (1995). Human genome organization. Curr Opin Genet Dev. 5, 315–322 [DOI] [PubMed] [Google Scholar]
- Hashiguchi K, Stuart JA, de Souza-Pinto NC, Bohr VA. (2004). The C-terminal alphaO helix of human Ogg1 is essential for 8-oxoguanine DNA glycosylase activity: the mitochondrial beta-Ogg1 lacks this domain and does not have glycosylase activity. Nucleic Acids Res. 32, 5596–5608 [DOI] [PMC free article] [PubMed] [Google Scholar]
- Kim JH, Kim EL, Lee YK, Park CB, Kim BW, Wang HJ, Yoon CH, Lee SJ, Yoon G. (2011). Decreased lactate dehydrogenase B expression enhances claudin 1-mediated hepatoma cell invasiveness via mitochondrial defects. Exp Cell Res. 317, 1108–1118 [DOI] [PubMed] [Google Scholar]
- Ku JL, Park JG. (2005). Biology of SNU cell lines. Cancer Res Treat. 37, 1–19 [DOI] [PMC free article] [PubMed] [Google Scholar]
- Kubli DA, Gustafsson AB. (2012). Mitochondria and mitophagy: the yin and yang of cell death control. Circ Res. 111, 1208–1221 [DOI] [PMC free article] [PubMed] [Google Scholar]
- Larsen NB, Rasmussen M, Rasmussen LJ. (2005). Nuclear and mitochondrial DNA repair: similar pathways?. Mitochondrion. 5, 89–108 [DOI] [PubMed] [Google Scholar]
- Linnane AW, Marzuki S, Ozawa T, Tanaka M. (1989). Mitochondrial DNA mutations as an important contributor to ageing and degenerative diseases. Lancet. 1, 642–645 [DOI] [PubMed] [Google Scholar]
- Mao L, Zabel C, Wacker MA, Nebrich G, Sagi D, Schrade P, Bachmann S, Kowald A, Klose J. (2006). Estimation of the mtDNA mutation rate in aging mice by proteome analysis and mathematical modeling. Exp Gerontol. 41, 11–24 [DOI] [PubMed] [Google Scholar]
- Nishikawa M, Nishiguchi S, Shiomi S, Tamori A, Koh N, Takeda T, Kubo S, Hirohashi K, Kinoshita H, Sato E, et al. (2001). Somatic mutation of mitochondrial DNA in cancerous and noncancerous liver tissue in individuals with hepatocellular carcinoma. Cancer Res. 61, 1843–1845 [PubMed] [Google Scholar]
- Nishioka K, Ohtsubo T, Oda H, Fujiwara T, Kang D, Sugimachi K, Nakabeppu Y. (1999). Expression and differential intracellular localization of two major forms of human 8- oxoguanine DNA glycosylase encoded by alternatively spliced OGG1 mRNAs. Mol. Biol. Cell. 10, 1637–1652 [DOI] [PMC free article] [PubMed] [Google Scholar]
- Park JG, Lee JH, Kang MS, Park KJ, Jeon YM, Lee HJ, Kwon HS, Park HS, Yeo KS, Lee KU, et al. (1995). Characterization of cell lines established from human hepatocellular carcinoma. Int. J. Cancer. 62, 276–282 [DOI] [PubMed] [Google Scholar]
- Pavicic WH, Richard SM. (2009). Correlation analysis between mtDNA 4977-bp deletion and ageing. Mutat Res. 670, 99–102 [DOI] [PubMed] [Google Scholar]
- Pedersen PL. (1978). Tumor mitochondria and the bioenergetics of cancer cells. Prog Exp Tumor Res. 22, 190–274 [DOI] [PubMed] [Google Scholar]
- Petros JA, Baumann AK, Ruiz-Pesini E, Amin MB, Sun CQ, Hall J, Lim S, Issa MM, Flanders WD, Hosseini SH, et al. (2005). mtDNA mutations increase tumorigenicity in prostate cancer. Proc. Natl. Acad. Sci. USA. 102, 719–724 [DOI] [PMC free article] [PubMed] [Google Scholar]
- Sawyer DE, Van Houten B. (1999). Repair of DNA damage in mitochondria. Mutat Res. 434, 161–176 [DOI] [PubMed] [Google Scholar]
- Scarpulla RC. (2008). Transcriptional paradigms in mammalian mitochondrial biogenesis and function. Physiol Rev. 88, 611–638 [DOI] [PubMed] [Google Scholar]
- Seo YH, Jung HJ, Shin HT, Kim YM, Yim H, Chung HY, Lim IK, Yoon G. (2008). Enhanced glycogenesis is involved in cellular senescence via GSK3/GS modulation. Aging Cell. 7, 894–907 [DOI] [PubMed] [Google Scholar]
- Shigenaga MK, Hagen TM, Ames BN. (1994). Oxidative damage and mitochondrial decay in aging. Proc. Natl. Acad. Sci. USA. 91, 10771–10778 [DOI] [PMC free article] [PubMed] [Google Scholar]
- Smeitink J, van den Heuvel L, DiMauro S. (2001). The genetics and pathology of oxidative phosphorylation. Nat Rev Genet. 2, 342–352 [DOI] [PubMed] [Google Scholar]
- Taanman JW. (1999). The mitochondrial genome: structure, transcription, translation and replication. Biochim. Biophys. Acta. 1410, 103–123 [DOI] [PubMed] [Google Scholar]
- Villani G, Attardi G. (2001). In vivo measurements of respiration control by cytochrome c oxidase and in situ analysis of oxidative phosphorylation. Methods Cell Biol. 65, 119–131 [DOI] [PubMed] [Google Scholar]
- Wallace DC. (2012). Mitochondria and cancer. Nat. Rev. Cancer. 12, 685–698 [DOI] [PMC free article] [PubMed] [Google Scholar]
- Warburg O. (1956). On the origin of cancer cells. Science. 123, 309–314 [DOI] [PubMed] [Google Scholar]
- Yoon YS, Byun HO, Cho H, Kim BK, Yoon G. (2003). Complex II defect via down-regulation of iron-sulfur subunit induces mitochondrial dysfunction and cell cycle delay in iron chelation-induced senescence-associated growth arrest. J Biol Chem. 278, 51577–51586 [DOI] [PubMed] [Google Scholar]
- Yoon YS, Yoon DS, Lim IK, Yoon SH, Chung HY, Rojo M, Malka F, Jou MJ, Martinou JC, Yoon G. (2006). Formation of elongated giant mitochondria in DFO-induced cellular senescence: involvement of enhanced fusion process through modulation of Fis1. J Cell Physiol. 209, 468–480 [DOI] [PubMed] [Google Scholar]
- Yu JS, Kim AK. (2011). Wogonin induces apoptosis by activation of ERK and p38 MAPKs signaling pathways and generation of reactive oxygen species in human breast cancer cells. Mol. Cells. 31, 327–335 [DOI] [PMC free article] [PubMed] [Google Scholar]


