Abstract
Hypoxia-induced microtubule disruption and mitochondrial permeability transition (mPT) are crucial events leading to fatal cell damage and recent studies showed that microtubules (MTs) are involved in the modulation of mitochondrial function. Dynein light chain Tctex-type 1 (DYNLT1) is thought to be associated with MTs and mitochondria. Previously we demonstrated that DYNLT1 knockdown aggravates hypoxia-induced mitochondrial permeabilization, which indicates a role of DYNLT1 in hypoxic cytoprotection. But the underlying regulatory mechanism of DYNLT1 remains illusive. Here we aimed to investigate the phosphorylation alteration of DYNLT1 at serine 82 (S82) in hypoxia (1% O2). We therefore constructed recombinant adenoviruses to generate S82E and S82A mutants, used to transfect H9c2 and HeLa cell lines. Development of hypoxia-induced mPT (MMP examining, Cyt c release and mPT pore opening assay), hypoxic energy metabolism (cellular viability and ATP quantification), and stability of MTs were examined. Our results showed that phosph-S82 (S82-P) expression was increased in early hypoxia; S82E mutation (phosphomimic) aggravated mitochondrial damage, elevated the free tubulin in cytoplasm and decreased the cellular viability; S82A mutation (dephosphomimic) seemed to diminish the hypoxia-induced injury. These data suggest that DYNLT1 phosphorylation at S82 is involved in MTs and mitochondria regulation, and their interaction and cooperation contribute to the cellular hypoxic tolerance. Thus, we provide new insights into a DYNLT1 mechanism in stabilizing MTs and mitochondria, and propose a potential therapeutic target for hypoxia cytoprotective studies.
Keywords: DYNLT1, energy metabolism, hypoxia, microtubule, mPT, phosphorylation
INTRODUCTION
Oxygen deficiency (hypoxia) is one of the most common physiopathology processes that occur in many diseases and severe injuries. For example, severe burns can cause serious damage in major organs including heart and gastrointestinal tract, resulting in poor prognosis (Huang et al., 1999; Wang et al., 2012). In cardiomyocytes, early hypoxia induces obvious microtubule disruption, mitochondrion swelling, cell apoptosis and dysfunction (Huang et al., 2003; Song et al., 2010; Tong et al., 2012). Seeking prophylaxis and therapy methods for hypoxia relief has always been a focus in cellular protection during critical treatment.
MTs are major components of the eukaryotic cytoskeleton consisting of α- and β-tubulin dimers that play various functional roles in many cell processes such as protein synthesis, intra-cellular trafficking, mitosis, cytokinesis, intracellular signaling, and cell fate determination (Rogers and Gelfand, 2000). These network forming tubular complexes are in a dynamic balance between assembly and disassembly. This network is involved in the distribution of organelles such as mitochondria. Recent studies have showed that in case of ischemia-reperfusion or oxygen-glucose deprivation, the MTs are more prone to hypoxic damage than the actin filaments (Sato et al., 1993). In addition, it is known that early disruption of the cytoskeleton ultra-structure correlates with the cellular reaction to a metabolic challenge (Hein et al., 1995; Vandroux et al., 2004), and thus promoting irreversible cell damage. It was reported that the homeostasis of MT forms relies on MT-associated proteins (MAPs) (Cassimeris, 1999). Our previous study showed that hypoxia-induced MAP4 phosphorylation leads to MT network disruption and an increase in free tubulin. Subsequently we demonstrated that MAP4 could alleviate MTs disruption and stabilize mitochondrial permeability transition (mPT) in hypoxia via dynein light chain Tctex-type 1 (DYNLT1) modulation (Fang et al., 2011; Hu et al., 2010).
DYNLT1, widely expressed in a number of tissues in various species and a component of dynein complex, fulfills cargo binding function (Belmont and Mitchison, 1996; Chuang et al., 2001), and plays a key role in multiple processes including endomembrane organization, trafficking, mitosis, and MT organization (Nagano et al., 1998; Palmer et al., 2011). DYNLT1 displays an independent cargo adaptor role for dynein motor transport apart from its other neuritogenic effects (Chuang et al., 2005). Although numerous reports have addressed dynein subunits, it is still unclear how they function with other molecules in the cytosol. We were interested in DYNLT1 in our previous works as we tested the existence of an intermediate molecule linking mitochondria and MTs and acting as a protector in regulating mPT under hypoxic condition. Using Y2H assays, we identified DYNLT1 as a promising candidate showing remarkable protein-protein interaction with voltage-dependent anion-selective channel (VDAC, a major porin located on the mitochondrial outer membrane) is in accordance with previous reports (Schwarzer et al., 2002), as well as a co-localization with VDAC1 and MTs(Fang et al., 2011). Therefore we hypothesized that DYNLT1 might be a new modulator of mitochondrial function and MTs stability in hypoxia. Recently it was shown that DYNLT1 knockdown by RNA interference technique aggravated hypoxia-induced mitochondrial damage: permeabilization, mitochondrial membrane potential (MMP) collapse and metabolic viability reduction (Fang et al., 2011). However, the changes that DYNLT1 undergoes during hypoxia are unknown.
DYNLT1’s structure is highly conservative and little is known about its modifications with the main thought to be phosphorylation (Song et al., 2007). Within a protein, phosphorylation can occur on several amino acids and one of the most common phosphorylation states occurs on serine residues. It was reported that the dynein complex disassembles to release cargo following specific phosphorylation of DYNLT1 at the serine 82 residue (S82). This process is critical for the apical delivery of membrane cargoes and S82 phosphorylation leads to a reduced affinity for the dynein intermediate chain (Yeh et al., 2006). Since the above mentioned reports indicated a key role of DYNLT1 in modulating mPT and MT network stability, we hypothesized that phosphorylation of DYNLT1, especially on S82, might occur in hypoxia, based on our previous work in which we showed that hypoxia-activated p38/MAPK signaling pathway initiates MT disruption and alters cell viability by phosphorylating the downstream effector (Hu et al., 2010). In order to generalize these observations, we chose H9c2 and HeLa cells (Brito and Rieder, 2009; Wan et al., 2009) to study hypoxia-reduced MTs disruption and mitochondrial permeabilization related to S82. We used site-directed mutagenesis of the phosphorylation site to obtain phosphomimic and dephosphomimic mutants. In this study we demonstrated that phosph-S82 (S82-P) exhibits a parabolic change under hypoxic conditions; S82E mutation which mimics DYNLT1 phosphorylated at S82 aggravated hypoxia-induced mitochondrial damage and elevated the free tubulin in cytoplasm; while S82A mutation, the dephosphomimic counterpart, decreased mPT and stabilized MTs during early hypoxia. These data provide new insights into a DYNLT1 mechanism that stabilizes mitochondria and improves cell viability to resist hypoxic damage.
MATERIALS AND METHODS
Cell culture
H9c2 cell line, a subclone of the original clonal cell line derived from embryonic BD1X rat heart tissue, was obtained from the Cell Bank of the Chinese Academy of Sciences. The cells were maintained in Dulbecco’s Modified Eagle’s Medium (DMEM) (Hyclone) supplemented with 10% FBS and 100 U/ml penicillin, 100 mg/ml streptomycin at 37°C in a gas mixture of 94% N2, 5% CO2, and 1% O2 (v/v). HeLa cells, an immortal cell line originally derived from cervical cancer tissues, were obtained from the American Type Culture Collection (USA). HeLa cells were cultured in RPMI-1640 with 5% FBS under standard mammalian cell culture conditions.
Hypoxia treatment
A hypoxia model was established as previously mentioned (Seko et al., 1997). Briefly, hypoxic conditions were achieved by using an anaerobic jar (Mitsubishi, Japan) and a vacuum glove box (Chunlong, China). The serum-free medium was placed in the vacuum glove box filled with a gas mixture of 94% N2, 5% CO2, and 1% O2 overnight and allowed to equilibrate with the hypoxic atmosphere. Cells were subjected to hypoxic conditions by replacing the normoxic medium with the hypoxic medium and the culture dishes then placed in the anaerobic jar.
S82E/A mutant recombinant adenovirus construction and transfection
To mimic S82 phosphorylation and dephosphorylation, we constructed recombinant adenoviruses containing various DYNLT1 sequences at S82 using site-directed mutagenesis to generate putative glutamic acid (E) and alanine (A) mutants (S82E and S82A, respectively). The recombinant adenoviruses were prepared using the AdMaxTM system (Microbix, CAN) according to the manufacturer’s instructions. H9C2 cells were maintained in DMEM/F12 supplemented with 10% FBS and HeLa cells were maintained in RPMI-1640 containing 5%FBS. Culture media were replaced by medium without FBS, and monolayers were infected with adenoviruses at a multiplicity of infection of 100–200 particles/cell. After 48 h of incubation, more than 90% of the cells were determined to be infected by observing GFP expression on a fluorescent microscope. Mutagenesis was confirmed by real-time PCR (gene sequence) and by Western blot (GFP fusion protein expression). A negative adenovirus vector was used as background in these experiments. The cells were then cultured in DMEM/F12 or RPMI-1640 with FBS prior to morphological or biochemical analyses.
Extraction and quantification of tubulin fractions
Polymeric and monomeric tubulin fractions were isolated by a method previously described by Putnam et al. (1998). Briefly, cells grown in 60-mm dishes were washed twice with a MT stabilization buffer (MTSB, 37°C) containing 0.1 M piperazine-N,N′-bis (2-ethanesulfonic acid, pH 6.8) (PIPES), 2 mM ethylene glycol-bis (β-aminoethylether) N,N,N′,N′-tetraacetic acid (EGTA), 0.5 mM MgCl2, 20% glycerol, and a protease inhibitor cocktail (Sigma-Aldrich). Cells were incubated with MTSB containing 0.1% Triton X-100 for 30 min, and the supernatant collected as the monomeric tubulin fraction. The MTSB insoluble fraction, containing the polymerized tubulin, was then solubilized in a RIPA lysis buffer (Sigma-Aldrich) with 2 mM phenylmethylsulfonyl fluoride (PMSF) and a protease inhibitor cocktail. Polymeric and monomeric tubulin fractions were quantified using western blot analysis.
Preparation of cytosolic and mitochondrial fractions
Subcellular fractions were prepared according to well established protocols (Al Rahim et al., 2013; Zang et al., 2007). Briefly, Cell were harvested and homogenized in isotonic MB (mitochondrial buffer) consisting of 210 mM mannitol, 70 mM sucrose, 1 mM EDTA and 10 mM Hepes, pH 7.5, supplemented with protease and phosphatase inhibitor cocktails (Calbiochem, USA). After centrifugation at 500 g for 5 min, the nuclear fraction was collected as a pellet. The post-nuclear supernatant was submitted to a subsequent centrifugation at 10,000 × g for 30 min at 4°C and the mitochondrial fraction obtained in the resulting pellet, was resuspended in 50 μl of MB containing 0.1% Triton X-100 to break up the mitochondria and the supernatant was used as the crude cytosolic fraction. To confirm the separation of cytosolic and mitochondrial fractions, blots were stripped and incubated with GAPDH and VDAC, respectively, which also served as loading controls.
Western blot analysis
Free and polymerized tubulin fractions prepared as described above were probed with anti-α-tubulin antibodies (1:200; Santa Cruz); cytosolic and mitochondrial fractions were probed with anti-cytochrome c antibodies (1:200; Santa Cruz Biotechnology, USA). VDAC (1:1,000; Abcam, USA) was used as a loading control of polymeric tubulin and mitochondrial fraction, and anti-GAPDH (1:5,000; Sigma-Aldrich) used to detect the internal control GAPDH in supernatants. Besides these cell component lysates, the whole cell lysate was also prepared and analyzed by Western blotting using primary antibodies to S82-P of DYNLT1 (1:1,000; GL Biochem, China). Immunocom-plexes were visualized and quantified with a chemiluminescence detection kit (Amersham Pharmacia, USA), using horseradish peroxidaseconjugated secondary antibodies (1:2,000; Santa Cruz).
Immunofluorescence microscopy
Immunocytochemical staining was performed as described previously (Feng et al., 2007; Vandroux et al., 2004). Cells were cultured on coverslips (10-mm diameter) and rinsed twice in prewarmed (37°C) PBS. Cells were then fixed in 4% paraformaldehyde for 30 min and permeabilized with 0.1% Triton X-100 in PBS for 30 min. After rehydration samples were blocked for 20 min using 10% goat serum (Sigma) in PBS. For immunofluorescence microscopy, cover slips were incubated in α-tubulin primary antibodies (1:1,000; Santa Cruz) followed by cyanine 3 (Cy3; 1:1,000; Beyotime, China) -conjugated antibodies. Counterstaining of nuclei was performed with 4,6-diamidino-2-phenylindole (DAPI; Biotium, USA) and cells were observed and photographed using an LSM 510 META laser confocal scanning microscope (Carl Zeiss, Germany). The experiments were repeated for a total of three times (n = 3).
Quantification of ATP
Two assays were employed to measure the ATP content. First, cells were harvested and sonicated after addition of HClO4 and neutralization with K2CO3, and protein concentration assessed in a BCA assay. The mixtures were centrifuged at 16,000 × g for 15 min (Rusanen et al., 2000) and the supernatants collected for the measurement of ATP concentration using Molecular Probes’ ATP Determination Kit (A22066, Invitrogen, USA) according to the manufacturer’s instructions (Loos et al., 2011). The amounts of ATP were calculated in the experimental samples from the standard curve established following the protocol and was normalized as percentage of the control. Then, ATP synthesis rate was determined using the luciferin-luciferase method. Briefly, mitochondrial fractions were resuspended in the reaction solution (0.5 mM EDTA, 10 mM Hepes, 5 mM KH2PO4, 2.5 mM MgCl2), and incubated for 3 min in 5 μM digitonin at room temperature with gentle agitation. The sample was then mixed with a solution of 20 μM luciferase, 5 mM malate and 10 mM glutamate to record the light intensity as background using a GloMax 20/20n luminometer (Promega, USA). ATP synthesis was initiated by addition of 4M ADP. The changes in light intensity corresponded to the ATP synthesis rate.
Cell viability assay
Cell viability was determined using a cell counting kit (CCK-8; Dojin Laboratories, Japan), a colorimetric assay for the determination of the number of viable cells which produce a water-soluble formazan dye upon reduction of a tetrazolium salt WST-8 in the presence of an electron carrier. In these experiments, 1 × 10⁴ cells/well were seeded in 96-well plates containing serum-free medium and incubated in hypoxic conditions. 10 μl of the CCK-8 solution was added to each well followed by 1 h incubation. After solubilization, the absorbance was measured at 450 nm using a microplate reader (Synergy HT, Bio-Tek, USA) (Liang et al., 2012; Takeuchi et al., 2003). The experiments were repeated for a total of three times (n = 3).
Determination of MMP
MMP was assessed using tetramethyl rhodamine methyl ester (TMRE, Invitrogen), a lipophilic cationic fluorescent probe that localizes within the mitochondria according to the membrane potential (Scharstuhl et al., 2009; Zhdanov et al., 2011). Cells grown on coverslips were loaded with 500 nM TMRE for 30 min at 37°C in Hank’s balanced salt solution and real time imaging of live cells performed with a fluorescence imaging system (Leica DM6000 B, Leica, Germany). Dye loaded cells were maintained in a perfusion chamber (bath volume = 0.5 ml) mounted on the microscope stage. For detection samples excited at 568 nm emitted fluorescence at 585 nm. Images were collected with an exposure time of 100 msec. Regions of interest (ROI) were selected within several cells in each experiment to measure changes in MMP.
Mitochondrial permeability transition
The mPT was measured by calcein-AM/CoCl2 staining as described previously (Petronilli et al., 1999; 2001). Briefly, cells were loaded with 1 mM calcein-AM ester and 1 mM CoCl2 in Hanks’ solution containing 10 mM Hepes buffer (pH 7.4) for 30 min at 37°C. Cells were washed to remove free calcein and Co2+ and fluorescence was detected using laser-scanning confocal microscopy (excitation at 490 nm and emission at 520 nm).
Statistical analysis
Data are expressed as mean ± SEM. SPSS 13.0 software was used for statistical analysis and significance evaluated by oneway ANOVA followed by post-hoc tests and paired-samples t-test. P values < 0.05 were considered statistically significant.
RESULTS
Hypoxia induces phosphorylation of DYNLT1 at S82
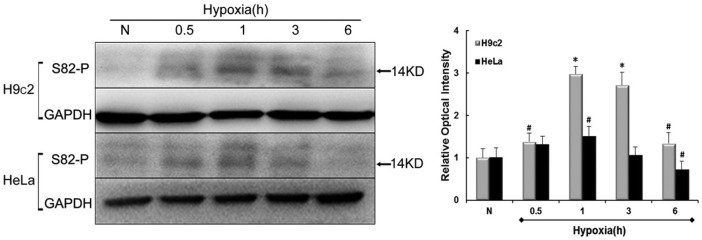
Given the importance of phosphorylation of DYNLT1 at S82, we used antibodies to S82-P to investigate the effect of S82-P during hypoxia. HeLa and H9c2 cells were exposed to hypoxic conditions for 0.5, 1, 3 and 6 h besides a basic normoxic contrast. Levels of phophoserine were assessed by Western blot and quantified by relative optical density signals (Fig. 1). Figure 1 shows that the tendency of S82-P degree increases first, reaches a peak plateau, before declining. Precisely, a slight elevation in H9c2 cells can be observed at after only 0.5 h hypoxia (P < 0.05) followed by an apparent high expression at 1h which remains to 180 min (P < 0.01), and decreases at later time points, to values close to basal levels albeit still higher than normal (P < 0.05). For HeLa cells, no significant increase was detected until after 1 h hypoxia (P < 0.05) with a final value lower than normal at 6 h (P < 0.05). The variability of results obtained for H9c2 and HeLa cell responses to hypoxia might be due to the inherent differences between these cell lines in their ability to withstand hypoxia. Indeed these findings indicate that hypoxia induces phosphorylation of S82, especially at early time points in both cell groups.
Fig. 1.
Levels of S82 phosphorylation in hypoxia. Immunoblots represent changes in levels of S82 residue phosphorylation in either H9c2 or HeLa cell line at normoxia (N) and 0.5, 1, 3, 6h of hypoxia. The histogram to the right shows relative optical density analysis. GAPDH was chosen as an internal control. Values were compared to N values, set to 100% respectively and the other values normalized accordingly. Data are mean ± SEM (n = 3). #P < 0.05; *P < 0.01 vs. N.
S82E mutagenesis accelerates MT depolymerization induced by hypoxia while S82A plays a potentially protective effect
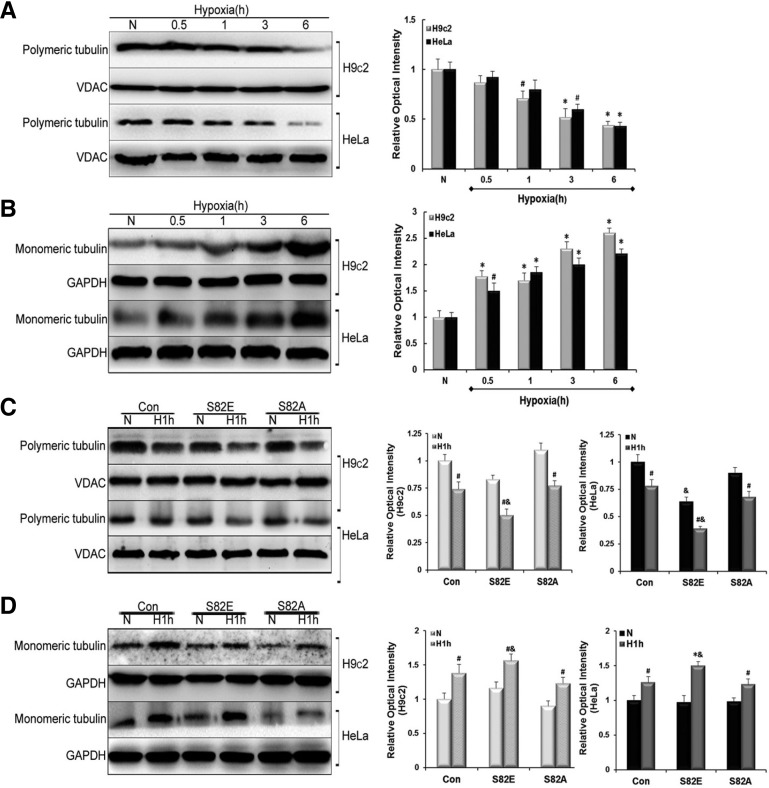
To test the effects of different S82 mutations on MT organization, objected cells were separated into polymeric and monomeric tubulin fractions as described in the experimental section. Western blot data showed a time-dependent decrease in polymerized tubulin, concomitant with a parallel increase in free tubulin in both H9c2 and HeLa cells after hypoxia treatment (Figs. 2A and 2B). In H9c2 cells the concentration of polymerized tubulin were lower than normal at 1 h of hypoxia (P < 0.05), while a statistically significance decrease occurred in HeLa cells only at 3 h. However, increase in monomeric tubulin was obvious at 0.5 h hypoxia in both H9c2 (P < 0.01) and HeLa cells (P < 0.05), and after 1 h hypoxia, the quantity of monomeric tubulin was significantly elevated in both cell groups (P < 0.01). These results show a dynamic depolymerization of tubulin induced by hypoxia. Based on these findings, 1 h of hypoxia was considered the earliest and ideal time point causing evident tubulin depolymerizing, and was accordingly chosen for general hypoxia treatment in subsequent experiments. Afterwards, we transfected the objected cells with S82E/A mutant recombinant adenoviruses. Each group including S82E, S82A and the control cells (Con) was set into normoxia and hypoxia (H1h) comparison. As shown in Fig. 2C Immunoblotting revealed that all cell groups exhibited a more pronounced disruption of tubulin in hypoxia compared with that in normoxia (P < 0.05). Interestingly, S82E mutagenesis in both H9c2 and HeLa cells showed a significant MT breakage compared with Con groups in hypoxia (P < 0.05), as evidenced in Fig. 2C (two lowest panels). There seemed to be no statistical difference between S82A and Con group whether in normoxic or hypoxic conditions (P > 0.05). Conversely the results displayed in Fig. 2D show an increase of monomeric tubulin during hypoxia in each group although S82E groups still displayed a higher expression of free tubulin (P < 0.05 and P < 0.01, respectively) which translates into a promotion of MT disassembly. No statistical differences were detected between untransfected cells and those transfected with empty adenovirus vector (data not shown) in all the experiments.
Fig. 2.
Influence of S82 mutants on microtubule homeostasis. Free and polymerized tubulin fractions were prepared and probed with anti-α-tubulin antibodies. Immunoblots and relative optical density analysis in (A) indicated a decrease in polymeric tubulin, while in (B) an increase in monomeric tubulin in either H9c2 or HeLa cell lines was observed. (C, D), Western blot experiments show the influence of S82E and S82A mutants on polymeric tubulin and monomeric tubulin compared with Con group under normoxia (N) and Hypoxia (H1h) conditions in both cell lines. Histograms to the right represent the quantified relative integrated signals of H9c2 and HeLa, respectively. GAPDH in monomeric tubulin fractions was chosen as an internal control for free tubulin and VDAC in polymeric tubulin fractions was chosen for polymerized tubulin. Data are presented as mean ± SEM (n = 3). #P < 0.05 vs. N, &P < 0.05 vs. Con.
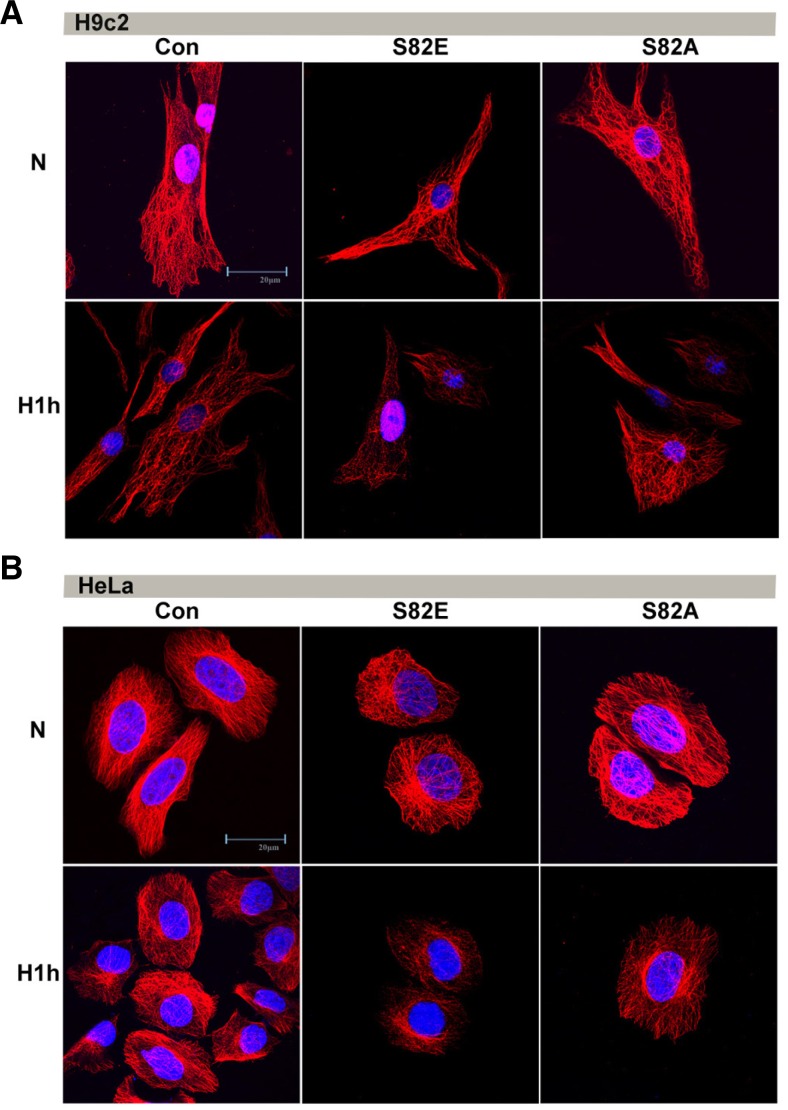
Using Confocal laser microscopy, we found that the structure of the MTs was severely disrupted after 1h of hypoxia, especially in S82E groups in both H9c2 and HeLa cells (Fig. 3), with a more striking decrease in MT density, looser distribution and a more severe loss of MTs closely adjacent to the cell membrane than the Con group. However the hypoxia-induced alteration of microtubule networks was less noticeable in S82A groups in comparison with S82E and the MT structure in the S82A mutant even persisted more than the Con.
Fig. 3.
Immunofluorescent confocal micrographs comparing S82E and S82A mutants to Con groups in both H9c2 (A) and HeLa (B) cell lines under normoxia and hypoxia (H1h) conditions.
S82E is responsible for hypoxia-induced mitochondrial damage: MMP collapse and permeabilization
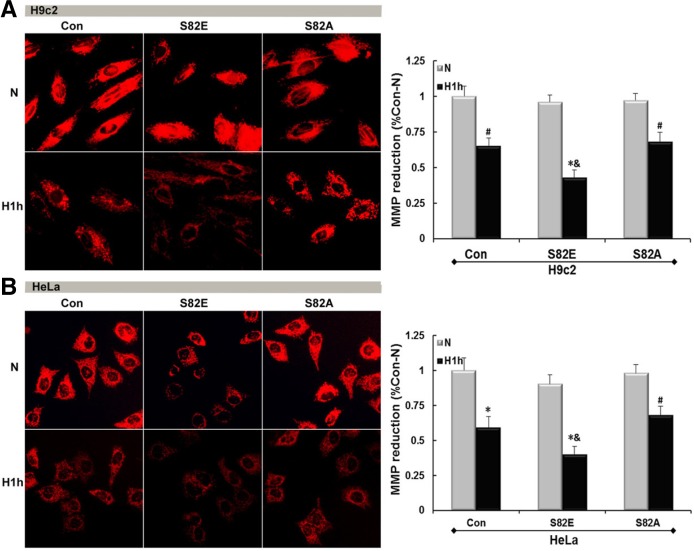
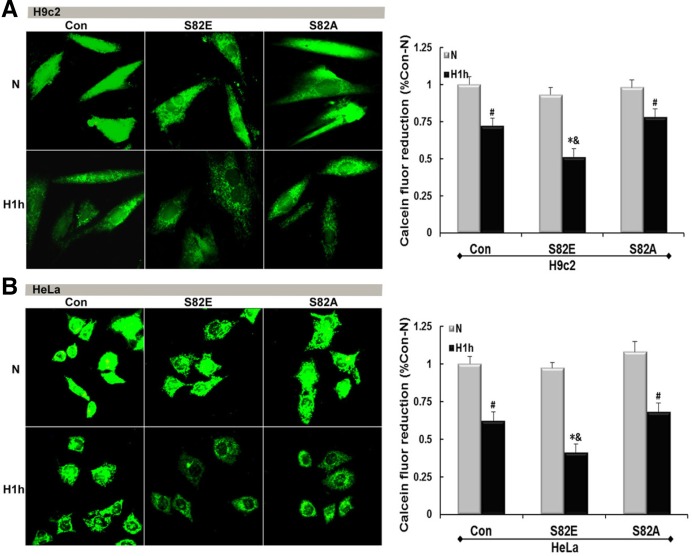
Fluorescence micrographs in Fig. 4 show a MMP collapse and damage induced by hypoxia in both H9c2 (P < 0.05) and HeLa (P < 0.01). S82E groups slightly lowered the MMP in normoxia initially, regardless to the host cell line. After hypoxia treatment the red fluorescence intensity representing the MMP was much weaker than that obtained either from the same cells in normoxia (N) (P < 0.01) or Con group in similar hypoxia conditions (P < 0.05). Conversely, both S82A groups maintained a positive MMP strength symbolizing their capability of hypoxia tolerance. Figure 5 shows the mPT induction by visualization of green fluorescence intensity. S82E was also prone to elicit mitochondrial permeabilization under normoxia although this was more pronounced under hypoxic conditions (P < 0.01), and S82A seemed to protect mPT from hypoxia-induced damage.
Fig. 4.
Hypoxia induces MMP disruption and this damage can be influenced by S82 mutations. Red fluorescence detection in H9c2-(A) and HeLa (B) cell lines including Con, S82E and S82A groups under normoxia and hypoxia conditions shows different MMP damage according to groups. The histogram to the right represents the quantified MMP reduction respectively as mean ± SEM (n = 3). #P < 0.05; *P < 0.01 vs. N, & P < 0.05 vs. Con.
Fig. 5.
mPT induction probed by calcein-AM/CoCl2 co-staining. Mutagenesis of S82 has an impact on hypoxia-induced permeabilization. Fluorescent micrographs of H9c2-(A) and HeLa (B) cell lines (Con, S82E and S82A groups) under normoxia and hypoxia conditions show distinct degrees of mPT induction. Graphs to the right represent the calcein fluor reduction. Values are mean ± SEM (n = 3). #P < 0.05; *P < 0.01 vs. N; &P < 0.05 vs. Con.
Release of Cyt c is aggravated in S82E and suppresed in S82A groups during hypoxia
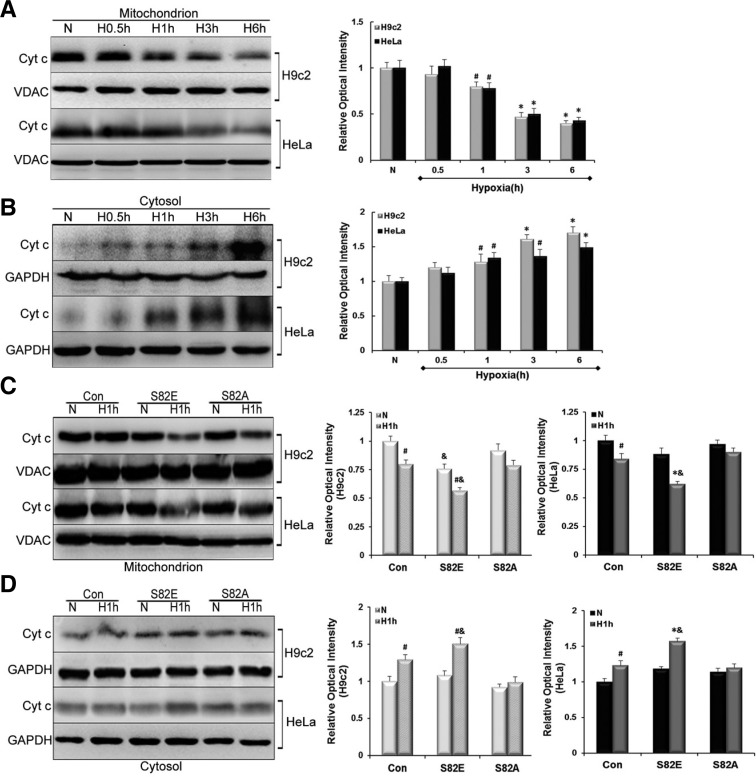
Release of mitochondrial proteins like cytochrome (Cyt) c constitutes a major event during apoptosis. To analyze the translocation of Cyt c, protein levels were quantified by Western blot in mitochondrial and cytosolic fractions of Con and transfected cells. We found that Cyt c was depleted from its resident location i.e. mitochondria after oxygen deprivation. In parallel, the levels of Cyt c gradually increased in cytosolic fractions (Figs. 6A and 6B). These changes were noticed (P < 0.05) after 1h of hypoxia. As the hypoxia was prolonged, these changes became even more evident (P < 0.01). Afterwards, we evaluated the effects of S82 mutagenesis on Cyt c release. It seemed that the mutagenesis had no obvious influence on basal Cyt c amounts in mitochondrial and cytosolic fractions under normoxia (P > 0.05), except for the S82E group in the H9c2 mitochondrial background showing a slight decrease compared with the control cells (P < 0.05). These findings suggest that S82E mutagenesis itself might alter the release of Cyt c. We found that S82E aggravated this transport while S82A was able to suppress the release of Cyt c in hypoxia (Figs. 6C and 6D). Indeed, there was no statistically significant in Cyt c concentrations obtained in mitochondrial or cytosolic fractions from S82A groups, whether in normoxia and hypoxia conditions. In contrast, when comparing S82E-Hypoxia with S82E-Normoxia groups, Cyt c release was elevated in H9c2 cells (P < 0.05), and even more pronounced in HeLa cells (P < 0.01). Focusing on the Cyt c expression in same hypoxia condition, we found that in all S82E groups the changes were significant compared with the Con (P < 0.05).
Fig. 6.
Influence of S82 mutants on Cyt c release of from mitochondria into cytosol. (A) and (B) exhibit the reverse change in Cyt c amounts in mitochondrial and cytosolic fractions: a gradual decrease vs. increase in H9c2 and HeLa cell lines. (C, D) show the effect of S82E and S82A mutants on Cyt c transfer in comparison with Con group under normoxia (N) and Hypoxia (H1h) condition in each cell line. Histograms to the right represent the quantified relative integrated signal of H9c2 and HeLa cells, respectively. Values are mean ± SEM (n = 3). #P < 0.05, *P < 0.01 vs. N; & P < 0.05 vs. Con.
Effect of S82 mutagenesis on hypoxic energy metabolism
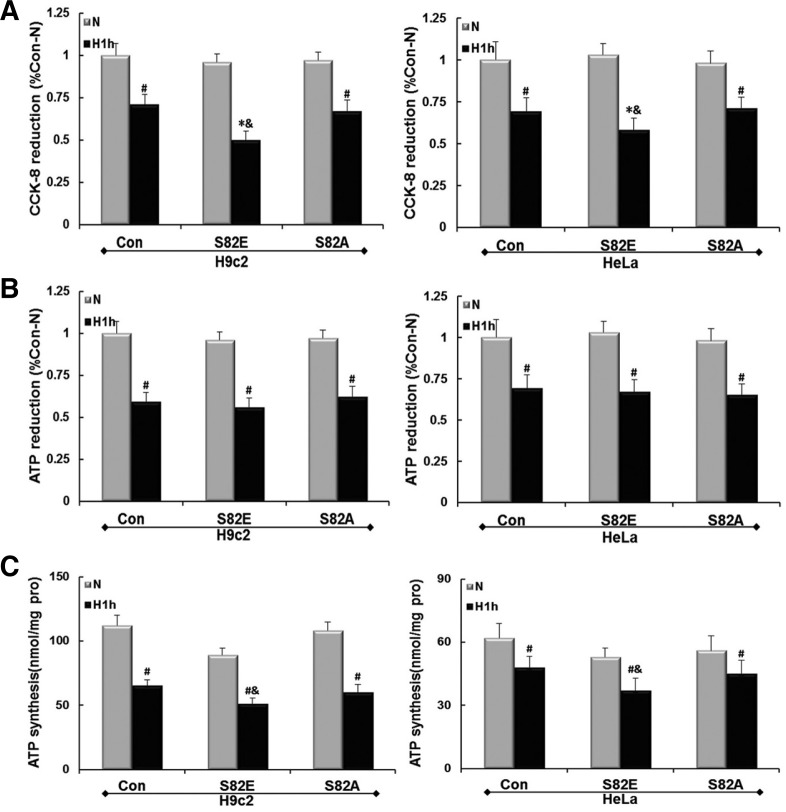
Con and S82 mutant groups of H9c2 and HeLa cells were exposed to hypoxic conditions for 1 h as described above. The relative cell viability of the cultured cell was tested using the CCK-8 assay. Figure 7A shows that hypoxia caused a decrease in cell viability in Con and S82A groups of both cell lines (P < 0.05), and the reduction in numbers of viable cells is more remarkable in S82E groups (P < 0.01). S82E groups therefore lead to more cell killing than Con groups in hypoxia (P < 0.05). As shown in Fig. 7B the relative total ATP content in hypoxia was significantly decreased than that in normoxia in each cell group. Similar results were obtained for the ATP synthesis rates (Fig. 7C). Moreover, the values obtained showed that the ATP synthesis ability of H9c2 cells is higher than that of HeLa, and the impairment induced by hypoxia was also more evident in H9c2. Although no significant difference in ATP reduction was detected among the hypoxic Con, S82E and S82A groups (P > 0.05), the ATP synthesis rates were significantly lower in S82E compared with Con during hypoxia in either cell line (P < 0.05).
Fig. 7.
Cell viability and energy metabolism maintenance reduction in hypoxia. (A) shows a decrease in cell viability measured by CCK-8 method, and (B) shows a total ATP decrease respectively in H9c2 and Hela cell groups after Ad-S82E or Ad-S82A transfection. Values were normalized as percentages after comparison with N of Con. (first panel), set to 100%. (C) shows the ATP synthesis rates of different cell groups under the conditions as above. Values in the grpah are mean ± SEM (n = 3). #P < 0.05, *P < 0.01 vs. N; &P < 0.05 vs. Con.
DISCUSSION
MT disruption is a common phenomenon in hypoxia-induced cell injuries and is closely connected with mitochondrial dysfunction, which can also directly be induced by hypoxia. Some studies proposed that free tubulin can modulate MMP, VDAC and hence, mitochondrial outer membrane permeability in cancer cells (Maldonado et al., 2010; Rostovtseva and Bezrukov, 2012). In addition, Sheldon’s team discovered that phosphorylation of VDAC governs its interaction with tubulin (Sheldon et al., 2011). These experiments revealed the interaction between MT and mitochondrion. In our previous works, we described a co-localization of VDAC1 and MTs in accordance with previous reports. Furthermore, we found that a new molecule, DYNLT1, linking MT network and mitochondria, was involved in a possible mechanism of MT and mitochondria stabilization, thus improving cell viability during hypoxia. DYNLT1 is a component of cytoplasmic dynein, the major motor protein complex responsible for minus-end, MT-based motile processes. Each dynein complex consists of 2 heavy chains with ATPase and motor activities, in addition to a group of accessory polypeptides such as intermediate chains, light intermediate chains and light chains. It is generally admitted that the light chain portion is engaged in cargo binding and attached to cell organelles (e.g. mitochondria) while contributing to their localization (Makokha et al., 2002; Mok et al., 2001; Williams et al., 2005). Schwarzer et al. (2002) reported that DYNLT1 slightly increases the voltage-dependence of VDAC1, indicating that DYNLT1 has the ability to modulate channel properties. Our recent findings indicated that DYNYT1 knockdown can negatively affect the mitochondrial permeabilization and metabolism (Fang et al., 2011). All these data suggest that DYNLT1 might be a potential modulator in cytoprotection by MT and mitochondrion modulation coordination.
DYNLT1 is highly constructively conservative with a possible modification is presumed to be phosphorylation. It was reported that The S82 of DYNLT1 is critical for binding to dynein intermediate chain and phosphorylation of this amino acid was shown to play a role in the uncoupling of DYNLT1 from the dynein complex (Yeh et al., 2006). Considering its important regulatory role during hypoxia, we were interested in the changes that DYNLT1 would undergo under hypoxia and to address whether its alternation would influence MT polymerization and mitochondrial function besides cargo binding. We speculated that once oxygen was deprived, phosphorylation would occur to DYNLT1 most likely at serine/tyrosine residues. Therefore, S82 was chosen to analyze the phosphorylation development of DYNLT1 in H9c2 and HeLa cell lines. Our results (Fig. 1) confirmed our hypothesis with the tendency towards increased phosphorylation first (start at 0.5 h, peak at 1 h), and subsequent dephosphorylation (declining at 3 h and nearing basal line at 6 h). Based on these observations, hypoxia of 1 h was selected as earliest optimal point to be used in subsequent experiments (S82-P levels remarkably elevated). Site-directed mutagenesis was carried out using recombinant adenovirus to mutate S82 to either S82E or S82A, mimicking the phosphorylated or dephosphorylated forms of DYNLT1 at S82 residue, respectively.
Western blots and the relative integrated signals in Figs. 2A and 2B showed a common decrease of polymeric tubulin as well as an increase of monomeric tubulin in H9c2 and HeLa cells during hypoxic treatment. In S82E mutation this contrast was most pronounced (Figs. 2C and 2D), with the polymeric tubulin amounts in hypoxia not only lower than that in normoxia, but also than that of Con group in hypoxic conditions. In contrast S82A mutation seemed to prevent this aggravation. Besides this quantitative analysis, immunofluorescence of cells cultured on coverslips displayed the morphology of MT dynamics in hypoxia and revealed a difference resulting from various site-directed mutants (Fig. 3). These results suggest that S82E mutant could promote the MT depolymerization while the S82A mutant plays a protective role in hypoxia. It is known that S82E mutant of DYNLT1 negatively affects its binding to intermediate chains and hence alters dynein assembly (Yeh et al., 2006). However, it is still unclear whether MT disassembly is caused directly by the S82 phosphomimic action or if there is an intermediary player involved.
Permeabilization of mitochondrial membrane is a crucial step in apoptosis and necrosis. The complexes responsible for mPT pore activity span both the inner and outer membranes of mitochondria (Kinnally et al., 2011a). Opening of mPT pore can be triggered by several factors such as oxidative stress, mitochondrial membrane depolarization, etc. Although the definitive molecular identity of the pore is still under debate, proteins such as cyclophilin D, VDAC and ANT contribute to mPT pore formation, and VDAC has been proposed to play an undeniable role in outer mitochondrial membrane permeabilization (Kinnally et al., 2011b; McCommis and Baines, 2012). Increasing attention has been directed towards mPT because induced permeabilization causes matrix swelling, MMP loss and cellular energy dysmetabolism. When the MMP is lost there is an unchecked flow of protons and various molecules across the outer mitochondrial membrane such as Cyt c. This can facilitate the activation of caspase cascade, DNA damage and eventually cell death. The loss of the MMP also interferes with the production of ATP since an electrochemical gradient is indispensable in energy (ATP) production. During cell damage resulting from severe hypoxemic injury (e.g. heart attack or severe burn), an induced permeabilization can severely reduce ATP production and even cause ATP synthase to start hydrolyzing ATP instead (Stavrovskaya and Kristal, 2005).
We found that S82E caused an obvious MMP collapse compared with Con and S82A groups in either H9c2 or HeLa backgrounds in hypoxia (Fig. 4). When evaluating mitochondrial permeabilization, we also found that S82E resulted in a more inducible hypoxic mPT than other groups (Fig. 5). These results were in accordance with their interaction as mentioned above. Interestingly, S82A acted as a protective factor, and its beneficial effect on MMP or mPT was obvious. Figure 6 dynamically displays the procedure of Cyt c released into cytosol under hypoxic conditions, which seemed analogous to tubulin depolymerization (decrease on one side and increase on the other). Based on the mechanism of permeabilization induction stated above, we confirmed that S82E negatively influences mPT since it facilitated the Cyt c release through the mPT pore opening in normoxia and even more in hypoxia. In contrast, S82A effectively attenuated Cyt c release, again in accordance with its preventive role in mPT induction.
CCK-8 assay and ATP quantification were used to test the maintenance of hypoxic energy metabolism. It is known that Hypoxia treatment could reduce cell viability (Hu et al., 2010). We found that S82A improved the survival of hypoxic cells whereas S82E sharply reduced cell viability in hypoxia conditions. The data obtained in two different ATP assessment assays showed that hypoxia resulted in a decrease in total ATP content and mitochondrial ATP synthesis rate. Under hypoxic conditions, no statistical differences were detected in total ATP decrease between Con, S82E and S82A groups in both cell lines. However the mitochondrial ATP production was impaired in the two S82E groups compared with the Con groups. Except for limitations in our experimental design e.g. hypoxic time points, these findings suggest that the synthesis rate is more sensitive to test early ATP changes. H9c2 cell line was more easily affected by hypoxia in ATP producing than HeLa, and this may due to the enhanced hypoxic ATP production through glycolysis in cancer cell (Frezza et al., 2011; Teng et al., 2010).
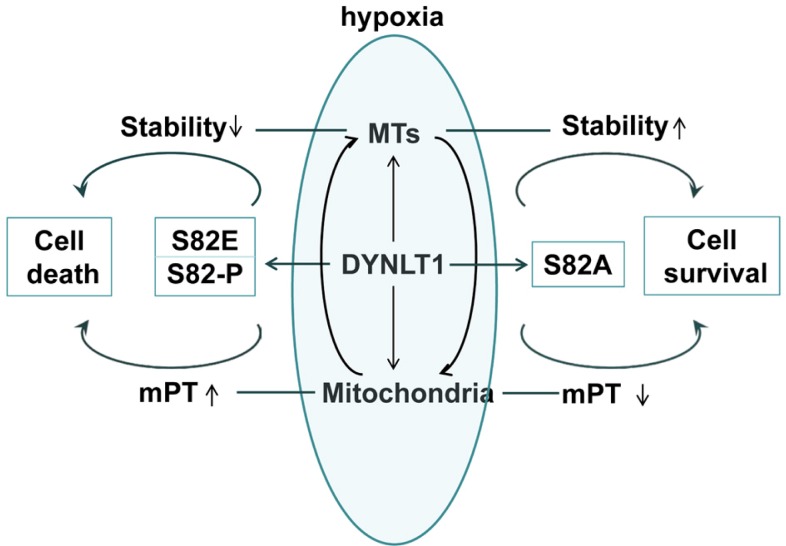
However, the puzzle is not completely solved. For example, what is the regulatory mechanism between DYNLT1, MTs and mitochondria? Does DYNLT1 modulate mitochondria through MTs or the reverse? Does S82 phosphorylation mutagenesis affect mPT by impairing the dynein complex assembly, or else? Additionally, our previous studies have shown that down-regulation of DYNLT1 aggravates hypoxia-induced mitochondrial damage. In order to obtain an ideal ability for hypoxia tolerance, what may be a better protective modification between expression modulation and site-directed mutation, or what kind of combination balance is the best choice? These questions need to be addressed in order to deeply explore the DYNLT1 mechanisms in mitochondrion and MT modulation. Certainly, our current results indicate that DYNLT1 phosphorylation at S82 is involved in MTs regulation and mPT induction, and that their interaction and cooperation may contribute to the cellular hypoxic tolerance (Fig. 8). Thus we provide new insights into a DYNLT1 mechanism in stabilizing MTs and mitochondria and propose a potential therapeutic target in hypoxia cytoprotective studies.
Fig. 8.
Proposed mechanism of modulation of MTs and mitochondrial function in hypoxia by DYNLT1 phosphorylation at S82. Our data demonstrated that hypoxia can induce DYNLT1 phosphorylation at S82, which is involved in MTs and mitochondrion tuning. S82E makes this damage even worse while S82A prevents hypoxia-induced cellular dysfunction. Consequently, phosphorylation of S82 does play a role in MT assembly and mitochondrial permeabilization regulation and should be involved in studies dealing with cellular hypoxic tolerance.
Acknowledgments
This work was supported by National Natural Science Foundation of China (No. 81000833, 81071547), and partly by the Key Project of China National Programs for Basic Research and Development (“973” Project in China, 2012CB518101). The funders had no role in study design, data collection and analysis, decision to publish, or preparation of the manuscript. We also take this opportunity to express our deep mourning to Doctor Ya-dong Fang, the prime designer of this program and an excellent researcher in our team, who passed away because of an unexpected heart attack in July, 2012.
REFERENCES
- Al Rahim M, Thatipamula S, Hossain MA. Critical role of neuronal pentraxin 1 in mitochondria-mediated hypoxicischemic neuronal injury. Neurobiol Dis. 2013;50:59–68. doi: 10.1016/j.nbd.2012.10.003. [DOI] [PMC free article] [PubMed] [Google Scholar]
- Belmont LD, Mitchison TJ. Identification of a protein that interacts with tubulin dimers and increases the catastrophe rate of microtubules. Cell. 1996;84:623–631. doi: 10.1016/s0092-8674(00)81037-5. [DOI] [PubMed] [Google Scholar]
- Brito DA, Rieder CL. The ability to survive mitosis in the presence of microtubule poisons differs significantly between human nontransformed (RPE-1) and cancer (U2OS, HeLa) cells. Cell Motil Cytoskel. 2009;66:437–447. doi: 10.1002/cm.20316. [DOI] [PMC free article] [PubMed] [Google Scholar]
- Cassimeris L. Accessory protein regulation of microtubule dynamics throughout the cell cycle. Curr Opin Cell Biol. 1999;11:134–141. doi: 10.1016/s0955-0674(99)80017-9. [DOI] [PubMed] [Google Scholar]
- Chuang JZ, Milner TA, Sung CH. Subunit heterogeneity of cytoplasmic dynein: differential expression of 14 kDa dynein light chains in rat hippocampus. J Neurosci. 2001;21:5501–5512. doi: 10.1523/JNEUROSCI.21-15-05501.2001. [DOI] [PMC free article] [PubMed] [Google Scholar]
- Chuang JZ, Yeh TY, Bollati F, Conde C, Canavosio F, Caceres A, Sung CH. The dynein light chain Tctex-1 has a dynein-independent role in actin remodeling during neurite outgrowth. Dev Cell. 2005;9:75–86. doi: 10.1016/j.devcel.2005.04.003. [DOI] [PMC free article] [PubMed] [Google Scholar]
- Fang YD, Xu X, Dang YM, Zhang YM, Zhang JP, Hu JY, Zhang Q, Dai X, Teng M, Zhang DX, et al. MAP4 mechanism that stabilizes mitochondrial permeability transition in hypoxia: microtubule enhancement and DYNLT1 interaction with VDAC1. PLoS One. 2011;6:e28052. doi: 10.1371/journal.pone.0028052. [DOI] [PMC free article] [PubMed] [Google Scholar]
- Feng P, Liang C, Shin YC, Xiaofei E, Zhang W, Gravel R, Wu TT, Sun R, Usherwood E, Jung JU. A novel inhibitory mechanism of mitochondrion-dependent apoptosis by a herpesviral protein. PLoS Pathog. 2007;3:e174. doi: 10.1371/journal.ppat.0030174. [DOI] [PMC free article] [PubMed] [Google Scholar]
- Frezza C, Zheng L, Tennant DA, Papkovsky DB, Hedley BA, Kalna G, Watson DG, Gottlieb E. Metabolic profiling of hypoxic cells revealed a catabolic signature required for cell survival. PLoS One. 2011;6:e24411. doi: 10.1371/journal.pone.0024411. [DOI] [PMC free article] [PubMed] [Google Scholar]
- Hein S, Scheffold T, Schaper J. Ischemia induces early changes to cytoskeletal and contractile proteins in diseased human myocardium. J Thorac Cardiovasc Surg. 1995;110:89–98. doi: 10.1016/S0022-5223(05)80013-3. [DOI] [PubMed] [Google Scholar]
- Hu JY, Chu ZG, Han J, Dang YM, Yan H, Zhang Q, Liang GP, Huang YS. The p38/MAPK pathway regulates microtubule polymerization through phosphorylation of MAP4 and Op18 in hypoxic cells. Cell Mol Life Sci. 2010;67:321–333. doi: 10.1007/s00018-009-0187-z. [DOI] [PMC free article] [PubMed] [Google Scholar]
- Huang YS, Yang ZC, Yan BG, Yang JM, Chen FM, Crowther RS, Li A. Pathogenesis of early cardiac myocyte damage after severe burns. J Trauma. 1999;46:428–432. doi: 10.1097/00005373-199903000-00013. [DOI] [PubMed] [Google Scholar]
- Huang Y, Li Z, Yang Z. Roles of ischemia and hypoxia and the molecular pathogenesis of post-burn cardiac shock. Burns. 2003;29:828–833. doi: 10.1016/s0305-4179(03)00204-3. [DOI] [PubMed] [Google Scholar]
- Kinnally KW, Peixoto PM, Ryu SY, Dejean LM. Is mPTP the gatekeeper for necrosis, apoptosis, or both? Bba-Mol Cell Res. 2011a;1813:616–622. doi: 10.1016/j.bbamcr.2010.09.013. [DOI] [PMC free article] [PubMed] [Google Scholar]
- Kinnally KW, Peixoto PM, Ryu SY, Dejean LM. Is mPTP the gatekeeper for necrosis, apoptosis, or both? Biochim. Biophys. Acta. 2011b;1813:616–622. doi: 10.1016/j.bbamcr.2010.09.013. [DOI] [PMC free article] [PubMed] [Google Scholar]
- Liang B, Kong D, Liu Y, Liang N, He M, Ma S, Liu X. Autophagy inhibition plays the synergetic killing roles with radiation in the multi-drug resistant SKVCR ovarian cancer cells. Radiat Oncol. 2012;7:213. doi: 10.1186/1748-717X-7-213. [DOI] [PMC free article] [PubMed] [Google Scholar]
- Loos B, Genade S, Ellis B, Lochner A, Engelbrecht AM. At the core of survival: autophagy delays the onset of both apoptotic and necrotic cell death in a model of ischemic cell injury. Exp Cell Res. 2011;317:1437–1453. doi: 10.1016/j.yexcr.2011.03.011. [DOI] [PubMed] [Google Scholar]
- Makokha M, Hare M, Li M, Hays T, Barbar E. Interactions of cytoplasmic dynein light chains Tctex-1 and LC8 with the intermediate chain IC74. Biochemistry. 2002;41:4302–4311. doi: 10.1021/bi011970h. [DOI] [PubMed] [Google Scholar]
- Maldonado EN, Patnaik J, Mullins MR, Lemasters JJ. Free tubulin modulates mitochondrial membrane potential in cancer cells. Cancer Res. 2010;70:10192–10201. doi: 10.1158/0008-5472.CAN-10-2429. [DOI] [PMC free article] [PubMed] [Google Scholar]
- McCommis KS, Baines CP. The role of VDAC in cell death: friend or foe? Biochim. Biophys Acta. 2012;1818:1444–1450. doi: 10.1016/j.bbamem.2011.10.025. [DOI] [PMC free article] [PubMed] [Google Scholar]
- Mok YK, Lo KW, Zhang M. Structure of Tctex-1 and its interaction with cytoplasmic dynein intermediate chain. J Biol Chem. 2001;276:14067–14074. doi: 10.1074/jbc.M011358200. [DOI] [PubMed] [Google Scholar]
- Nagano F, Orita S, Sasaki T, Naito A, Sakaguchi G, Maeda M, Watanabe T, Kominami E, Uchiyama Y, Takai Y. Interaction of Doc2 with tctex-1, a light chain of cytoplasmic dynein. Implication in dynein-dependent vesicle transport. J Biol Chem. 1998;273:30065–30068. doi: 10.1074/jbc.273.46.30065. [DOI] [PubMed] [Google Scholar]
- Palmer KJ, MacCarthy-Morrogh L, Smyllie N, Stephens DJ. A role for Tctex-1 (DYNLT1) in controlling primary cilium length. Eur. J. Cell Biol. 2011;90:865–871. doi: 10.1016/j.ejcb.2011.05.003. [DOI] [PMC free article] [PubMed] [Google Scholar]
- Petronilli V, Miotto G, Canton M, Brini M, Colonna R, Bernardi P, Di Lisa F. Transient and long-lasting openings of the mitochondrial permeability transition pore can be monitored directly in intact cells by changes in mitochondrial calcein fluorescence. Biophys J. 1999;76:725–734. doi: 10.1016/S0006-3495(99)77239-5. [DOI] [PMC free article] [PubMed] [Google Scholar]
- Petronilli V, Penzo D, Scorrano L, Bernardi P, Di Lisa F. The mitochondrial permeability transition, release of cytochrome c and cell death. Correlation with the duration of pore openings in situ. J Biol Chem. 2001;276:12030–12034. doi: 10.1074/jbc.M010604200. [DOI] [PubMed] [Google Scholar]
- Putnam AJ, Cunningham JJ, Dennis RG, Linderman JJ, Mooney DJ. Microtubule assembly is regulated by externally applied strain in cultured smooth muscle cells. J Cell Sci. 1998;111:3379–3387. doi: 10.1242/jcs.111.22.3379. [DOI] [PubMed] [Google Scholar]
- Rogers SL, Gelfand VI. Membrane trafficking, organelle transport, and the cytoskeleton. Curr Opin Cell Biol. 2000;12:57–62. doi: 10.1016/s0955-0674(99)00057-5. [DOI] [PubMed] [Google Scholar]
- Rostovtseva TK, Bezrukov SM. VDAC inhibition by tubulin and its physiological implications. Biochim. Biophys Acta. 2012;1818:1526–1535. doi: 10.1016/j.bbamem.2011.11.004. [DOI] [PMC free article] [PubMed] [Google Scholar]
- Rusanen H, Majamaa K, Hassinen IE. Increased activities of antioxidant enzymes and decreased ATP concentration in cultured myoblasts with the 3243A-->G mutation in mitochondrial DNA. Biochim. Biophys Acta. 2000;1500:10–16. doi: 10.1016/s0925-4439(99)00081-2. [DOI] [PubMed] [Google Scholar]
- Sato H, Hori M, Kitakaze M, Iwai K, Takashima S, Kurihara H, Inoue M, Kamada T. Reperfusion after brief ischemia disrupts the microtubule network in canine hearts. Circ Res. 1993;72:361–375. doi: 10.1161/01.res.72.2.361. [DOI] [PubMed] [Google Scholar]
- Scharstuhl A, Mutsaers HA, Pennings SW, Russel FG, Wagener FA. Involvement of VDAC, Bax and ceramides in the efflux of AIF from mitochondria during curcumin-induced apoptosis. PLoS One. 2009;4:e6688. doi: 10.1371/journal.pone.0006688. [DOI] [PMC free article] [PubMed] [Google Scholar]
- Schwarzer C, Barnikol-Watanabe S, Thinnes FP, Hilschmann N. Voltage-dependent anion-selective channel (VDAC) interacts with the dynein light chain Tctex 1 and the heat-shock protein PBP74. Int J Biochem Cell Biol. 2002;34:1059–1070. doi: 10.1016/s1357-2725(02)00026-2. [DOI] [PubMed] [Google Scholar]
- Seko Y, Takahashi M, Tobe K, Kadowaki T, Yazaki Y. Hypoxia and hypoxia/reoxygenation activate p65(PAK), p38mi-togen-activated protein kinase (MAPK), and stress-activated protein kinase (SAPK) in cultured rat cardiac myocytes. Biochem Biophys Res Commun. 1997;239:840–844. doi: 10.1006/bbrc.1997.7570. [DOI] [PubMed] [Google Scholar]
- Sheldon KL, Maldonado EN, Lemasters JJ, Rostovtseva TK, Bezrukov SM. Phosphorylation of voltage-dependent anion channel by serine/threonine kinases governs its interaction with tubulin. PLoS One. 2011;6:e25539. doi: 10.1371/journal.pone.0025539. [DOI] [PMC free article] [PubMed] [Google Scholar]
- Song Y, Benison G, Nyarko A, Hays TS, Barbar E. Potential role for phosphorylation in differential regulation of the assembly of dynein light chains. J Biol Chem. 2007;282:17272–17279. doi: 10.1074/jbc.M610445200. [DOI] [PubMed] [Google Scholar]
- Song HP, Zhang L, Dang YM, Yan H, Chu ZG, Huang YS. The phosphatidylinositol 3-kinase-Akt pathway protects cardiomyocytes from ischaemic and hypoxic apoptosis via mitochondrial function. Clin Exp Pharmacol Physiol. 2010;37:598–604. doi: 10.1111/j.1440-1681.2010.05355.x. [DOI] [PubMed] [Google Scholar]
- Stavrovskaya IG, Kristal BS. The powerhouse takes control of the cell: is the mitochondrial permeability transition a viable therapeutic target against neuronal dysfunction and death? Free Radic Biol Med. 2005;38:687–697. doi: 10.1016/j.freeradbiomed.2004.11.032. [DOI] [PubMed] [Google Scholar]
- Takeuchi A, Mishina Y, Miyaishi O, Kojima E, Hasegawa T, Isobe K. Heterozygosity with respect to Zfp148 causes complete loss of fetal germ cells during mouse embryogenesis. Nat Genet. 2003;33:172–176. doi: 10.1038/ng1072. [DOI] [PubMed] [Google Scholar]
- Teng M, Dang YM, Zhang JP, Zhang Q, Fang YD, Ren J, Huang YS. Microtubular stability affects cardiomyocyte glycolysis by HIF-1alpha expression and endonuclear aggregation during early stages of hypoxia. Am J Physiol Heart Circ Physiol. 2010;298:H1919–1931. doi: 10.1152/ajpheart.01039.2009. [DOI] [PubMed] [Google Scholar]
- Tong DL, Zhang DX, Xiang F, Teng M, Jiang XP, Hou JM, Zhang Q, Huang YS. Nicotinamide pretreatment protects cardiomyocytes against hypoxia-induced cell death by improving mitochondrial stress. Pharmacology. 2012;90:11–18. doi: 10.1159/000338628. [DOI] [PubMed] [Google Scholar]
- Vandroux D, Schaeffer C, Tissier C, Lalande A, Bes S, Rochette L, Athias P. Microtubule alteration is an early cellular reaction to the metabolic challenge in ischemic cardiomyocytes. Mol Cell Biochem. 2004;258:99–108. doi: 10.1023/b:mcbi.0000012840.67616.cc. [DOI] [PubMed] [Google Scholar]
- Wan X, O’Quinn RP, Pierce HL, Joglekar AP, Gall WE, DeLuca JG, Carroll CW, Liu ST, Yen TJ, McEwen BF, et al. Protein architecture of the human kinetochore microtubule attachment site. Cell. 2009;137:672–684. doi: 10.1016/j.cell.2009.03.035. [DOI] [PMC free article] [PubMed] [Google Scholar]
- Wang G, Zhang BQ, Ruan J, Luo ZH, Zhang JP, Xiao R, Lei ZY, Hu JY, Chen YS, Huang YS. Shaking stress aggravates burn-induced cardiovascular and renal disturbances in a rabbit model. Burns. 2012;39:760–766. doi: 10.1016/j.burns.2012.09.007. [DOI] [PubMed] [Google Scholar]
- Williams JC, Xie H, Hendrickson WA. Crystal structure of dynein light chain TcTex-1. J Biol Chem. 2005;280:21981–21986. doi: 10.1074/jbc.M414643200. [DOI] [PubMed] [Google Scholar]
- Yeh TY, Peretti D, Chuang JZ, Rodriguez-Boulan E, Sung CH. Regulatory dissociation of Tctex-1 light chain from dynein complex is essential for the apical delivery of rhodopsin. Traffic. 2006;7:1495–1502. doi: 10.1111/j.1600-0854.2006.00482.x. [DOI] [PMC free article] [PubMed] [Google Scholar]
- Zang Q, Maass DL, Tsai SJ, Horton JW. Cardiac mitochondrial damage and inflammation responses in sepsis. Surg Infect. 2007;8:41–54. doi: 10.1089/sur.2006.033. [DOI] [PMC free article] [PubMed] [Google Scholar]
- Zhdanov AV, Dmitriev RI, Papkovsky DB. Bafilomycin A1 activates respiration of neuronal cells via uncoupling associated with flickering depolarization of mitochondria. Cell Mol Life Sci. 2011;68:903–917. doi: 10.1007/s00018-010-0502-8. [DOI] [PMC free article] [PubMed] [Google Scholar]


