Abstract
Purpose.
The nonpigmented ciliary epithelium (NPE) is rich in soluble adenylyl cyclase (sAC), a proposed cytoplasmic bicarbonate sensor. Here, we examine the contribution of sAC to an increase in cyclic AMP (cAMP) and changes in a key ion transporter, H+-ATPase, in NPE exposed to acetazolamide, a carbonic anhydrase inhibitor (CAI).
Methods.
Cyclic AMP was measured by radioimmunoassay in primary cultured porcine NPE. The pH-sensitive dye BCECF was used to examine cytoplasmic pH regulation. Subcellular protein translocation was examined by Western blot.
Results.
A transient cAMP increase, detectable within minutes of acetazolamide treatment, was prevented by KH7, a specific sAC inhibitor. Following 10-minute exposure to acetazolamide, the abundance of H+-ATPase B1 subunit and sAC was doubled in a plasma membrane-rich fraction, suggesting subcellular translocation. Similar evidence of H+-ATPase translocation was observed in NPE exposed to 8-Bromoadenosine 3′,5′-cyclic monophosphate (8-Br-cAMP). Consistent with increased capacity for proton export, acetazolamide increased the rate of pH recovery from acidification. KH7 and bafilomycin A1, an inhibitor of H+-ATPase, both prevented the stimulatory effect of acetazolamide on pH recovery. In a parallel study, H+-ATPase abundance was found to be higher in the plasma membrane of HEK293 cells that overexpress sAC compared to the normal HEK293 cells. HEK cells that overexpress sAC and had higher H+-ATPase abundance displayed a faster rate of pH recovery and greater sensitivity to KH7.
Conclusions.
Acetazolamide increases cAMP in a response that involves activation of sAC. Subcellular translocation of H+-ATPase and an increase in the capacity for proton export by acetazolamide-treated NPE cells is a cAMP-dependent response.
Keywords: acetazolamide, cytoplasmic pH, nonpigmented ciliary epithelium, soluble adenylyl cyclase, H+-ATPase
Acetazolamide (ACTZ) activated soluble adenylyl cyclase and increased cAMP in the nonpigmented ciliary epithelium (NPE). Increased cAMP caused translocation of H+-ATPase to the plasma membrane, increasing the capacity for proton export. Some ACTZ effects on the NPE may be related to cAMP signaling.
Introduction
It has become increasingly evident that the enzyme soluble adenylyl cyclase (sAC) acts as a cytoplasmic bicarbonate sensor in a wide variety of organisms including corals, teleost fish, and mammals.1,2 Soluble AC catalyzes the conversion of adenosine triphosphate (ATP) to 3′,5′ cyclic AMP (cAMP), and its activity is increased by a rise in the concentration of bicarbonate ions.1–3 Thus sAC enables cells to respond to a cytoplasmic bicarbonate increase by a rise in cAMP. Effectively, this links cAMP-dependent signaling pathways to cytoplasmic pH and CO2, which are in equilibrium with bicarbonate. Soluble AC activity has been reported in ciliary processes in the pig, mouse, and rabbit eye.4,5 Localization studies show sAC expression in the nonpigmented ciliary epithelium (NPE) of the ciliary process,4 the structure that secretes aqueous humor into the eye.
Here we report on the influence of carbonic anhydrase inhibitors (CAIs) on sAC. This is significant because CAIs are used widely to reduce aqueous humor formation as a glaucoma therapy.6–9 Carbonic anhydrase inhibitors target carbonic anhydrases with high selectivity, preventing catalysis of the reversible hydration of carbon dioxide to generate bicarbonate ions and protons. They reduce aqueous humor formation and intraocular pressure in all species that have been tested, including bovines,10 rabbits,11,12 dogs,13 monkeys,14 and humans,15 as well as in the intact porcine eye.16 Our past studies on ciliary epithelium of the porcine eye demonstrated robust expression of both membrane-bound (CAIV) and cytoplasmic (CAII) carbonic anhydrase in the NPE.16 The NPE also expresses chloride–bicarbonate exchanger (AE2), sodium–bicarbonate cotransporter (kNBC1), and sodium–hydrogen exchangers (NHE1 and NHE4).17 Jointly, these transporters are understood to play a key role in transporting anions across the bilayer in a blood-to-aqueous direction.18,19 Carbonic anhydrase activity likely influences the availability of H+ and HCO3− that drive the above-mentioned exchangers and cotransporters. However, there are still questions regarding their action as glaucoma drugs because CAIs are similarly effective in species that concentrate bicarbonate ions in the aqueous humor and species that do not concentrate bicarbonate. We considered the possibility that CAIs might increase cAMP in the ciliary epithelium. In rat renal cortical slices, acetazolamide is reported to increase cAMP in a concentration-dependent manner. It was found to stimulate adenylyl cyclase activity but had no discernible effect on the activity of cyclic nucleotide phosphodiesterase.20
It has been suggested that sAC plays a role in regulating renal tubule sodium transport.21 In the intercalated cells of the cortical collecting duct, sAC is known to regulate H+-ATPase-mediated proton transport.22 Previous studies by Wax and coworkers23 drew attention to plasma membrane-localized H+-ATPase in the NPE and reported changes in its subcellular distribution in response to isoproterenol and phorbol esters. Here, we report subcellular translocation of H+-ATPase, along with evidence for an increased capacity for proton export in NPE cells exposed to acetazolamide. The findings suggest that this was a cAMP-dependent response resulting from activation of sAC.
Materials and Methods
Cells and Reagents
Fresh porcine eyes were used to establish NPE cells in primary culture as described earlier.24 The cells were grown and propagated in HEPES-buffered Dulbecco's modified Eagle's medium (DMEM) containing 10% fetal bovine serum (FBS). The eyes were purchased from the University of Arizona Meat Science Laboratory or Hatfield Quality Meat (Hatfield, PA), and were transported to the laboratory on ice. The use of porcine tissue was approved by the University of Arizona Institutional Animal Care and Use Committee and conformed to the ARVO Statement for the Use of Animals in Ophthalmic and Vision Research.
HEK293 cells were obtained from American Type Culture Collection (ATCC, Manassas, VA). 4-4 cells (HEK293 transfected with sAC) were developed in the laboratory of two of the authors (LRL and JB). HEK293 cells were transfected with plasmid containing the soluble adenylyl cyclase (sACt) cDNA25,26 and placed under selection pressure with gentamycin. Resistant cells were selected, diluted to individual cell, and single clones were established; the sAC-overexpressing cells used in this study (4-4 cells) represent one such clone. Once single clones were grown for multiple generations, gentamycin was removed from the medium. Overexpression of sACt was periodically confirmed by Western blot or enzyme activity assay. Unlike what occurs with parental HEK293 cells, in 4-4 cells the majority of the intracellular cAMP that accumulates due to addition of the broad-specificity phosphodiesterase inhibitor IBMX is sAC dependent. HEK293 cells were grown in minimum essential medium (ATCC; Cat. No. 30-2003) supplemented with 10% FBS and 100 U/mL penicillin plus 100 μg/mL streptomycin. The 4-4 cells were grown in DMEM (Cell-grow, Cat. No. 10-017-CV [Mediatech, Inc., Manassas, VA]) supplemented with 10% FBS, 1.0% L-glutamine, and 100 U/mL penicillin plus 100 μg/mL streptomycin.
Prior to use, the cell monolayers were serum starved for 3 hours, and then the medium was replaced with Krebs solution containing (mM) 119 NaCl, 4.7 KCl, 1.2 KH2PO4, 25 NaHCO3, 2.5 CaCl2, 1 MgCl2, and 5.5 glucose, equilibrated with 5% CO2 and adjusted to pH 7.4. In specified experiments, 20 mM ammonium chloride was added to the Krebs solution, which was modified to contain 99 mM NaCl, in order to preserve normal osmolarity. Certain experiments were conducted using bicarbonate-free HEPES-buffered Krebs solution that contained 10 mM HEPES, 137 mM NaCl, and no added NaHCO3. In experiments using KH7, 0.1% bovine serum albumin (BSA) was added to the Krebs solution to aid KH7 solubility, and for those experiments 0.1% BSA was also added to control solutions. HCO3−-buffered Krebs solution was continuously bubbled with 5% CO2/95% air throughout the experiment. Bicarbonate-free HEPES-buffered Krebs solution was bubbled with nitrogen.
Acetazolamide, methazolamide, dimethyl sulfoxide (DMSO), 3-isobutyl-1-methylxanthine (IBMX), BSA, gentamycin, bafilomycin A1, Dowex 50W×4-400 ion exchange resin, phosphatase inhibitor cocktail 1, phosphatase inhibitor cocktail 2, and all other chemicals used for homogenization buffers and Krebs solution were purchased from Sigma (St. Louis, MO). KH7 ((±)-2-(1H-benzimidazol-2-ylthio)propanoic acid 2-[(5-bromo-2-hydroxyphenyl)methylene]hydrazide) was purchased from Tocris Biosciences (Minneapolis, MN). Protease inhibitor cocktail was obtained from Thermo Scientific (Pierce Biotechnology, Rockford, IL). HEPES-buffered DMEM, FBS, newborn calf serum, 2′,7′-bis-(2-carboxyethyl)-5-(and-6)-carboxyfluorescein (BCECF free acid), and 2′,7′-bis-(2-carboxyethyl)-5-(and-6)-carboxyfluorescein, acetoxymethyl ester (BCECF, AM) were each purchased from Life Technologies (Grand Island, NY). Adenosine 3′5′-cyclicphosphate, [5′,8-3H],(cAMP,[5′,8-3H]), and a cAMP radioimmunoassay kit (cAMP [125I] RIA Kit) were purchased from Perkin Elmer (Waltham, MA). Rabbit polyclonal anti-V-ATPase (H+-ATPase) B1 subunit antibody (N1C1-2) was purchased from Gene Tex, Inc. (Irvine, CA). Rabbit polyclonal anti-PDI (protein disulphide isomerase) antibody was purchased from Cell Signaling (Danvers, MA). Rabbit polyclonal anti-syndecan 4 antibody was obtained from Abcam (Cambridge, MA). Mouse monoclonal anti-sAC (ADCY10) antibody was obtained from CEP Biotech (Orlando, FL). Mouse monoclonal anti-Na,K-ATPase α1 antibody was purchased from Sigma. Rabbit polyclonal anti-β-actin antibody was obtained from Cell Signaling. Goat anti-mouse IRDye 800-conjugated and goat anti-rabbit IRDye 680-conjugated secondary antibodies were purchased from LI-COR Biosciences (Lincoln, NE).
Measurement of Cellular Cyclic AMP
Nonciliary pigmented epithelium monolayers grown to confluence on 35-mm dishes were preincubated with Krebs solution for 1 hour and then exposed to Krebs solution containing 500 μM acetazolamide; some cells also received IBMX (500 μM) and/or KH7 (50 μM). After incubation, the monolayers were washed briefly with ice-cold Krebs solution; 0.5 mL 10% trichloroacetic acid (TCA) was added, and the cells were scraped and collected in 2.0-mL Eppendorf tubes, frozen in liquid nitrogen, and stored at −80°C until further processing.
Cyclic AMP was extracted according to a modification of an earlier method.27 Frozen samples in the Eppendorf tubes were subjected to three cycles of freeze-thaw and then sonicated using a Misonix S3000 sonicator (Misonix, Newtown, CT; 6-W power setting, four strokes of 15 seconds each with a 5-second interval). After sonication, ∼4000 count per min (cpm) 3H-cAMP was added to each tube to determine recovery efficiency. At a specific activity of approximately 37 Ci/mmol and at a 50% counting efficiency, this represents approximately 0.1 pmol (100 fmol) cAMP. This was taken into account when calculating cAMP content of a sample. The samples were centrifuged at 13,000g for 30 minutes, and each supernatant was transferred to new Eppendorf tubes, designated as SN tubes. Each pellet was washed with 200 μL 10% TCA, briefly sonicated, and centrifuged again at 13,000g for 30 minutes; and the supernatant was transferred to the respective SN tube. The supernatant samples were used for cAMP assay, and pellet samples were used for protein measurement.
Cyclic AMP was extracted from the supernatant samples using ion exchange chromatography. Cation exchange columns (5 cm) were prepared using washed and preswollen (overnight) Dowex 50W×4-400 mesh cation exchange resin (H+-form) loaded into glass Pasteur pipettes (the narrow ends were plugged with glass wool). The columns were washed 10 times (1 mL each) with double-distilled water and 3 times (1 mL each) with 0.02 N HCl. Each supernatant sample (∼0.7 mL) was applied to a chromatography column, which was first washed with 0.5 mL water, and the eluted material discarded. The next 4 washes (1 mL each) were collected and pooled in glass tubes. The eluted samples were dried under a stream of air at 40°C. Dried samples were reconstituted in 400 μL cAMP assay buffer (Na-acetate buffer). A 100-μL aliquot of each reconstituted sample was mixed with 7 mL liquid scintillation fluid in a scintillation vial and counted using a beta counter to calculate recovery percentage. Recovery efficiency was calculated from the total and blank counts. Blank-count tubes contained only the assay buffer, and the total-count tubes contained 4000 cpm 3H-cAMP. Another 100 μL of the reconstituted cAMP solution from each sample was subjected to radioimmunoassay using a cAMP assay kit (Cat. No. NEK033001KT; Perkin Elmer) following the acetylated cAMP assay procedure recommended by the manufacturer. According to this protocol, each 100 μL (out of a total of 400 μL reconstituted cAMP solution) was acetylated with 5.0 μL acetylation reagent and then diluted to 1.0 mL with double-distilled water, giving an effective dilution of the assayed samples to 40-fold. Thus, cAMP measured in 100 μL was multiplied by 40 to calculate the total cAMP content in each sample. Results were expressed as pmol cAMP/mg protein. Protein was measured in the pellet by bicinchoninic acid (BCA) assay.
Western Blot Analysis
Nonciliary pigmented epithelial monolayers cultured to confluence on 60- or 100-mm dishes were equilibrated in Krebs solution for 3 hours in a humidified incubator (5% CO2, 37°C), then exposed to specified test compounds or the vehicle. After a specified time, the cells were harvested, and a plasma membrane-rich fraction was prepared as follows according to a published method28 with some modifications. The cells were harvested in an ice-cold hypotonic homogenization buffer (1:30 wt/vol) containing 50 mM mannitol, 5.0 mM N-(2-hydroxyethyl)piperazine-N-2-ethanesulfonic acid (HEPES), Complete Mini Protease Inhibitor cocktail tablets (Roche Diagnostics, Indianapolis, IN; three tablets/20 mL), and Phosphatase Inhibitor cocktails 1 and 2 (Calbiochem, Billerica, MA; 1:100 each, vol/vol), and the pH was adjusted to 7.4. The samples were then immediately homogenized for 1 minute (four strokes of 15 seconds at 5-second intervals) using Misonix S3000 sonicator at a 6-W power setting. Calcium chloride solution (1.0 M) was added to the homogenate to obtain a final concentration of 10 mM, and the sample was mixed gently at 0°C for 10 minutes on a belly dancer. Calcium causes selective aggregation of microsomes,29,30 eliminating the need for gradient ultracentrifugation. Calcium-induced membrane aggregates were then deposited as sediment by spinning at 13,000g for 30 minutes at 4°C. The slightly turbid supernatant containing the plasma membrane vesicles was then collected and subjected to ultracentrifugation at 4°C for 90 minutes and at 140,000g. The supernatant was discarded, and the pellet (the plasma membrane-rich fraction) was used for Western blot analysis.
The plasma membrane-rich fraction was dissolved in ice-cold Radioimmuno precipitation assay (RIPA) buffer containing (mM) 50 HEPES, 150 NaCl, 1.0 EDTA, 10 sodium pyrophosphate, 2.0 sodium orthovanadate, 10 sodium fluoride, and with 10% glycerol, 1.0% Triton X-100, 1.0% sodium deoxycholate, and Complete Mini Protease Inhibitor cocktail tablets (Roche Diagnostics; three tablets/20 mL) and Phosphatase Inhibitor cocktails 1 and 2 (Calbiochem; 1:100 each, vol/vol). The lysate in RIPA buffer was then subjected to Western blot analysis. Protein concentration in both the whole homogenate and the plasma membrane-rich fraction was measured with a BCA protein assay kit (Pierce Biotechnology).31
After mixing samples in RIPA buffer with an appropriate volume of Laemmli sample buffer, proteins were separated by electrophoresis on a 7.5% SDS-polyacrylamide minigel, then transferred to nitrocellulose membrane, which was blocked overnight with Aqua Block blocking buffer (East Coast Bio, North Berwic, ME). The nitrocellulose membranes were incubated overnight at 4°C with the following primary antibodies: rabbit polyclonal anti-V-ATPase B1 [N1C1-2] antibody (1:1000), mouse monoclonal anti-sAC (ADCY10, 1:2000) antibody, rabbit polyclonal anti-PDI (1:1000), mouse monoclonal Na,K-ATPase α1 antibody (1:1000), and rabbit polyclonal anti–β-actin (1:10,000) antibody. All antibodies were diluted in blocking buffer. After three washes in 30 mM Tris, 150 mM NaCl, 0.5% (vol/vol) Tween 20 (TTBS) at pH 7.4, each nitrocellulose membrane was incubated for 1 hour with an appropriate secondary antibody conjugated either with IRDye goat anti-mouse 800 or anti-rabbit 680 secondary antibodies (1:20,000) (LI-COR Biosciences). Protein bands were visualized, and band density was quantified by infrared laser scan detection (Odyssey; LI-COR Biosciences). Through the use of secondary antibodies at two different infrared wavelengths, two proteins were detected and quantified simultaneously.
Measurement of Cytoplasmic pH
Cytoplasmic pH was measured by imaging ratio fluorescence microscopy using the pH-sensitive dye BCECF. Nonpigmented epithelial cells grown to semiconfluence on a 35-mm plastic dish (Corning, Tewksbury, MA) were incubated for 10 minutes with BCECF-AM (5.0 μM) at 37°C as described earlier.17 Then the cells were washed five times with the Krebs solution and incubated for another 10 minutes in Krebs solution to allow de-esterification of the dye. De-esterification transforms BCECF-AM (the ester form) to the membrane-impermeable BCECF (acid form), which is trapped in the cytoplasm. After loading, the cells were washed several times to remove any traces of external dye. The dish containing the cells was then placed in a temperature-controlled perfusion microincubator (PDMI-2; Harvard Biosciences, Holliston, MA) on the stage of an upright epifluorescence microscope, where the preparation was superfused at a rate of 1.5 mL/min with control Krebs solution. Solution inflow and outflow rate was controlled using peristaltic pumps (Watson-Marlow, Cornwall, UK). The microscope was fitted with a high-resolution video camera (DVC 340M-00-CL; DVC Co., Austin, TX) to continuously monitor and record the BCECF fluorescence intensity in the cells. Fluorescence intensity was measured at an emission wavelength of 535 nm using alternating excitation wavelengths of 488 and 460 nm programmed by an InCyt Im2 imaging system (Intracellular Imaging, Inc., Cincinnati, OH). The fluorescence intensity ratio I488/I460 was calibrated by titrating BCECF-free acid with a range of buffers with defined pH values (5.49–8.5). Calibration was done in vitro using the calibration chamber supplied by the manufacturer (Intracellular Imaging, Inc.). The camera and the microscope settings used for the calibration and for conducting experiments were the same. Since cytoplasmic pH recovery rate varies between batches of cells, data from different batches were not pooled.
Results
Effect of Acetazolamide on cAMP
Studies were carried out to examine acetazolamide-induced cAMP generation in NPE cells in a CO2/HCO3− buffer or in a bicarbonate-free HEPES buffer. To prevent cAMP breakdown, the cells also were exposed to phosphodiesterase inhibitor IBMX (500 μM). The CAI elicited a sustained increase in cAMP when incubated in CO2/HCO3− buffer, detectable at 1 minute, with a peak response at 2 minutes (Fig. 1A). In contrast, when cells were exposed to acetazolamide in bicarbonate-free HEPES buffer for 2 to 15 minutes, the CAI failed to increase cAMP (Fig. 1B). Some cells were exposed to acetazolamide for 2 minutes in the presence of KH7 (50 μM) in CO2/HCO3− buffer. The magnitude of the acetazolamide-induced increase in cAMP was significantly reduced by KH7, a selective inhibitor of sAC26 (Fig. 2).
Figure 1.
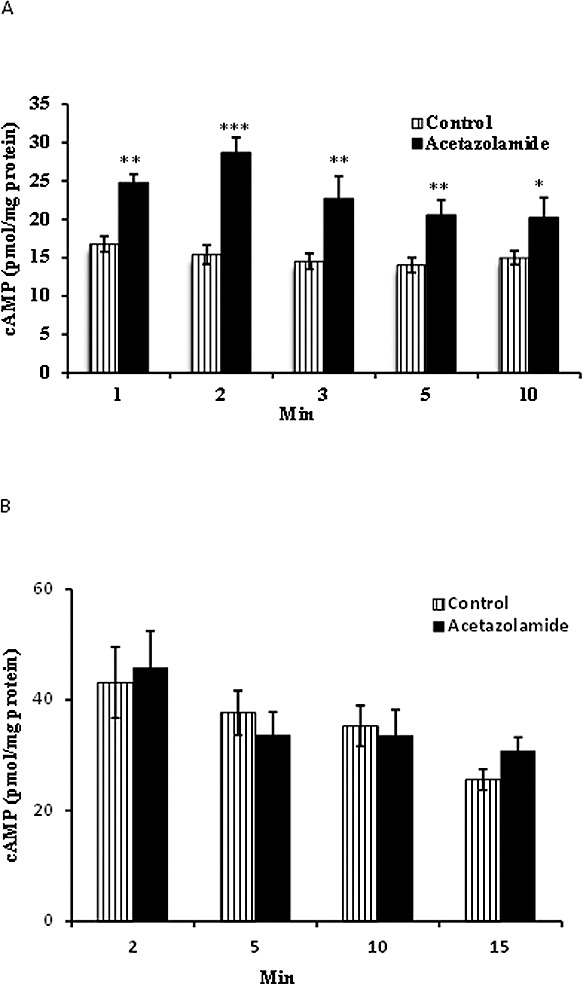
Time course of the cAMP increase detected in NPE cells exposed to acetazolamide (ACTZ, 500 μM) in normal CO2/HCO3−-buffered Krebs solution (A). (B) Cyclic AMP measured in cells exposed to acetazolamide in bicarbonate-free HEPES-buffered Krebs solution. All cells also were exposed to IBMX (500 μM), a phosphodiesterase inhibitor added throughout the experiment to prevent cAMP breakdown. The results are the mean ± SEM of six to eight individual measurements. ***, **, *Significant differences from the control (time zero) group at P < 0.001, P < 0.005, and P < 0.01, respectively.
Figure 2.
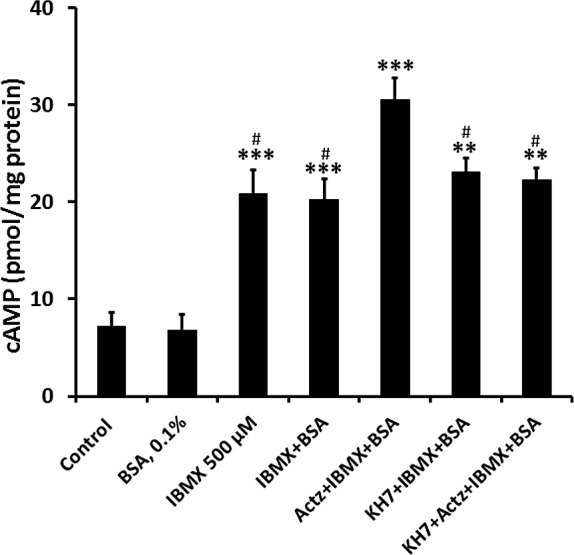
The influence of KH7 (50 μM) on cAMP detected in NPE cells exposed to acetazolamide (500 μM) for 2 minutes in CO2/HCO3−-buffered Krebs solution. Apart from the control group, all cells also were exposed to IBMX (500 μM), a phosphodiesterase inhibitor added throughout the experiment to prevent cAMP breakdown. The results are the mean ± SEM of six individual measurements. ***Significant difference from control, P < 0.001; ##significant difference from acetazolamide treatment, P < 0.01.
Effect of Acetazolamide on Subcellular Translocalization of sAC and H+-ATPase
When a plasma membrane-enriched fraction was isolated from cells exposed to acetazolamide, Western blot analysis revealed an increase in the abundance of sAC. In addition there was a marked increase in H+-ATPase, a proton export mechanism (Fig. 3A). The observed increase in both sAC and H+-ATPase was greatest in cells exposed to acetazolamide for 10 minutes. The abundance of the plasma membrane protein Na,K-ATPase α1, used here as a housekeeping control, remained unchanged in the plasma membrane-enriched fraction isolated from control and from the acetazolamide-treated cells. The findings point to subcellular translocation of sAC and H+-ATPase to the plasma membrane. As confirmation of plasma membrane enrichment, Western blot analysis of the membrane preparation compared to a cell lysate showed enrichment of syndecan-4, a plasma membrane marker,32 and depletion of protein disulphide isomerase (PDI), an endoplasmic reticulum marker33 (Fig. 3B).
Figure 3.
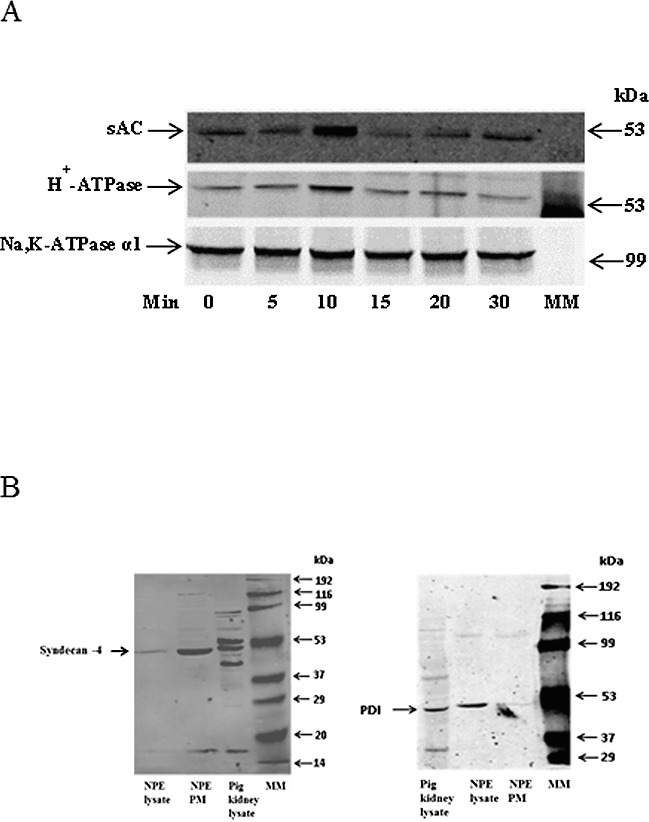
Time course of the increase in sAC and H+-ATPase (B1) detected in a plasma membrane-enriched preparation obtained from NPE cells exposed to CO2/HCO3−-buffered Krebs solution containing acetazolamide (500 μM) for 5 to 30 minutes. The Western blots in (A) show sAC (upper), H+-ATPase (middle), and Na,K-ATPase α1 (lower) immunoreactive bands. Na,K-ATPase α1, a plasma membrane protein, was used as a housekeeping control. MM: molecular marker lane. The Western blots in (B) show enrichment of the plasma membrane marker syndecan-4 (left) and depletion of the endoplasmic reticulum marker PDI (right) in the plasma membrane-enriched preparation compared to the whole cell lysate.
Effect of Acetazolamide on Cytoplasmic pH Recovery in CO2/HCO3− Buffer
Cultured porcine NPE cells were subjected to a 5-minute exposure to CO2/HCO3− Krebs solution containing 20 mM ammonium chloride, a standard experimental maneuver that causes cytoplasmic acidification (Fig. 4A). The rate of cytoplasmic pH (pHi) recovery, measured here as the slope of the pHi versus time record, reflects proton export and/or base import. In cells exposed to acetazolamide (500 μM), the rate of pH recovery almost doubled (Figs. 4B, 4C). A different CAI, methazolamide (500 μM), caused a similar increase in pH recovery rate (Fig. 4D). Acetazolamide did not cause any significant change in baseline pHi (control 7.17 ± 0.01 versus acetazolamide treated 7.16 ± 0.01). Exposure of the cells to the sAC inhibitor KH7 (50 μM) abolished the stimulatory effect of acetazolamide on the rate of pHi recovery (Fig. 4E).
Figure 4.
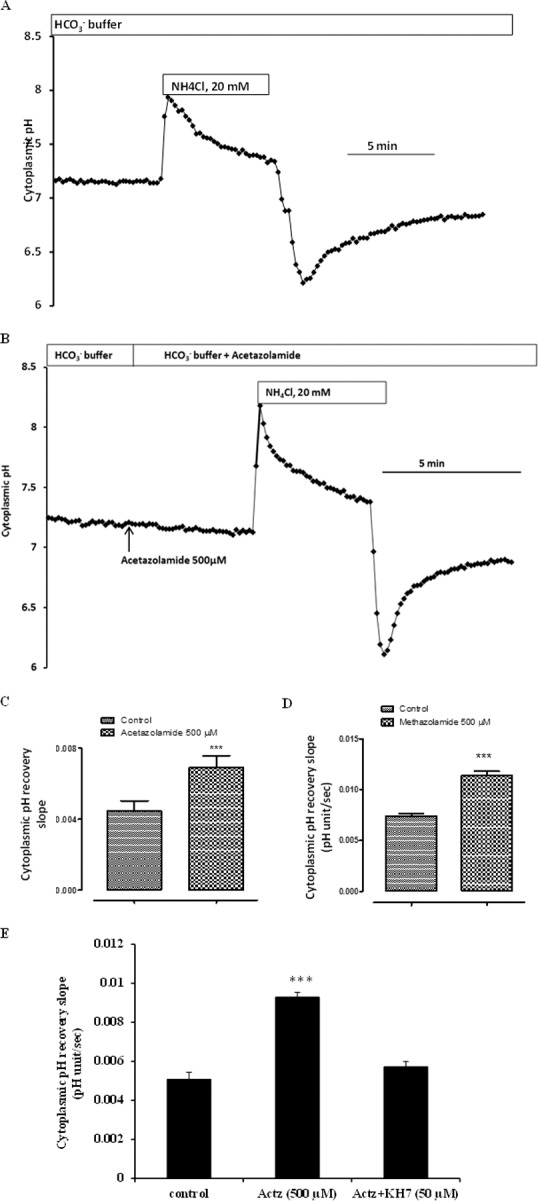
The influence of carbonic anhydrase inhibitors on the rate of pH recovery after an episode of cytoplasmic acidification. NPE cells loaded with the pH-sensitive dye BCECF were superfused with normal Krebs solution (CO2/HCO3− buffer, pH 7.4), and baseline cytoplasmic pH was recorded for ∼3 minutes. Then the cells were exposed for ∼5 minutes to Krebs solution containing 20 mM ammonium chloride. On removal of the ammonium chloride-containing solution, cytoplasmic pH decreased rapidly, then recovered toward baseline. (A, B) Typical recordings in control and in acetazolamide-treated cells, respectively. The slope of the first 1 minute of pH recovery was measured and compared. (C, D) Pooled data on the rate of pH recovery in control cells and cells exposed to acetazolamide or methazolamide (500 μM) throughout the experiment. (E) The rate of pH recovery measured in cells that were preincubated with KH7 (50 μM), a selective sAC inhibitor, then exposed to acetazolamide in the continued presence of KH7. The results are the mean ± SEM of five to eight individual experiments, each of which represents pooled recordings from 20 to 25 cells. ***Significant difference from control, P < 0.001.
Effect of Acetazolamide on Cytoplasmic pH Recovery in Bicarbonate-Free Buffer
The rate of cytoplasmic pH (pHi) recovery was low in cells bathed in bicarbonate-free HEPES-buffered Krebs solution (Fig. 5A), and under bicarbonate-free conditions acetazolamide failed to increase the pHi recovery rate (Figs. 5B, 5C). The finding indicates that presence of bicarbonate is required for acetazolamide to enhance pHi recovery and prompted us to examine the role of sAC and cAMP. Based on reasoning that the effect of acetazolamide on pHi recovery is linked to cAMP, some cells were exposed to the phosphodiesterase inhibitor IBMX (500 μM) in a strategy to increase cAMP in the absence of a CAI. In the presence of IBMX (500 μM), the cytoplasmic pHi recovery rate more than doubled (Fig. 6).
Figure 5.
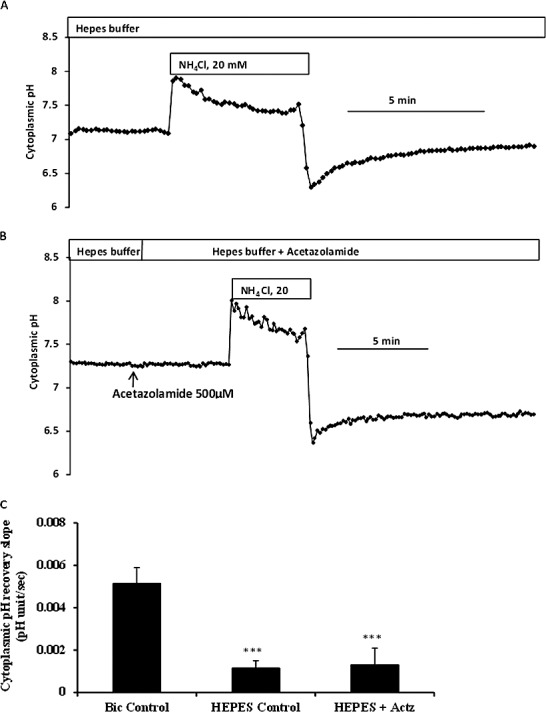
The influence of bicarbonate ion concentration on the rate of pH recovery after an episode of cytoplasmic acidification. BCEFC-loaded NPE cells were subjected to an episode of acidification by exposure for 5 minutes to 20 mM ammonium chloride either in CO2/HCO3−-buffered Krebs solution or in bicarbonate-free HEPES-buffered Krebs solution; then the rate of cytoplasmic pH recovery was measured. (A, B) Typical recordings in control and in acetazolamide-treated cells, superfused with HEPES-buffered Krebs solution, respectively. (C) Pooled data on the rate of pH recovery for cells that were superfused throughout the experiment with CO2/HCO3−-buffered Krebs solutions (Bic Control), superfused throughout the experiment with bicarbonate-free HEPES-buffered Krebs solution (HEPES Control), or superfused with HEPES-buffered Krebs solutions containing acetazolamide (500 μM) (HEPES+ACTZ). The results are the mean ± SEM of five to seven individual experiments. ***Significant difference from bicarbonate (Bic) control group, P < 0.001.
Figure 6.
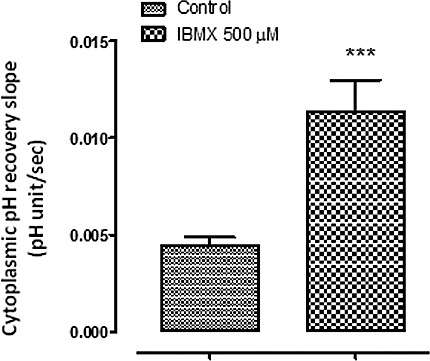
The influence of IBMX on the rate of pH recovery. BCEFC-loaded NPE cells were subjected to an episode of acidification by exposure for 5 minutes to Krebs solution containing 20 mM ammonium chloride; then the rate of cytoplasmic pH recovery was measured. One group of cells was superfused throughout the experiment with CO2/HCO3−-buffered Krebs solution containing IBMX (500 μM), and a second group was superfused with control CO2/HCO3−-buffered Krebs solution. The results are the mean ± SEM of five to seven individual experiments. **Significant difference from the control group, P < 0.001.
Effect of Bafilomycin A1 on Acetazolamide-Induced Stimulation of pHi Recovery
The increase in subcellular localization of H+-ATPase to the plasma membrane in acetazolamide-treated cells points to greater capacity for proton export, and this is consistent with the observed increase in the rate of pH recovery. Consistent with the involvement of H+-ATPase, the stimulatory effect of acetazolamide on the rate of pH recovery was abolished when cells were exposed to acetazolamide in the presence of the H+-ATPase inhibitor bafilomycin A1 (100 nM) (Fig. 7). To confirm the notion that the H+-ATPase subcellular localization response is cAMP dependent, some cells were exposed to 8-Bromoadenosine 3′,5′-cyclic monophosphate (8-Br-cAMP). A significant increase in the abundance of H+-ATPase was noted in the plasma membrane-enriched fraction isolated from cells exposed to 8-Br-cAMP (Fig. 8), while the abundance of Na,K-ATPase α1, probed here as a plasma membrane control, remained unchanged.
Figure 7.
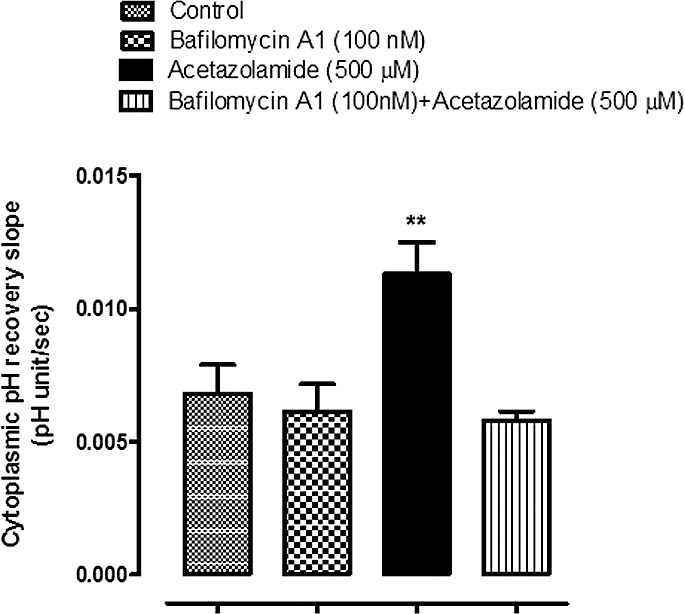
The influence of bafilomycin A1 on the rate of pH recovery after an episode of cytoplasmic acidification. BCEFC-loaded NPE cells were subjected to an episode of acidification by exposure for 5 minutes to Krebs solution containing 20 mM ammonium chloride; then the rate of cytoplasmic pH recovery was measured. One group of cells was superfused throughout the experiment with CO2/HCO3−-buffered Krebs solutions containing bafilomycin A1 (100 nM); a second group was superfused with bafilomycin A1 (100 nM) + acetazolamide (500 μM); and a third group was exposed to control CO2/HCO3−-buffered Krebs solutions. The results are the mean ± SEM of five to seven individual experiments. ***Significant difference from the control group, P < 0.001.
Figure 8.
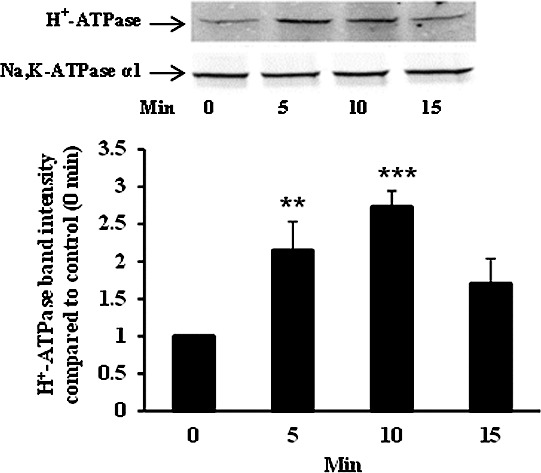
Time course of the H+-ATPase (B1) increase detected in a plasma membrane-enriched preparation obtained from NPE cells exposed to 8-Br-cAMP (1 mM) for 5 to 15 minutes. A representative Western blot is shown (upper panel) together with a bar graph (lower panel) that shows band density results pooled from three independent experiments (mean ± SEM). Na,K-ATPase α1 was used as a housekeeping control. ***, **Significant difference from control at P < 0.01 and P > 0.05, respectively.
pH Recovery Response in sAC-Transfected HEK293 Cells
To further examine the apparent link between H+-ATPase and sAC, abundance of H+-ATPase and sAC as well as pH recovery was examined in HEK293 cells stably transfected with sAC. In comparison to normal HEK293 cells, the abundance of sAC and H+-ATPase was markedly higher in plasma membrane-enriched material obtained from HEK293 cells stably transfected with sAC (Fig. 9). Compared to that in normal HEK293 cells, the rate of pH recovery was approximately 5-fold higher in cells that overexpress sAC (Fig. 10). In addition, cells that overexpress sAC were found to be more sensitive to the sAC inhibitor KH7. In the presence of KH7 (50 μM), the pH recovery rate was reduced by ∼50% in sAC-overexpressing cells compared to no significant inhibition in normal HEK293 cells (Fig. 10).
Figure 9.

Comparison of sAC and H+-ATPase (B1) and β actin detected by Western blot in HEK293 cells (three left lanes) and 4-4 cells, transfected HEK293 cells that overexpress sAC (three right lanes). Each lane represents material isolated from a different batch of cells.
Figure 10.
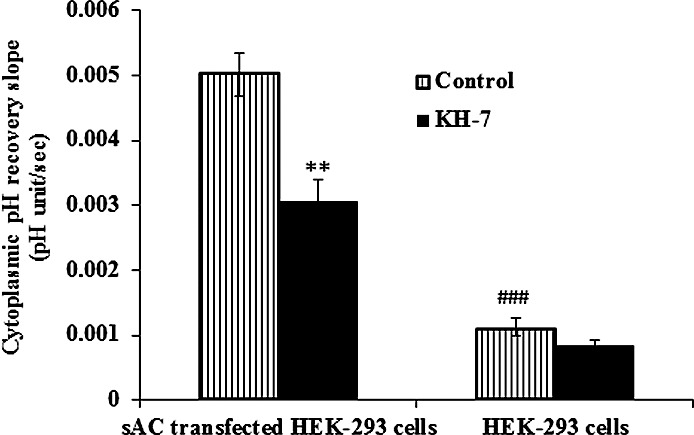
Comparison of the effect of KH7 on pH recovery responses in HEK293 cells and sAC-transfected HEK293 cells (4-4 cells). BCEFC-loaded cells were subjected to an episode of acidification by exposure for 5 minutes to CO2/HCO3−-buffered Krebs solution containing 20 mM ammonium chloride; then the rate of cytoplasmic pH recovery was measured in normal CO2/HCO3−-buffered Krebs solution with or without KH7 (50 μM) added throughout the course of the experiment. The results are the mean ± SEM of five or six individual experiments. **Significant difference between control and KH7-treated 4-4 cells, P < 0.01; ###Significant difference between control HEK293 and 4-4 cells, P < 0.001.
Discussion
It has been reported previously that sAC is highly expressed in the NPE layer,4,5 and here we show evidence suggesting that it becomes activated, causing an increase in cAMP, when the cells are exposed to the CAI acetazolamide. A rise in cAMP, detectable within minutes of acetazolamide treatment, was prevented by KH7, an inhibitor reported to be selective for sAC.6 We acknowledge the possibility that the response of isolated cells and the intact eye may be different, but we know from an earlier study that acetazolamide lowers aqueous humor formation and intraocular pressure in the porcine eye.16 The rise of cAMP concentration caused by sAC activation in turn stimulated recruitment of H+-ATPase to the plasma membrane, and a change in pH regulation observed as an increased rate of pH recovery. In this respect the NPE differs from the epididymis, where acetazolamide prevented sAC-dependent H+-ATPase translocation as did inhibition of sAC with catechol estrogen.34 The different responses suggest a complex and variable relationship between carbonic anhydrases and sAC. We acknowledge that Na+/H+ exchange (NHE), sodium–bicarbonate cotransport (NBC), and chloride–bicarbonate exchange (AE) all may influence the rate of pH recovery.16,17 While we cannot rule out effects of acetazolamide or KH7 on NHE, NBC, or AE, the specific inhibitor of sAC (KH7) completely eliminated the acetazolamide-induced increase of pHi recovery rate in NPE cells.
The acetazolamide-induced, KH7-sensitive increase in cAMP is consistent with sAC activation. The rise of cAMP did not occur in cells exposed to acetazolamide under bicarbonate-free conditions. The ability of bicarbonate-free medium to eliminate the acetazolamide-induced cAMP increase is consistent with bicarbonate-dependent sAC activation, and the findings argue against a direct effect of acetazolamide on sAC. Carbonic anhydrase inhibitor effects on cAMP are not confined to the NPE. Acetazolamide increases cAMP in several tissues including rat renal cortical slices in vitro20 and rat liver.35 In these cases, however, the role of sAC has not been defined. In liver, acetazolamide induces glycogenolysis through an indirect mechanism dependent upon the release of some endogenous factor such as glucagon or epinephrine that, in turn, increases cAMP.35 In the kidney it has been suggested that stimulation of cAMP production may be part of the mechanism by which acetazolamide produces phosphaturia.20 Interpretation of cAMP effects on the NPE is difficult because aqueous formation, the primary function of NPE, can be lowered by beta adrenergic blockade that reduces cAMP but also lowered by maneuvers that increase cAMP.27 Still, there is a well-known link between elevated cAMP concentration in the aqueous humor and decrease in the rate of aqueous formation.36,37
A low rate of pH recovery in the absence of extracellular bicarbonate points to the significant contribution of bicarbonate entry via a mechanism such as a sodium–bicarbonate cotransporter. The acetazolamide-induced transient increase in cAMP caused an increase in the capacity of NPE cells for H+-ATPase-mediated proton export activity seen as an increase in the bafilomycin A1-sensitive rate of cytoplasmic pH recovery following an episode of acidification. The evidence for sAC/cAMP-dependence of the response is as follows: The pH recovery response to acetazolamide was absent in bicarbonate-free medium, mimicked when IBMX was used to elevate cAMP, and abolished when KH7 was used to inhibit sAC. A similar, although slightly faster, increase of plasma membrane H+-ATPase abundance was found in cells exposed to 8-Br-cAMP, suggesting that subcellular translocation of H+-ATPase is cAMP dependent. The 8-Br-cAMP effect may be faster because it does not require sAC activation and endogenous cAMP formation. It is also the case that 8-Br-cAMP is relatively resistant to breakdown by phosphodiesterases,38,39 and this may explain why 8-Br-cAMP-mediated translocation of H+-ATPase remains increased at 15 minutes while acetazolamide, which caused a transient cAMP rise, had an effect on translocation that decayed after 10 minutes. Our results are consistent with an earlier study in which experiments on intact rabbit ciliary body exposed to isoproterenol led Wax and coworkers23 to conclude that a rise of cAMP is capable of causing a marked change in the distribution of H+-ATPase. These investigators showed reduction of IOP when the H+-ATPase inhibitor bafilomycin A1 was applied topically to the surface of the rabbit cornea. They proposed that H+-ATPase at the plasma membrane might contribute to bicarbonate transport across the ciliary epithelium as is the case in the intercalated cells of the renal collecting duct.
Considering the mechanism responsible for the increased rate of pH recovery in acetazolamide-treated cells, we acknowledge the possibility that increased pH recovery following sAC activation could feasibly be the result of cAMP-mediated activation of sodium–hydrogen exchanger (NHE). Indeed, our earlier studies on astrocytes showed that an increase in cAMP activates NHE.40 In the present study, however, this seems unlikely since the H+-ATPase inhibitor bafilomycin A1 abolished the acetazolamide-induced stimulation of pH recovery. We are unable to rule out a change of H+-ATPase specific activity in addition to changes in subcellular localization. Certainly a change of H+-ATPase specific activity could influence the increased ability of acetazolamide-treated cells to recover from acidification.
Cyclic AMP signaling is understood to be compartmentalized into domains in a way that permits functional separation of cAMP-dependent pathways that have different purposes. This might explain why sAC has been localized to a variety of subcellular compartments.3 In the intercalated cells of the renal tubule22 and clear cells of the epididymis and vas deferens that transport protons into the lumen,34 sAC was discovered to be associated with H+-ATPase at the surface of the cell. In the present study, acetazolamide transiently increased the abundance of sAC and H+-ATPase determined by Western blot analysis to be associated with a plasma membrane-enriched fraction. For both proteins, the maximum translocation response was observed after 10-minute acetazolamide treatment. Soluble AC is not a transmembrane protein but can appear as a membrane-associated protein.3,41 In sea urchin sperm flagella, immunoprecipitation studies show sAC complexes with 10 plasma membrane proteins including Na+/H+ exchanger, membrane-bound guanylyl cyclase, Guanosine 3′,5′-cyclic monophosphate (cGMP-specific) phosphodiesterase 5A, and cyclic nucleotide-gated ion channel.42 In most cells, including the sAC-overexpressing HEK 293 cells used in the present study, sAC is distributed in the cytoplasmic as well as the particulate fractions.25,26 In the present study, acetazolamide increased the abundance of both sAC and H+-ATPase determined by Western blot analysis to be associated with a plasma membrane-enriched fraction. It is noteworthy that H+-ATPase abundance in the plasma membrane-enriched preparation was higher in HEK293 cells that overexpress sAC (4-4 cells) compared to normal HEK293 cells. In a manner consistent with functional association between sAC and H+-ATPase, HEK cells that overexpress sAC and had high H+-ATPase abundance displayed a faster baseline rate of pH recovery and greater sensitivity to KH7, the sAC inhibitor. KH7 inhibited the response by approximately 50% in sAC-overexpressing cells, and we acknowledge the possibility that overexpression of sAC might have caused changes to other acid/base transporters.
Soluble AC serves as a bicarbonate sensor in a wide range of tissues.1–3 It responds to increasing bicarbonate ion concentration by catalyzing the formation of cAMP and thus exerting a potential effect on a broad range of cell functions that are regulated by cAMP-dependent signaling pathways. Here the sAC-dependent rise of cAMP points to an increase of bicarbonate concentration in NPE exposed to acetazolamide. Because cells may have multiple carbonic anhydrases, some possibly coupled to bicarbonate transporters such as AE2 to form a metabolon,43,44 it is not a straightforward matter to predict the net effect of carbonic anhydrase inhibition on cytoplasmic bicarbonate concentration or the pH and concentration of bicarbonate in unstirred layers adjacent to the plasma membrane. A rise in cellular bicarbonate could be explained if, for example, AE2-mediated bicarbonate export from the NPE was slowed as the result of carbonic anhydrase inhibition. Porcine NPE is rich in AE2.16 It also should be kept in mind that NPE expresses both membrane-bound (CAIV) and cytoplasmic (CAII) carbonic anhydrase.16 The response of different tissues to acetazolamide may not be similar if there are differences in the quantitative distribution of membrane-bound and cytoplasmic carbonic anhydrases. Indeed, in some tissues it has been reported that acetazolamide causes H+-ATPase inhibition by reducing the abundance of H+-ATPase at the cell surface.34,45
It is worth noting that in addition to serving as the site of aqueous humor (AH) secretion, the NPE has functional significance as a neuroendocrine tissue that secretes a range of neuropeptides.46 With respect to maintenance of intraocular pressure, which is dependent on the balance between AH formation and drainage, it has been suggested that regulation of aqueous humor drainage from the eye is dependent on secretion of substances into the aqueous humor by the NPE in response to activation of sAC.4 In mice, inhibition of sAC caused an increase of intraocular pressure. Here, the findings indicate that carbonic anhydrase inhibition by acetazolamide causes activation of sAC and increases cAMP in the NPE. Subcellular translocation of H+-ATPase and an increase in the capacity for proton export occurs in NPE cells exposed to acetazolamide and is a cAMP-dependent response. This raises the possibility that some functional effects of carbonic anhydrase inhibitors on the NPE may be related to cAMP signaling.
Acknowledgments
The authors thank the University of Arizona Meat Science Laboratory and Hatfield Quality Meat, Pennsylvania, for the supply of porcine eyes.
Supported by National Institutes of Health Grant EY006915. The authors alone are responsible for the content and writing of the paper.
Disclosure: M. Shahidullah, None; A. Mandal, None; G. Wei, None; L.R. Levin, CEP Biotech (I, C), P; J. Buck, CEP Biotech (I, C), P; N.A. Delamere, None
References
- 1. Tresguerres M, Parks SK, Salazar E, Levin LR, Goss GG, Buck J. Bicarbonate-sensing soluble adenylyl cyclase is an essential sensor for acid/base homeostasis. Proc Natl Acad Sci U S A. 2010; 107: 442–447 [DOI] [PMC free article] [PubMed] [Google Scholar]
- 2. Zippin JH, Levin LR, Buck J. CO(2)/HCO(3)(-)-responsive soluble adenylyl cyclase as a putative metabolic sensor. Trends Endocrinol Metab. 2001; 12: 366–370 [DOI] [PubMed] [Google Scholar]
- 3. Tresguerres M, Levin LR, Buck J. Intracellular cAMP signaling by soluble adenylyl cyclase. Kidney Int. 2011; 79: 1277–1288 [DOI] [PMC free article] [PubMed] [Google Scholar]
- 4. Lee YS, Tresguerres M, Hess K, et al. Regulation of anterior chamber drainage by bicarbonate-sensitive soluble adenylyl cyclase in the ciliary body. J Biol Chem. 2011; 286: 41353–41358 [DOI] [PMC free article] [PubMed] [Google Scholar]
- 5. Mittag TW, Guo WB, Kobayashi K. Bicarbonate-activated adenylyl cyclase in fluid-transporting tissues. Am J Physiol. 1993; 264: F1060–F1064 [DOI] [PubMed] [Google Scholar]
- 6. Sugrue MF. Pharmacological and ocular hypotensive properties of topical carbonic anhydrase inhibitors. Prog Retin Eye Res. 2000; 19: 87–112 [DOI] [PubMed] [Google Scholar]
- 7. Hartenbaum D. The efficacy of dorzolamide, a topical carbonic anhydrase inhibitor, in combination with timolol in the treatment of patients with open-angle glaucoma and ocular hypertension. Clin Ther. 1996; 18: 460–465 [DOI] [PubMed] [Google Scholar]
- 8. Sugrue MF. The preclinical pharmacology of dorzolamide hydrochloride, a topical carbonic anhydrase inhibitor. J Ocul Pharmacol Ther. 1996; 12: 363–376 [DOI] [PubMed] [Google Scholar]
- 9. Lee AJ, Goldberg I. Emerging drugs for ocular hypertension. Exp Opin Emerg Drugs. 2011; 16: 137–161 [DOI] [PubMed] [Google Scholar]
- 10. Shahidullah M, Wilson WS, Yap M, To CH. Effects of ion transport and channel-blocking drugs on aqueous humor formation in isolated bovine eye. Invest Ophthalmol Vis Sci. 2003; 44: 1185–1191 [DOI] [PubMed] [Google Scholar]
- 11. Caprioli J, Sears M. Combined effect of forskolin and acetazolamide on intraocular pressure and aqueous flow in rabbit eyes. Exp Eye Res. 1984; 39: 47–50 [DOI] [PubMed] [Google Scholar]
- 12. Kodama T, Reddy VN, Macri FJ. Pharmacological study on the effects of some ocular hypotensive drugs on aqueous humor formation in the arterially perfused enucleated rabbit eye. Ophthalmic Res. 1985; 17: 120–124 [DOI] [PubMed] [Google Scholar]
- 13. Maren TH. The rates of movement of Na+, Cl-, and HCO-3 from plasma to posterior chamber: effect of acetazolamide and relation to the treatment of glaucoma. Invest Ophthalmol. 1976; 15: 356–364 [PubMed] [Google Scholar]
- 14. Wang RF, Serle JB, Podos SM, Sugrue MF. MK-507 (L-671, 152), a topically active carbonic anhydrase inhibitor, reduces aqueous humor production in monkeys. Arch Ophthalmol. 1991; 109: 1297–1299 [DOI] [PubMed] [Google Scholar]
- 15. Dailey RA, Brubaker RF, Bourne WM. The effects of timolol maleate and acetazolamide on the rate of aqueous formation in normal human subjects. Am J Ophthalmol. 1982; 93: 232–237 [DOI] [PubMed] [Google Scholar]
- 16. Shahidullah M, To C-H, Pelis RM, Delamere NA. Studies on bicarbonate transporters and carbonic anhydrase in porcine nonpigmented ciliary epithelium. Invest Ophthalmol Vis Sci. 2009; 50: 1791–1800 [DOI] [PMC free article] [PubMed] [Google Scholar]
- 17. Shahidullah M, Mandal A, Delamere NA. Responses of sodium-hydrogen exchange to nitric oxide in porcine cultured nonpigmented ciliary epithelium. Invest Ophthalmol Vis Sci. 2009; 50: 5851–5858 [DOI] [PMC free article] [PubMed] [Google Scholar]
- 18. Do CW, Civan MM. Basis of chloride transport in ciliary epithelium. J Membr Biol. 2004; 200: 1–13 [DOI] [PubMed] [Google Scholar]
- 19. Civan MM. Transport components of net secretion of the aqueous humour and their integrated regulation. In: Civan MM. ed The Eye's Aqueous Humor: From Secretion to Glaucoma. San Diego: Academic Press; 1998: 1–24 [Google Scholar]
- 20. Rodriguez HJ, Walls J, Yates J, Klahr S. Effects of acetazolamide on the urinary excretion of cyclic AMP and on the activity of renal adenyl cyclase. J Clin Invest. 1974; 53: 122–130 [DOI] [PMC free article] [PubMed] [Google Scholar]
- 21. Hallows KR, Wang H, Edinger RS, et al. Regulation of epithelial Na+ transport by soluble adenylyl cyclase in kidney collecting duct cells. J Biol Chem. 2009; 284: 5774–5783 [DOI] [PMC free article] [PubMed] [Google Scholar]
- 22. Paunescu TG, Da Silva N, Russo LM, et al. Association of soluble adenylyl cyclase with the V-ATPase in renal epithelial cells. Am J Physiol Renal Physiol. 2008; 294: F130–F138 [DOI] [PubMed] [Google Scholar]
- 23. Wax MB, Saito I, Tenkova T, et al. Vacuolar H+-ATPase in ocular ciliary epithelium. Proc Natl Acad Sci U S A. 1997; 94: 6752–6757 [DOI] [PMC free article] [PubMed] [Google Scholar]
- 24. Shahidullah M, Tamiya S, Delamere NA. Primary culture of porcine nonpigmented ciliary epithelium. Curr Eye Res. 2007; 32: 511–522 [DOI] [PMC free article] [PubMed] [Google Scholar]
- 25. Buck J, Sinclair ML, Schapal L, Cann MJ, Levin LR. Cytosolic adenylyl cyclase defines a unique signaling molecule in mammals. Proc Natl Acad Sci U S A. 1999; 96: 79–84 [DOI] [PMC free article] [PubMed] [Google Scholar]
- 26. Hess KC, Jones BH, Marquez B, et al. The “soluble” adenylyl cyclase in sperm mediates multiple signaling events required for fertilization. Dev Cell. 2005; 9: 249–259 [DOI] [PMC free article] [PubMed] [Google Scholar]
- 27. Shahidullah M, Wilson WS, Millar C. Effects of timolol, terbutaline and forskolin on IOP, aqueous humour formation and ciliary cyclic AMP levels in the bovine eye. Curr Eye Res. 1995; 14: 519–528 [DOI] [PubMed] [Google Scholar]
- 28. Lin PH, Selinfreund R, Wakshull E, Wharton W. Rapid and efficient purification of plasma membrane from cultured cells: characterization of epidermal growth factor binding. Biochemistry. 1987; 26: 731–736 [DOI] [PubMed] [Google Scholar]
- 29. Kamath SA, Rubin E. Interaction of calcium with microsomes: a modified method for the rapid isolation of rat liver microsomes. Biochem Biophys Res Commun. 1972; 49: 52–59 [DOI] [PubMed] [Google Scholar]
- 30. Schenkman JB, Cinti DL. Preparation of microsomes with calcium. Meth Enzymol. 1978; 52: 83–89 [DOI] [PubMed] [Google Scholar]
- 31. Smith PK, Krohn RI, Hermanson GT, et al. Measurement of protein using bicinchoninic acid. Anal Biochem. 1985; 150: 76–85 [DOI] [PubMed] [Google Scholar]
- 32. Podyma-Inoue KA, Hara-Yokoyama M, Shinomura T, Kimura T, Yanagishita M. Syndecans reside in sphingomyelin-enriched low-density fractions of the plasma membrane isolated from a parathyroid cell line. PLoS One. 2012; 7: e32351 [DOI] [PMC free article] [PubMed] [Google Scholar]
- 33. Huppa JB, Ploegh HL. The eS-Sence of -SH in the ER. Cell. 1998; 92: 145–148 [DOI] [PubMed] [Google Scholar]
- 34. Pastor-Soler N, Beaulieu V, Litvin TN, et al. Bicarbonate-regulated adenylyl cyclase (sAC) is a sensor that regulates pH-dependent V-ATPase recycling. J Biol Chem. 2003; 278: 49523–49529 [DOI] [PMC free article] [PubMed] [Google Scholar]
- 35. Beth H. Studies on the mechanism of action of acetazolamide in the prophylaxis of hyperkalemic periodic paralysis. Life Sci. 1977; 20: 343–349 [DOI] [PubMed] [Google Scholar]
- 36. Neufeld AH, Jampol LM, Sears ML. Cyclic-AMP in the aqueous humor: the effects of adrenergic agents. Exp Eye Res. 1972; 14: 242–250 [DOI] [PubMed] [Google Scholar]
- 37. Liu JH. Aqueous humor messengers in the transient decrease of intraocular pressure after ganglionectomy. Invest Ophthalmol Vis Sci. 1992; 33: 3181–3185 [PubMed] [Google Scholar]
- 38. Meyer RB Jr, Miller JP. Analogs of cyclic AMP and cyclic GMP: general methods of synthesis and the relationship of structure to enzymic activity. Life Sci. 1974; 14: 1019–1040 [DOI] [PubMed] [Google Scholar]
- 39. Ferrier GR, Howlett SE. Differential effects of phosphodiesterase-sensitive and -resistant analogs of cAMP on initiation of contraction in cardiac ventricular myocytes. J Pharmacol Exp Ther. 2003; 306: 166–178 [DOI] [PubMed] [Google Scholar]
- 40. Mandal A, Delamere NA, Shahidullah M. Ouabain-induced stimulation of sodium-hydrogen exchange in rat optic nerve astrocytes. Am J Physiol Cell Physiol. 2008; 295: 378–382 [DOI] [PMC free article] [PubMed] [Google Scholar]
- 41. Braun T, Dods RF. Development of a Mn-2+-sensitive, “soluble” adenylate cyclase in rat testis. Proc Natl Acad Sci U S A. 1975; 72: 1097–1101 [DOI] [PMC free article] [PubMed] [Google Scholar]
- 42. Nomura M, Vacquier VD. Proteins associated with soluble adenylyl cyclase in sea urchin sperm flagella. Cell Mot Cytoskeleton. 2006; 63: 582–590 [DOI] [PubMed] [Google Scholar]
- 43. Sterling D, Reithmeier RA, Casey JR. A transport metabolon. Functional interaction of carbonic anhydrase II and chloride/bicarbonate exchangers. J Biol Chem. 2001; 276: 47886–47894 [DOI] [PubMed] [Google Scholar]
- 44. Morgan PE, Pastorekov S, Stuart-Tilley AK, Alper SL, Casey JR. Interactions of transmembrane carbonic anhydrase, CAIX, with bicarbonate transporters. Am J Physiol Cell Physiol. 2007; 293: C738–C748 [DOI] [PubMed] [Google Scholar]
- 45. Breton S, Hammar K, Smith PJ, Brown D. Proton secretion in the male reproductive tract: involvement of Cl--independent HCO-3 transport. Am J Physiol. 1998; 275: C1134–C1142 [DOI] [PubMed] [Google Scholar]
- 46. Ortego J, Escribano J, Crabb J, Coca-Prados M. Identification of a neuropeptide and neuropeptide-processing enzymes in aqueous humor confers neuroendocrine features to the human ocular ciliary epithelium. J Neurochem. 1996; 66: 787–796 [DOI] [PubMed] [Google Scholar]


