

Abstract
Motivation: The identification of short insertions and deletions (indels) and single nucleotide polymorphisms (SNPs) from Ion Torrent and 454 reads is a challenging problem, essentially because these techniques are prone to sequence erroneously at homopolymers and can, therefore, raise indels in reads. Most of the existing mapping programs do not model homopolymer errors when aligning reads against the reference. The resulting alignments will then contain various kinds of mismatches and indels that confound the accurate determination of variant loci and alleles.
Results: To address these challenges, we realign reads against the reference using our previously proposed hidden Markov model that models homopolymer errors and then merges these pairwise alignments into a weighted alignment graph. Based on our weighted alignment graph and hidden Markov model, we develop a method called PyroHMMvar, which can simultaneously detect short indels and SNPs, as demonstrated in human resequencing data. Specifically, by applying our methods to simulated diploid datasets, we demonstrate that PyroHMMvar produces more accurate results than state-of-the-art methods, such as Samtools and GATK, and is less sensitive to mapping parameter settings than the other methods. We also apply PyroHMMvar to analyze one human whole genome resequencing dataset, and the results confirm that PyroHMMvar predicts SNPs and indels accurately.
Availability and implementation: Source code freely available at the following URL: https://code.google.com/p/pyrohmmvar/, implemented in C++ and supported on Linux.
Contact: ruijiang@tsinghua.edu.cn or cengf08@mails.thu.edu.cn
1 INTRODUCTION
The most prevalent variants on the human genome are single nucleotide polymorphisms (SNPs) (Abecasis et al., 2012; Levy et al., 2007; Wheeler et al., 2008). The second most prevalent variants are insertions and deletions (indels) that occur every 7.2 k bp (Mills et al., 2006). Among them, >84% are short indels (<5 bp) (Bhangale et al., 2005). At present, the next-generation sequencing technology facilitates the direct detection of SNPs and short indels by resequencing a personal genome (Nielsen et al., 2011). After sequencing, reads are mapped against the reference genome by read-mapping programs (Chen et al., 2009; Homer et al., 2009; Langmead and Salzberg, 2012; Li and Durbin, 2010; Li et al., 2009; Ning et al., 2001; Rumble et al., 2009), and variants are called by hypothesis testing methods on the piled-up reads (DePristo et al., 2011; Li et al., 2008; Marth et al., 1999). However, accurate variant detection depends on the ability to discriminate true variants from sequencing errors. Particularly, for Ion Torrent and 454 data, indels are the most common sequencing errors causing incorrect alignments and thus posing a major roadblock to the accurate detection of variants. Ion Torrent and 454 can uniquely sequence homopolymers by quantifying the number of released by-products in the process of DNA synthesis (Margulies et al., 2005; Rothberg et al., 2011). At the same time, however, these techniques are prone to homopolymer sequencing errors, either overcalling or undercalling the number of homopolymer bases (Balzer et al., 2010; Huse et al., 2007). Moreover, the carry forward and incomplete extension effects, which happen as a few template copies may grow in desynchronization with the population, also raise insertions in reads. However, existing mapping methods do not include models to tackle homopolymer errors; therefore, alignments around homopolymers can be incorrect, resulting in calling false variants (Fig. 1). Therefore, a comprehensive method is necessary to improve the accuracy of variant calling for Ion Torrent and 454 data.
Fig. 1.
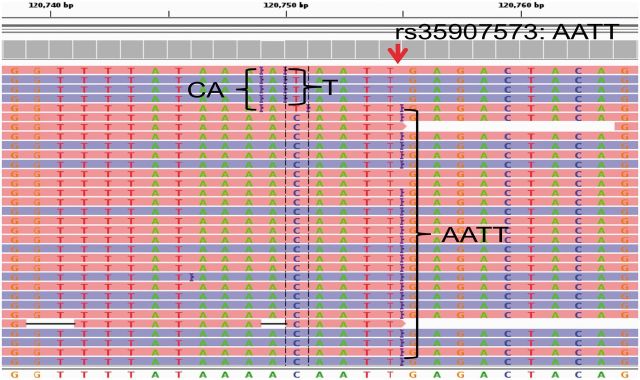
Example of false alignments from 1000 Genome Project resequencing data. True variant is an insertion ‘AATT’ at locus 120 754. Because that homopolymers ‘AAAA’ in top five reads are sequenced to be ‘AAA’, the read mapper produces false alignments. These false alignments will raise the false positive variants: a false insertion ‘CA’ at locus 120 749 and a false SNP ‘C/T’ at locus 120 750. If false alignments were adjusted correctly, these two false variants would not be called
Most of the existing methods detect SNPs and indels independently. The general strategy is to establish an accurate error model for the specific sequencing platform. For example, Atlas-SNP2 (Shen et al., 2010) developed a logistical regression model relying on sequence context to discriminate true SNPs from sequencing errors. Realignment has been proven as an efficient method to improve accuracy by adjusting raw mappings. In response, Samtools (Li et al., 2008), for example, deploys a concept termed base alignment quality (Li, 2011), which is calculated by realigning a read against a reference to decrease false SNPs caused by nearby indels. Meanwhile, GATK (DePristo et al., 2011) adjusts the alignments of reads spanning over indels by performing local multiple sequence alignment. However, as noted above, most of these methods are not designed to engage the problem of homopolymer errors and incorrect alignments around homopolymers. We previously proposed a method termed PyroHMMsnp (Zeng et al., 2013) for Ion Torrent and 454. This method implements a hidden Markov model (HMM) to formulate homopolymer errors and trains the HMM by an expectation-maximization (EM) algorithm using resequencing data. Then, the trained HMM is used to realign reads against the reference sequence around homopolymers to improve the performance of SNP calling.
Identification of indels in the reference is a more challenging problem in short-read sequencing. One of the major obstacles is to identify potential genome positions where indels are located. Strategies for identifying indels are different. Specifically, long insertions can only be found through sequence assembly, either local assembly (Li et al., 2013) or global assembly (Iqbal et al., 2012; Li, 2012), whereas deletions can be found through either sequence assembly or sequence alignments (Albers et al., 2011; Emde et al., 2012). Strategies for identifying short and long indels are also quite different. In principle, short indels, sometimes even long deletions, can be found by aligning one read against the reference, as long as a reliable read-mapping program is used. However, because the read length is short, such mapping generally produces many false alignments with various kinds of indels and mismatches. To confirm the existence of an indel, we would have to examine multiple pieces of evidence, such as multiple aligned reads, read coverage and constraints of paired-end reads. To the best of our knowledge, robust indel detection remains unsettled.
In this article, we propose a method termed PyroHMMvar to call SNPs and short indels for both Ion Torrent and 454 resequencing data. Two distinct features are highlighted in PyroHMMvar. First, we introduce an HMM to formulate homopolymer errors. The HMM can accurately distinguish real signals from sequencing errors and thus improve the alignment of reads against the reference. The parameters of HMM are trained directly from raw mapping results through an iterative EM algorithm. Second, we propose a graph data structure that merges multiple aligned reads at a given locus into a weighted alignment graph from which we reconstruct the consensus sequence(s). The use of the weighted alignment graph provides the following advantages. First, it enables the straightforward construction of the haplotype(s), which may contain both SNPs and indels. In comparison, Dindel (Albers et al., 2011) infers indels separately from SNPs. Second, we propose an efficient traversal algorithm over the weighted alignment graph to avoid the exhaustive and computationally complex enumeration of candidate haplotypes.
We simulate SNPs and short indels in the diploid genome and use them to test the performance of PyroHMMvar. Compared with two state-of-the-art methods, Samtools (Li et al., 2008) and GATK (DePristo et al., 2011), PyroHMMvar gives more accurate results. We also test the effect of the raw alignments produced by mapping programs to indel/SNP-calling accuracy by varying the scoring function of BWA-SW (Li and Durbin, 2010) to produce different mappings. The test results show that PyroHMMvar is less sensitive to the variation of the scoring function than the other programs. Finally, we apply PyroHMMvar to analyze one human whole genome resequencing dataset, and the results confirm that PyroHMMvar predicts SNPs and indels accurately.
2 METHODS
As shown in Figure 2A, the workflow of PyroHMMvar includes the following steps. (i) We build and train an HMM model directly from the raw mapping of the resequencing data or the spike-in data using an iterative EM algorithm. (ii) We use a sliding window to scan the genome. If the sliding window contains one or more candidate variants, we collect the short reads aligned within the sliding window and realign them against the reference using the HMM. (iii) We then merge all the alignments (paths in HMM) to build a weighted alignment graph and traverse the graph to reconstruct the top candidate haplotypes. (iv) Finally, we use a Bayesian method to infer the genotype from the set of candidate haplotypes and the short reads, followed by alignment of the genotype to the reference to determine the alleles and coordinates of variants. Details of these four steps are described in the following paragraphs.
Fig. 2.

(A) The schematic diagram depicts the workflow of PyroHMMvar. (B) The cartoon shows the topological structure of the HMM, the homopolymer sequence and the hidden state transition. (C) An example of the weighted alignment graph that is established from the pairwise read–HMM alignments
2.1 Homopolymer HMM
An appropriate error model can facilitate the correct alignments of reads against the reference. We previously proposed an HMM (Fig. 2B) to formulate homopolymer sequencing errors in both Ion Torrent and 454 data (Zeng et al., 2013). The HMM accepts a nucleotide sequence as input, and then converts the sequence into units of homopolymers using the run length encoding rule (Vacic et al., 2008). As shown in Figure 2B, ATTTTGGCCCC becomes a sequence of four homopolymers <A,1><T,4><G,2><C,3>. For each homopolymer, there are two hidden states  and
and  .
.  means that the corresponding homopolymer is being sequenced, whereas the length of the output homopolymer could be varying because of overcalling or undercalling errors.
  represents that the homopolymer is not being sequenced in case that either the homopolymer may be deleted or the flow signal is too weak to be detected. A third hidden state
  sitting between two consecutive homopolymers is used to model random insertions. Two hidden states
  are added into the model to represent the beginning and ending of the alignment because (i) the quality at the beginning and ending of a read may be low and (ii) sometimes the exact boundaries (the beginning and ending) of the corresponding reference substring that produces the read are not clearly defined. Thus, the HMM model represents a local, rather than global, alignment. Based on the above notation, a hidden state
  can take values from the set
  . For each read that is mapped to the reference, we use Viterbi’s algorithm to compute a hidden state path
  , which represents a unique alignment between the read and the corresponding reference substring.
2.1.1 Hidden State Emission
In the above HMM, each hidden state can emit a homopolymer. Let  represent the homopolymer input to a state
 , and let
  where
where  represent the homopolymer emitted by the state, where
  . However, in sequence comparison, we need a special homopolymer, a null homopolymer
  , to represent homopolymer indels. For a read homopolymer
  , each compositional nucleotide
  has a quality score
  . We, therefore, define the quality score of the homopolymer as the average over the compositional nucleotides, as,
 |
(1) |
Hence, the probability that state  emits output
  given input
  is modeled as,
| (2) |
The base call rate  represents the probability that an input base
  is sequenced to an observed base
  during nucleotide incorporation. The length call rate
  reflects the probability of observing
  consecutive bases when a
  bp homopolymer is given, and it is represented by a hierarchical model of the sequencing and base-calling procedures (Zeng et al., 2013).
  formulates the quality score assigned by the base-calling procedure.
2.1.2 Parameter Estimation
To use the HMM to perform the realignment, the parameters of the HMM will be inferred from the following iterative EM algorithm. Parameters in the above HMM include the hidden state transition matrix, the base call rates, the length call rates and the quality score distribution. The training data can be the resequencing data from one or more genomic loci, with no variants, or few variants or the spike-in data, which are sequenced through the control lane of a sequencing platform to assess sequencing quality. The estimation of these parameters would be simple if the ground-truth alignments that represent the procedure of generating read sequences from templates were known. However, because the ground-truth alignments are not available, we propose an iterative strategy inspired by the EM algorithm (Dempster et al., 1977) to train the HMM without the ground-truth alignments. In this strategy, the learning procedure is divided into two successive processes. First, given a read and its mapped reference sequence, the best alignment is computed and simultaneously assigned a posterior probability conditional on the previously learned parameters using the forward–backward algorithm (Durbin et al., 1998). Next, occurrences of the state transitions and state emissions are counted from the probabilistically weighted alignments, and parameters of the HMM are updated according to the occurrences by using the maximum likelihood estimation. This procedure iterates until the likelihood value converges.
2.1.3 Pairwise Read–HMM alignment
After parameter estimation, the HMM is used to adjust a read mapping by realigning the read to the reference through the HMM. Given a read  and the corresponding reference sequence
  that is located through read-mapping, we first transform the reference
  into homopolymer sequence
  , where
  . Then, we apply the HMM to search for the optimal alignment between the read
  and the template
  using the Viterbi algorithm (Durbin et al., 1998). We define the Viterbi variable
  as the probability of the optimal alignment between the read prefix subsequence
  and the homopolymer prefix subsequence
  ending with the hidden state
  , and, simultaneously, the suffix of
  is a homopolymer of length
  . We use the following recursion to calculate the Viterbi variable for
  ,
,  , as
, as
 |
(3) |
where  ,
,  ,
,  ,
,  ,
,  is the maximum length of the homopolymer ended at read position
  ,
,  is the maximum length of the homopolymer at read position
  and
and  is the transition probability between two states. Based on the recursion, we can use dynamic programming to compute the Viterbi variables, starting with the boundary conditions
  and
and  , where
  , and ending with the Viterbi score
 .
.
2.2 Weighted alignment graph
Given all the pairwise read–reference alignments within a scanning window, we propose a graph data structure, termed weighted alignment graph, to merge all these alignments. Each read-reference alignment is represented by a path from  to
to  in the hidden space of the HMM (Fig. 2C). Stacking up all the paths in this window, we construct a weighted alignment graph, which is a directed acyclic graph with a starting node at the hidden state
  and an ending node at the hidden state
  . In this graph, the same hidden states and transition edges in multiple paths are merged and represented by one node and one directed edge, respectively. Each edge is weighted by the number of paths in which it appears. An example is shown in Figure 2C.
In this weighted alignment graph, a diploid genome should have one consensus path if the two underlying haplotypes are identical, or two different paths if the two underlying haplotypes are different. However, because each path in the graph represents a haplotype candidate, the number of paths grows exponentially by the number of branches in the graph. In regions where either the read quality or the alignment quality is low, the graph can be so complicated that an exhaustive search for all haplotype candidates is a computational burden. Fortunately, for most cases, true haplotypes correspond to paths with high weights in the graph. Therefore, we traverse the graph using a modified depth-first search (DFS) algorithm. For each node, we define an array to store the top  weighted paths from the starting node to this node. The algorithm consists of the following two steps:
Topological sort. We traverse the graph using the DFS algorithm to produce a topological sort. The topological sort is a sorted order of the nodes from the left to the right such that every edge in the graph points from the left to the right. The topological sort takes
 time, where
  is the number of nodes and
  is the number of edges.
Graph traversing. We traverse the nodes from the left to the right in the topological order. For each node, we compute the weights of all incoming paths, rank them and store the top
 weighted paths. The graph traversing takes
  time.
time.
This algorithm reduces the computational complexity.
2.3 Bayesian variant detection for diploid genome
We use the Bayesian method to infer the underlying genotype from the observed short reads and the candidate haplotypes generated by traversing the weighted alignment graph. Let  be a haplotype sequence. A read subsequence
  is aligned against
  by using the Viterbi algorithm. The alignment score is used as the likelihood that
  generates
  , as
, as
| (4) |
The haplotype likelihood that  generates all read subsequences
  is calculated by assuming that every read is sequenced from the haplotype independent of others, as
| (5) |
For diploid genome, the sequencing procedure can be considered as a two-stage model, shown in the following
| (6) |
At the first stage, a haplotype  is randomly sampled from the genotype
  . At the second stage, a read
  is sequenced from the
  . Based on the Bernoulli model, the genotype likelihood that
  generates the data
  is calculated by
| (7) |
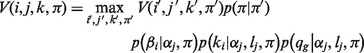
where by default  . With genotype prior
  , the posterior that all reads are sequenced from
  is computed by
| (8) |
We use a multinomial distribution to model the prior of a haplotype pair  and
and  . Let
. Let  be the length of the alignment between
  and
and  . Given the mismatch probability
  and indel probability
  , the prior probability of a genotype is defined as the probability that observing
  mismatches and
  indels in the alignment, calculated by,
| (9) |
This prior setting is used to penalize a genotype of which two haplotypes are largely different from each other. The genotype  with the maximum posterior probability will be selected as the most possible underlying genotype.
A predicted variant is assigned a quality score, which is defined by how well the predicted variant explains the data. Specifically, a variant is of high quality if the best genotype explains the observed short reads well with the variant, but poorly without it. Therefore, the quality score for a variant  is defined as the following log-likelihood ratio:
| (10) |
where  is the set of genotypes having the variant
  , and
, and  is the complement set of
  .
.
The previously proposed variant calling method works under the assumption of the reliable mappings, i.e. a read should be mapped back to the original genomic locus, at which there are a few false aligned positions or it is a correct alignment. However, this assumption cannot be guaranteed in practice. Therefore, we recalibrate the aforementioned variant quality score  by integrating the mapping quality
  . The recalibrated variant quality score is calculated as the geometric mean of the above quality scores,
| (11) |
where  is defined as the median mapping quality score of short reads within the sliding window.
2.4 Aligning genotype with reference
The inferred genotype  contains the variant allele(s), but without such explicit information as a locus. For the example shown in Figure 2C, the haplotype sequence reconstructed by the weighted alignment graph gives two insertions <C,1><T,3> followed by a homopolymer sequencing error of undercalling. Therefore, to explicitly determine the variant(s), we use the standard dynamic programming for multiple sequence alignment to align the genotype against the reference. In our case, we have three sequences, including two haplotype sequences and one reference sequence, so the running time is
  where
where  is the length of the sequences.
2.5 Computational complexity
The computational complexity of PyroHMMvar arises from two components. The first component is the pairwise read–HMM alignment. Suppose there are  reads of length
  bp within a sliding window. The Viterbi algorithm, which is used to perform the pairwise alignment, achieves the time complexity
  . As a consequence of traversing the weighted alignment graph,
  paths are generated as candidate haplotype sequences.
  short reads are aligned pairwise against a candidate haplotype to calculate the data generation likelihood. Therefore, the computational complexity within a sliding window before we perform the Bayesian inference is
  . The second component is the alignment between the inferred genotype against the reference. This alignment is done through a standard dynamic programming for multiple sequence alignment. In our case, we have three sequences, including two haplotype sequences and one reference sequence; therefore, the running time is
  where
where  is the length of the sequences. Hence, the total computational complexity within a sliding window is
 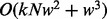 . When PyroHMMvar is applied to a genome of size
  bp, the complexity will be
  , where
  is the number of the sliding windows in the genome. To reduce the complexity, we use the banding technique to avoid the computation of the entire dynamic programming table for both the pairwise and multiple sequence alignment.
3 RESULTS
3.1 Datasets
We used two simulation datasets and one human whole genome resequencing data to compare the performance of PyroHMMvar with Samtools and GATK. We used the human chromosome 21 (chromosome size 48 129 895 bp) to generate the first simulation data. We randomly chose 35 110 SNP sites (SNP rate 0.1%) and 4409 indel sites (indel rate 0.01%; indel size 1–5 bp) on chromosome 21 to generate a pair of haplotypes. A variant site has a probability of two-third to be heterozygous and one-third to be homozygous. Next, we used the Ion Torrent simulator DWGSIG (https://github/com/nh13/dwgsim) to simulate the sequencing reads which are, on average, 400 bp long with an error rate of 2%. Six datasets were generated by the simulator to assess the performance of variant calling programs at the 5-, 10-, 15-, 20-, 25- and 30-fold sequencing depths. The simulated short reads were mapped against human chromosome 21 by using the BWA-SW (Li and Durbin, 2010) with the default parameter setting.
The second simulation dataset was used to evaluate the effect of the mapping parameter setting on the performance of PyroHMMvar and other variant calling programs. Different parameter settings could produce different mappings and/or raw alignments of reads. We used the aforementioned simulation strategy to generate the sequencing reads (read length 400 bp) with 10× depth from a 5 Mbp segment on human chromosome 20 (Chr20:1000000–6000000). The simulated short reads were mapped against human chromosome 20 by using the BWA-SW with different mismatch penalties varying from 1 to 9.
We also applied PyroHMMvar and other variant calling programs to call SNPs and short indels in the human genome by using the whole genome resequencing data produced by an Ion Torrent PGM machine (National Center for Biotechnology Information SRA Accession: ERX016676). The dataset consists of 859 757 279 reads, with an average length of 183 bp at roughly 6× coverage.
3.2 Performance criteria
Three evaluation criteria were used: sensitivity, specificity and F1 score. Sensitivity is defined as the fraction of the annotated variants called by the program, specificity as the fraction of the called variants that are correct. Sensitivity measures the performance of a method in detecting true variants, and specificity assesses whether a method is capable of reporting few false-positive variants. F1 score is the harmonic mean of sensitivity and specificity. The formulas are shown in the following:
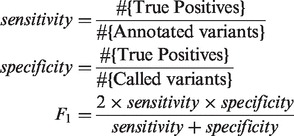 |
(12) |
3.3 Diploid simulation with various sequencing depths
We used the DWGSIM simulator to generate six sets of sequencing reads from human chromosome 21 with varying coverage depths: 5, 10, 15, 20, 25 and 30×. PyroHMMvar, Samtools and GATK were applied to call SNPs and short indels. A called SNP is regarded as correct or true positive if the called locus is exactly the same as the simulated locus and the called genotype is concordant with the simulated genotype; otherwise, it is incorrect or false positive. An indel is regarded as a correct call if the called locus is within 5 bp of the simulated locus, and the called genotype is concordant with the simulated genotype. These concepts, as applied to true and false positives, were applied to both SNPs and indels. A comparison of the performance of these three variant calling programs is shown in Table 1.
Table 1.
Performance evaluation of variant calling programs on the simulation of short reads generated from human chromosome 21 at various sequencing depths. The numbers in Bold are the best performances
| Depth | Method | SNP |
Indel |
Runtime (hour) | ||||||||
|---|---|---|---|---|---|---|---|---|---|---|---|---|
| TP | FP | SEN (%)d | SPE (%)e | F1 (%) | TP | FP | SEN (%) | SPE (%) | F1 (%) | |||
| 5× | PVa | 15 739 | 722 | 44.8 | 95.6 | 61.0 | 838 | 37 | 19.0 | 95.7 | 31.7 | 0.53 |
| GAb | 15 740 | 2 996 | 44.8 | 84.0 | 58.5 | 759 | 52 | 17.2 | 93.6 | 29.1 | 0.10f | |
| STc | 14 948 | 1 257 | 42.6 | 92.2 | 58.3 | 745 | 993 | 16.9 | 42.9 | 24.2 | 0.37 | |
| 10× | PV | 28 393 | 325 | 80.9 | 98.9 | 89.0 | 2 608 | 92 | 59.2 | 96.6 | 73.4 | 1.07 |
| GA | 23 071 | 2 898 | 65.7 | 88.8 | 75.5 | 2 467 | 101 | 56.0 | 96.1 | 70.7 | 0.21 | |
| ST | 26 486 | 917 | 75.4 | 96.7 | 84.7 | 1 741 | 1 340 | 39.5 | 56.5 | 46.5 | 1.10 | |
| 15× | PV | 32 757 | 96 | 93.3 | 99.7 | 96.4 | 3 778 | 80 | 85.7 | 97.9 | 91.4 | 1.10 |
| GA | 25 430 | 2 288 | 72.4 | 91.7 | 81.0 | 3 672 | 157 | 83.3 | 95.9 | 89.1 | 0.32 | |
| ST | 31 453 | 439 | 89.6 | 98.6 | 93.9 | 2 466 | 1 528 | 55.9 | 61.7 | 58.7 | 2.13 | |
| 20× | PV | 34 202 | 46 | 97.4 | 99.9 | 98.6 | 4 180 | 69 | 94.8 | 98.4 | 96.6 | 1.12 |
| GA | 27 539 | 1 855 | 78.4 | 93.7 | 85.4 | 4 124 | 174 | 93.5 | 96.0 | 94.7 | 0.45 | |
| ST | 33 618 | 235 | 95.8 | 99.3 | 97.5 | 2 904 | 1 566 | 65.9 | 65.0 | 65.4 | 3.42 | |
| 25× | PV | 34 681 | 37 | 98.8 | 99.9 | 99.3 | 4 347 | 70 | 98.6 | 98.4 | 98.5 | 1.14 |
| GA | 29 462 | 1 497 | 83.9 | 95.2% | 89.2% | 4 302 | 179 | 97.6% | 96.0% | 96.8% | 0.57 | |
| ST | 34 470 | 129 | 98.2 | 99.6% | 98.9% | 3 238 | 1 748 | 73.4% | 64.9% | 68.9% | 4.78 | |
| 30× | PV | 34 861 | 19 | 99.3 | 99.9 | 99.6 | 4 380 | 52 | 99.3 | 98.8 | 99.1 | 1.25 |
| GA | 30 003 | 1 289 | 85.5 | 95.9 | 90.4 | 4 345 | 161 | 98.5 | 96.4 | 97.5 | 0.64 | |
| ST | 34 796 | 84 | 99.1 | 99.8 | 99.4 | 3 418 | 1 765 | 77.5 | 65.9 | 71.3 | 6.37 | |
aPV is PyroHMMvar.
bGA is GATK (v2.4-9).
cST is Samtools (v0.1.19).
dSEN is Sensitivity.
eSPE is Specificity.
fThe runtime of GATK is the runtime of IndelRealigner plus the runtime of UnifiedGenotyper.
Across different coverages, PyroHMMvar called more true-positive SNPs and fewer false-positive SNPs, when compared with GATK and Samtools. For the high-coverage (30× depth) sequencing data, PyroHMMvar called 34 861 true-positive SNPs, which implies a sensitivity of 99.3%, whereas GATK called 30 003 true-positive SNPs (sensitivity 85.5%) and Samtools called 34 796 true-positive SNPs (sensitivity 99.1%). Relative to its counterparts, PyroHMMvar called 16.2% more true-positive SNPs than GATK and 0.2% more true-positive SNPs than Samtools. Moreover, PyroHMMvar called only 19 false-positive SNPs (99.9% specificity), whereas GATK called 1289 false-positive SNPs (95.9% specificity) and Samtools called 84 false-positive SNPs (99.8% specificity). At the other sequencing depths, Samtools called slightly fewer true-positive SNPs and slightly more false-positive SNPs than PyroHMMvar. Overall, GATK predicted the fewest true-positive SNPs and the most false-positive SNPs at various sequencing depths. The results imply that PyroHMMvar and Samtools performed better in detecting SNPs than GATK in terms of both sensitivity and specificity.
The results also show that PyroHMMvar is accurate at detecting short indels. Overall, PyroHMMvar had the best performance in all three criteria (sensitivity, specificity and F1) across all sequencing depths. PyroHMMvar predicted more simulated indels, as well as PyroHMMvar had the highest specificity. It is worth noting that the number of false-positive indels called by PyroHMMvar decreases as the sequencing depth increases, whereas GATK and Samtools called more false-positive indels along with the increase of sequencing depth. Across all sequencing data, the performance of Samtools’ indel calling is well below that of PyroHMMvar and GATK. Overall, PyroHMMvar achieved the best performance in detecting both SNPs and short indels.
We also demonstrated the runtime of the three programs, which were performed at a single thread of a computer with a 3.4 GHz CPU and 16 GB of memory. GATK achieved the fastest speed across all datasets. PyroHMMvar was slower than GATK, but faster than Samtools. These three programs can all be accelerated by using the parallel computing technique.
3.4 Diploid simulation with varying scoring function
BWA-SW deploys a Smith–Waterman algorithm (Smith and Waterman, 1981) to perform local alignment of long reads. In general, different scoring functions will produce raw alignments, and may thus affect the performance of variant calling. Therefore, it is desirable that a variant calling method be less sensitive to the scoring function of the mapping programs to produce robust results. To assess this performance, we varied the mismatch penalty of BWA-SW from 1 to 9 and applied it to map the second simulated dataset at 10× depth. At a high mismatch penalty, the mapping program prefers indels over mismatches and produces different raw alignments. After applying PyroHMMvar, GATK and Samtools to these datasets, we computed the sensitivity, specificity and F1 measure, and the results are shown in Figure 3. Clearly, PyroHMMvar achieves consistent sensitivity and specificity across all parameter settings in detecting short indels. In contrast, the sensitivity of GATK increases when the mismatch penalty increases. We also noticed that the behavior of Samtools is different from other programs in that both the sensitivity and specificity increase as the mismatch penalty increases. This is because Samtools relies more on raw alignments to call indels.
Fig. 3.

Sensitivity, specificity and F1 measure when tuning the mismatch penalty from 1 to 9. Different scoring settings generate different mapping results, which then affect downstream variant calling. This figure shows the performance changes of three methods by using different penalty scores
Because the mapping program prefers indels over mismatches, the sensitivity in detecting SNPs decreases as the mismatch penalty increases. PyroHMMvar selects a variant locus as an SNP candidate when there are at least two reads supporting the variant. If the original mismatches are replaced by indels in the alignments, evidence is insufficient to support a variant locus as a candidate site. For the same reason, the sensitivity of SNP detection decreases in GATK and Samtools. However, although the specificity of PyroHMMvar and Samtools is consistent between them, the specificity of GATK is quite low at low mismatch penalty. Thus, with a small mismatch penalty, some indels appear like SNPs in the raw alignments, in turn causing GATK to call false-positive SNPs. These results show that PyroHMMvar is more robust than the other tools.
3.5 Application to whole genome resequencing data
We downloaded a human whole genome resequencing dataset (National Center for Biotechnology Information SRA Accession: ERX016676), which was generated by an Ion Torrent PGM machine (Rothberg et al., 2011). We used the BWA-SW to map the short reads back to the human reference hg19 with the default parameter setting and then applied the three variant calling programs to call SNPs and short indels. The called variants with a prediction error rate of higher than 0.1% (quality score <30) were eliminated. As demonstrated in Table 2, these results suggest that PyroHMMvar provides an accurate prediction of SNPs and short indels on human genome.
Table 2.
Performance comparison of variant calling programs based on human whole genome resequencing data at the prediction accuracy >99.9% (variant quality score >30)
| Method | PyroHMMvar | GATK | Samtools |
|---|---|---|---|
| Total predicted SNPs | 1 181 972 | 1 103 003 | 734 398 |
| Validated (%) | 1 173 633 (99.3%) | 1 093 986 (99.2%) | 731 859 (99.7%) |
| Ts/Tv ratioa | 2.17 | 2.18 | 2.19 |
| Homozygous SNPs | |||
| Predicted | 687 985 | 752 994 | 597 993 |
| Validated (%)b | 687 278 (99.9%) | 750 428 (99.7%) | 597 195 (99.9%) |
| Heterozygous SNPs | |||
| Predicted | 493 987 | 350 009 | 136 405 |
| Validated (%) | 486 385 (98.5%) | 343 558 (98.2%) | 134 664 (98.7%) |
| Insertions | |||
| Predicted | 5 671 | 9 339 | 3 552 |
| Validated (%) | 5 583 (98.4%) | 8 597 (92.6%) | 3 266 (91.9%) |
| Deletions | |||
| Predicted | 19 304 | 101 602 | 11 530 |
| Validated (%) | 6 683 (34.6%) | 13 510 (13.3%) | 3 259 (28.3%) |
| Runtime (hour) | 66.9 | 22.6c | 36.4 |
aTs/Tv ratio is the transition-to-transversion ratio.
bThe validation database is the dbSNP 137.
cThe runtime of GATK is the runtime of IndelRealigner plus the runtime of UnifiedGenotyper.
PyroHMMvar predicted 1 181 972 SNPs, among which 687 985 were homozygous and 493 987 were heterozygous. In all, 99.9% of the predicted homozygous SNPs (687 278) and 98.5% of the predicted heterozygous SNPs (486 385) could be validated by the dbSNP 137. The predicted transition-to-transversion (Ts/Tv) ratio is 2.17. In comparison, GATK predicted less SNPs with a similar Ts/Tv ratio (2.18). The number of the predicted homozygous SNPs was larger (752 994), but the number of the predicted heterozygous SNPs was smaller (350 009). Their validation ratios are slightly lower than those of PyroHMMvar, at 99.7% for the homozygous SNPs and 98.2% for the heterozygous SNPs. Samtools made considerably fewer SNP predictions (734 398), but its validation ratios and Ts/Tv ratio are similar to the other two programs.
PyroHMMvar predicted 5671 insertions for which the validation rate was 98.4%, and 19 304 deletions for which the validation rate was 34.6%. GATK called many more indels, but with lower validation rates: 9339 insertions with 92.6% validation rate, and 101 602 deletions with 13.3% validation rate. Samtools predicted the fewest number of indels, only 3552 insertions and 11 530 deletions. The validation rates of the indels were 91.9 and 28.3%, respectively. The running times of PyroHMMvar, GATK and Samtools were 66.9, 22.6 and 36.4 h, respectively.
3.6 The contribution of the HMM and the alignment graph in PyroHMMvar
To evaluate the contribution of the HMM in PyroHMMvar, we implemented a program, named PyroHMMvar-SW, which replaces the HMM by a homopolymer-aware Smith–Waterman alignment method, resembling PanGEA (Kofler et al., 2009). In PyroHMMvar-SW, we assign a score +5 to a match and −3 to a mismatch. For an insertion or a deletion, we assign a score −4 to the gap opening penalty, and −1 to each gap extension penalty. For each pair of aligned homopolymers, in which a k-mer polynucleotide stretch is aligned to an l-mer polynucleotide stretch with identical nucleotide bases, we penalize the difference by −1×|k-l| in the following scoring function,
| (13) |
We simulated a diploid genome sequencing dataset with 10-fold sequencing coverage, and applied both PyroHMMvar and PyroHMMvar-SW to this dataset. The results are shown in Table 3. Both programs show a similar performance in SNP calling, but the HMM clearly out-performs the Smith–Waterman method in the detection of indels. PyroHMMvar called less false indels and achieved a higher specificity (96.6%) than PyroHMMvar-SW (89.7%). This improvement is due to the contribution of the HMM in modeling the homopolymer errors.
Table 3.
The performance comparison of PyroHMMvar with PyroHMMvar-SW, which replaces the HMM with a homopolymer-aware Smith–Waterman alignment method, and PyroHMMvar-Unique, which uses the unique read sequences as the consensus sequences instead of the weighted alignment graph
| Method | SNP |
Indel |
||||||||
|---|---|---|---|---|---|---|---|---|---|---|
| TP | FP | SEN (%) | SPE (%) | F1 (%) | TP | FP | SEN (%) | SPE (%) | F1(%) | |
| PyroHMMvar | 28 393 | 325 | 80.9 | 98.9 | 89.0 | 2 608 | 092 | 59.2 | 96.6 | 73.4 |
| PyroHMMvar-SW | 28 297 | 340 | 80.6 | 98.8 | 88.8 | 2 285 | 263 | 51.8 | 89.7 | 65.7 |
| PyroHMMvar-Unique | 21 224 | 126 | 60.5 | 99.4 | 75.2 | 1 723 | 018 | 39.1 | 99.0 | 56.0 |
To evaluate the contribution of the weighted alignment graph method, we implemented a program called PyroHMMvar-Unique, which identifies potential haplotypes by using short reads instead of the weighted alignment graph and the DFS-based algorithm implemented in PyroHMMvar. Similarly, we simulated a diploid genome sequencing dataset with 10-fold sequencing coverage, and applied both PyroHMMvar and PyroHMMvar-Unique to this dataset. The results are shown in Table 3. PyroHMMvar has higher F1 scores for both the SNP calling (89.0%) and the indel calling (73.4%) than PyroHMMvar-Unique (75.2% for the SNP calling and 56.0% in the indel calling). This proves that the weighted alignment graph method significantly improves the performance of variant calling.
4 DISCUSSION
The Ion Torrent and 454 sequencing machines are the routine benchmark next-generation sequencing platforms with the leverage of affordable sequencing cost, low error rate and long read length. These sequencing machines are commonly used in microbiology and virology research. However, short reads generated by both Ion Torrent and 454 machines are contaminated by homopolymer errors, which invariably raise indels in data, thereby decreasing the accurate detection of SNPs and indels from resequencing data. In this article, we introduced a computational framework that includes four components: (i) an HMM to model homopolymer errors; (ii) a pairwise read–HMM realignment method by which scoring parameters are estimated from resequencing data; (iii) a weighted alignment graph to reconstruct the underlying haplotype sequences; and (iv) a Bayesian method to call the genotype. Based on the simulation experiments and application to real human whole genome resequencing data, the proposed realignment approach combined with the weighted alignment graph was demonstrated to be an effective strategy to increase the accurate detection of SNPs and short indels on both Ion Torrent and 454 resequencing data.
Although the method introduced in the article is designed for Ion Torrent and 454 sequencing technologies, we believe that this computational framework conveys the following insights on the future development of variant calling method. Frist, it demonstrates a method of establishing an appropriate error model for a specific sequencing platform by (i) training the error model using the resequencing data and (ii) applying the error model to realign the mappings. Second, it demonstrates the use of the alignment graph technique to reconstruct haplotype sequences. The alignment graph technique has also been shown to be effective in constructing high-quality consensus sequences from the long reads generated by the third-generation single molecular sequencing technology (Chin et al., 2013). Furthermore, the alignment graph technique dramatically reduces the computational time of the otherwise exhaustive haplotype enumeration strategy, which was used in previously published works (Albers et al., 2011; Zeng et al., 2013). Overall, by replacing the homopolymer error model with an appropriate error model, the proposed computational framework can also benefit the detection of single nucleotide variants from resequencing data generated by other sequencing technologies, such as Illumina or Pacific Biosciences.
ACKNOWLEDGEMENTS
The authors thank Professor Xuegong Zhang for his support and helpful suggestions. The authors also thank the two anonymous reviewers for their insightful comments.
Funding: National Basic Research Program of China (2012CB316504) (in part), the National High Technology Research and Development Program of China (2012AA020401), the National Natural Science Foundation of China (61175002 and 60805010), Tsinghua University Initiative Scientific Research Program, Center of Excellence of Genome Sciences: Genomic Analysis of the Genotype-Phenotype Map (NIH/HG 2 P50 HG002790-06), Robust and Portable Workflow-based tools for mRNA and Genome re-sequencing (NIH/NHGRI 1U01 HG006531-01) and Computational Analysis of Metagenomic Sequencing Data (NSF/DMS ATD 7031026).
Conflict of Interest: none declared.
REFERENCES
- Abecasis GR, et al. An integrated map of genetic variation from 1,092 human genomes. Nature. 2012;491:56–65. doi: 10.1038/nature11632. [DOI] [PMC free article] [PubMed] [Google Scholar]
- Albers CA, et al. Dindel: accurate indel calls from short-read data. Genome Res. 2011;21:961–973. doi: 10.1101/gr.112326.110. [DOI] [PMC free article] [PubMed] [Google Scholar]
- Balzer S, et al. Characteristics of 454 pyrosequencing data–enabling realistic simulation with flowsim. Bioinformatics. 2010;26:i420–i425. doi: 10.1093/bioinformatics/btq365. [DOI] [PMC free article] [PubMed] [Google Scholar]
- Bhangale TR, et al. Comprehensive identification and characterization of diallelic insertion-deletion polymorphisms in 330 human candidate genes. Hum. Mol. Genet. 2005;14:59–69. doi: 10.1093/hmg/ddi006. [DOI] [PubMed] [Google Scholar]
- Chen Y, et al. PerM: efficient mapping of short sequencing reads with periodic full sensitive spaced seeds. Bioinformatics. 2009;25:2514–2521. doi: 10.1093/bioinformatics/btp486. [DOI] [PMC free article] [PubMed] [Google Scholar]
- Chin CS, et al. Nonhybrid, finished microbial genome assemblies from long-read SMRT sequencing data. Nat. Methods. 2013;10:563–569. doi: 10.1038/nmeth.2474. [DOI] [PubMed] [Google Scholar]
- Dempster AP, et al. Maximum likelihood from incomplete data via the EM algorithm. J. R. Stat. Soc. Series B Methodol. 1977;39:1–38. [Google Scholar]
- DePristo MA, et al. A framework for variation discovery and genotyping using next-generation DNA sequencing data. Nat. Genet. 2011;43:491–498. doi: 10.1038/ng.806. [DOI] [PMC free article] [PubMed] [Google Scholar]
- Durbin R, et al. Biological Sequence Analysis: Probabilistic Models of Proteins and Nucleic Acids. Cambridge, UK: Cambridge University Press; 1998. [Google Scholar]
- Emde AK, et al. Detecting genomic indel variants with exact breakpoints in single- and paired-end sequencing data using SplazerS. Bioinformatics. 2012;28:619–627. doi: 10.1093/bioinformatics/bts019. [DOI] [PubMed] [Google Scholar]
- Homer N, et al. BFAST: an alignment tool for large scale genome resequencing. PLoS One. 2009;4:e7767. doi: 10.1371/journal.pone.0007767. [DOI] [PMC free article] [PubMed] [Google Scholar]
- Huse SM, et al. Accuracy and quality of massively parallel DNA pyrosequencing. Genome Biol. 2007;8:R143. doi: 10.1186/gb-2007-8-7-r143. [DOI] [PMC free article] [PubMed] [Google Scholar]
- Iqbal Z, et al. De novo assembly and genotyping of variants using colored de Bruijn graphs. Nat. Genet. 2012;44:226–232. doi: 10.1038/ng.1028. [DOI] [PMC free article] [PubMed] [Google Scholar]
- Kofler R, et al. PanGEA: identification of allele specific gene expression using the 454 technology. BMC Bioinformatics. 2009;10:143. doi: 10.1186/1471-2105-10-143. [DOI] [PMC free article] [PubMed] [Google Scholar]
- Langmead B, Salzberg SL. Fast gapped-read alignment with Bowtie 2. Nat. Methods. 2012;9:357–359. doi: 10.1038/nmeth.1923. [DOI] [PMC free article] [PubMed] [Google Scholar]
- Levy S, et al. The diploid genome sequence of an individual human. PLoS Biol. 2007;5:e254. doi: 10.1371/journal.pbio.0050254. [DOI] [PMC free article] [PubMed] [Google Scholar]
- Li H. Improving SNP discovery by base alignment quality. Bioinformatics. 2011;27:1157–1158. doi: 10.1093/bioinformatics/btr076. [DOI] [PMC free article] [PubMed] [Google Scholar]
- Li H. Exploring single-sample SNP and INDEL calling with whole-genome de novo assembly. Bioinformatics. 2012;28:1838–1844. doi: 10.1093/bioinformatics/bts280. [DOI] [PMC free article] [PubMed] [Google Scholar]
- Li H, Durbin R. Fast and accurate long-read alignment with Burrows-Wheeler transform. Bioinformatics. 2010;26:589–595. doi: 10.1093/bioinformatics/btp698. [DOI] [PMC free article] [PubMed] [Google Scholar]
- Li H, et al. Mapping short DNA sequencing reads and calling variants using mapping quality scores. Genome Res. 2008;18:1851–1858. doi: 10.1101/gr.078212.108. [DOI] [PMC free article] [PubMed] [Google Scholar]
- Li R, et al. SOAP2: an improved ultrafast tool for short read alignment. Bioinformatics. 2009;25:1966–1967. doi: 10.1093/bioinformatics/btp336. [DOI] [PubMed] [Google Scholar]
- Li S, et al. SOAPindel: efficient identification of indels from short paired reads. Genome Res. 2013;23:195–200. doi: 10.1101/gr.132480.111. [DOI] [PMC free article] [PubMed] [Google Scholar]
- Margulies M, et al. Genome sequencing in microfabricated high-density picolitre reactors. Nature. 2005;437:376–380. doi: 10.1038/nature03959. [DOI] [PMC free article] [PubMed] [Google Scholar]
- Marth GT, et al. A general approach to single-nucleotide polymorphism discovery. Nat. Genet. 1999;23:452–456. doi: 10.1038/70570. [DOI] [PubMed] [Google Scholar]
- Mills RE, et al. An initial map of insertion and deletion (INDEL) variation in the human genome. Genome Res. 2006;16:1182–1190. doi: 10.1101/gr.4565806. [DOI] [PMC free article] [PubMed] [Google Scholar]
- Nielsen R, et al. Genotype and SNP calling from next-generation sequencing data. Nat. Rev. Genet. 2011;12:443–451. doi: 10.1038/nrg2986. [DOI] [PMC free article] [PubMed] [Google Scholar]
- Ning Z, et al. SSAHA: a fast search method for large DNA databases. Genome Res. 2001;11:1725–1729. doi: 10.1101/gr.194201. [DOI] [PMC free article] [PubMed] [Google Scholar]
- Rothberg JM, et al. An integrated semiconductor device enabling non-optical genome sequencing. Nature. 2011;475:348–352. doi: 10.1038/nature10242. [DOI] [PubMed] [Google Scholar]
- Rumble SM, et al. SHRiMP: accurate mapping of short color-space reads. PLoS Comput. Biol., 2009;5:e1000386. doi: 10.1371/journal.pcbi.1000386. [DOI] [PMC free article] [PubMed] [Google Scholar]
- Shen Y, et al. A SNP discovery method to assess variant allele probability from next-generation resequencing data. Genome Res. 2010;20:273–280. doi: 10.1101/gr.096388.109. [DOI] [PMC free article] [PubMed] [Google Scholar]
- Smith TF, Waterman MS. Identification of common molecular subsequences. J. Mol. Biol. 1981;147:195–197. doi: 10.1016/0022-2836(81)90087-5. [DOI] [PubMed] [Google Scholar]
- Vacic V, et al. A probabilistic method for small RNA flowgram matching. Pac. Symp. Biocomput. 2008:75–86. [PMC free article] [PubMed] [Google Scholar]
- Wheeler DA, et al. The complete genome of an individual by massively parallel DNA sequencing. Nature. 2008;452:872–876. doi: 10.1038/nature06884. [DOI] [PubMed] [Google Scholar]
- Zeng F, et al. PyroHMMsnp: an SNP caller for Ion Torrent and 454 sequencing data. Nucleic Acids Res. 2013;41:e136. doi: 10.1093/nar/gkt372. [DOI] [PMC free article] [PubMed] [Google Scholar]