

Abstract
Between birth and late adolescence, the human brain undergoes exponential maturational changes. Using in vivo magnetic resonance spectroscopy, we determined the developmental profile for 6 metabolites in 5 distinct brain regions based on spectra from 309 children from 0 to 18 years of age. The concentrations of N-acetyl-aspartate (an indicator for adult-type neurons and axons), creatine (energy metabolite), and glutamate (excitatory neurotransmitter) increased rapidly between birth and 3 months, a period of rapid axonal growth and synapse formation. Myo-inositol, implicated in cell signaling and a precursor of membrane phospholipid, as well as an osmolyte and astrocyte marker, declined rapidly during this period. Choline, a membrane metabolite and indicator for de novo myelin and cell membrane synthesis, peaked from birth until approximately 3 months, and then declined gradually, reaching a plateau at early childhood. Similarly, taurine, involved in neuronal excitability, synaptic potentiation, and osmoregulation, was high until approximately 3 months and thereafter declined. These data indicate that the first 3 months of postnatal life are a critical period of rapid metabolic changes in the development of the human brain. This study of the developmental profiles of the major brain metabolites provides essential baseline information for future analyses of the pediatric health and disease.
Keywords: human brain maturation, magnetic resonance spectroscopy, metabolism, myelination
Introduction
The period between birth and adolescence is remarkable for monumental developmental changes, whereby helpless infants transform into young adults capable of the complex cognitive and behavioral processes necessary to function independently in modern society. It is a time marked by critical periods involving nearly every cognitive system from vision to language to social and emotional processes. It is also a time during which multiple neurocognitive disorders emerge, including autism, attention–deficit/hyperactivity disorder, and schizophrenia. At the core, the marked behavioral changes between infancy and adolescence reflect structural maturational changes (e.g., axonal outgrowth, dendritic arborization, myelination, gliogenesis, angiogenesis) and functional maturational changes (e.g., Hebbian learning processes). Complex metabolic processes underline the energy and structural “building blocks” to support development, as well as the biochemical prerequisites for neurotransmission and synaptic function.
Autopsy studies and in vivo neuroimaging studies provide a detailed blue-print of the morphological changes underlying human normal development brain (Yakovlev and LeCours 1967; Rakic and Yakovlev 1968; Dobbing and Sands 1973; Sidman and Rakic 1973; Gilles 1976; Brody et al. 1987; Kinney et al. 1988; Kostovic 1990; Kostovic and Rakic 1990; Kinney et al. 1994; Rakic et al. 1994; Huttenlocher and Dabholkar 1997; Huppi et al. 1998; Sowell et al. 2001; Barkovich 2005; Haynes et al. 2005; Waber et al. 2007; Petanjek et al. 2008; Marin-Padilla 2011; Petanjek et al. 2011; Xu et al. 2011).
Limited, however, is information regarding developing biochemical processes that underlie the morphological development. Biochemical data acquired in vivo not only provide insight into the metabolic processes that support normal development, but also can lead to the development of biomarkers for aberrant developmental processes. Information about the metabolic features of tissue can be obtained with in vivo magnetic resonance spectroscopy (MRS), a modality widely available on most state-of-the-art MR scanners. Yet, few small children undergo MR studies unless clinically indicated. Thus, previous research of metabolic maturation includes small numbers of children or covers only a limited age range (van der Knaap et al. 1990; Huppi et al. 1991; Kreis et al. 1993; Toft et al. 1994; Cady et al. 1996; Pouwels et al. 1999; Kreis et al. 2002). While positron emission tomography (PET) has been used to investigate developmental metabolic changes, the studies are limited to assessing glucose (Glc) metabolism (Chugani et al. 1987) and are difficult to replicate in large-scale, healthy pediatric cohorts. The present study was designed to help filling in missing metabolic information using in vivo MRS in 309 children whose ages ranged from birth through late adolescence.
We analyzed, in parallel, 6 principal metabolites and 5 principal brain regions across human brain development. The metabolites selected were those that are robustly measured using standard MRS sequences and are routinely obtained in current standard MR scanners; therefore, they are potentially relevant now for not only research but also diagnostic purposes. These metabolites are involved in specific biochemical pathways fundamental for cellular functions in the developing brain, for example, myelination, axonal elongation, and glutamatergic neurotransmission. We selected 2 cerebral white matter sites, the parietal and frontal white matter, to define metabolite changes related to white matter development clinically relevant to the evaluation of white matter disorders across the developmental span. We chose 2 gray matter sites, the parieto-occipital cortex and the deep nuclei (combined thalamus/putamen/caudate) in order to: 1) define metabolite changes related to gray matter development; 2) contrast changes in gray versus white matter; and 3) examine changes in cortical versus subcortical gray matter. Finally, we included the ventral pons (basis pontis), a mixed gray and white matter site, to assess metabolic changes in the brainstem and contrast those with the aforementioned supratentorial regions. We analyzed the region-specific developmental changes in the metabolites relative to the major epochs of human development as defined in child psychology, neurology, and psychiatry for ready comparison of the metabolic data to well-defined neurobehavioral landmarks of these epochs. These epochs are: 1) birth to 2 years, a period of rapid and profound brain growth when the brain attains almost 90% of its adult weight; 2) the preschool period of 2–5 years; 3) middle childhood from 5 to 12 years; and 4) adolescence from 12 to 18 years. In this study, we tested the 2-fold hypothesis that: 1) the developmental profiles of the concentrations of the selected metabolites vary from each other in the different brain regions and epochs, reflecting known or postulated differential changes in region-specific metabolic pathways; and 2) rapid quantitative changes identify potential critical periods in specific developmental milestones for which the metabolite is an essential component.
Materials and Methods
Subjects
The children in this study were selected from a database of approximately 2500 patients aged from birth to 18 years who underwent combined magnetic resonance imaging (MRI) and MRS studies over an 8-year period (2001–2008) at Children's Hospital Los Angeles. The initial step in defining this sample was to search the database for patients with no abnormalities on MRI (including diffusion MRI), including upon re-review by a pediatric neuroradiologist (A.P.). The second step was to remove MR spectra of low quality by limiting the analysis empirically to spectra with a linewidth (measure of the field homogeneity) of <5Hz. The removal of spectra of poor quality limits the potential for inaccurate measurements of metabolite concentrations. The third step was to review the clinical records of the remaining subjects and to select them for final inclusion based upon study criteria of neurobehavioral normality. Only subjects with unremarkable medical histories (without significant neurological disorders or developmental delay) made the final selection criteria for the study. As part of our larger research program, for subjects in early infancy (<3 months of age), where it is particularly challenging to identify appropriate controls, the clinical records were reviewed by a neonatologist (L.P.), neuropsychologist (J.L.W.), and pediatric neuroradiologist (A.P.) in consensus; moreover, a documented follow-up period of at least 6 months was required. Because the metabolic maturation of preterm infants is known to differ from that of full-term infants (Kreis et al. 2002), only subjects born at a term (40 gestational weeks) were included in the final dataset. In the pool of children older than 5 years, there was a normal subset, representing a group that was typically comprised of normal siblings of patients participating in separate prospective research studies under our auspices. Clinical indications for neuroimaging in the remaining children included the diagnostic suspicion that was not subsequently confirmed of encephalitis, meningitis, headaches, febrile seizures, hypoxic–ischemic episodes, tumor, and hypotonia.
Brain Regions Analyzed
Spectra were acquired in 5 regions of interest (ROI): 1) parietal white matter; 2) frontal white matter; 3) parieto-occipital cerebral cortex; 4) deep gray nuclei (DGN, including combined thalamus/caudate/putamen); and 5) ventral pons (mainly the basis pontis with occasional inclusion of the very ventral tegmentum due to tiny size in certain cases; Figs 1 and 2). We provide the number of spectra for each brain region in Table 1. The position of the ROIs and the function and morphological development of encircled structures in the ROI is summarized in Supplement Material 1.
Figure 1.

(Left) T2-weighted MRI indicating the parietal WM and parietal/occipital GM ROI. (Right) Representative spectra of parietal WM and parietal/occipital GM in subjects with normal MRI at different stages of brain development.
Figure 2.

Representative spectra of fWM, DGN, and brain stem of the newborn brain and at early adolescence.
Table 1.
Spectra from 309 subjects (161 male, 148 female) are included in these analyses
| Spectra | M/F | |
|---|---|---|
| Parietal/occipital GM | 211 | 111/100 |
| Parietal WM | 178 | 97/81 |
| Frontal WM | 46 | 24/22 |
| Deep gray nuclei | 33 | 17/16 |
| Brainstem | 25 | 20/5 |
The total number of spectra is 493 with 269 spectra acquired from male subjects and 224 spectra from female subjects. The number of spectra for each location varies because scan protocols did not always include every region of interest.
Metabolites Analyzed
We defined the developmental curves of the concentrations of 6 principal metabolites, as markers of neuronal integrity, energy metabolism, membrane integrity, and signal transduction in brain growth and development, as summarized below. Absolute metabolite concentrations (in mmol/kg tissue) were measured.
Neuronal Integrity
N-acetyl-aspartate
This metabolite is a major source of acetyl groups for lipid synthesis, as defined in rat development (Burri et al. 1991). It is synthesized in the mitochondria of neurons, diffuses along the axoplasma, and is degraded in oligodendrocytes (OLs; Patel and Clark 1979; Bates et al. 1996; Clark 1998). Although N-acetyl-aspartate (NAA) has been reported in immature OLs and O-2A progenitor cells in the developing brain (Urenjak et al. 1992, 1993), it is essentially not present in the myelin sheath, the product of mature OL membrane wrapping. The majority of NAA in the brain is stored in mature neurons and axons (Bjartmar et al. 2002). Thus, its concentration is considered a surrogate measure of the number and/or density of “adult-type” neurons and axons. In neurological disorders, reductions in NAA concentration are associated with neuronal and axonal injury and loss (Ross and Bluml 2001).
Glutamate/Glutamine
The amino acid glutamate is the most abundant excitatory neurotransmitter in the mammalian brain and is utilized by neurons throughout virtually all regions of the neuroaxis, thereby involved in multiple neural functions, including cognition, memory and learning, sensory and motor processing, and homeostasis (Curtis and Johnston 1974; Erecinska and Silver 1990; McEntee and Crook 1993; Coyle 1996; Ueda et al. 2001). Glutamine, on the other hand, is the major precursor for the amino acid neurotransmitters glutamate, aspartate (Asp), and γ-amino-butyric acid (GABA), and helps regulate their levels via the glutamine/glutamate cycle (Erecinska and Silver 1990). Glutamate released into the synaptic cleft is taken up by astrocytes and synthesized into glutamine, which in turn is transported back to neurons where it is metabolized to glutamate, Asp, and GABA (Erecinska and Silver 1990). Excessive levels of glutamate generated in hypoxia–ischemia and other pathological processes are toxic to neurons and OLs and lead to cell injury and/or death via the glutamate-receptor–mediated mechanisms of excitotoxicity (Manev et al. 1989). In MRS, the quantitation of glutamate in individual subjects is complicated by its complex spectral pattern and overlaps with glutamine. Thus, we also analyzed in this study the more robust sum of glutamate and glutamine.
Taurine
This metabolite, an aminosulfonic acid, is predominantly obtained from the diet, but in the brain, it can also be synthesized from the prerequisite amino acids (Hayes and Sturman 1981). It has been implicated in a variety of predominately neuronal processes, including inhibitory neurotransmission, neuroprotection against free radicals and glutamate, neurodevelopment (Miller et al. 2000; Pasantes-Morales and Hernández-Benítez 2010), and osmoregulation (Thurston et al. 1980). Importantly, taurine is an agonist at the inhibitory glycine and GABAA receptors (Huxtable 1989; Xu et al. 2006; Sergeeva et al. 2007; Jia et al. 2008). It also serves as a trophic factor in brain development, influencing neuronal proliferation, survival, and neurite outgrowth (Pasantes-Morales and Hernández-Benítez 2010).
Energy Metabolism
Creatine
This metabolite is a nitrogenous organic acid that is synthesized from 3 amino acids (l-arginine, glycine, and l-methionine) in the liver and kidney and transported to the brain where it is involved in adenosine triphosphate (ATP) metabolism and supplies energy to all brain cells, including neurons and OLs (Braissant et al. 2005). In normal brain tissue, the creatine (Cr) peak in MRS comprises contributions from free creatine (fCr) and phosphocreatine (PCr) in approximately equal proportions. PCr stores energy and maintains/replenishes ATP levels by converting PCr to fCr via the enzyme creatine kinase.
Membrane Integrity
Choline
This metabolite is an essential nutrient that is grouped with the B complex vitamins. It is present in phosphatidylcholine (PtdCho = lecithin) and sphingomyelin that are phospholipids abundant in cell membranes, including myelin (Zeisel et al. 1986). Thus, it is a marker of the structural integrity and signaling of cell membranes, notably myelin sheaths. PtdCho, “which is MRS invisible,” is the first polar lipid to appear in central nervous system white matter even before the initiation of active myelin synthesis and the expression of myelin-associated galactolipids (Kinney et al. 1994). Choline (Cho) is also the major precursor for the neurotransmitter acetylcholine, the latter whose concentration is below detectable limits with MRS, which is synthesized in cholinergic neurons in the basal forebrain and upper brainstem and released throughout the neuroaxis to influence arousal, cognition, learning, memory, and motor function (Brandon et al. 2004). In MRS, Cho is a complex peak comprising several Cho-containing metabolites, mostly phosphocholine (PC) and glycerophosphocholine (GPC). Their resonances, however, cannot be reliably separated at clinical field strength, and thus in this study, we only evaluated total Cho (Cho = PC plus GPC).
Signal Transduction
Myo-inositol
This metabolite, a sugar-like molecule, is implicated in signaling and second messenger systems in the brain (Fisher et al. 2002). Myo-inositol (mI) is either derived from the diet or synthesized by the kidneys. It is a precursor of phosphatidylinositol (PtdIns), a membrane phospholipid important for signal transduction events (Berry 2011) that is present in the white matter prior to active myelination (Kinney et al. 1994). mI also functions as a buffer in the regulation of extracellular osmolality (Thurston et al. 1989; Lien et al. 1990; Berry 2011) and is a putative marker of glial cells (Brand et al. 1993; Isaacks et al. 1994).
Data Acquisition and Processing
All MRS studies were performed on a 1.5 T MR system (Signa LX, GE Healthcare, Milwaukee, WI, United States of America) and were acquired as part of clinically indicated MR scan. Patients up to 5 years of age were anesthetized with 100–200 mg/min/kg propofol throughout the MR scan. Single-voxel 1H spectra were acquired using point resolved spectroscopy with a short echo time = 35 ms, a repetition time = 1.5 s, 128 signal averages, and a total acquisition time for each spectrum of approximately 5min, including scanner adjustments. Gray matter and white matter ROIs increased typically from 3 cm3 in newborns to 10 cm3 in adults to reflect the increase in brain size with increasing age. A standard head coil was used for acquisitions in older subjects (15–18 years), whereas for younger children and for newborns, custom-designed smaller pediatric and newborn head coils (Bluml et al. 2004) were used to ensure an optimal signal-to-noise ratio. All processing was performed using fully automated LCModel software (Stephen Provencher Inc., Oakville, Ontario, Canada, LCModel Version 6.1-4F). The basis set for LCModel included other metabolites than the 6 focused upon in this report, that is, alanine, Asp, lactate, Glc, scyllo-inositol, N-acetyl-aspartyl-glutamate (NAAG), and GABA. In this dataset, we did not find any significant changes across the epochs of child development and brain regions analyzed (data not shown). In the MRS literature, often the sum of NAA + NAAG has been reported. Since the sum of NAA + NAAG presented approximately the same result as NAA alone it is not reported.
Metabolite concentrations were corrected for the varying fractions of cerebrospinal fluid in the selected ROIs (Ernst et al. 1993). The signal from unsuppressed water was used as internal reference. The water content of the developing human brain is known to change rapidly from approximately 88% at term to approximately 85% 6 months after birth, with a gradual decline thereafter to approximately 82% and 73% in pure gray and white matter, respectively (Smart et al. 1973; Lentner 1981). Thus, from data published by Lentner (1981), we generated a reference table for water content as a function of postconceptional age that was used for the absolute quantitation of spectra in this study.
Modeling of Metabolite Concentration Versus Age
In a preliminary step, the MRS data from female and male subjects were analyzed separately, but since no significant difference in the developmental curves was found for any metabolite or for any developmental epoch, the data from both genders were pooled. To yield developmental curves, metabolite concentrations measured in all subjects were fitted to a number of model functions (see Supplement Material 2). Least-squares fits were carried out using MATLAB (R2010b, The Mathworks, Inc., Natick, MA, United States of America).The functions that fitted the data best (minimum χ2) and the corresponding fit parameters are reported. Errors for the fitted parameters were determined by Monte Carlo simulation (Shestov et al. 2007).
Statistical Analysis
As the metabolic development within the first 3 months was notably rapid and dramatic (see below), the epoch from 0 to 2 years was divided post hoc into 2 subepochs, 0–3 months and 3–24 months in order to capture the substantial changes of this early period. Subsequently, we performed linear regression analyses (StatPlus, AnalystSoft Inc., Alexandria, VA, United States of America) for metabolite concentrations versus age within each (sub)epoch: 0–3 months, 3–24 months, 2–5 years, 5–12 years, and 12–18 years. Metabolic changes were considered to be significant when the regression analyses yielded slopes that were significantly different from zero at a level of P < 0.05. Analysis of covariance (ANCOVA) was used to determine whether metabolite changes were different in different brain regions. This analysis was performed for parietal white matter (WM), parieto-occipital gray matter (GM), and frontal WM (fWM; only 0–3 months). Otherwise, the number of data points available was not considered sufficient for a detailed analysis of metabolic changes within all individual epochs. Here, we compared the mean concentrations, 0–3 months versus 3 months—18 years using unpaired, 2-tailed, Student's t-tests; P < 0.05 was considered to indicate significance. No corrections for multiple comparisons were applied. For epochs were metabolite concentrations appeared to increase or decrease upon visual inspection of curves, linear regression analyses were carried out to establish significance.
Results
We determined the developmental profile for the concentration of 6 key metabolites in 5 regions (Figs 1 and 2) over 4 epochs in human brain development. The final dataset included 309 normal children from birth to 18 years of age, including 161 males and 148 females, with normality defined by rigorous criteria. The total number of spectra included in this report was 493 with 269 spectra acquired from male subjects and 224 spectra from female subjects (Table 1). We found that each metabolite had a different developmental profile, which was age- and region-specific (Figs 3 and 4). Across different brain regions, certain metabolites rapidly increased in concentration and then plateaued, others decreased and then plateaued, and still others increased first and then decreased (Figs 3 and 4). Age-dependent metabolic changes and major developmental events for each region are summarized in Supplement Material 1. Listed in Supplement Material 3 are the functions and parameters that provided the best fit to the data for various metabolites and their relative concentrations across development. Below, we report the curves of the metabolite concentrations determined by MRS in the selected white matter, gray matter, and mixed ROIs at each developmental epoch. Importantly, the most rapid and dramatic changes occurred in the first 3 postnatal months, and with the exception of taurine in the parieto-occipital cortex, all metabolite levels within all brain regions sampled by 2 years of age were within 15% of the concentrations observed at the end of adolescence.
Figure 3.

Measured concentrations and fitted curves for NAA, creatine (Cr), total choline (Cho), and mI for the various brain regions studied versus age. A logarithmic scale was used for the time-axis (x-axis) to allow a more detailed inspection of age-dependent changes immediately after birth. PCA = postconceptional age.
Figure 4.
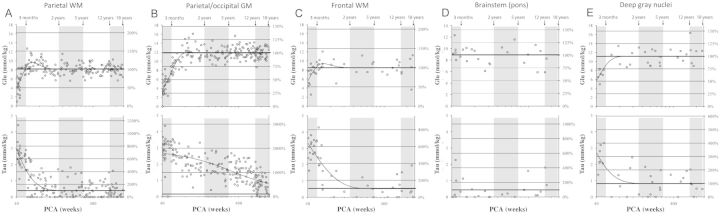
Measured concentrations and time courses for glutamate (Glu) and taurine (Tau) for the various brain regions studied versus age. PCA = postconceptional age.
Cerebral White Matter
While the parietal white matter is known to myelinate earlier and faster than the fWM in the human brain (Kinney et al. 1988), the timing and developmental curves of the concentrations of all 6 metabolites were similar at the fWM and parietal white matter sites throughout development. There were significant increases, or decreases, in the concentrations of NAA, Cr, glutamate, and mI within the first 3 postnatal months (all slopes P < 0.001), with approximately 130%, 50%, and 200% increases in NAA, Cr, and glutamate, respectively, and an approximately 40% decrease in mI. On the other hand, Cho and taurine remained close to constant (Table 2). Each curve changed after 3 months: NAA increased gradually, albeit not reaching significance in any individual epochs between 3 months and 5 years. A significant increase of NAA was again observed between 5 and 12 years in parietal WM (P< 0.001). Cr declined significantly between 3 months and 2 years (P < 0.001) and plateaued at 2 years. Glutamate peaked at approximately 4–6 months and declined significantly between 3 months and 2 years (P < 0.001) to plateau at 2 years. Cho slowly decreased between 3 months and 2 years (P < 0.001) and 2–5 years (P < 0.05) and reached a low plateau at approximately 6 years of age. mI decreased further between 3 months and 2 years (P < 0.001), but at lower rate, to reach a low plateau at 2 years. Taurine progressively declined (P < 0.05) to approximately 1–2 years at which time it reached a plateau.
Table 2.
ANCOVA and linear regression analyses of metabolite concentration were performed to describe metabolic maturation within individual epochs of human brain development
| Epoch | NAA | Cr | Cho | mI | Glu | Tau | ||
|---|---|---|---|---|---|---|---|---|
| 0–3 months | pWM | Mean | 4.94 ± 1.40 | 4.94 ± 0.80 | 2.05 ± 0.23 | 8.22 ± 1.52 | 5.52 ± 2.42 | 2.68 ± 0.80 |
| Slope | 0.35 ± 0.01 | 0.15 ± 0.01 | n.s. | −0.27 ± 0.02 | 0.50 ± 0.03 | n.s.*a | ||
| Δconc | 134% | 47% | n.s. | −37% | 198% | n.s. | ||
| GM | Mean | 4.32 ± 1.18*** (vs. pWM, fWM) | 4.71 ± 0.65 | 1.79 ± 0.22*** (vs. pWM, fWM) | 9.93 ± 1.58*** (vs. pWM, fWM) | 4.71 ± 1.90** (vs. fWM) | 3.02 ± 0.51 | |
| Slope | 0.31 ± 0.01 | 0.14 ± 0.01 | n.s. | −0.31 ± 0.02 | 0.39 ± 0.03 | n.s. | ||
| Δconc | 139% | 46% | n.s. | −36% | 168% | n.s. | ||
| fWM | Mean | 4.94 ± 1.75 | 4.73 ± 0.86 | 2.06 ± 0.21 | 8.14 ± 1.02 | 6.30 ± 2.08 | 2.96 ± 0.60 | |
| Slope | 0.40 ± 0.01 | 0.17 ± 0.01 | n.s. | −0.19 ± 0.01 | 0.31 ± 0.03 | n.s. | ||
| Δconc | 169% | 55% | n.s. | −29% | 79% | n.s. | ||
| 3 months–2 years | pWM | Mean | 7.60 ± 0.71 | 5.58 ± 0.59*** | 2.03 ± 024*** | 5.35 ± 1.05*** | 8.76 ± 1.55*** | 0.82 ± 0.77*** |
| Slope | n.s.*** | −0.02 ± 0.01*** | −0.004 ± 0.004 | −0.02 ± 0.01 | −0.03 ± 0.03*** | −0.010 ± 0.014 | ||
| Δconc | n.s. | −25% | −18% | −37% | −26% | −79% | ||
| GM | Mean | 7.69 ± 0.90 | 6.28 ± 0.54 | 1.54 ± 0.23 | 6.54 ± 0.68 | 10.93 ± 2.18 | 2.25 ± 0.66 | |
| Slope | 0.23 ± 0.01*** | 0.01 ± 0.01 | −0.006 ± 0.003 | −0.01 ± 0.01 | 0.04 ± 0.04 | −0.013 ± 0.011 | ||
| Δconc | 30% | 13% | −31% | −14% | 41% | −45% | ||
| 2–5 years | pWM | Mean | 8.26 ± 0.63*** | 5.12 ± 0.49*** | 1.77 ± 0.19*** | 4.61 ± 0.64*** | 8.39 ± 1.24*** | 0.48 ± 0.56*** |
| Slope | n.s. | n.s. | −0.002 ± 0.003* | n.s. | n.s. | n.s. | ||
| Δconc | n.s. | n.s. | −16% | n.s. | n.s. | n.s. | ||
| GM | Mean | 9.15 ± 0.78 | 6.67 ± 0.44 | 1.24 ± 0.14 | 6.04 ± 0.58 | 11.24 ± 1.33 | 1.79 ± 0.61 | |
| Slope | n.s. | n.s. | n.s. | −0.005 ± 0.010 | n.s. | n.s. | ||
| Δconc | n.s. | n.s. | n.s. | −12% | n.s. | n.s. | ||
| 5–12 years | pWM | Mean | 8.95 ± 0.74*** | 5.19 ± 0.44*** | 1.69 ± 0.19*** | 5.03 ± 0.82*** | 8.15 ± 1.09*** | 0.35 ± 0.40*** |
| Slope | 0.003 ± 0.012 | n.s. | n.s.*b | n.s. | n.s. | n.s.** | ||
| Δconc | 13% | n.s. | n.s. | n.s. | n.s. | n.s. | ||
| GM | Mean | 9.76 ± 0.67 | 6.88 ± 0.48 | 1.21 ± 0.16 | 5.77 ± 0.52 | 12.02 ± 1.02 | 1.45 ± 0.58 | |
| Slope | 0.002 ± 0.012 | 0.002 ± 0.008 | n.s.*b | n.s. | n.s. | −0.002 ± 0.011 | ||
| Δconc | 7% | 10% | n.s. | n.s. | n.s. | −37% | ||
| 12–18 years | pWM | Mean | 9.17 ± 0.63*** | 5.24 ± 0.46*** | 1.59 ± 0.24*** | 4.95 ± 0.66*** | 8.07 ± 1.08*** | 0.27 ± 0.38*** |
| Slope | n.s. | n.s. | n.s. | n.s. | n.s. | n.s. | ||
| Δconc | n.s. | n.s. | n.s. | n.s. | n.s. | n.s. | ||
| GM | Mean | 9.93 ± 0.56 | 6.95 ± 0.49 | 1.26 ± 0.15 | 5.79 ± 0.59 | 11.70 ± 1.17 | 0.77 ± 0.48 | |
| Slope | n.s. | n.s. | n.s. | n.s. | n.s. | n.s. | ||
| Δconc | n.s. | n.s. | n.s. | n.s. | n.s. | n.s. |
Tabulated are the adjusted mean concentration (mmol/kg) and slopes (mmol/kg/week) and their standard deviations. Δconc indicates the % increase (or decrease) of a metabolite between start and end of a developmental epoch. Parietal white matter (pWM) and parieto-occipital gray matter (GM) were analyzed. For fWM, a sufficient number of data points were only available for 0–3 months. Other epochs were not analyzed. Likewise, DGN and brainstem data were not analyzed due to the smaller number of data points available for those regions. Slopes significantly different from zero with P < 0.05 (regular font), P < 0.01 (italic), P < 0.001 (bold) are reported. Significant differences between mean concentrations or slopes of a metabolite for an individual epoch are indicated by *P < 0.05, **P < 0.01, and ***P < 0.001. n.s., not significant. For example, NAA was significantly different (P < 0.001) in pWM, GM, and fWM in the epoch 0–3 months. Also, all slopes were significantly different from zero at a level of P< 0.001. However, the slopes were not significantly different from each other. For epoch 0–3 months, the Tukey honestly significant difference test was used to determine for which brain regions metabolite levels were different.
aAlbeit the individual slopes were not significantly different from zero, when compared with each other they were significantly different as taurine tended to declined in pWM, whereas it tended to increase in GM during this epoch.
bSlopes were significantly different as Cho tended to decrease in pWM, whereas it tended to increase in GM during this epoch.
Gray Matter
The developmental curves of the concentrations of the selected metabolites differed markedly between the two gray matter sites analyzed: The parieto-occipital cortex and the subcortical gray matter site (caudate/putamen/thalamus). In the cortical region, there were striking increases of approximately 140%, 50%, and 170% in NAA, Cr, and glutamate, respectively, in the first 3 months, with an approximately 40% decrease in mI over this time-period (all slopes P < 0.001). Cortical Cho and taurine did not change during this time-period. After 3 months, the developmental curves again varied across metabolites, with plateaus reached at different ages for each of the metabolites. NAA increased more gradually between 3 months and 2 years (P < 0.001), remained unchanged between 2 and 5 years, increased again at 5–12 years (P < 0.05), and plateaued in adolescence. Glutamate continued to increase after 3 months (P < 0.001) and reached a plateau after approximately 1 year with no evidence for a further increase thereafter. As NAA, Cr increased between 3 months and 2 years (P < 0.01), remained constant between 2 and 5 years, and then increased again between 5 and 12 years of age (P < 0.001) into middle/late childhood. mI decreased gradually between 3 months and 2 years (P < 0.01) and between 2 and 5 years (P < 0.05) to plateau thereafter. For cortical Cho, a significant decline (P< 0.001) occurred between 3 months and 2 years, with a low plateau reached at approximately 2–5 years. Cortical taurine declined gradually and did not yet reach a low plateau by the end of adolescence and thus appears to decrease into adulthood. In DGN, glutamate increased markedly within the first 2 years (2.77 ± 1.86 mmol/kg/year, r2 = 0.49, P < 0.01, Figs 3 and 4). DGN NAA showed a more gradual increase over the first 2 years (1.55 ± 1.14 mmol/kg/year, r2 = 0.45, P < 0.01) than cortical NAA, whereas there was no evidence for significant changes of Cr levels in this brain region. Cho in DGN declined (−0.27 ± 0.45 mmol/kg/year, r2 = 0.55, P < 0.001) at a rate comparable with cortical Cho reaching a plateau at around 5 years of age. Also, mI declined gradually in this brain region over the first 5 years of life (−0.61 ± 1.26 mmol/kg/year, r2 = 0.39, P < 0.01). Taurine, in contrast to the slowly and progressively decline in the parieto-occipital cortex, declined more rapidly in DGN (ANCOVA, significant different slopes, P < 0.05; Table 3).
Table 3.
Metabolite concentrations in the brainstem and DGN in the first 3 months of life and 3 months–18 years
| Epoch | NAA | Cr | Cho | mI | Glu | Tau |
|---|---|---|---|---|---|---|
| Brainstem | ||||||
| 0–3 months | 7.29 ± 0.87** | 6.07 ± 0.64 | 2.97 ± 0.49 | 9.57 ± 1.50* | 9.51 ± 1.50 | 0.62 ± 0.89 |
| 3 months–18 years | 8.91 (122%) ±1.40 | 5.67 (93%) ±0.95 | 2.74 (92%) ±0.39 | 7.66 (80%) ±1.15 | 8.63 (91%) ±1.66 | 0.39 (63%) ±0.55 |
| Deep gray nuclei | ||||||
| 0–3 months | 6.05 ± 1.41** | 7.97 ± 1.66 | 2.87 ± 0.62** | 6.41 ± 2.01* | 7.71 ± 1.88*** | 2.12 ± 1.07* |
| 3 months–18 years | 8.13 (134%) ±0.95 | 7.61 (96%) ±1.02 | 1.78 (62%) ±0.33 | 4.67 (73%) ±0.97 | 11.14 (144%) ±1.78 | 0.87 (41%) ±0.70 |
*P < 0.05, **P < 0.01, and ***P < 0.001.
Brainstem Gray and White Matter: Ventral Pons
In contrast to the white and gray matter sites, there was only 1 metabolite, Cr, with a rapid change in concentration in the ventral pons in the first 3 months, that is, with a peak at approximately 3 months (Figs. 3 and 4). The concentration of NAA steadily increased over the first 5 years (0.61 ± 1.31 mmol/kg/year, r2 = 0.26, P < 0.05), with a plateau thereafter. The concentration of mI steadily decreased over the first 5 years (−0.63 ± 1.35 mmol/kg/year, r2 = 0.27, P < 0.05) followed by a plateau. At this stage, no significant developmental changes were observed for Cho, glutamate, or taurine.
Discussion
In this in vivo study of key metabolites in the human brain using MRS, we verified the a priori hypotheses that the developmental profiles of their concentrations vary from each other in different regions and across different epochs in from birth through adolescence, and that rapid changes in the concentrations of metabolites identify critical periods in specific developmental processes for which the metabolites are an essential component. In addition, striking changes in the concentrations of 4 metabolites (NAA, Cr, mI, Glu) in the cerebral white matter and the cortex during the first 3 postnatal months—indeed the most dramatic changes in any epoch—were observed. These findings are consistent with an earlier study by Kreis et al. (1993) in a smaller number of term and preterm subjects in this age range. These results indicate that this age range is a critical period, when a molecular or cellular process or a set of processes undergo a rapid and defining transformation and are thereby vulnerable to the deprivation of particular inputs and/or insults/injury. Interestingly, brain volume from birth to the third postnatal month increases from approximately 28%–43% of adult brain weight, with a near constant growth between 3 months and 18 months thereafter (8%–15% per 3-month period; Folkerth and Kinney 2008). It is quite possible that the critical period for subcortical gray matter (i.e., deep gray nucleus and ventral pons) occurs prior to birth, and thus, was “missed” in this postnatal study beginning at term birth. This possibility is in keeping with the general recognition that the brain develops caudal to rostral, with brainstem neuronal differentiation and myelination preceding that in DGN which in turn precedes that in the cortex (Sidman and Rakic 1973). An equally remarkable observation in our study to the rapid changes in metabolites in the first 3 months is that the metabolism of middle childhood and adolescence is relatively stable in the cerebral white matter and cortex.
Critical Period of Metabolic Development in the Cerebral White Matter From Birth to 3 Months
Metabolically, in the cerebral white matter, the first 3 postnatal months of human brain development are marked by dramatic changes in the concentrations of 4 of the 6 metabolites studied: Cr, NAA, and glutamate show an increase and mI shows a parallel decrease, whereas Cho and taurine remained stable. Interestingly, the developmental curves of the same metabolites are essentially identical between the fWM and parietal white matter, underscoring a stereotypy of key developmental events–myelination and axonal elongation–in white matter. The striking changes in Cr, NAA, glutamate, and mI occur “before” myelin tubules are detectable in the cerebral white matter of the parietal and frontal lobes (Kinney et al. 1988), revealing the complexity in the developmental processes that must occur before axons are ensheathed with myelin by mature OLs. The dramatic increase in Cr from birth to 3 months indicates increasing energy demands that depend upon ATP. As NAA is a marker for axons, its increase in concentration is consistent with marked axonal elongation and collateralization in the cerebral white matter during this period, and consistent with increased levels of the synaptic phosphoprotein growth-associated protein-43 (GAP-43), another marker of axonal elongation, in immunocytochemical studies (Haynes et al. 2005). Additionally, also consistent with the GAP-43 results, NAA remains high past the first 3 months, suggesting that NAA is not only a marker of axonal elongation, but also a marker of neuronal mitochondrial metabolism involving NAA. NAA has also been reported in OL precursor cells (PreOLs, i.e., immature OLs and O-2A progenitor cells) in the developing brain, whereas mature OLs and myelin contain little or no NAA (Urenjak et al. 1992, 1993). Thus, its dramatic increase in concentration in the cerebral white matter may also reflect, at least in part, the proliferation of immature OLs prior to their differentiation into myelin-producing (mature) OLs. Glutamate, whose function as an excitatory neurotransmitter is well established, has been shown more recently to play a role in interactions between axons and PreOLs, and glutamate release from axons into PreOLs cells may regulate PreOL proliferation (Gallo et al. 1996) or migration (Gudz et al. 2006). Thus, the dramatic increase and transient peak in glutamate in the white matter in the first 3 months may also reflect processes associated with the premyelinaton process. Rapidly changing metabolites are likely to be critical for OL proliferation and differentiation and protein and lipid accumulation in preparation for active myelin sheath production in the cerebral white matter. Of note, other changes in the telencephalic white matter in the first few postnatal months than myelination and axonal elongation occur, including changes in the density of subplate and interstial white matter neurons (Kostovic and Rakic 1990; Allendoerfer and Shatz 1994; Kinney et al. 2012), and metabolite changes may reflect these processes as well.
mI functions as a buffer for changes of extracellular osmolality (Thurston et al. 1989; Lien et al. 1990; Berry 2011) and it is a precursor of PtdIns, an important membrane phospholipid (Berry 2011), present in the white matter prior to active myelination (Kinney et al. 1994). The observation that mI dramatically falls from relatively high levels at birth suggests that the metabolic pathways and/or structures utilizing it regress as white matter maturation progresses. Cho remains close to constant during the first 3 postnatal months. Given that this metabolite is crucial to membrane integrity, including the formation of myelin (Kreis et al. 1993), this finding is consistent with the bulk of myelination in the fWM and parietal white matter occurring after the first 3 postnatal months. It has also been suggested that mI is a marker for glial cells (Brand et al. 1993; Isaacks et al. 1994). The biochemical/structural basis for the decline of taurine concentrations during the first 3 postnatal months is unknown and an area for future research.
Critical Period of Metabolic Development in the Cerebral Cortex From Birth to 3 Months
It is well established that major and rapid changes occur in the human cerebral cortex in the first 3 months of postnatal life, including in lamination, neuronal differentiation, synaptogenesis, and intragyral connectivity (Rakic and Yakovlev 1968; Changeux and Danchin 1976; Huttenlocher 1979; Mrzljak et al. 1988; Mrzljak et al. 1990; Rakic et al. 1994; Huttenlocher and Dabholkar 1997; Petanjek et al. 2008; Volpe 2008; Kostović et al. 2011; Xu et al. 2011). Thus, not surprisingly, we observed quite significant changes in the levels of 4 of the 6 metabolites in the cortical gray matter during this same period, albeit without the feasibility of point-to-point correlations between these levels and the different structural changes.
Dramatic changes were observed for 4 of the 6 metabolites in the cortical gray matter during the period between birth and 3 months. These include increases in NAA, glutamate, and Cr and a decrease in mI, and at the most general level, reflect the increasing metabolic demands in the cerebral cortex during this period, a finding that parallels earlier observations from PET imaging studies (Chugani et al. 1987, 1991; Kinnala et al. 1996). The concentration of glutamate increases dramatically in the cortex in the first 3 months of postnatal life, an increase that is in parallel to that of NAA (a marker of neuronal and axonal development) and Cr (a marker of ATP-related energy metabolism). The increase is either due to increasing glutamate synthesis by the on-site pyramidal cell bodies, increasing ingrowth of glutamatergic terminals from subcortical regions or from other ipsi- or contralateral cortical regions, or both. Because cortical measures of glutamate concentration are not available in the human “fetal” cortex, it is not possible to determine if the rapid and immediate postnatal increase is the continuation of a trajectory that began in fetal life, or rather, represents a sudden onset (a switch) at birth. The relative plateau in glutamate concentration in the cerebral cortex beyond 2 years is puzzling, given the tremendous cognitive changes mediated by cortical glutamate that occur beyond this period (Johnson et al. 1996). The maturation of other markers related to glutamate neurotransmission, including N-methyl-D-aspartate (NMDA) and non-NMDA receptors and vesicular and plasma membrane transporters, as opposed to glutamate itself, may account for functional changes presumably mediated by glutamatergic system beyond the first 3 postnatal months. Of note, the differing developmental curves for the same metabolites between the cortical and subcortical (gray matter) regions studied suggest that the maturational profiles of neurons depend upon unique connectivity and neurotransmitter specificity of that region, among other factors.
The question arises, what are the developmental landmarks of the first 3 months of human life that may be affected (determined?) by the intense changes in the metabolic profile of the cerebral cortex and white matter during this time frame? The key milestone of this period is the development of homeostatic regulation as the newborn transitions from intrauterine to extrauterine life (Davies 2004). This brief period is marked by the development of sleep/wake feeding cycles, cardiorespiratory stability, arousal patterns, and self-regulation, including self-soothing (Davies 2004). Additionally, between 2 and 4 months, there is a gradual attenuation and then loss of primary neonatal reflexes (e.g., Moro reflex, palmar grasp, tonic neck response; Volpe 2008). The burst in the metabolite concentrations over the first 3 postnatal months in the cerebral cortex and white matter reported here likely relates to biological processes that are potentially critical to cortically influenced homeostasis, arousal, and self-regulation via interactions with the thalamus, basal forebrain, hypothalamus, and brainstem—all with fiber systems traversing the cerebral white matter and synapsing with widespread and diffuse cerebral cortical regions (Parvizi et al. 2006).
Putative Metabolic Stability in Childhood and Adolescence
Our finding of relative stability beyond early infancy of the concentrations of the selected metabolites in all brain regions analyzed is striking in view of known neurobehavioral changes to occur in the preschool period, middle childhood, and adolescence. Adolescence, in particular, is marked by major changes in physical, psychological, and social development, as well as hormonal changes associated with puberty. A longitudinal study using MRI in subjects from approximately 4–20 years demonstrates that the volume of the cerebral cortex changes in middle childhood and adolescence, reaching a transient maximum in the frontal and parietal lobes around 12 years, a transient maximum in the temporal lobe around 16 years, and transient maximum in the occipital lobe around 20 years (Giedd et al. 1999). Similarly, metabolic data obtained from fluorodeoxyglucose-PET studies show a transient peak in cerebral metabolism between 3 and 8 years, when local cerebral metabolic rates range from 190% to 226% of corresponding adult values, and then a gradual decline to adult levels during preadolescence and adolescence (Chugani et al. 1991). Overall, published data are thought to reflect changes in cortical synapses: Synapses in the cortical neuropil undergo an initial overabundant production, reflected in an increase in the cortical volume, followed by programmed elimination, and decrease in cortical volume in accordance with different timetables in different brain regions (Huttenlocher and Dabholkar 1997). Given that taurine is involved in dendritic outgrowth and synaptic development, its decline across adolescence may reflect the programmed loss of neuropil suggested by the MRI study mentioned earlier. Decreasing levels of taurine have been observed in the developing rat brain (Tkác et al. 2003). The dissociation between the developmental profiles of different behaviors in adolescence and the metabolites analyzed in this study suggests that changes in other biochemical markers may likely underlie functional changes.
Potential Limitations of the Study
A potential limitation in this analysis of metabolite profiles is the fact that our subjects were possibly not neurologically normal, despite considerable effort to select such cases. Obtaining research scans on young children is challenging due to factors associated with obtaining permission to image healthy children. This is particularly a true for the period between 3 months of age and late preschool. In this period, research MRI scans must be acquired during sleep or with the cooperation of an awake child using distraction techniques. We thus analyzed MRS data acquired clinically over an 8-year period in those patients that we believed were “closest-to-normal” based on the unremarkable clinical follow-up.
Albeit ROIs, specifically white and gray matter locations, were selected to maximize a particular cell type to the extent technically feasible, they do contain mixtures of white and gray matter. That poses a limitation for the interpretation of specific changes for different cell types. Similarly, the brainstem and the DGN locations included heterogeneous structures with regard to white and gray matter, and results are thus not specific for the individual structures enclosed. A further consideration is that anesthesia, used to sedate patients, may have had an effect. Although an impact of anesthesia on metabolite levels cannot be excluded a priori, a previous study reported no differences in metabolite levels in anesthetized versus awake patients (Lundbom et al. 1999). In this study, there was an overlap of 5-year-old anesthetized and awake subjects with no apparent differences observed between the 2 groups. Concentrations were determined by fitting curves to individual MR spectra. Accordingly, it is expected that there is an experimental uncertainty in this measurement. This uncertainty is not uniform across metabolites included in this report due to both the inherent concentrations in the tissue—that is, signal strength—and the shape and position of the signal relative to other peaks. Thus, it should be considered that the intersubject variability is due to both measurement uncertainties and biological variations. Finally, not covered by our data are developmental changes that occur during the prenatal period and beyond 18 years of age. Nevertheless, the graphs and tables in this report, we believe, provide current and well-grounded information of the metabolic changes occurring in human brain development.
Conclusions
In summary, we provide extensive baseline data for the analysis of metabolic biomarkers in specific developmental epochs and regions in the developing human brain with in vivo mass spectroscopy. These data define birth to 3 months as an immensely active period in metabolite development in the human cerebral cortex and white matter. This insight carries important implications for the cognitive, behavioral, and emotional development of infants. Indeed, optimal stimulation and nutrition are essential in this extraordinary period of brain development to ensure that the infant's maximal neurodevelopmental potential is reached.
Supplementary Material
Supplementary material can be found at: http://www.cercor.oxfordjournals.org/.
Funding
Grant support was supported by Rudi Schulte Research Institute (S.B.), K23NS063371 (A.P.), 1UL1RR031986 (A.P., J.L.W., L.P.), and P50NS019632 (J.L.W.).
Supplementary Material
Notes
We thank Julia Castro and Arabhi Nagasunder, MS, for assistance the review of medical records and manuscript preparation. We thank Jane Tavare, MS, for help with the statistical analyses. We thank Dr Istvan Seri and the staff of the Center for Fetal and Neonatal Care for their support and Dr Hanna Damasio for her insightful comments regarding this manuscript. Conflict of Interest: None declared.
References
- Allendoerfer KL, Shatz CJ. The subplate, a transient neocortical structure: its role in the development of connections between thalamus and cortex. Annu Rev Neurosci. 1994;17:185–218. doi: 10.1146/annurev.ne.17.030194.001153. [DOI] [PubMed] [Google Scholar]
- Barkovich AJ. Pediatric neuroimaging. New York: Lippincott Williams & Wilkins; 2005. [Google Scholar]
- Bates TE, Strangward M, Keelan J, Davey GP, Munro PM, Clark JB. Inhibition of N-acetylaspartate production: implications for 1H MRS studies in vivo. Neuroreport. 1996;7:1397–1400. [PubMed] [Google Scholar]
- Berry GT. Is prenatal myo-inositol deficiency a mechanism of CNS injury in galactosemia? J Inherit Metab Dis. 2011;34:345–355. doi: 10.1007/s10545-010-9260-x. [DOI] [PubMed] [Google Scholar]
- Bjartmar C, Battistuta J, Terada N, Dupree E, Trapp BD. N-acetylaspartate is an axon-specific marker of mature white matter in vivo: a biochemical and immunohistochemical study on the rat optic nerve. Ann Neurol. 2002;51:51–58. doi: 10.1002/ana.10052. [DOI] [PubMed] [Google Scholar]
- Bluml S, Friedlich P, Erberich S, Wood JC, Seri I, Nelson MD., Jr MR imaging of newborns by using an MR-compatible incubator with integrated radiofrequency coils: initial experience. Radiology. 2004;231:594–601. doi: 10.1148/radiol.2312030166. [DOI] [PubMed] [Google Scholar]
- Braissant O, Henry H, Villard AM, Speer O, Wallimann T, Bachmann C. Creatine synthesis and transport during rat embryogenesis: spatiotemporal expression of AGAT, GAMT and CT1. BMC Dev Biol. 2005;5:9. doi: 10.1186/1471-213X-5-9. [DOI] [PMC free article] [PubMed] [Google Scholar]
- Brand A, Richter-Landsberg C, Leibfritz D. Multinuclear NMR studies on the energy metabolism of glial and neuronal cells. Dev Neurosci. 1993;15:289–298. doi: 10.1159/000111347. [DOI] [PubMed] [Google Scholar]
- Brandon EP, Mellott T, Pizzo DP, Coufal N, D'Amour KA, Gobeske K, Lortie M, López-Coviella I, Berse B, Thal LJ. Choline transporter 1 maintains cholinergic function in choline acetyltransferase haploinsufficiency. J Neurosci. 2004;24:5459–5466. doi: 10.1523/JNEUROSCI.1106-04.2004. [DOI] [PMC free article] [PubMed] [Google Scholar]
- Brody BA, Kinney HC, Kloman AS, Gilles FH. Sequence of central nervous system myelination in human infancy. I. An autopsy study of myelination. J Neuropathol Exp Neurol. 1987;46:283–301. doi: 10.1097/00005072-198705000-00005. [DOI] [PubMed] [Google Scholar]
- Burri R, Steffen C, Herschkowitz N. N-acetyl-l-aspartate is a major source of acetyl groups for lipid synthesis during rat brain development. Dev Neurosci. 1991;13:403–411. doi: 10.1159/000112191. [DOI] [PubMed] [Google Scholar]
- Cady EB, Penrice J, Amess PN, Lorek A, Wylezinska M, Aldridge RF, Franconi F, Wyatt JS, Reynolds EO. Lactate, N-acetylaspartate, choline and creatine concentrations, and spin-spin relaxation in thalamic and occipito-parietal regions of developing human brain. Magn Reson Med. 1996;36:878–886. doi: 10.1002/mrm.1910360610. [DOI] [PubMed] [Google Scholar]
- Changeux JP, Danchin A. Selective stabilisation of developing synapses as a mechanism for the specification of neuronal networks. Nature. 1976;264:705–712. doi: 10.1038/264705a0. [DOI] [PubMed] [Google Scholar]
- Chugani HT, Hovda DA, Villablanca JR, Phelps ME, Xu WF. Metabolic maturation of the brain: a study of local cerebral glucose utilization in the developing cat. J Cereb Blood Flow Metab. 1991;11:35–47. doi: 10.1038/jcbfm.1991.4. [DOI] [PubMed] [Google Scholar]
- Chugani HT, Phelps ME, Mazziotta JC. Positron emission tomography study of human brain functional development. Ann Neurol. 1987;22:487–497. doi: 10.1002/ana.410220408. [DOI] [PubMed] [Google Scholar]
- Clark JB. N-acetyl aspartate: a marker for neuronal loss or mitochondrial dysfunction. Dev Neurosci. 1998;20(4–5):271–276. doi: 10.1159/000017321. [DOI] [PubMed] [Google Scholar]
- Coyle JT. The glutamatergic dysfunction hypothesis for schizophrenia. Harv Rev Psychiatry. 1996;3:241–253. doi: 10.3109/10673229609017192. [DOI] [PubMed] [Google Scholar]
- Curtis DR, Johnston GA. Amino acid transmitters in the mammalian central nervous system. Ergeb Physiol. 1974;69:97–188. doi: 10.1007/3-540-06498-2_3. [DOI] [PubMed] [Google Scholar]
- Davies D. Child development: a practitioner's guide. The Guilford Press; 2004. [Google Scholar]
- Dobbing J, Sands J. Quantitative growth and development of human brain. Arch Dis Child. 1973;48:757–767. doi: 10.1136/adc.48.10.757. [DOI] [PMC free article] [PubMed] [Google Scholar]
- Erecinska M, Silver IA. Metabolism and role of glutamate in mammalian brain. Progr Neurobiol. 1990;35:245–296. doi: 10.1016/0301-0082(90)90013-7. [DOI] [PubMed] [Google Scholar]
- Ernst T, Kreis R, Ross BD. Absolute quantitation of water and metabolites in the human brain. I. Compartments and water. J Magn Reson. 1993;102:1–8. [Google Scholar]
- Fisher SK, Novak JE, Agranoff BW. Inositol and higher inositol phosphates in neural tissues: homeostasis, metabolism and functional significance. J Neurochem. 2002;82:736–754. doi: 10.1046/j.1471-4159.2002.01041.x. [DOI] [PubMed] [Google Scholar]
- Folkerth RD, Kinney HC. Greenfield's neuropathology. In: Louis DN, Love S, Ellison DW, editors. 8th ed. Hodder Arnold; 2008. [Google Scholar]
- Gallo V, Zhou JM, McBain CJ, Wright P, Knutson PL, Armstrong RC. Oligodendrocyte progenitor cell proliferation and lineage progression are regulated by glutamate receptor-mediated K+ channel block. J Neurosci. 1996;16:2659–2670. doi: 10.1523/JNEUROSCI.16-08-02659.1996. [DOI] [PMC free article] [PubMed] [Google Scholar]
- Giedd JN, Blumenthal J, Jeffries NO, Castellanos FX, Liu H, Zijdenbos A, Paus T, Evans AC, Rapoport JL. Brain development during childhood and adolescence: a longitudinal MRI study. Nat Neurosci. 1999;2:861–863. doi: 10.1038/13158. [DOI] [PubMed] [Google Scholar]
- Gilles FH. Myelination in the neonatal brain. Hum Pathol. 1976;7:244–248. doi: 10.1016/s0046-8177(76)80035-4. [DOI] [PubMed] [Google Scholar]
- Gudz TI, Komuro H, Macklin WB. Glutamate stimulates oligodendrocyte progenitor migration mediated via an alphav integrin/myelin proteolipid protein complex. J Neurosci. 2006;26:2458–2466. doi: 10.1523/JNEUROSCI.4054-05.2006. [DOI] [PMC free article] [PubMed] [Google Scholar]
- Hayes KC, Sturman JA. Taurine in metabolism. Annu Rev Nutr. 1981;1:401–425. doi: 10.1146/annurev.nu.01.070181.002153. [DOI] [PubMed] [Google Scholar]
- Haynes RL, Borenstein NS, Desilva TM, Folkerth RD, Liu LG, Volpe JJ, Kinney HC. Axonal development in the cerebral white matter of the human fetus and infant. J Comp Neurol. 2005;484:156–167. doi: 10.1002/cne.20453. [DOI] [PubMed] [Google Scholar]
- Huppi PS, Posse S, Lazeyras F, Burri R, Bossi E, Herschkowitz N. Magnetic resonance in preterm and term newborns: 1H-spectroscopy in developing human brain. Pediatr Res. 1991;30:574–578. doi: 10.1203/00006450-199112000-00017. [DOI] [PubMed] [Google Scholar]
- Huppi PS, Warfield S, Kikinis R, Barnes PD, Zientara GP, Jolesz FA, Tsuji MK, Volpe JJ. Quantitative magnetic resonance imaging of brain development in premature and mature newborns. Ann Neurol. 1998;43:224–235. doi: 10.1002/ana.410430213. [DOI] [PubMed] [Google Scholar]
- Huttenlocher PR. Synaptic density in human frontal cortex—developmental changes and effects of aging. Brain Res. 1979;163:195–205. doi: 10.1016/0006-8993(79)90349-4. [DOI] [PubMed] [Google Scholar]
- Huttenlocher PR, Dabholkar AS. Regional differences in synaptogenesis in human cerebral cortex. J Comp Neurol. 1997;387:167–178. doi: 10.1002/(sici)1096-9861(19971020)387:2<167::aid-cne1>3.0.co;2-z. [DOI] [PubMed] [Google Scholar]
- Huxtable RJ. Taurine in the central nervous system and the mammalian actions of taurine. Prog Neurobiol. 1989;32:471–533. doi: 10.1016/0301-0082(89)90019-1. [DOI] [PubMed] [Google Scholar]
- Isaacks RE, Bender AS, Kim CY, Prieto NM, Norenberg MD. Osmotic regulation of myo-inositol uptake in primary astrocyte cultures. Neurochem Res. 1994;19:331–338. doi: 10.1007/BF00971582. [DOI] [PubMed] [Google Scholar]
- Jia F, Yue M, Chandra D, Keramidas A, Goldstein PA, Homanics GE, Harrison NL. Taurine is a potent activator of extrasynaptic GABA(A) receptors in the thalamus. J Neurosci. 2008;28:106–115. doi: 10.1523/JNEUROSCI.3996-07.2008. [DOI] [PMC free article] [PubMed] [Google Scholar]
- Johnson M, Perry RH, Piggott MA, Court JA, Spurden D, Lloyd S, Ince PG, Perry EK. Glutamate receptor binding in the human hippocampus and adjacent cortex during development and aging. Neurobiol Aging. 1996;17:639–651. doi: 10.1016/0197-4580(96)00064-4. [DOI] [PubMed] [Google Scholar]
- Kinnala A, Suhonen-Polvi H, Aärimaa T, Kero P, Korvenranta H, Ruotsalainen U, Bergman J, Haaparanta M, Solin O, Nuutila P. Cerebral metabolic rate for glucose during the first six months of life: an FDG positron emission tomography study. Arch Dis Child Fetal Neonatal Ed. 1996;74:F153–157. doi: 10.1136/fn.74.3.f153. [DOI] [PMC free article] [PubMed] [Google Scholar]
- Kinney HC, Brody BA, Kloman AS, Gilles FH. Sequence of central nervous system myelination in human infancy. II. Patterns of myelination in autopsied infants. J Neuropathol Exp Neurol. 1988;47:217–234. doi: 10.1097/00005072-198805000-00003. [DOI] [PubMed] [Google Scholar]
- Kinney HC, Haynes RL, Xu G, Andiman SE, Folkerth RD, Sleeper LA, Volpe JJ. Neuron deficit in the white matter and subplate in periventricular leukomalacia. Ann Neurol. 2012;71:397–406. doi: 10.1002/ana.22612. [DOI] [PMC free article] [PubMed] [Google Scholar]
- Kinney HC, Karthigasan J, Borenshteyn NI, Flax JD, Kirschner DA. Myelination in the developing human brain: biochemical correlates. Neurochem Res. 1994;19:983–996. doi: 10.1007/BF00968708. [DOI] [PubMed] [Google Scholar]
- Kostovic I. Structural and histochemical reorganization of the human prefrontal cortex during perinatal and postnatal life. In: Uylings HBM, Van Eden CG, De Bruin JPC, Corner MA, Feenstra MGP, editors. Progress in brain research. Elsevier; 1990. [DOI] [PubMed] [Google Scholar]
- Kostovic I, Rakic P. Developmental history of the transient subplate zone in the visual and somatosensory cortex of the macaque monkey and human brain. J Comp Neurol. 1990;297:441–470. doi: 10.1002/cne.902970309. [DOI] [PubMed] [Google Scholar]
- Kostović I, Judaš M, Sedmak G. Developmental history of the subplate zone, subplate neurons and interstitial white matter neurons: relevance for schizophrenia. Int J Dev Neurosci. 2011;29:193–205. doi: 10.1016/j.ijdevneu.2010.09.005. [DOI] [PubMed] [Google Scholar]
- Kreis R, Ernst T, Ross BD. Development of the human brain: in vivo quantification of metabolite and water content with proton magnetic resonance spectroscopy. Magn Reson Med. 1993;30:424–437. doi: 10.1002/mrm.1910300405. [DOI] [PubMed] [Google Scholar]
- Kreis R, Hofmann L, Kuhlmann B, Boesch C, Bossi E, Huppi PS. Brain metabolite composition during early human brain development as measured by quantitative in vivo 1H magnetic resonance spectroscopy. Magn Reson Med. 2002;48:949–958. doi: 10.1002/mrm.10304. [DOI] [PubMed] [Google Scholar]
- Lentner C. Geigy Scientific Tables. In: Ciba G, editor. Basel, Switzerland: Ciba-Geigy; 1981. p. 220. 222, 223. [Google Scholar]
- Lien YH, Shapiro JI, Chan L. Effects of hypernatremia on organic brain osmoles. J Clin Invest. 1990;85:1427–1435. doi: 10.1172/JCI114587. [DOI] [PMC free article] [PubMed] [Google Scholar]
- Lundbom NM, Manner T, Komu M, Peltola O, Leino KA, Kirvelä OA. Barbiturate anesthesia and brain proton spectroscopy. AJNR Am J Neuroradiol. 1999;20:1543–1546. [PMC free article] [PubMed] [Google Scholar]
- Manev H, Favaron M, Guidotti A, Costa E. Delayed increase of Ca2+ influx elicited by glutamate: role in neuronal death. Mol Pharmacol. 1989;36:106–112. [PubMed] [Google Scholar]
- Marin-Padilla M. The human brain: prenatal development and structure. Heidelberg: Springer; 2011. [Google Scholar]
- McEntee WJ, Crook TH. Glutamate: its role in learning, memory, and the aging brain. Psychopharmacology (Berl) 1993;111:391–401. doi: 10.1007/BF02253527. [DOI] [PubMed] [Google Scholar]
- Miller TJ, Hanson RD, Yancey PH. Developmental changes in organic osmolytes in prenatal and postnatal rat tissues. Comp Biochem Physiol A Mol Integr Physiol. 2000;125:45–56. doi: 10.1016/s1095-6433(99)00160-9. [DOI] [PubMed] [Google Scholar]
- Mrzljak L, Uylings HB, Kostovic I, Van Eden CG. Prenatal development of neurons in the human prefrontal cortex: I. A qualitative Golgi study. J Comp Neurol. 1988;271:355–386. doi: 10.1002/cne.902710306. [DOI] [PubMed] [Google Scholar]
- Mrzljak L, Uylings HB, Van Eden CG, Judás M. Neuronal development in human prefrontal cortex in prenatal and postnatal stages. Prog Brain Res. 1990;85:185–222. doi: 10.1016/s0079-6123(08)62681-3. [DOI] [PubMed] [Google Scholar]
- Parvizi J, Van Hoesen GW, Buckwalter J, Damasio A. Neural connections of the posteromedial cortex in the macaque. Proc Natl Acad Sci USA. 2006;103:1563–1568. doi: 10.1073/pnas.0507729103. [DOI] [PMC free article] [PubMed] [Google Scholar]
- Pasantes-Morales H, Hernández-Benítez R. Taurine and brain development: trophic or cytoprotective actions. Neurochem Res. 2010;35:1939–1943. doi: 10.1007/s11064-010-0262-8. [DOI] [PubMed] [Google Scholar]
- Patel TB, Clark JB. Synthesis of N-acetyl-l-aspartate by rat brain mitochondria and its involvement in mitochondrial/cytosolic carbon transport. Biochem J. 1979;184:539–546. doi: 10.1042/bj1840539. [DOI] [PMC free article] [PubMed] [Google Scholar]
- Petanjek Z, Judas M, Kostović I, Uylings HB. Lifespan alterations of basal dendritic trees of pyramidal neurons in the human prefrontal cortex: a layer-specific pattern. Cereb Cortex. 2008;18:915–929. doi: 10.1093/cercor/bhm124. [DOI] [PubMed] [Google Scholar]
- Petanjek Z, Judaš M, Šimic G, Rasin MR, Uylings HB, Rakic P, Kostovic I. Extraordinary neoteny of synaptic spines in the human prefrontal cortex. Proc Natl Acad Sci USA. 2011;108:13281–13286. doi: 10.1073/pnas.1105108108. [DOI] [PMC free article] [PubMed] [Google Scholar]
- Pouwels PJ, Brockmann K, Kruse B, Wilken B, Wick M, Hanefeld F, Frahm J. Regional age dependence of human brain metabolites from infancy to adulthood as detected by quantitative localized proton MRS. Pediatr Res. 1999;46:474–485. doi: 10.1203/00006450-199910000-00019. [DOI] [PubMed] [Google Scholar]
- Rakic P, Bourgeois JP, Goldman-Rakic PS. Synaptic development of the cerebral cortex: implications for learning, memory, and mental illness. Prog Brain Res. 1994;102:227–243. doi: 10.1016/S0079-6123(08)60543-9. [DOI] [PubMed] [Google Scholar]
- Rakic P, Yakovlev PI. Development of the corpus callosum and cavum septi in man. J Comp Neurol. 1968;132:45–72. doi: 10.1002/cne.901320103. [DOI] [PubMed] [Google Scholar]
- Ross B, Bluml S. Magnetic resonance spectroscopy of the human brain. Anat Rec. 2001;265:54–84. doi: 10.1002/ar.1058. [DOI] [PubMed] [Google Scholar]
- Sergeeva OA, Fleischer W, Chepkova AN, Warskulat U, Häussinger D, Siebler M, Haas HL. GABAA-receptor modification in taurine transporter knockout mice causes striatal disinhibition. J Physiol. 2007;585:539–548. doi: 10.1113/jphysiol.2007.141432. [DOI] [PMC free article] [PubMed] [Google Scholar]
- Shestov AA, Valette J, Uğurbil K, Henry PG. On the reliability of (13)C metabolic modeling with two-compartment neuronal-glial models. J Neurosci Res. 2007;85:3294–3303. doi: 10.1002/jnr.21269. [DOI] [PubMed] [Google Scholar]
- Sidman RL, Rakic P. Neuronal migration, with special reference to developing human brain: a review. Brain Res. 1973;62:1–35. doi: 10.1016/0006-8993(73)90617-3. [DOI] [PubMed] [Google Scholar]
- Smart JL, Dobbing J, Adlard BP, Lynch A, Sands J. Vulnerability of developing brain: relative effects of growth restriction during the fetal and suckling periods on behavior and brain composition of adult rats. J Nutr. 1973;103:1327–1338. doi: 10.1093/jn/103.9.1327. [DOI] [PubMed] [Google Scholar]
- Sowell ER, Thompson PM, Tessner KD, Toga AW. Mapping continued brain growth and gray matter density reduction in dorsal frontal cortex: inverse relationships during postadolescent brain maturation. J Neurosci. 2001;21:8819–8829. doi: 10.1523/JNEUROSCI.21-22-08819.2001. [DOI] [PMC free article] [PubMed] [Google Scholar]
- Thurston JH, Hauhart RE, Dirgo JA. Taurine: a role in osmotic regulation of mammalian brain and possible clinical significance. Life Sci. 1980;26:1561–1568. doi: 10.1016/0024-3205(80)90358-6. [DOI] [PubMed] [Google Scholar]
- Thurston JH, Sherman WR, Hauhart RE, Kloepper RF. Myo-inositol: a newly identified nonnitrogenous osmoregulatory molecule in mammalian brain. Pediatr Res. 1989;26:482–485. doi: 10.1203/00006450-198911000-00024. [DOI] [PubMed] [Google Scholar]
- Tkác I, Rao R, Georgieff MK, Gruetter R. Developmental and regional changes in the neurochemical profile of the rat brain determined by in vivo 1H NMR spectroscopy. Magn Reson Med. 2003;50:24–32. doi: 10.1002/mrm.10497. [DOI] [PubMed] [Google Scholar]
- Toft PB, Leth H, Lou HC, Pryds O, Henriksen O. Metabolite concentrations in the developing brain estimated with proton MR spectroscopy. J Magn Reson Imaging. 1994;4:674–680. doi: 10.1002/jmri.1880040510. [DOI] [PubMed] [Google Scholar]
- Ueda Y, Doi T, Tokumaru J, Yokoyama H, Nakajima A, Mitsuyama Y, Ohya-Nishiguchi H, Kamada H, Willmore LJ. Collapse of extracellular glutamate regulation during epileptogenesis: down-regulation and functional failure of glutamate transporter function in rats with chronic seizures induced by kainic acid. J Neurochem. 2001;76:892–900. doi: 10.1046/j.1471-4159.2001.00087.x. [DOI] [PubMed] [Google Scholar]
- Urenjak J, Williams SR, Gadian DG, Noble M Department of Biophysics HIRCoSoEL. Proton nuclear magnetic resonance spectroscopy unambiguously identifies different neural cell types. J Neurosci. 1993;13(3):981–989. doi: 10.1523/JNEUROSCI.13-03-00981.1993. [DOI] [PMC free article] [PubMed] [Google Scholar]
- Urenjak J, Williams SR, Gadian DG, Noble M Department of Biophysics HIRCoSoELE. Specific expression of N-acetylaspartate in neurons, oligodendrocyte-type-2 astrocyte progenitors, and immature oligodendrocytes in vitro. J Neurochem. 1992;59(1):55–61. doi: 10.1111/j.1471-4159.1992.tb08875.x. [DOI] [PubMed] [Google Scholar]
- van der Knaap MS, van der Grond J, van Rijen PC, Faber JA, Valk J, Willemse K. Age-dependent changes in localized proton and phosphorus MR spectroscopy of the brain. Radiology. 1990;176:509–515. doi: 10.1148/radiology.176.2.2164237. [DOI] [PubMed] [Google Scholar]
- Volpe JJ. Neurology of the newborn. Philadelphia: Saunders Elsevier; 2008. [Google Scholar]
- Waber DP, De Moor C, Forbes PW, Almli CR, Botteron KN, Leonard G, Milovan D, Paus T, Rumsey J, Group BDC. The NIH MRI study of normal brain development: performance of a population based sample of healthy children aged 6 to 18 years on a neuropsychological battery. J Int Neuropsychol Soc. 2007;13:729–746. doi: 10.1017/S1355617707070841. [DOI] [PubMed] [Google Scholar]
- Xu G, Broadbelt KG, Haynes RL, Folkerth RD, Borenstein NS, Belliveau RA, Trachtenberg FL, Volpe JJ, Kinney HC. Late development of the GABAergic system in the human cerebral cortex and white matter. J Neuropathol Exp Neurol. 2011;70:841–858. doi: 10.1097/NEN.0b013e31822f471c. [DOI] [PMC free article] [PubMed] [Google Scholar]
- Xu H, Wang W, Tang ZQ, Xu TL, Chen L. Taurine acts as a glycine receptor agonist in slices of rat inferior colliculus. Hear Res. 2006;220:95–105. doi: 10.1016/j.heares.2006.07.005. [DOI] [PubMed] [Google Scholar]
- Yakovlev PI, LeCours AR. The myelogenetic cycles of regional maturation of the brain. In: Minkowski A, editor. Regional development of the brain in early life. Oxford: Blackwell; 1967. pp. 3–70. [Google Scholar]
- Zeisel SH, Char D, Sheard NF. Choline, phosphatidylcholine and sphingomyelin in human and bovine milk and infant formulas. J Nutr. 1986;116:50–58. doi: 10.1093/jn/116.1.50. [DOI] [PubMed] [Google Scholar]
Associated Data
This section collects any data citations, data availability statements, or supplementary materials included in this article.