

Abstract
Obesity is a major public health problem with strong genetic determination. Multiple genetic variants have been implicated for obesity by conducting genome-wide association (GWA) studies, primarily focused on body mass index (BMI). Fat body mass (FBM) is phenotypically more homogeneous than BMI and is more appropriate for obesity research; however, relatively few studies have been conducted on FBM. Aiming to identify variants associated with obesity, we carried out meta-analyses of seven GWA studies for BMI-related traits including FBM, and followed these analyses by de novo replication. The discovery cohorts consisted of 21 969 individuals from diverse ethnic populations and a total of over 4 million genotyped or imputed SNPs. The de novo replication cohorts consisted of 6663 subjects from two independent samples. To complement individual SNP-based association analyses, we also carried out gene-based GWA analyses in which all variations within a gene were considered jointly. Individual SNP-based association analyses identified a novel locus 1q21 [rs2230061, CTSS (Cathepsin S)] that was associated with FBM after the adjustment of lean body mass (LBM) (P = 3.57 × 10⁻⁸) at the genome-wide significance level. Gene-based association analyses identified a novel gene NLK (nemo-like kinase) in 17q11 that was significantly associated with FBM adjusted by LBM. In addition, we confirmed three previously reported obesity susceptibility loci: 16q12 [rs62033400, P = 1.97 × 10⁻¹⁴, FTO (fat mass and obesity associated)], 18q22 [rs6567160, P = 8.09 × 10⁻¹⁹, MC4R (melanocortin 4 receptor)] and 2p25 [rs939583, P = 1.07 × 10⁻⁷, TMEM18 (transmembrane protein 18)]. We also found that rs6567160 may exert pleiotropic effects to both FBM and LBM. Our results provide additional insights into the molecular genetic basis of obesity and may provide future targets for effective prevention and therapeutic intervention.
INTRODUCTION
Obesity is a serious public health problem associated with an increased risk of type 2 diabetes, hypertension, cardiovascular disease and certain forms of cancer (1). In the USA, over two-thirds of the population are overweight and about one-third are obese (2). The annual economic cost attributable to obesity in the USA is as high as $100 billion (3).
Obesity is under strong genetic control (4–8). Body mass index (BMI) and fat body mass (FBM) are two important indices of obesity and both have strong genetic determination with heritability of 0.4–0.7 (4–8). BMI has been used widely for obesity research because it can be measured conveniently at low cost for large samples. However, BMI alone may not be accurate enough for assessing the extent of excessive fat accumulation and thus the health hazard of obesity because (1) body weight is mainly composed of FBM and lean body mass (LBM), which are under different development mechanisms; and (2) BMI may not always represent body fat appropriately since the relationship between BMI and FBM is not always linear (9). FBM is considered phenotypically more homogeneous than BMI and may be advantageous for obesity research (4).
More than 10 genome-wide association (GWA) studies have been published for identifying genetic variants underlying obesity (10–21), primarily focused on BMI. These GWA studies have identified a number of obesity genes/loci, such as FTO (fat mass and obesity associated), MC4R (melanocortin 4 receptor), NPC1, PTER, MAF, NRXN3, KCNMA1, PAX5, MRPS22, C12orf51 and CTNNBL1. Meta-analytic combination of multiple GWA studies is an efficient way to enhance the power of gene identification by greatly increasing the sample sizes. Several GWA meta-analyses identified additional susceptibility genes/loci underlying obesity (22–26), such as TMEM18 (transmembrane protein 18), KCTD15, GNPDA2, SH2B1, MTCH2, NEGR1, SDCCAG8, TNKS/MSRA, RBJ/ADCY3/POMC, QPCTL/GIPR, SLC39A8, TMEM160, FANCL, CADM2, LRP1B, PTBP2, MTIF3/GTF3A, ZNF608, RPL27A/TUB, NUDT3/HMGA1,OLFM4 and HOXB5. However, the genetic variants identified so far only explain a small fraction of the heritability attributable to obesity (24).
In the present study, aiming to identify additional genetic variants associated with human obesity, we conducted a GWA meta-analysis for obesity-related phenotypes in populations of diverse ethnicities. The discovery samples included seven GWA studies (n = 21 969) and millions of genotyped/imputed SNPs from the 1000 Genomes Project (1000G) (27) reference panels. Significant SNPs were further de novo genotyped in two independent samples (n = 6663). Gene-based association analysis is a useful complement to individual SNP-based GWA analysis (28). In the presence of allelic heterogeneity, it is more powerful than traditional individual SNP-based analytical approaches (29). In addition to the meta-analytic association testing per SNP, we also evaluated the significance of all genes across the genome using the gene-based analyses.
RESULTS
The discovery meta-analysis included 21 969 individuals from the following seven GWA studies (see Supplementary Material, Methods and Materials): OOS (n = 998) (30), KCOS (n = 2283), COS (n = 1624), FHS (n = 4760) (31), IFS (n = 1478) (32), WHI-AA (n = 7478) and WHI-HIS (n = 3348). Basic characteristics of the samples are listed in Table 1. The majority of individuals were women (n = 17 955). No population outlier was observed with principal components analysis (33). Imputation with the 1000G reference panels generated over 4 million SNPs that were qualified for further analyses (Supplementary Material, Table S1).
Table 1.
Basic characteristics of study samples
| Gender | Stage | Sample | Ancestry | Sample size | Age (years) | Height (m) | Weight (kg) | BMI (kg/m2) | FBM (kg) | PFM (%) |
|---|---|---|---|---|---|---|---|---|---|---|
| Female | Discovery | OOS | Caucasian | 498 (487) | 50.1 (17.7) | 1.64 (0.06) | 71.22 (15.86) | 26.58 (5.96) | 26.61 (10.43) | 36.95 (7.08) |
| KCOS | Caucasian | 1727 (1727) | 51.6 (12.9) | 1.63 (0.06) | 71.45 (16.04) | 26.82 (5.98) | 25.27 (10.78) | 33.85 (7.73) | ||
| COS | Chinese | 823 (822) | 37.5 (13.8) | 1.58 (0.05) | 54.63 (8.09) | 21.78 (3.05) | 16.13 (4.87) | 29.30 (5.36) | ||
| FHS | Caucasian | 2606 (1787) | 66.1 (13.2) | 1.59 (0.07) | 69.18 (15.67) | 27.19 (5.74) | 27.04 (8.52) | 41.51 (7.29) | ||
| IFS | Caucasian | 1478 (1433) | 32.7 (7.2) | 1.65 (0.06) | 71.65 (16.89) | 26.21 (5.97) | 25.33 (12.05) | 36.41 (9.20) | ||
| WHI-AA | African American | 7478 (709) | 60.9 (6.9) | 1.62 (0.06) | 83.15 (17.72) | 31.00 (6.33) | 37.53 (12.65) | 45.26 (6.79) | ||
| WHI-HIS | Hispanic | 3348 (408) | 60.7 (7.2) | 1.57 (0.06) | 73.87 (15.62) | 28.80 (5.45) | 32.58 (10.66) | 44.73 (6.90) | ||
| Replication | OOSR | Caucasian | 2261 (2261) | 49.1 (14.7) | 1.63 (0.06) | 72.05 (17.76) | 26.96 (6.50) | 26.64 (11.44) | 35.41 (7.34) | |
| COSR | Chinese | 1580 (1580) | 53.4 (7.7) | 1.58 (0.05) | 53.36 (7.34) | 21.25 (2.93) | 15.35 (4.76) | 28.60 (5.32) | ||
| OOS | Caucasian | 500 (488) | 50.4 (18.9) | 1.78 (0.07) | 89.04 (14.93) | 28.15 (4.47) | 23.40 (8.88) | 26.13 (6.59) | ||
| KCOS | Caucasian | 556 (556) | 50.7 (16.0) | 1.76 (0.07) | 87.12 (16.74) | 28.12 (4.85) | 20.75 (9.35) | 22.89 (6.88) | ||
| Discovery | COS | Chinese | 801 (800) | 31.4 (11.9) | 1.70 (0.06) | 65.74 (9.64) | 22.65 (2.93) | 11.86 (5.14) | 17.78 (5.75) | |
| FHS | Caucasian | 2154 (999) | 64.8 (12.4) | 1.73 (0.08) | 85.04 (15.44) | 28.13 (4.48) | 22.35 (6.20) | 28.95 (5.93) | ||
| Male | Replication | IFS | Caucasian | 0 | – | – | – | – | – | – |
| WHI-AA | African American | 0 | – | – | – | – | – | – | ||
| WHI-HIS | Hispanic | 0 | – | – | – | – | – | – | ||
| OOSR | Caucasian | 1662 (1662) | 43.5 (13.5) | 1.76 (0.07) | 84.09 (17.12) | 27.05 (5.14) | 19.78 (9.65) | 22.63 (7.06) | ||
| COSR | Chinese | 1160 (1160) | 63.8 (9.4) | 1.70 (0.05) | 63.80 (9.46) | 22.07 (2.93) | 11.00 (4.76) | 16.93 (5.78) |
Notes: Sample size is presented as number of subjects with available BMI (FBM).
Means (standard deviation) for age, height and weight were calculated based on subjects with BMI information.
Meta-analysis of individual SNPs
Prior to meta-analysis, association statistics in each individual sample were corrected using genomic control (GC) approach (lambda = 0.98–1.08). A logarithmic quantile–quantile plot of the meta-analysis test statistics showed a marked deviation in the tail of the distribution, implying existence of true associations in these samples (Fig. 1).
Figure 1.
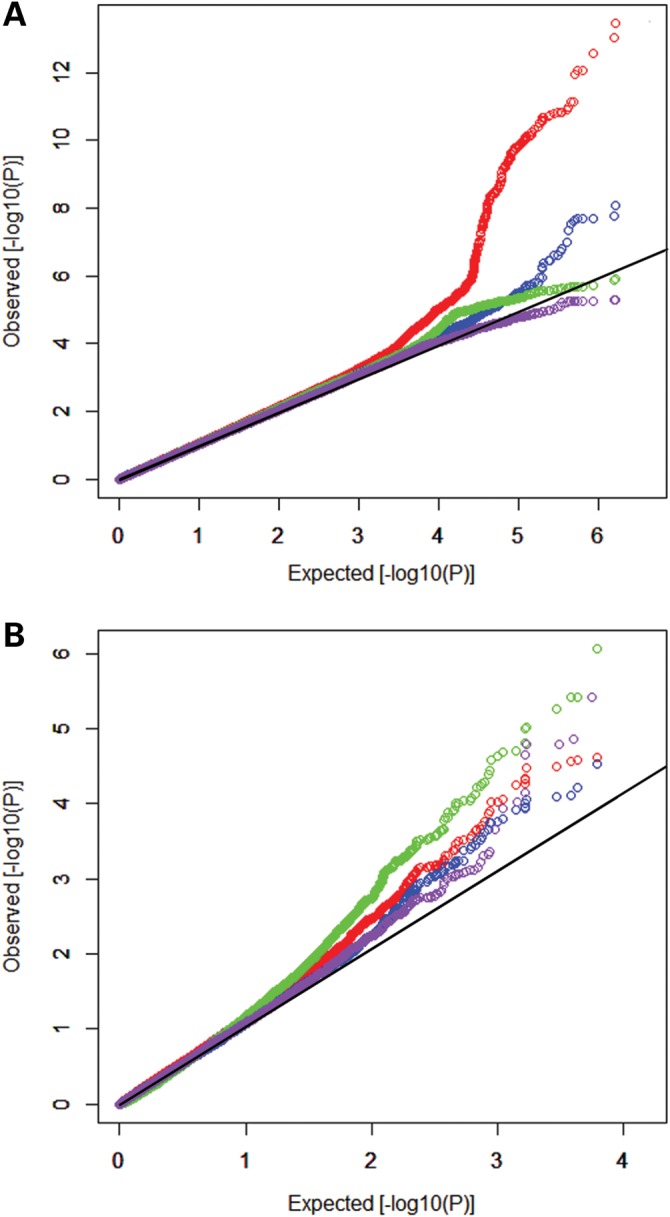
Logarithmic quantile–quantile (QQ) plot of the meta-analysis test statistics. (A) The QQ plot for SNP-based analyses for BMI (red dot), FBM (blue dot), FBM(adj) (green dot) and PFM (purple dot); and (B) the QQ plot for the gene-based analyses for BMI (red dot), FBM (blue dot), FBM(adj) (green dot) and PFM (purple dot).
The discovery GWA meta-analyses identified two genomic regions in 18q22 and 16q12 at the genome-wide significance (GWS) level (5 × 10⁻⁸). In 18q22, the most prominent association was observed at rs6567160 for BMI (P = 7.23 × 10⁻¹⁴, Table 2). Association at the same locus was also found for FBM (P = 1.91 × 10⁻⁷), of which the lead SNP was rs17782313 (P = 8.57 × 10⁻⁹). These two SNPs are 22.0 kb apart and in strong linkage disequilibrium (LD) with each other (r2 = 0.93), therefore probably representing a causal effect from the same source. The association between rs6567160 and FBM(adj) (P = 0.02) and percentage of fat mass (PFM, P = 1.59 × 10⁻⁴) was weak. In 16q12, the GWS signal was found only for BMI, with the lead SNP being rs62033400 (P = 7.50 × 10⁻¹², Table 2). The association of rs62033400 with FBM (P = 8.49 × 10⁻⁵), FBM(adj) (P = 0.03) and PFM (P = 0.04) was weak. Besides these two loci, three additional loci were identified at the level of suggestive significance (5 × 10⁻⁶): 2p25, 1q41 and 1q21. The lead SNPs were rs7569210 for BMI (P = 4.07 × 10⁻⁷) in 2p25, rs320466 for FBM (P = 3.50 × 10⁻⁷) in 1q41 and rs6693120 for FBM(adj) (P = 1.26 × 10⁻⁶) in 1q21. In summary, two genomic loci were identified at the GWS level and three additional loci were identified at the suggestive level, for multiple phenotypes.
Table 2.
Association results of the five de novo genotyped SNPs
| Trait | SNP | Gene | Alleles | Discovery |
Replication |
Combined |
|||||||||
|---|---|---|---|---|---|---|---|---|---|---|---|---|---|---|---|
| Effect (se) | P-value | I2 | Log10 (BF) | Effect (SE) | P-value | I2 | Log10 (BF) | Effect (SE) | P-value | I2 | Log10 (BF) | ||||
| BMI | rs6567160 | MC4R | T/C | 0.09 (0.01) | 7.23 × 10⁻¹⁴ | 0 | 12.11 | 0.10 (0.02) | 4.42 × 10⁻⁶ | 0 | 24.30 | 0.09 (0.01) | 8.09 × 10⁻¹⁹ | 0 | 34.69 |
| BMI | rs62033400 | FTO | A/G | 0.08 (0.01) | 7.50 × 10⁻¹² | 0 | 9.71 | 0.07 (0.02) | 6.00 × 10⁻⁴ | 0 | 1.98 | 0.08 (0.01) | 1.97 × 10⁻¹⁴ | 0 | 12.08 |
| BMI | rs939583 | TMEM18 | T/C | −0.07 (0.01) | 1.03 × 10⁻⁶ | 21 | 4.77 | −0.06 (0.03) | 0.03 | 0 | – | −0.07 (0.01) | 1.07 × 10⁻⁷ | 8 | 5.64 |
| FBM | rs6567160 | MC4R | T/C | 0.09 (0.02) | 1.91 × 10⁻⁷ | 11 | 5.56 | 0.09 (0.02) | 3.88 × 10⁻⁵ | 0 | 3.13 | 0.09 (0.01) | 3.24 × 10⁻¹¹ | 0 | 8.80 |
| FBM | rs320466 | RPS6KC1 | T/C | 0.11 (0.02) | 3.50 × 10⁻⁷ | 0 | 5.02 | 0.01 (0.02) | 0.78 | 72 | 0.18 | 0.05 (0.01) | 4.92 × 10⁻⁴ | 66 | 2.76 |
| FBM(adj) | rs2230061 | CTSS | G/A | −0.07 (0.02) | 2.98 × 10⁻⁶ | 0 | 4.34 | −0.06 (0.02) | 2.82 × 10⁻³ | 0 | 1.51 | −0.06 (0.01) | 3.57 × 10⁻⁸ | 0 | 6.29 |
Notes: FBM(adj) represents FBM adjusted for LBM. I2is the measure of heterogeneity (%).
P-values reached GWS level or log10(BF) > 6 are in bold italics.
The second allele is the effect allele.
Results from MANTRA were in concordance with the above findings. Specifically, MANTRA identified the same two loci 18q22 and 16q12 at the GWS level (log10(BF) > 6), with the same two lead SNPs (rs6567160 log10(BF) = 12.1 and rs62033400 log10(BF) = 9.7) for BMI. In 18q22, rs17782313 was again the lead SNP (log10(BF) = 6.7) for FBM. No association was found for the other phenotypes. For the three suggestively associated loci, the MANTRA signals ranged from 4.34 to 5.56 (Table 2).
One SNP from each of these five loci was selected for de novo genotyping in two replication samples. SNPs were selected based on the strongest association signals, with two exceptions in 2p25 and 1q21. rs7569210 (P = 4.07 × 10⁻⁷) and rs6693120 (P = 1.26 × 10⁻⁶) were the most significant SNPs in these two regions. However, the genotyping probes for these two SNPs failed to be amplified in one of our two replication samples with de novo genotyping. They were replaced by rs939583 (P = 1.03 × 10⁻⁶) and rs2230061 (P = 2.98 × 10⁻⁶), which were successfully genotyped. In the joint analysis of the two replication samples, four SNPs were successfully replicated at the nominal level 0.05, while the last one rs320466 was not significant (P = 0.78) (Table 2). Joint analyses of both discovery and replication samples retained rs6567160 and rs62033400 at the GWS level. In addition, the signal of rs2230061 (P = 3.57 × 10⁻⁸) reached the GWS level. Association of rs939583 got stronger as well (P = 1.07 × 10⁻⁷), although it did not reach the GWS level. At last, rs320466 was filtered out because of a much weaker association signal (P = 4.92 × 10⁻⁴). Analyses of the replication samples with MANTRA gave similar results (Table 2). For all four SNPs that were successfully replicated, the results from the random-effects model were the same as those from the fixed-effects model (data not shown), and their MANTRA log10(BF) values were larger than one. At rs320466, the MANTRA log10(BF) was only 0.18.
Of the four loci described here, three (18q22, 16q12 and 2p25) had been previously reported to be associated with BMI-related phenotypes at the GWS level, while the last one (1q21) was novel. rs6567160 in 18q22 was significant at the GWS level for both BMI (P = 8.09 × 10⁻¹⁹) and FBM (P = 3.24 × 10⁻¹¹) in the combined analyses. Allele C at this imputed SNP increased both BMI and FBM (Fig. 1). It is located in an intergenic region between MC4R (209.4 kb) and PMAIP1 (257.6 kb), of which MC4R was of primary interest. Genetic variation within MC4R was previously reported to be associated with both obesity and height (25,34,35). The association of rs6567160 with FBM in the present study was likely to be a direct one rather than induced by height, because FBM was already adjusted by both height and height2 in association analyses. rs62033400 in 16q12 was strongly associated with BMI (P = 1.97 × 10⁻¹⁴). Allele G at this imputed SNP increased BMI (Fig. 1). It is located in an intron region of the FTO gene, which is a well-known gene associated with fat mass and obesity (36). Although the combined P-value 1.07 × 10⁻⁷ for the third SNP rs939583 in 2p25 did not reach the GWS level, the successful replication (P = 0.03) indicated that this locus might be associated with obesity. Allele C at this imputed SNP decreased BMI. It is located in an intergenic region between FAM150B (334.2 kb) and TMEM18 (45.4 kb). TMEM18 was previously reported to be associated with BMI (26), thus strengthening the confidence on the association identified here. Finally, rs2230061 in the only novel locus 1q21 was associated with FBM after the adjustment by LBM (P = 3.57 × 10⁻⁸). Allele A of this imputed SNP decreased residue of FBM (Fig. 1). rs2230061 is located in an intron region of the gene CTSS (Cathepsin S), which was not reported previously. Associations between the four identified SNPs and all the studied phenotypes are listed in Supplementary Material, Table S2.
Despite being strongly associated with FBM (P = 3.24 × 10⁻¹¹), rs6567160 was weakly associated with FBM(adj) (P = 2.32 × 10⁻³). To explore possible explanation, we tested its association with LBM and with LBM after the adjustment of FBM, namely LBM(adj). The association with LBM was significant at the GWS level (P = 9.35 × 10⁻¹³). Interestingly, the association with LBM(adj) still existed, although the signal was weak (P = 1.43 × 10⁻⁴), implying that rs6567160 may exert pleiotropic effects to both FBM and LBM (Table 3). Allele C at rs6567160 increased both FBM and LBM (Fig. 2).
Table 3.
Pleiotropic effects of rs6567160 on FBM and LBM
| Trait | Discovery |
Replication |
Combined |
|||
|---|---|---|---|---|---|---|
| Beta (SE) | P-values | Beta (SE) | P-values | Beta (SE) | P-values | |
| BMI | 0.09 (0.01) | 7.23 × 10⁻¹⁴ | 0.10 (0.02) | 4.42 × 10⁻⁶ | 0.09 (0.01) | 8.09 × 10⁻¹⁹ |
| FBM | 0.09 (0.02) | 1.91 × 10⁻⁷ | 0.09 (0.02) | 3.88 × 10⁻⁵ | 0.09 (0.01) | 3.24 × 10⁻¹¹ |
| LBM | 0.10 (0.02) | 5.42 × 10⁻⁸ | 0.10 (0.02) | 3.67 × 10⁻⁶ | 0.10 (0.01) | 9.35 × 10⁻¹³ |
| FBM(adj) | 0.04 (0.02) | 0.02 | 0.04 (0.02) | 0.06 | 0.04 (0.01) | 2.32 × 10⁻³ |
| LBM(adj) | 0.05 (0.02) | 4.31 × 10⁻³ | 0.05 (0.02) | 0.01 | 0.05 (0.01) | 1.43 × 10⁻⁴ |
Notes: FBM(adj) represents FBM adjusted for LBM and LBM(adj) represents LBM adjusted for FBM.
P-values reached GWS level are in bold italics.
Figure 2.

Forest plot for the identified SNPs associated with obesity-related traits. X-axis represents the effect size. The title of each sub-figure represents a specific combination of SNP and trait. BMI(F) refers to results for BMI in females and FBM(adj) refers to results for FBM adjusted for LBM.
Gender-stratified P-values at the identified SNPs seemed to be different between the two gender groups. Specifically, P-values were always smaller in females than in males, especially for rs939583 (Table 4). However, gender-specific effects were not significant with the SNP-by-sex interaction analyses. One potential reason for the smaller P-values in the females was the larger number of female subjects.
Table 4.
Sex-stratified results for the four identified SNPs
| Trait | SNP | Gene | Alleles | Females |
Males |
P-value of SNP-by-sex interaction test | ||
|---|---|---|---|---|---|---|---|---|
| Beta (SE) | P-value | Beta (SE) | P-value | |||||
| BMI | rs6567160 | MC4R | T/C | 0.09 (0.01) | 2.22 × 10⁻¹² | 0.11 (0.02) | 7.23 × 10⁻⁸ | 0.42 |
| BMI | rs62033400 | FTO | A/G | 0.07 (0.01) | 9.62 × 10⁻¹⁰ | 0.09 (0.02) | 2.17 × 10⁻⁶ | 0.87 |
| BMI | rs939583 | TMEM18 | T/C | −0.08 (0.01) | 4.83 × 10⁻⁸ | −0.03 (0.03) | 0.26 | 0.51 |
| FBM | rs6567160 | MC4R | T/C | 0.09 (0.02) | 6.28 × 10⁻⁸ | 0.09 (0.02) | 7.79 × 10⁻⁵ | 0.70 |
| FBM(adj) | rs2230061 | CTSS | G/A | −0.07 (0.01) | 6.06 × 10⁻⁷ | −0.05 (0.02) | 0.01 | 0.31 |
Notes: FBM(adj) represents FBM adjusted for LBM.
The second allele is the effect allele.
P-values reached GWS level are in bold italics.
We estimated the cumulative effects of the identified SNPs on variation of the studied phenotypes in KCOS and COS samples. Individual SNPs explained 0.05–0.64% of phenotypic variations, and the variation explained by all four SNPs ranged between 0.46 and 1.61%, depending on samples and phenotypes (Table 5).
Table 5.
Phenotypic variation explained by the identified SNPs
| Trait | SNP | Variance explained (%) |
|
|---|---|---|---|
| COS | KCOS | ||
| BMI | rs6567160 | 0.64 | 0.43 |
| BMI | rs62033400 | 0.21 | 0.45 |
| BMI(F) | rs939583 | 0.52 | 0.05 |
| FBM | rs6567160 | 0.54 | 0.26 |
| FBM(adj) | rs2230061 | 0.22 | 0.15 |
| PFM | rs6567160 | 0.33 | 0.13 |
| BMI | Total | 1.11 | 0.90 |
| BMI(F) | Total | 1.61 | 0.73 |
| FBM | Total | 1.34 | 0.68 |
| FBM(adj) | Total | 1.10 | 0.49 |
| PFM | Total | 0.97 | 0.46 |
Notes: FBM(adj) represents FBM adjusted for LBM and BMI(F) refers to results for BMI in females.
Replication with previously reported results
We first checked the replicability of our findings in the GIANT summary results of BMI (24). Of the four identified SNPs, rs6567160 and rs939583 existed in the GIANT data sets, and both were extremely significant (P = 1.82 × 10⁻²² and 5.34 × 10⁻²²). The other two SNPs rs62033400 and rs2230061 did not exist in the GIANT data set. Scrutiny of their nearby SNPs implied that they were well replicated. For example, the SNP rs3751812 near rs62033400 (LD, r2 = 0.99) was extremely significant (P = 1.14 × 10−59) in the GIANT results. Another SNP rs4509581 near rs2230061 (r2 = 0.87) was significant as well at the nominal level 0.05 (P = 0.03).
We then checked the replicability of previously reported loci in our summary results. By searching in the GWAS catalog (37), we identified 32 distinct genomic regions and 39 SNPs that were reported previously at the GWS level. The signals of these SNPs in our results are listed in Supplementary Material, Table S3. Of the 39 SNPs, 3 were not available in our results, and 22 were significant at the nominal level 0.05.
Gene-based meta-analysis
A total of 17 483 genes were included in the gene-based association test. The Bonferroni correction was used to declare the significance level (0.05/17 483 = 2.86 × 10⁻⁶). In this analysis, we identified one gene NLK (nemo-like kinase; 17q11) that was significant for FBM(adj) (P = 8.77 × 10⁻⁷, Table 6). This gene had not been reported previously. Exploration of allelic structures showed that common variants (MAF > 5%) accounted for the majority of genetic variation in NLK. Variants were common in all but the WHI-AA samples. In the WHI-AA sample, 25 of the total 77 SNPs were less common with MAF between 1 and 5%, but no rare variants (MAF < 1%) were involved. All of the 77 SNPs were well imputed (r2 > 0.3) and the average r2 was as high as 0.78. The gene remained significant (P = 6.82 × 10⁻⁵) after excluding these less common variants from the combined analyses, although the P-value was higher than the significance level. No gene was identified at the GWS level for the other phenotypes. Although the four candidate genes (CTSS, MC4R, FTO and TMEM18) identified in the single variants analyses did not reach the significance level in the gene-based analyses, their signals were all nominally significant (P < 0.05, Supplementary Material, Table S4).
Table 6.
Genes identified by gene-based association test (P < 1 × 10⁻⁵)
| Gene information |
P-values in different samples | |||||||
|---|---|---|---|---|---|---|---|---|
| Name | Chr | Start | Stop | Caucasian | COS | WHI-AA | WHI-HIS | Combined |
| NLK | 17 | 23 393 814 | 23 547 531 | 0.04 | 9.92 × 10⁻³ | 1.70 × 10⁻⁵ | 0.07 | 8.77 × 10⁻⁷ |
| RNF213 | 17 | 75 928 320 | 75 984 673 | 0.09 | 0.06 | 2.01 × 10⁻⁴ | 2.43 × 10⁻³ | 3.75 × 10⁻⁶ |
| DHX40 | 17 | 54 997 667 | 55 040 484 | 0.12 | 0.65 | 3.60 × 10⁻⁵ | 9.55 × 10⁻⁴ | 3.87 × 10⁻⁶ |
| TBX4 | 17 | 56 888 588 | 56 916 446 | 0.18 | 0.77 | 6.10 × 10⁻⁵ | 4.66 × 10⁻⁴ | 5.55 × 10⁻⁶ |
| PMP22 | 17 | 15 073 820 | 15 109 369 | 0.92 | 0.05 | 7.10 × 10⁻⁵ | 2.08 × 10⁻³ | 9.50 × 10⁻⁶ |
| C7orf57 | 7 | 48 041 641 | 48 067 419 | 0.45 | 2.46 × 10⁻³ | 8.33 × 10⁻⁴ | 8.28 × 10⁻³ | 9.87 × 10⁻⁶ |
Notes: The results for Caucasian were calculated based on P-values from GWA studies of individuals with European ancestry (fixed-effect meta-analysis of OOS, KCOS, FHS and IFS GWA studies). P-values that reached genome-wide gene-based significance levels are in bold italics. All these genes are identified for FBM(adj).
DISCUSSION
In the present study, we carried out a GWA meta-analysis of seven GWA studies of diverse populations for obesity, followed by de novo replication. Using both individual SNP- and gene-based analyses, we identified two novel loci 1q21 and 17q11 associated with FBM after the adjustment of LBM. We also confirmed three previously reported loci (16q12, 18q22 and 2p25) at the GWS level.
The two candidate genes implied by the two identified loci were CTSS and NLK. The CTSS gene belongs to a family of cystein protease that includes other proteases (e.g. CTSK and CTSL) involved in the development of obesity (38). It plays a central role in extracellular matrix remodeling by stimulating adipocyte differentiation through degrading fibronectin, one of the main components of the extra cellular matrix (39). In vitro studies showed that CTSS expression and Cathepsin S secretion in adipose tissue were induced by LPS, TNF-α and IL-1β, proinflammatory factors that are secreted by cells such as macrophages or smooth muscle cells (40). The involvement of CTSS in the development of obesity was also supported by extensive gene expression studies and clinical studies (40–42). The NLK gene is a negative regulator of the canonical Wnt/beta-catenin signaling pathway (43), which was demonstrated to play an important role in maintaining pre-adipocytes in an undifferentiated state by inhibiting adipogenic gene expression (44). Our finding, therefore, provides additional evidence on the novel hypothetical mechanism by which NLK contributes to the development of obesity.
The three candidate genes that we confirmed in the present study were FTO, TMEM18 and MC4R. They were all well established to be associated with BMI by previous studies (25,34). We found that rs6567160, near MC4R, had a pleiotropic effect to both FBM and LBM, implying that MC4R may regulate the development of both fat and lean masses. This gene plays an important role in the regulation of food intake, energy expenditure and catabolism (45,46). Humans with rare functional mutations in their MC4R sequence are known to develop severe early-onset obesity (47) and analogous phenotypes are seen in murine models of MC4R disruption (34). In mice, stimulation of MC4R has been demonstrated to decrease food-seeking behavior, to increase basal metabolic rate and to decrease LBM (45). Blockade of central melanocortin signaling increased both LBM and FBM in a rat model (48), supporting the bidirectional role played by the MC4R in obesity development.
PFM is one of the commonly used traits for body fat mass (31). However, no significant findings were obtained with PFM in the present study at either the GWS or suggestive significance level. Instead, both novel findings were identified with original fat/lean mass measurements. This result implies that modeling on original measured parameters may be advantageous compared with modeling on a synthesized trait (e.g. PFM). Although PFM is the surrogate of fat mass, it has a linear relationship with percentage of lean mass (PLM, PFM+PLM = 1) so that PFM and PLM are equivalent from an analytical point of view. In other words, results of PFM have the same interpretations to both fat and lean mass. Because fat and lean have different biological and developmental mechanisms and also because PLM and PFM have a linear relationship, interpretation of the results on PFM may be somehow difficult.
The only SNP that was not significant in the de novo replication results was rs320466 for FBM. In addition to a false-positive signal, the reasons for the failure of replication may be the following: first, genetic heterogeneity caused by different evolution histories may result in differential genotype–phenotype associations (49). Second, interacting variants in the background may modulate individual marker effects, diminishing or increasing marginal associations of the studied polymorphisms (50). Third, significant associations are usually declared at genetic markers that are in LD with the causal site, rather than the causal site itself. Therefore, the failure to replicate could be a result of different patterns of LD between populations.
Gene-based analysis has the capacity to identify genes that are missed by SNP-based analyses. This is because gene-based analysis is more powerful in certain conditions by jointly modeling onto multiple SNPs within a gene. In our study, none of the SNPs located within NLK was significant. However, when modeling all SNPs together, the gene was significant. One of the advantages of the gene-based analysis is the ability to take into account allelic heterogeneity (i.e. presence of more than one susceptibility allele in a gene), which is low-powered by individual SNP-based analysis. We did not validate the multiple imputed SNPs within the NLK through experiments; however, we believe our results were reliable because of the following two reasons: (i) all included variants were common (MAF > 5%) or less common (MAF > 1%); and (ii) all SNPs were well imputed (r2 > 0.3), in practice the average r2 was 0.78.
The samples that we analyzed were from populations of diverse ethnicities. Although using different samples in one study might increase the false-negative rates due to sample heterogeneity, the loci identified here are not likely to be due solely to heterogeneity. First, neither Cochran's Q statistic nor I2 measures demonstrated evidence of heterogeneity at any of the identified SNPs. Second, replication in distinct samples makes the false-positive findings less likely. Third, the random-effects model, which is more robust against heterogeneity, generated similar results to the fixed-effects model. Fourth, the results from MANTRA, which combines GWAS from different ethnic groups by taking advantage of the expected similarity in allelic effects between the most closely related populations, gave highly concordant results. Finally, multiple previously reported loci (e.g. FTO, TMEM18 and MC4R) were replicated using the same analytical approach. Therefore, the identified loci may represent true genetic susceptible loci for obesity that are shared across populations.
In summary, by meta-analyzing multiple GWA studies and following by de novo replication, we have identified two novel loci for obesity, as well as confirmed three previously reported loci. Further studies are warranted to explore the biological functions of the genetic variants identified in the present study.
MATERIALS AND METHODS
Study populations
This study included multiple samples from different research and/or clinical centers. All samples were approved for use by respective institutional ethics review boards, and all participants provided written informed consent.
In the discovery stage, seven GWA samples were included, of which three were from in-house studies and four were from the public database of genotype and phenotype (dbGAP) (51). The three in-house samples included those from the Omaha Osteoporosis Study (OOS, with 998 unrelated Caucasian subjects), Kansas-City Osteoporosis Study (KCOS, with 2283 unrelated Caucasian subjects) and China Osteoporosis Study (COS, with 1624 unrelated Chinese Han subjects). The fourth sample was selected from the Framingham Heart Study (FHS), a longitudinal and prospective cohort comprising over 16 000 Caucasian subjects spanning three generations (52,53). Based on the first two generations of the FHS families, we identified 4760 subjects with BMI information and 2786 subjects with FBM information for use in this study. The fifth sample was selected from the Indiana Fragility Study (IFS), a quantitative and cross-sectional cohort comprising 1493 premenopausal Caucasian sister pairs (54). Among them, 1478 subjects with BMI information and 1433 subjects with FBM information were included in the analyses. The sixth and seventh samples were selected from the Women's Health Initiative (WHI) observational study, a partial factorial randomized and longitudinal cohort with over 12 000 genotyped women of African-American or Hispanic ancestry (55). The sixth sample included 7478 individuals of African-American ancestry (WHI-AA) with BMI information and 709 individuals with FBM information. The seventh sample included 3348 individuals of Hispanic ancestry (WHI-HIS) with BMI information and 408 individuals with FBM information.
For replication, the selected SNPs were de novo genotyped in two independent samples, one with 3923 unrelated Caucasian individuals selected from OOS and KCOS (OOSR), and the other with 2740 unrelated Chinese Han individuals selected from COS (COSR).
Phenotype measurements and modeling
BMI was calculated as body mass (in kilograms) divided by the square of height (in meters). FBM and LBM were measured/calculated with dual-energy X-ray absorptiometry scanners (Lunar Corp., Madison, WI, USA; or Hologic Inc., Bedford, MA, USA) following the manufacturer protocols. PFM was calculated as FBM divided by the sum of FBM and LBM. In addition to BMI, FBM and PFM, we analyzed FBM after the adjustment of LBM, denoted by FBM(adj). The focus of this latter phenotype was on the fat part of body weight only. For all phenotypes, covariates were screened among gender, age, age2, height (except for BMI), height2 (except for BMI) and scanner ID (in WHI, except for BMI) with the step-wise linear regression model. In the admixed WHI-AA and WHI-HIS samples, the first five principle components derived from genome-wide genotype data were included as covariates to correct for potential population stratification/admixture (33). Phenotypes were adjusted by significant covariates. Adjusted phenotypes were then normalized by inverse quantile of the standard normal distribution and the normalized phenotypes were used in subsequent association analyses.
Genotyping and quality control
Individual GWA samples were genotyped by high-throughput SNP genotyping arrays (Affymetrix Inc., Santa Clara, CA, USA; or Illumina Inc., San Diego, CA, USA) following the manufacturer protocols. Quality controls of genotype data were implemented using PLINK (56) with the following criteria applied: individual missingness 5%, SNP call rate 95% and Hardy–Weinberg equilibrium (HWE) P-value 1.0 × 10⁻⁵. For familial samples (FHS and IFS), all genotypes with the Mendel error were set to missing. Population outliers were monitored by principal components derived from genome-wide genotypes (33).
Genotype imputation
In the discovery stage, imputation was performed for each GWA study using 1000G sequence variants as a reference panel (as of August 2010). Reference samples included 283 individuals of European ancestry, 193 individuals of Asian ancestry and 174 individuals of African ancestry. Imputation was performed by comparing the respective panel with the closest ancestry.
Prior to imputation, a consistency test of allele frequency between GWA samples and reference samples was examined with the Chi-square test. To correct for potential mis-strandedness, SNPs that failed consistency test (P < 1.0 × 10⁻⁶) were transformed into reverse strand. SNPs that failed consistency again were removed from the GWA studies.
To distribute imputation computation to multiple parallel CPUs, chromosomes were split into non-overlapping fragments each of 10 Mega base-pair length. In each fragment, haplotypes of the individual GWA study were phased by a MArkov Chain Haplotyping algorithm (MACH) (57,58). For familiar samples (FHS and IFS), 200 unrelated founder individuals were randomly selected to estimate model parameters, which were then used to impute all family members. Based on phased haplotypes, untyped genotypes were then imputed by a computationally efficient imputing algorithm Minimac (59). SNPs with r2 score less than 0.3 as estimated by Minimac were considered of low imputation accuracy. SNPs of low accuracy or of MAF < 0.01 in any one of the samples were excluded from subsequent SNP-based association analyses.
Association testing
Associations between phenotypes and SNPs (both genotyped and imputed) were tested under an additive mode of inheritance. For samples of unrelated subjects, association was examined by the linear regression model with MACH2QTL (57,58), in which allele dosage was taken as the predictor for the phenotype. Empirical assessments show that MACH2QTL provides an effective means of evaluating evidence for association at untyped markers (60). For familial samples (FHS and IFS), a mixed linear model was used in which the effect of genetic relatedness within each pedigree was also taken into account (61,62). To correct for potential population stratification, GC inflation factor (63) was estimated for each GWA study and study-specific summary statistics were corrected prior to the meta-analysis.
Meta-analysis
Summary association statistics from each GWA study were combined to perform weighted fixed-effects meta-analyses with METAL (64), in which weights were proportional to standard error of regression coefficient. Cochran's Q statistic and I2 were estimated with METAL to quantify between-study heterogeneity effect. Significant heterogeneity effect was defined as I2 > 50% or Q-statistic P-value < 0.1. We only focused on SNPs with the association directions consistent in all the seven GWA studies. The random-effects model of meta-analysis was applied to validate significant SNPs, with the R package ‘rmeta’ (65).
During the preparation of the present study, Morris developed a new meta-analysis method MANTRA that is specific to samples of diverse ethnicities (66). One advantage of this method is the ability to model the expected similarity in allelic effects between closely related ethnic groups. As an important complement and validation, we also analyzed data with MANTRA. Genome-wide significance level for MANTRA was set at the base 10 logarithm of Bayes factor log10(BF) > 6.
De novo replication analysis
SNPs with P-values < 5.0 × 10⁻⁶ in the discovery samples were considered as significant. One SNP from each distinct genomic region was subjected to de novo replication in two independent samples, namely OOSR and COSR. The OOSR sample was genotyped using a fluorescent resonance energy transfer-based KASP genotyping platform with technical support from Kbiosciences UK Company. The COSR sample was genotyped using the ligation detection reaction method with technical support from the Shanghai Biowing Applied Biotechnology Company. Quality control included individual missingness 5%, SNP call rate 90% and HWE P-value 1.0 × 10⁻⁵. Association testes in the de novo samples were performed with PLINK (56). Joint analyses of both discovery and replication samples were performed with METAL (64) and MANTRA (66).
SNP-by-sex interaction analysis
To examine gender-specific effects, we performed gene-by-sex interaction analyses for the identified SNPs. In each individual study, interaction was tested by a linear regression model with PLINK (56), in which gender was encoded into a binary variable. P-values from individual studies were then meta-analyzed for a combined signal with Fisher's method (67).
Replication analysis with previously reported results
We checked the replicability of our findings in another larger publicly available meta-analysis of BMI conducted by the GIANT consortium (24), in which 249 796 subjects were involved. We also checked the replicability of previously reported loci in our discovery samples.
Gene-based meta-analysis
Gene-based association meta-analyses were performed to identify genes associated with BMI-related phenotypes. As gene-based analyses require information of LD structure, which may diverge between different ethnic groups, we tested gene-based association within each ethnic group, and then combined signals from all groups into a summary statistic. Quality control of SNPs for inclusion was the same as that for SNP-based analyses: imputation accuracy r2 > 0.3 and MAF > 0.01. For ethnic groups containing only one individual GWA study (COS, WHI-AA, WHI-HIS), P-values from that study were analyzed individually with VEGAS (29). For the Caucasian group containing multiple GWA studies (OOS, KCOS, FHS and IFS), those multiple studies were meta-analyzed first, and then the combined P-values were analyzed with VEGAS (29). In using VEGAS, we adopted the following steps: (i) SNPs were assigned to genes according to their physical positions at the UCSC Genome Browser hg18 assembly. Gene boundaries were defined as 50 kb from the 5′ and 3′ UTRs; (ii) for a gene containing n SNPs, individual SNP P-values were converted to upper tail Chi-squared statistics with 1 degree of freedom. Then the gene-based statistic was defined as the sum of these Chi-squared statistics; (iii) using the Monte Carlo approach, a large number of multivariate normal vectors z with mean 0 and variance matrix of pairwise LD r values were simulated. The r values were estimated from the respective HapMap phase 2 samples (30) with the closest ancestry. The simulated gene-based test statistics was the sum of squares of the elements of z; and (iv) the empirical gene-based P-value was calculated as the proportion of simulated test statistics that exceeded the observed gene-based statistic. Gene-based P-values from different ethnic populations were combined by the Fisher's method (67).
SUPPLEMENTARY MATERIAL
FUNDING
This work was supported by grants from the National Institutes of Health (P50AR055081, R01AG026564, R01AR050496, RC2DE020756, R01AR057049 and R03TW008221); grant from the National Natural Science Foundation of China (31100902); Shanghai Leading Academic Discipline Project (S30501); and young teacher startup funds from Shanghai University of Science and Technology (slg11018 and slg11019). The Framingham Heart Study is conducted and supported by the National Heart, Lung, and Blood Institute (NHLBI) in collaboration with Boston University (Contract No. N01-HC-25195). This manuscript was not prepared in collaboration with investigators of the Framingham Heart Study and does not necessarily reflect the opinions or views of the Framingham Heart Study, Boston University or NHLBI. Funding for SHARe genotyping was provided by NHLBI Contract N02-HL-64278. Funding support for the Framingham Whole Body DXA dataset was provided by NIH grants R01 AR/AG 41398. The datasets used for the analyses described in this manuscript were obtained from dbGaP at http://www.ncbi.nlm.nih.gov/sites/entrez?db=gap through dbGaP accession phs000007.v14.p6. Funding support for the Genetic Determinants of Bone Fragility was provided through the NIA Division of Geriatrics and Clinical Gerontology. Genetic Determinants of Bone Fragility is a genome-wide association study funded as part of the NIA Division of Geriatrics and Clinical Gerontology. Assistance with phenotype harmonization and genotype cleaning, as well as with general study coordination, was provided by the NIA Division of Geriatrics and Clinical Gerontology and the NIA Division of Aging Biology. Support for the collection of data sets and samples was provided by the parent grant, Genetic Determinants of Bone Fragility (P01-AG018397). Funding support for the genotyping which was performed at the Johns Hopkins University Center for Inherited Diseases Research was provided by the NIH NIA. The datasets used for the analyses described in this manuscript were obtained from dbGaP at http://www.ncbi.nlm.nih.gov/sites/entrez?db=gap through dbGaP accession phs000138.v2.p1. The WHI program is funded by the National Heart, Lung, and Blood Institute, National Institutes of Health, U.S. Department of Health and Human Services through contracts N01WH22110, 24152, 32100-2, 32105-6, 32108-9, 32111-13, 32115, 32118-32119, 32122, 42107-26, 42129-32 and 44221. This manuscript was not prepared in collaboration with investigators of the WHI, has not been reviewed and/or approved by the Women's Health Initiative (WHI) and does not necessarily reflect the opinions of the WHI investigators or the NHLBI.WHI PAGE is funded through the NHGRI Population Architecture Using Genomics and Epidemiology (PAGE) network (Grant Number U01 HG004790). Assistance with phenotype harmonization, SNP selection, data cleaning, meta-analyses, data management and dissemination, and general study coordination, was provided by the PAGE Coordinating Center (U01HG004801-01). The data sets used for the analyses described in this manuscript were obtained from dbGaP at http://www.ncbi.nlm.nih.gov/sites/entrez?db=gap through dbGaP accession phs000200.v6.p2.
Supplementary Material
ACKNOWLEDGEMENTS
We thank Dr Andrew P. Morris (Wellcome Trust Centre for Human Genetics) for providing us with the MANTRA software. Thanks also to the reviewer and editor for their constructive comments and suggestions.
Conflict of Interest statement. None declared.
REFERENCES
- 1.Kopelman P.G. Obesity as a medical problem. Nature. 2000;404:635–643. doi: 10.1038/35007508. [DOI] [PubMed] [Google Scholar]
- 2.Ogden C.L., Carroll M.D., Curtin L.R., McDowell M.A., Tabak C.J., Flegal K.M. Prevalence of overweight and obesity in the United States, 1999–2004. JAMA. 2006;295:1549–1555. doi: 10.1001/jama.295.13.1549. doi:10.1001/jama.295.13.1549. [DOI] [PubMed] [Google Scholar]
- 3.Wolf A.M., Colditz G.A. Current estimates of the economic cost of obesity in the United States. Obes. Res. 1998;6:97–106. doi: 10.1002/j.1550-8528.1998.tb00322.x. doi:10.1002/j.1550-8528.1998.tb00322.x. [DOI] [PubMed] [Google Scholar]
- 4.Albanese C.V., Diessel E., Genant H.K. Clinical applications of body composition measurements using DXA. J. Clin. Densitom. 2003;6:75–85. doi: 10.1385/jcd:6:2:75. doi:10.1385/JCD:6:2:75. [DOI] [PubMed] [Google Scholar]
- 5.Bell C.G., Walley A.J., Froguel P. The genetics of human obesity. Nat. Rev. Genet. 2005;6:221–234. doi: 10.1038/nrg1556. doi:10.1038/nrg1556. [DOI] [PubMed] [Google Scholar]
- 6.Deng H.W., Lai D.B., Conway T., Li J., Xu F.H., Davies K.M., Recker R.R. Characterization of genetic and lifestyle factors for determining variation in body mass index, fat mass, percentage of fat mass, and lean mass. J. Clin. Densitom. 2001;4:353–361. doi: 10.1385/jcd:4:4:353. doi:10.1385/JCD:4:4:353. [DOI] [PubMed] [Google Scholar]
- 7.Maes H.H., Neale M.C., Eaves L.J. Genetic and environmental factors in relative body weight and human adiposity. Behav. Genet. 1997;27:325–351. doi: 10.1023/a:1025635913927. doi:10.1023/A:1025635913927. [DOI] [PubMed] [Google Scholar]
- 8.Stunkard A.J., Foch T.T., Hrubec Z. A twin study of human obesity. JAMA. 1986;256:51–54. doi:10.1001/jama.1986.03380010055024. [PubMed] [Google Scholar]
- 9.Saunders C.L., Chiodini B.D., Sham P., Lewis C.M., Abkevich V., Adeyemo A.A., de Andrade M., Arya R., Berenson G.S., Blangero J., et al. Meta-analysis of genome-wide linkage studies in BMI and obesity. Obesity (Silver Spring) 2007;15:2263–2275. doi: 10.1038/oby.2007.269. doi:10.1038/oby.2007.269. [DOI] [PubMed] [Google Scholar]
- 10.Melka M.G., Bernard M., Mahboubi A., Abrahamowicz M., Paterson A.D., Syme C., Lourdusamy A., Schumann G., Leonard G.T., Perron M., et al. Genome-wide scan for loci of adolescent obesity and their relationship with blood pressure. J. Clin. Endocrinol. Metab. 2012;97:E145–E150. doi: 10.1210/jc.2011-1801. doi:10.1210/jc.2011-1801. [DOI] [PubMed] [Google Scholar]
- 11.Jiao H., Arner P., Hoffstedt J., Brodin D., Dubern B., Czernichow S., van't Hooft F., Axelsson T., Pedersen O., Hansen T., et al. Genome wide association study identifies KCNMA1 contributing to human obesity. BMC Med. Genomics. 2011;4:51. doi: 10.1186/1755-8794-4-51. doi:10.1186/1755-8794-4-51. [DOI] [PMC free article] [PubMed] [Google Scholar]
- 12.Wang K., Li W.D., Zhang C.K., Wang Z., Glessner J.T., Grant S.F., Zhao H., Hakonarson H., Price R.A. A genome-wide association study on obesity and obesity-related traits. PLoS ONE. 2011;6:e18939. doi: 10.1371/journal.pone.0018939. doi:10.1371/journal.pone.0018939. [DOI] [PMC free article] [PubMed] [Google Scholar]
- 13.Cotsapas C., Speliotes E.K., Hatoum I.J., Greenawalt D.M., Dobrin R., Lum P.Y., Suver C., Chudin E., Kemp D., Reitman M., et al. Common body mass index-associated variants confer risk of extreme obesity. Hum. Mol. Genet. 2009;18:3502–3507. doi: 10.1093/hmg/ddp292. doi:10.1093/hmg/ddp292. [DOI] [PMC free article] [PubMed] [Google Scholar]
- 14.Norris J.M., Langefeld C.D., Talbert M.E., Wing M.R., Haritunians T., Fingerlin T.E., Hanley A.J., Ziegler J.T., Taylor K.D., Haffner S.M., et al. Genome-wide association study and follow-up analysis of adiposity traits in Hispanic Americans: the IRAS Family Study. Obesity (Silver Spring) 2009;17:1932–1941. doi: 10.1038/oby.2009.143. doi:10.1038/oby.2009.143. [DOI] [PMC free article] [PubMed] [Google Scholar]
- 15.Meyre D., Delplanque J., Chevre J.C., Lecoeur C., Lobbens S., Gallina S., Durand E., Vatin V., Degraeve F., Proenca C., et al. Genome-wide association study for early-onset and morbid adult obesity identifies three new risk loci in European populations. Nat. Genet. 2009;41:157–159. doi: 10.1038/ng.301. doi:10.1038/ng.301. [DOI] [PubMed] [Google Scholar]
- 16.Liu Y.J., Liu X.G., Wang L., Dina C., Yan H., Liu J.F., Levy S., Papasian C.J., Drees B.M., Hamilton J.J., et al. Genome-wide association scans identified CTNNBL1 as a novel gene for obesity. Hum. Mol. Genet. 2008;17:1803–1813. doi: 10.1093/hmg/ddn072. doi:10.1093/hmg/ddn072. [DOI] [PMC free article] [PubMed] [Google Scholar]
- 17.Scuteri A., Sanna S., Chen W.M., Uda M., Albai G., Strait J., Najjar S., Nagaraja R., Orru M., Usala G., et al. Genome-wide association scan shows genetic variants in the FTO gene are associated with obesity-related traits. PLoS Genet. 2007;3:e115. doi: 10.1371/journal.pgen.0030115. doi:10.1371/journal.pgen.0030115. [DOI] [PMC free article] [PubMed] [Google Scholar]
- 18.Hinney A., Nguyen T.T., Scherag A., Friedel S., Bronner G., Muller T.D., Grallert H., Illig T., Wichmann H.E., Rief W., et al. Genome wide association (GWA) study for early onset extreme obesity supports the role of fat mass and obesity associated gene (FTO) variants. PLoS ONE. 2007;2:e1361. doi: 10.1371/journal.pone.0001361. doi:10.1371/journal.pone.0001361. [DOI] [PMC free article] [PubMed] [Google Scholar]
- 19.Herbert A., Gerry N.P., McQueen M.B., Heid I.M., Pfeufer A., Illig T., Wichmann H.E., Meitinger T., Hunter D., Hu F.B., et al. A common genetic variant is associated with adult and childhood obesity. Science. 2006;312:279–283. doi: 10.1126/science.1124779. doi:10.1126/science.1124779. [DOI] [PubMed] [Google Scholar]
- 20.Paternoster L., Evans D.M., Nohr E.A., Holst C., Gaborieau V., Brennan P., Gjesing A.P., Grarup N., Witte D.R., Jorgensen T., et al. Genome-wide population-based association study of extremely overweight young adults—the GOYA study. PLoS ONE. 2011;6:e24303. doi: 10.1371/journal.pone.0024303. doi:10.1371/journal.pone.0024303. [DOI] [PMC free article] [PubMed] [Google Scholar]
- 21.Cho Y.S., Go M.J., Kim Y.J., Heo J.Y., Oh J.H., Ban H.J., Yoon D., Lee M.H., Kim D.J., Park M., et al. A large-scale genome-wide association study of Asian populations uncovers genetic factors influencing eight quantitative traits. Nat. Genet. 2009;41:527–534. doi: 10.1038/ng.357. doi:10.1038/ng.357. [DOI] [PubMed] [Google Scholar]
- 22.Bradfield J.P., Taal H.R., Timpson N.J., Scherag A., Lecoeur C., Warrington N.M., Hypponen E., Holst C., Valcarcel B., Thiering E., et al. A genome-wide association meta-analysis identifies new childhood obesity loci. Nat. Genet. 2012;44:526–531. doi: 10.1038/ng.2247. doi:10.1038/ng.2247. [DOI] [PMC free article] [PubMed] [Google Scholar]
- 23.Scherag A., Dina C., Hinney A., Vatin V., Scherag S., Vogel C.I., Muller T.D., Grallert H., Wichmann H.E., Balkau B., et al. Two new loci for body-weight regulation identified in a joint analysis of genome-wide association studies for early-onset extreme obesity in French and German study groups. PLoS Genet. 2010;6:e1000916. doi: 10.1371/journal.pgen.1000916. doi:10.1371/journal.pgen.1000916. [DOI] [PMC free article] [PubMed] [Google Scholar]
- 24.Speliotes E.K., Willer C.J., Berndt S.I., Monda K.L., Thorleifsson G., Jackson A.U., Lango Allen H., Lindgren C.M., Luan J., Magi R., et al. Association analyses of 249,796 individuals reveal 18 new loci associated with body mass index. Nat. Genet. 2010;42:937–948. doi: 10.1038/ng.686. doi:10.1038/ng.686. [DOI] [PMC free article] [PubMed] [Google Scholar]
- 25.Thorleifsson G., Walters G.B., Gudbjartsson D.F., Steinthorsdottir V., Sulem P., Helgadottir A., Styrkarsdottir U., Gretarsdottir S., Thorlacius S., Jonsdottir I., et al. Genome-wide association yields new sequence variants at seven loci that associate with measures of obesity. Nat. Genet. 2009;41:18–24. doi: 10.1038/ng.274. doi:10.1038/ng.274. [DOI] [PubMed] [Google Scholar]
- 26.Willer C.J., Speliotes E.K., Loos R.J., Li S., Lindgren C.M., Heid I.M., Berndt S.I., Elliott A.L., Jackson A.U., Lamina C., et al. Six new loci associated with body mass index highlight a neuronal influence on body weight regulation. Nat. Genet. 2009;41:25–34. doi: 10.1038/ng.287. doi:10.1038/ng.287. [DOI] [PMC free article] [PubMed] [Google Scholar]
- 27.Abecasis G.R., Altshuler D., Auton A., Brooks L.D., Durbin R.M., Gibbs R.A., Hurles M.E., McVean G.A. 1000 Genomes Project Consortium. A map of human genome variation from population-scale sequencing. Nature. 2010;467:1061–1073. doi: 10.1038/nature09534. doi:10.1038/nature09534. [DOI] [PMC free article] [PubMed] [Google Scholar]
- 28.Neale B.M., Sham P.C. The future of association studies: gene-based analysis and replication. Am. J. Hum. Genet. 2004;75:353–362. doi: 10.1086/423901. doi:10.1086/423901. [DOI] [PMC free article] [PubMed] [Google Scholar]
- 29.Liu J.Z., McRae A.F., Nyholt D.R., Medland S.E., Wray N.R., Brown K.M., Hayward N.K., Montgomery G.W., Visscher P.M., Martin N.G., et al. A versatile gene-based test for genome-wide association studies. Am. J. Hum. Genet. 2010;87:139–145. doi: 10.1016/j.ajhg.2010.06.009. doi:10.1016/j.ajhg.2010.06.009. [DOI] [PMC free article] [PubMed] [Google Scholar]
- 30.Frazer K.A., Ballinger D.G., Cox D.R., Hinds D.A., Stuve L.L., Gibbs R.A., Belmont J.W., Boudreau A., Hardenbol P., Leal S.M., et al. A second generation human haplotype map of over 3.1 million SNPs. Nature. 2007;449:851–861. doi: 10.1038/nature06258. doi:10.1038/nature06258. [DOI] [PMC free article] [PubMed] [Google Scholar]
- 31.Kilpelainen T.O., Zillikens M.C., Stancakova A., Finucane F.M., Ried J.S., Langenberg C., Zhang W., Beckmann J.S., Luan J., Vandenput L., et al. Genetic variation near IRS1 associates with reduced adiposity and an impaired metabolic profile. Nat. Genet. 2011;43:753–760. doi: 10.1038/ng.866. doi:10.1038/ng.866. [DOI] [PMC free article] [PubMed] [Google Scholar]
- 32.Speliotes E.K., Willer C.J., Berndt S.I., Monda K.L., Thorleifsson G., Jackson A.U., Lango Allen H., Lindgren C.M., Luan J., Magi R., et al. Association analyses of 249,796 individuals reveal 18 new loci associated with body mass index. Nat. Genet. 0000;42:937–948. doi: 10.1038/ng.686. doi:10.1038/ng.686. [DOI] [PMC free article] [PubMed] [Google Scholar]
- 33.Price A.L., Patterson N.J., Plenge R.M., Weinblatt M.E., Shadick N.A., Reich D. Principal components analysis corrects for stratification in genome-wide association studies. Nat. Genet. 2006;38:904–909. doi: 10.1038/ng1847. doi:10.1038/ng1847. [DOI] [PubMed] [Google Scholar]
- 34.Loos R.J., Lindgren C.M., Li S., Wheeler E., Zhao J.H., Prokopenko I., Inouye M., Freathy R.M., Attwood A.P., Beckmann J.S., et al. Common variants near MC4R are associated with fat mass, weight and risk of obesity. Nat. Genet. 2008;40:768–775. doi: 10.1038/ng.140. doi:10.1038/ng.140. [DOI] [PMC free article] [PubMed] [Google Scholar]
- 35.Lango Allen H., Estrada K., Lettre G., Berndt S.I., Weedon M.N., Rivadeneira F., Willer C.J., Jackson A.U., Vedantam S., Raychaudhuri S., et al. Hundreds of variants clustered in genomic loci and biological pathways affect human height. Nature. 2010;467:832–838. doi: 10.1038/nature09410. doi:10.1038/nature09410. [DOI] [PMC free article] [PubMed] [Google Scholar]
- 36.Frayling T.M., Timpson N.J., Weedon M.N., Zeggini E., Freathy R.M., Lindgren C.M., Perry J.R., Elliott K.S., Lango H., Rayner N.W., et al. A common variant in the FTO gene is associated with body mass index and predisposes to childhood and adult obesity. Science. 2007;316:889–894. doi: 10.1126/science.1141634. doi:10.1126/science.1141634. [DOI] [PMC free article] [PubMed] [Google Scholar]
- 37.Hindorff L.A., Sethupathy P., Junkins H.A., Ramos E.M., Mehta J.P., Collins F.S., Manolio T.A. Potential etiologic and functional implications of genome-wide association loci for human diseases and traits. Proc. Natl Acad. Sci. USA. 2009;106:9362–9367. doi: 10.1073/pnas.0903103106. doi:10.1073/pnas.0903103106. [DOI] [PMC free article] [PubMed] [Google Scholar]
- 38.Hooton H., Angquist L., Holst C., Hager J., Rousseau F., Hansen R.D., Tjonneland A., Roswall N., van der A D.L., Overvad K., et al. Dietary factors impact on the association between CTSS variants and obesity related traits. PLoS ONE. 2012;7:e40394. doi: 10.1371/journal.pone.0040394. doi:10.1371/journal.pone.0040394. [DOI] [PMC free article] [PubMed] [Google Scholar]
- 39.Taleb S., Cancello R., Clement K., Lacasa D. Cathepsin s promotes human preadipocyte differentiation: possible involvement of fibronectin degradation. Endocrinology. 2006;147:4950–4959. doi: 10.1210/en.2006-0386. doi:10.1210/en.2006-0386. [DOI] [PubMed] [Google Scholar]
- 40.Taleb S., Lacasa D., Bastard J.P., Poitou C., Cancello R., Pelloux V., Viguerie N., Benis A., Zucker J.D., Bouillot J.L., et al. Cathepsin S, a novel biomarker of adiposity: relevance to atherogenesis. FASEB J. 2005;19:1540–1542. doi: 10.1096/fj.05-3673fje. [DOI] [PubMed] [Google Scholar]
- 41.Taleb S., Clement K. Emerging role of cathepsin S in obesity and its associated diseases. Clin. Chem. Lab Med. 2007;45:328–332. doi: 10.1515/CCLM.2007.083. doi:10.1515/CCLM.2007.083. [DOI] [PubMed] [Google Scholar]
- 42.Naour N., Rouault C., Fellahi S., Lavoie M.E., Poitou C., Keophiphath M., Eberle D., Shoelson S., Rizkalla S., Bastard J.P., et al. Cathepsins in human obesity: changes in energy balance predominantly affect cathepsin s in adipose tissue and in circulation. J. Clin. Endocrinol. Metab. 2010;95:1861–1868. doi: 10.1210/jc.2009-1894. doi:10.1210/jc.2009-1894. [DOI] [PubMed] [Google Scholar]
- 43.Ishitani T., Ninomiya-Tsuji J., Nagai S., Nishita M., Meneghini M., Barker N., Waterman M., Bowerman B., Clevers H., Shibuya H., et al. The TAK1-NLK-MAPK-related pathway antagonizes signalling between beta-catenin and transcription factor TCF. Nature. 1999;399:798–802. doi: 10.1038/21674. doi:10.1038/21674. [DOI] [PubMed] [Google Scholar]
- 44.Ross S.E., Hemati N., Longo K.A., Bennett C.N., Lucas P.C., Erickson R.L., MacDougald O.A. Inhibition of adipogenesis by Wnt signaling. Science. 2000;289:950–953. doi: 10.1126/science.289.5481.950. doi:10.1126/science.289.5481.950. [DOI] [PubMed] [Google Scholar]
- 45.Marks D.L., Ling N., Cone R.D. Role of the central melanocortin system in cachexia. Cancer Res. 2001;61:1432–1438. [PubMed] [Google Scholar]
- 46.Rolland Y., Onder G., Morley J.E., Gillette-Guyonet S., Abellan van Kan G., Vellas B. Current and future pharmacologic treatment of sarcopenia. Clin. Geriatr. Med. 2011;27:423–447. doi: 10.1016/j.cger.2011.03.008. doi:10.1016/j.cger.2011.03.008. [DOI] [PubMed] [Google Scholar]
- 47.Farooqi I.S., Keogh J.M., Yeo G.S., Lank E.J., Cheetham T., O'Rahilly S. Clinical spectrum of obesity and mutations in the melanocortin 4 receptor gene. N. Engl. J. Med. 2003;348:1085–1095. doi: 10.1056/NEJMoa022050. doi:10.1056/NEJMoa022050. [DOI] [PubMed] [Google Scholar]
- 48.Scarlett J.M., Bowe D.D., Zhu X., Batra A.K., Grant W.F., Marks D.L. Genetic and pharmacologic blockade of central melanocortin signaling attenuates cardiac cachexia in rodent models of heart failure. J. Endocrinol. 2010;206:121–130. doi: 10.1677/JOE-09-0397. doi:10.1677/JOE-09-0397. [DOI] [PMC free article] [PubMed] [Google Scholar]
- 49.Economou M., Trikalinos T.A., Loizou K.T., Tsianos E.V., Ioannidis J.P. Differential effects of NOD2 variants on Crohn's disease risk and phenotype in diverse populations: a metaanalysis. Am. J. Gastroenterol. 2004;99:2393–2404. doi: 10.1111/j.1572-0241.2004.40304.x. doi:10.1111/j.1572-0241.2004.40304.x. [DOI] [PubMed] [Google Scholar]
- 50.Greene C.S., Penrod N.M., Williams S.M., Moore J.H. Failure to replicate a genetic association may provide important clues about genetic architecture. PLoS ONE. 2009;4:e5639. doi: 10.1371/journal.pone.0005639. doi:10.1371/journal.pone.0005639. [DOI] [PMC free article] [PubMed] [Google Scholar]
- 51.Mailman M.D., Feolo M., Jin Y., Kimura M., Tryka K., Bagoutdinov R., Hao L., Kiang A., Paschall J., Phan L., et al. The NCBI dbGaP database of genotypes and phenotypes. Nat. Genet. 2007;39:1181–1186. doi: 10.1038/ng1007-1181. doi:10.1038/ng1007-1181. [DOI] [PMC free article] [PubMed] [Google Scholar]
- 52.Dawber T.R., Meadors G.F., Moore F.E., Jr Epidemiological approaches to heart disease: the Framingham Study. Am. J. Public Health Nations Health. 1951;41:279–281. doi: 10.2105/ajph.41.3.279. doi:10.2105/AJPH.41.3.279. [DOI] [PMC free article] [PubMed] [Google Scholar]
- 53.Feinleib M., Kannel W.B., Garrison R.J., McNamara P.M., Castelli W.P. The Framingham Offspring Study. Design and preliminary data. Prev. Med. 1975;4:518–525. doi: 10.1016/0091-7435(75)90037-7. doi:10.1016/0091-7435(75)90037-7. [DOI] [PubMed] [Google Scholar]
- 54.Koller D.L., Ichikawa S., Lai D., Padgett L.R., Doheny K.F., Pugh E., Paschall J., Hui S.L., Edenberg H.J., Xuei X., et al. Genome-wide association study of bone mineral density in premenopausal European-American women and replication in African-American women. J. Clin. Endocrinol. Metab. 2010;95:1802–1809. doi: 10.1210/jc.2009-1903. doi:10.1210/jc.2009-1903. [DOI] [PMC free article] [PubMed] [Google Scholar]
- 55.Design of the Women's Health Initiative clinical trial and observational study. The Women's Health Initiative Study Group. Control Clin. Trials. 1998;19:61–109. doi: 10.1016/s0197-2456(97)00078-0. doi:10.1016/S0197-2456(97)00078-0. [DOI] [PubMed] [Google Scholar]
- 56.Purcell S., Neale B., Todd-Brown K., Thomas L., Ferreira M.A., Bender D., Maller J., Sklar P., de Bakker P.I., Daly M.J., et al. PLINK: a tool set for whole-genome association and population-based linkage analyses. Am. J. Hum. Genet. 2007;81:559–575. doi: 10.1086/519795. doi:10.1086/519795. [DOI] [PMC free article] [PubMed] [Google Scholar]
- 57.Li Y., Willer C.J., Ding J., Scheet P., Abecasis G.R. MaCH: using sequence and genotype data to estimate haplotypes and unobserved genotypes. Genet. Epidemiol. 2010;34:816–834. doi: 10.1002/gepi.20533. doi:10.1002/gepi.20533. [DOI] [PMC free article] [PubMed] [Google Scholar]
- 58.Li Y., Willer C., Sanna S., Abecasis G. Genotype imputation. Annu. Rev. Genomics Hum. Genet. 2009;10:387–406. doi: 10.1146/annurev.genom.9.081307.164242. doi:10.1146/annurev.genom.9.081307.164242. [DOI] [PMC free article] [PubMed] [Google Scholar]
- 59.Howie B., Fuchsberger C., Stephens M., Marchini J., Abecasis G.R. Fast and accurate genotype imputation in genome-wide association studies through pre-phasing. Nat. Genet. 2012;44:955–959. doi: 10.1038/ng.2354. doi:10.1038/ng.2354. [DOI] [PMC free article] [PubMed] [Google Scholar]
- 60.Pei Y.F., Zhang L., Li J., Deng H.W. Analyses and comparison of imputation-based association methods. PLoS ONE. 2010;5:e10827. doi: 10.1371/journal.pone.0010827. doi:10.1371/journal.pone.0010827. [DOI] [PMC free article] [PubMed] [Google Scholar]
- 61.Zhang L., Li J., Pei Y.F., Liu Y., Deng H.W. Tests of association for quantitative traits in nuclear families using principal components to correct for population stratification. Ann. Hum. Genet. 2009;73:601–613. doi: 10.1111/j.1469-1809.2009.00539.x. doi:10.1111/j.1469-1809.2009.00539.x. [DOI] [PMC free article] [PubMed] [Google Scholar]
- 62.Chen W.M., Abecasis G.R. Family-based association tests for genomewide association scans. Am. J. Hum. Genet. 2007;81:913–926. doi: 10.1086/521580. doi:10.1086/521580. [DOI] [PMC free article] [PubMed] [Google Scholar]
- 63.Devlin B., Roeder K. Genomic control for association studies. Biometrics. 1999;55:997–1004. doi: 10.1111/j.0006-341x.1999.00997.x. doi:10.1111/j.0006-341X.1999.00997.x. [DOI] [PubMed] [Google Scholar]
- 64.Willer C.J., Li Y., Abecasis G.R. METAL: fast and efficient meta-analysis of genomewide association scans. Bioinformatics. 2010;26:2190–2191. doi: 10.1093/bioinformatics/btq340. doi:10.1093/bioinformatics/btq340. [DOI] [PMC free article] [PubMed] [Google Scholar]
- 65.Lumley T. rmeta: Meta-analysis. R package, version 2.16. 2009 [Google Scholar]
- 66.Morris A.P. Transethnic meta-analysis of genomewide association studies. Genet. Epidemiol. 2011;35:809–822. doi: 10.1002/gepi.20630. doi:10.1002/gepi.20630. [DOI] [PMC free article] [PubMed] [Google Scholar]
- 67.Fisher R.A. Statistical Methods for Research Workers. Oliver and Boyd (Edinburgh); 1925. [Google Scholar]
Associated Data
This section collects any data citations, data availability statements, or supplementary materials included in this article.