

Abstract
Sulforaphane (SFN) is a potent inducer of detoxication enzymes such as NAD(P)H:quinone oxidoreductase 1 (NQO1) and glutathione-S-transferase (GST) via the Kelch-like erythroid-derived protein with CNC homology-associated protein 1 (Keap1)–NF-E2-related factor 2 (Nrf2) signaling pathway. NQO1 reduces the carcinogenic estrogen metabolite, catechol estrogen-3,4-quinone, whereas GSTs detoxify it through conjugation with glutathione. These 3,4-quinones can react with DNA to form depurinating DNA adducts. Thus, SFN may alter estrogen metabolism and thus protect against estrogen-mediated DNA damage and carcinogenesis. Human breast epithelial MCF-10A cells were treated with either vehicle or SFN and either estradiol (E2) or its metabolite 4-hydroxyestradiol (4-OHE2). 4-Hydroxy-derived estrogen metabolites and depurinating DNA adducts formed from E2 and its interconvertable metabolite estrone (E1) were analyzed by mass spectrometry. Levels of the depurinated adducts, 4-OHE1/2-1-N3Adenine and 4-OHE1/2-1-N7Guanine, were reduced by 60% in SFN-treated cells, whereas levels of 4-OCH3E1/2 and 4-OHE1/2-glutathione conjugates increased. To constitutively enhance the expression of Nrf2-regulated genes, cells were treated with either scrambled or siKEAP1 RNA. Following E2 or 4-OHE2 treatments, levels of the adenine and guanine adducts dropped 60–70% in siKEAP1-treated cells, whereas 4-OHE1/2-glutathione conjugates increased. However, 4-OCH3E1/2 decreased 50% after siKEAP1 treatment. Thus, treatment with SFN or siKEAP1 has similar effects on reduction of depurinating estrogen–DNA adduct levels following estrogen challenge. However, these pharmacologic and genetic approaches have different effects on estrogen metabolism to O-methyl and glutathione conjugates. Activation of the Nrf2 pathway, especially elevated NQO1, may account for some but not all of the protective effects of SFN against estrogen-mediated DNA damage.
Introduction
Elevated levels of estrogens have been recognized as an important determinant of the risk of breast cancer (1). Studies in experimental animal models demonstrate that estradiol (E2) and estrone (E1) are carcinogenic (2) and studies in cultured human cells (3,4) provide a mechanistic basis for this effect. Observational studies and clinical trials consistently support the contention that sustained exposure to endogenous estrogens is associated with the development of sporadic breast cancer. Two complementary pathways are likely required for estrogen carcinogenicity (2). One involves signaling through the estrogen receptor (ER) leading to altered gene expression and increased proliferation accompanied by spontaneous mutations (5). The other pathway, outlined in Figure 1, involves the oxidative metabolism of E1 or E2 to catechol estrogens and then reactive quinone metabolites. These metabolites can then directly and/or indirectly cause DNA damage and mutations responsible for the initiation and progression to breast cancer.
Fig. 1.
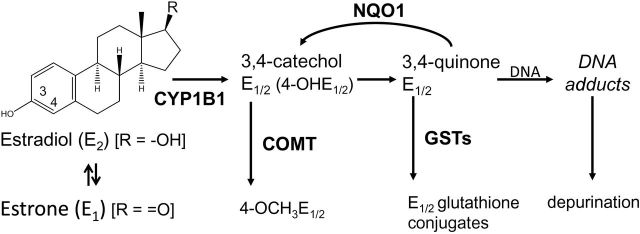
Pathway for formation of estrogen depurinating DNA adducts. E2 or E1 can be oxidized to E1/2-3,4-quinone, which can bind to DNA to form 4-OHE1/2-1-N3Adenine or 4-OHE1/2-1-N7Guanine adducts. NQO1 reduces E1/2-3,4-quinones back to catechols and GST catalyzes the conjugation of E1/2-3,4-quinones with glutathione, whereas COMT catalyzes the methylation of 4-OHE1/2 to 4-OCH3E1/2
Metabolism of estrogens is characterized by a balanced set of activating and deactivating pathways. Aromatization of androstenedione and testosterone by aromatase (CYP19) yields E1 and E2, respectively. E1 and E2 are interconverted by 17β-hydroxysteroid dehydrogenase, and they are metabolized at the 2- or 4-position to form 2-OHE1/2 or 4-OHE1/2, respectively. Cytochrome P450 1A1 preferentially hydroxylates E1 and E2 at C-2, whereas cytochrome P450 1B1 (CYP1B1) almost exclusively catalyzes the formation of 4-OHE1/2 (6). The most common pathway of conjugation of estrogens in extrahepatic tissues is O-methylation, catalyzed by catechol-O-methyltransferase (COMT). If the activity of COMT is low, CYP or peroxidases can catalyze competitive oxidation of the catechol estrogens to E1/2-2,3-quinones and E1/2-3,4-quinones. Higher levels of depurinating DNA adducts are formed by E1/2-3,4-quinones compared with E1/2-2,3-quinones due to different mechanisms of adduction (7). The E1/2-3,4-quinones react via a 1,4-Michael addition, whereas the E1/2-2,3-quinones rearrange to p-quinone methides, which react via a 1,6-Michael addition (8). These adducts generate apurinic sites that can be converted into mutations by error-prone repair, which in turn may initiate breast carcinogenesis (9). Consistent with these actions, E1/2-3,4-quinone produced A–T to G–C mutations in the DNA of the mammary gland of ACI rats (10).
Although the estrogen oxidation pathway is detrimental to the integrity of DNA, several protective pathways in cells control the homeostasis of estrogen metabolism to avoid DNA damage. Catechol estrogens can be detoxified by COMT, and the E1/2-3,4-quinones by conjugation with glutathione or by reduction back to catechol estrogens, catalyzed by NAD(P)H:quinone oxidoreductase 1 (NQO1) (8) (Figure 1). Diminished expression of detoxication enzymes and/or upregulation of enzymes of the oxidation pathway can disrupt this homeostasis. For example, higher expression of CYP19 and CYP1B1, or lower expression of COMT and NQO1, in breast tissues is associated with elevated risk of breast cancer (11). Gaikwad et al. (12,13) and Pruthi et al. (14) have reported that there is a significantly higher ratio of depurinating DNA adducts to other estrogen metabolites when comparing women at high risk for breast cancer or diagnosed with the disease to controls, indicating that formation of depurinating estrogen–DNA adducts likely plays key roles in breast cancer development.
Sulforaphane (SFN) is an isothiocyanate found in cruciferous vegetables with particularly high levels in 3-day-old broccoli sprouts (15). It is converted by hydrolysis of the glucosinolate, glucoraphanin, by the enzyme, myrosinase, found in plants or by β-thioglucosidases found in the gut microflora. SFN is an attractive chemopreventive agent since it is safe and can be distributed widely as broccoli sprout preparations. Moreover, SFN and broccoli sprout preparations are effective chemopreventive agents in rodent models of mammary carcinogenesis (15,16) and initial pharmacokinetic studies indicate that pharmacologically relevant concentrations of SFN metabolites can be detected in the mammary epithelium of women consuming broccoli sprout-derived beverages (17). An important, but far from unilateral, mechanism of action for SFN is the induction of carcinogen detoxication enzymes such as NQO1 and glutathione-S-transferases (GSTs). SFN is an activator of the antioxidant response element Kelch-like erythroid-derived protein with CNC homology-associated protein 1 (Keap1)–NF-E2-related factor 2 (Nrf2) signaling pathway regulating the expression of these and many other genes (18). Under normal cellular conditions, Nrf2 binds to Keap1 in the cytoplasm, resulting in ubiquitination of Nrf2 and its subsequent proteasomal degradation (19). SFN can modify cysteine 151 in Keap1 to disrupt the association of Cul3 ubiquitin ligase with Keap1, allowing Nrf2 to escape degradation. Thus, Nrf2 is stabilized and translocates into the nucleus to induce the transcription of its target genes such as NQO1 and GST (3,20). Using transcriptomic and proteomic profiling, we have shown previously that SFN induces Nrf2-regulated genes in ERα negative, non-tumorigenic human breast epithelial MCF-10A and MCF-12A cells (20) and primary cultures of human mammary epithelial cells (21). Interestingly, these profiles were similar to those provoked by treatment of the MCF-10A cells with small interfering RNA (siRNA) vectors for KEAP1 knockdown (20). In the present study, we have evaluated the efficacy of SFN to alter estrogen metabolism away from the formation of DNA adducts through induction of detoxication genes and to determine the extent to which such protection can be mimicked by genetic amplification of the Nrf2 signaling pathway through KEAP1 knockdown.
Materials and methods
Chemicals and reagents
E2, 4-hydroxyestradiol (4-OHE2) and 4-OCH3E1 (E2) were obtained from Steraloids (Newport, RI). Standards of the glutathione conjugates of 4-OHE2 and the depurinating DNA adducts were synthesized by published procedures (7,22–24). A mixed standard solution of 10 µg/ml was obtained by mixing 10 µl of individual stock solutions (1mg/ml) and diluting to 1ml with methanol/water 50:50 with 0.1% formic acid. Serial dilutions of this solution were used as standards for the preparation of calibration curves. Stock standard solutions and mixed standard solutions were stored at −80°C. SFN (1-isothiocyanato-4-(methylsulfinyl)-butane) was purchased from LKT Laboratories (St Paul, MN). The glutathione (reduced) quantification kit was purchased from Dojindo Molecular Technologies (Rockville, MD). All other chemicals were of the highest quality obtainable commercially.
Cell lines and cell culture
MCF-10A cells were obtained from the American Type Culture Collection and cultured in estrogen-free medium at 37°C in a humidified incubator containing 5% CO2. Cell culture medium was prepared by a phenol red-free mixture of Dulbecco’s modified Eagle’s media and Ham’s nutrient mixture F-12 media (Mediatech, Manassas, VA) containing 20ng/ml epidermal growth factor, 10 µg/ml insulin, 0.5 µg/ml hydrocortisone, 100ng/ml cholera toxin and 5% charcoal-stripped fetal bovine serum (Invitrogen) (25).
For SFN treatment, cells were seeded in 10 cm dishes (1–2 × 10⁶ cells/10ml media/dish) overnight and then treated with either vehicle or SFN for 24 h. After discarding the media, all plates were fed with fresh cell culture media containing 10 μM E2 or 4-OHE2 for 24 h and then retreated with vehicle or SFN for another 24 h (Figure 2) without changing cell culture media. SFN and E2 were dissolved in dimethyl sulfoxide and 4-OHE2 was dissolved in ethanol; the final vehicle concentration in the media was <0.05% (v/v). For siRNA knockdown of KEAP1, cells were seeded in 10 cm dishes (1–2 × 10⁶ cells/10ml medium/dish) overnight and were transfected at 30–40% confluence with siRNA human KEAP1(J-012453-07) or scrambled siRNA control(D-001810-01) from Thermo Scientific (Dharmacon, Lafayette, CO) with lipofectamine 2000 for 48 h following the manufacturer’s protocol (Figure 2). Confirmatory experiments were conducted using a shRNA construct for KEAP1. The target sequence selected, 5′-GTGGGCGTGGCTGTCCTCAAT-3′ (sense), corresponds to a region 1572–1592bp of the Keap1 gene. The sh-Scramble sequence was selected as 5′-GGACGGAGCAGTCAAGTACAA-3′. The targeted and scrambled sequences were subcloned into entry vector pENTR/H1 plasmid (Invitrogen), pENTR/H1/Keap1 or scramble was recombined into pAD/Dest. Then pAd/Keap1 or scramble was transfected into the adenovirus packaging cell line. After generation, amplification and titer measuring, the adenoviruses were then incubated with MCF-10A cells at 37°C. The cell culture media were collected with 2mg/ml ascorbic acid added and either processed immediately or frozen at −80°C prior to assay for estrogen metabolites and depurinating DNA adducts. Cells were harvested for RNA, protein and activity assays.
Fig. 2.

Timeline for treatments of MCF-10A cells.
Quantitative reverse transcription–polymerase chain reaction
Total RNA was isolated using the Qiagen RNeasy Mini Kit (Qiagen, Germantown, MD) or 5 PRIME PerfectPure RNA Cell & Tissue Kit (5PRIME, Gaithersburg, MD), from which complementary DNA was synthesized using the qScript™ cDNA synthesis kit (Quanta BioSciences, Gaithersburg, MD). PCR was carried out in a 20 µl volume including each target primer, complementary DNA and iQ™ SYBR® Green Supermix (Bio-Rad, Hercules, CA) and run in a Bio-Rad Thermal Cycler (Bio-Rad, Hamburg, Germany). Fold-change values were determined using the 2−ΔΔCt relative quantification method (26). The amplified products were electrophoresed on agarose gel and stained with ethidium bromide.
PCR primers were as follows: forward 5′-TGACAATGAGGTTTCTTCGG-3′ and reverse 5′-TCTGTCAGTTTGGCTTCTGG-3′ for human Nrf2, forward 5′-ACGTCCTTGGAGGCTATGAT-3′ and reverse 5′-TCTGCTGGTCA ATCTGCTTC-3′ for human KEAP1, forward 5′-CGCTTCTCTTGGAGGA ATGT-3′ and reverse 5′-TCCACCACCTCCCTGTATTC-3′ for human COMT, forward 5′-TTCCGGAGTAAGAAGGCAGT-3′ and reverse 5′-GGAGTGTGCCCAATGCTAT-3′ for human NQO1, forward 5′-TAAA GGAGAGAGCCCTGATTG-3′ and reverse 5′-TTCAAAGGCAGGGAAGT AGC-3′ for human GSTA1 and forward 5′-GGACTCATGACCACAGTCCA-3′ and reverse 5′-CTGCTTCACCACCTTCTTGA-3′ for glyceraldehyde 3-phosphate dehydrogenase.
Western blots
After treatment, cells were harvested and then lysed in RIPA buffer with protease inhibitor (Roche Diagnostics GmbH, Mannheim, Germany) and unlysed cellular debris removed by centrifugation. Protein concentrations were determined by using the BCA protein assay kit (Pierce Biotechnology, Rockford, IL). Western blot procedures followed the ABC protocol. Samples were electrophoresed on sodium dodecyl sulfate–polyacrylamide gel electrophoresis and transferred to polyvinylidene difluoride membranes. The membranes were blocked in Tris-buffered saline with 0.05% Tween 20 with 5% non-fat milk, incubated with primary antibodies and then incubated with a peroxidase-conjugated secondary antibody after extensive washing. Dilutions of primary anti-KEAP1, Nrf2, NQO1 (Santa Cruz Biotechnology), CYP1B1 (Genetest, Bedford, MA), COMT, GSTA1 and β-actin (Sigma) antibodies were made in blocking solution (5% non-fat dry milk in Tris-buffered saline). The blots were incubated with Western Lightning® Plus-ECL solution (PerkinElmer, Waltham, MA) and visualized with X-ray film. Intensities of the bands were quantified by Bio-Rad Quantity One® software (Bio-Rad, Hercules, CA). The densitometry ratios for treated samples compared with controls were determined for three biological replicates and normalization was to β-actin.
NQO1 activity
MCF-10A cells were washed three times with 0.25M sucrose/10mM potassium phosphate (pH 7.2), collected from the plates by scraping, frozen in liquid nitrogen and stored at −80°C for assay as described previously (27).
Ultra-performance liquid chromatography–tandem mass spectrometry analysis of estrogen metabolites and depurinating DNA adducts
Extraction of estrogen metabolites and depurinating DNA adducts from cell culture media was modified from previously described procedures (12). After adjusting the pH to 7, cell culture media (10ml/sample) was loaded onto phenyl cartridges (Agilent Technologies) that were preconditioned with methanol and water. Extracts were eluted as described (12), lyophilized, redissolved in a methanol:water 50:50 mixture containing 0.1% formic acid and finally subjected to ultra-performance liquid chromatography–tandem mass spectrometry analysis. Mass spectrometer parameters are presented in Table I. Analyses were conducted using selected reaction monitoring with a triple stage quadrupole mass spectrometer (TSQ Vantage, Thermo Scientific) by using heated electrospray ionization in positive ion mode. The mass spectrometer was interfaced to a ultra-performance liquid chromatography system consisting of an Accela quaternary pump (Thermo Scientific) used for the chromatographic separation, and a Thermo Pal autosampler (HTC PAL, Zwingen, Switzerland). A Hypersil Gold column (1.9 μm, 100 × 2.1mm, Thermo Electron) was used for separation at a flow rate of 0.5ml/min. The gradient started with 95% A (0.1% formic acid in H2O) and 5% B (0.1% formic acid in CH3CN), changed to 80% A over 1min, changed to 79% A over 4min, followed by a 4 min linear gradient to 30% A, changed to 2% A for 2 min, then changed back to the original conditions with a 3 min hold, resulting in a total separation time of 14min. For all the studies, a methanol:water (1:1) mixture with 0.1% formic acid was used as the carrier solution. A signal-to-noise ratio of 3 was used as the limit of detection for each compound. Experiments were performed by applying a capillary (ion transfer tube) temperature of 380°C, vaporizer temperature 398°C, sheath gas pressure (arbitrary units) 50, auxiliary gas pressure (arbitrary units) 20, spray voltage 3.98 kV and collision gas pressure 1.5 mTorr. The collision energy for each compound is listed in Table I. The coefficient of variance for all analytes was <4%. The Xcalibur software (Thermo Scientific) was used to process and quantify the acquired data of estrogen metabolites.
Table I.
Mass spectrometry parameters
| Name | Parent | Product | Collision energy | Limit of detection (fmol) |
|---|---|---|---|---|
| 4-OCH3E1 | 301.18 | 189.12 | 21 | 166.0 |
| 4-OCH3E2 | 303.15 | 137.10 | 23 | 329.9 |
| 4-OHE1-2-glutathione | 592.16 | 317.06 | 23 | 84.4 |
| 4-OHE2-2-glutathione | 594.17 | 319.08 | 24 | 168.3 |
| 4-OHE1-1-N7Guanine | 436.20 | 152.02 | 39 | 2.8 |
| 4-OHE2-1-N7Guanine | 438.21 | 272.12 | 35 | 2.8 |
| 4-OHE1-1-N3Adenine | 420.20 | 296.09 | 44 | 2.9 |
| 4-OHE2-1-N3Adenine | 422.16 | 136.00 | 47 | 2.9 |
| 2-OHE1-1-N3Adenine | 420.20 | 136.04 | 31 | 1.4 |
| 2-OHE2-1-N3Adenine | 422.22 | 136.02 | 28 | 1.4 |
Statistics
The data are presented as means ± SE of at least three independent experiments. Comparisons between two groups were analyzed using the Student’s t-test, and significance was established at P < 0.05 using Prizm 5 software.
Results
Modulation of transcripts, protein expression and activity of estrogen metabolism enzymes by SFN treatment or KEAP1 knockdown
Treatment of MCF-10A cells with SFN led to induction of GSTA1 and NQO1 transcripts but no changes in expression levels of two other genes known to influence E2 metabolism, namely CYP1B1 and COMT, were observed (Figure 3A). These inductions exhibited a dose response, with minimal induction observed with 3 μM, moderate with 7 μM and near maximal with 10 μM SFN (data not shown). As expected, there were also no changes in the transcript levels of KEAP1 or NRF2. SFN treatment significantly elevated NQO1 protein level 3.0-fold (P < 0.01; SFN treatment versus vehicle, Figure 3B) and its specific activity 2.7-fold (P < 0.01; SFN treatment versus vehicle, Figure 3C). Although no change of COMT messenger RNA level was detected, a significant 2.4-fold increase in COMT protein (P < 0.05; SFN treatment versus vehicle, Figure 3B) was observed. CYP1B1 protein was significantly decreased by 50% with SFN treatment (Figure 3B) (P < 0.05; SFN treatment versus vehicle). Thus, it appears that SFN influences the expression of E2 metabolizing enzymes through both transcriptional and post-transcriptional mechanisms. As expected, SFN and siKEAP1 also lead to increases in intracellular concentrations of reduced glutathione in MCF-10A cells (1.48- and 1.71-fold, respectively).
Fig. 3.

Effects of SFN on transcript, protein and activities of enzymes metabolizing E2 or E1. (A) Effect of SFN on transcripts levels of estrogen metabolism enzymes. (B) Effect of SFN on protein levels of estrogen metabolism enzymes. (C) Effect of SFN on NQO1 activity. MCF-10A cells were treated with 10 µM SFN as described in Figure 2. Values are mean ± SE of three independent experiments. *Differs from vehicle control, P < 0.05.
Since SFN is a well-characterized activator of Nrf2 signaling in MCF-10A and other mammary cells (20,21), the influence of siKEAP1 knockdown, and hence genetic activation of the pathway, was evaluated. As shown in Figure 4, transcript (Figure 4A), protein (Figure 4B) and specific activity of NQO1 (Figure 4C) significantly increased in the setting where KEAP1 expression was significantly reduced by 80% (P < 0.01 siKEAP1 versus scrambled). Interestingly, no induction of GSTA1 transcripts was detected, suggesting that the SFN-mediated induction of this gene is Nrf2 independent. Also unexpectedly, levels of COMT transcripts as well as COMT protein were significantly decreased 60–70% by the siKEAP1 treatment (P < 0.01 for COMT protein level in siKEAP1 versus scrambled) (Figure 4A and B). Comparable results were seen using shKEAP1 knockdown (data not shown). COMT is not known to be a direct Nrf2-regulated gene and the mechanism underlying this response is not known.
Fig. 4.

Effects of siKEAP1 on transcript, protein and activities of E2 metabolizing enzymes. (A) Effect of siKEAP1 on levels of estrogen metabolism enzyme transcripts. (B) Effect of siKEAP1 on protein levels of estrogen metabolism enzymes. Scr, scrambled; siKp, siKEAP1. (C) Effect of siKEAP1 on NQO1 activity. MCF-10A cells were treated with siKEAP1 as described in Figure 2. Values are mean ± SE of three independent experiments. *Differs from scrambled control, P < 0.05.
Modulation of levels of depurinating estrogen–DNA adducts and estrogen metabolites by SFN or siKEAP1 treatment
At 48 h after E2 treatment, the summed levels of the depurinating adducts, 4-OHE1/2-1-N3Adenine and 4-OHE1/2-1-N7Guanine, in the culture media were significantly lower in SFN-treated cells compared with vehicle (0.03±0.01 versus 0.07±0.02 pmol/106 cells, P < 0.05) (Figure 5A). Although E2 was added to the cells, there was considerable conversion to E1. Approximately half of the formed adenine and guanine adducts were derivatives of E1 and the remainder were from E2. In contrast, levels of 4-OCH3E1/2 increased significantly with SFN treatment (5.36±0.16 versus 1.81±0.20 pmol/106 cells, P < 0.01) (Figure 5B). More modest increases in the levels of 4-OHE1/2-glutathione conjugates were measured following SFN treatment (1.54±0.37 versus 0.83±0.19 pmol/106 cells, P < 0.05, Figure 5C). About 25-fold more methoxy conjugates were formed than glutathione conjugates in either the vehicle or SFN-treated cells. 2-OHE1/2 adducts were also measured but typically reflected only 2–3% of the level of the 4-OHE1/2 DNA adducts formed. Therefore, we did not characterize patterns of 2-OHE1/2-derived metabolites.
Fig. 5.
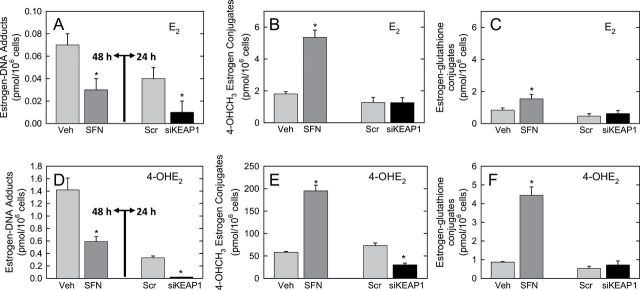
Effect of pharmacologic or genetic perturbation of estrogen metabolism on estrogen–DNA adducts and metabolites in MCF-10A cells. Cell culture media were collected, partially purified by solid-phase extraction, and analytes separated and quantified by ultra-performance liquid chromatography–tandem mass spectrometry. (A–C) Levels of estrogen–DNA adducts, 4-OHCH3E1/2 or E1/2-glutathione conjugates, respectively, following addition of E2 to cells pretreated with either SFN or siKEAP1. (D–F) Levels of estrogen–DNA adducts, 4-OHCH3E1/2 or E1/2-glutathione conjugates, respectively, following addition of 4-OHE2 to cells pretreated with either SFN or siKEAP1. Veh, vehicle; Scr, scrambled vector. Values are mean of triplicate biological replicates ± SE. *Differs from control, P < 0.05.
Addition of the proximate metabolite, 4-OHE2, to cells led to 20-fold higher levels of depurinating estrogen–DNA adducts than seen with E2 in vehicle-treated cells. In this instance, the majority was derived from E1. 4-OHE1/2-1-N3Adenine and 4-OHE1/2-1-N7Guanine adducts were again significantly lower in SFN-treated cells compared with vehicle (0.59±0.11 versus 1.42±0.16 pmol/106 cells, P < 0.01; Figure 5D). 4-OCH3E1/2 levels increased 3.4-fold (195.00±12.33 versus 58.05±1.77 pmol/106 cells, P < 0.01; Figure 5E), whereas 4-OHE1/2-glutathione conjugates increased 5.1-fold following SFN treatment (4.44±0.52 versus 0.87±0.03 pmol/106 cells, P < 0.01; Figure 5F). The methoxy conjugates were the dominant metabolites detected.
Pretreatment of cells with siKEAP1 led to more substantial declines in levels of the depurinating estrogen–DNA adducts in the cell culture media. Following E2 treatment, levels of the 4-OHE1/2-1-N3Adenine and 4-OHE1/2-1-N7Guanine adducts dropped 70% in siKEAP1-treated cells compared with scrambled vector. 4-OCH3E1/2 levels decreased 50% with siKEAP1 treatment (Figure 5E), whereas levels of the 4-OHE1/2-glutathione conjugates were not significantly different (Figure 5F). Both outcomes are consistent with the effects of siKEAP1 on COMT and GSTA1 transcripts (Figure 4A). Similar results were seen following 4-OHE2 treatment. 4-OHE1/2-1-N3Adenine and 4-OHE1/2-1-N7Guanine adducts declined 90% in siKEAP1-treated cells compared with scrambled vector (Figure 5D); 4-OCH3E1/2 declined 60% (Figure 5E), whereas there was no significant change in levels of 4-OHE1/2-glutathione conjugates with siKEAP1 treatment (Figure 5F).
Discussion
The natural and synthetic estrogens E1, E2, diethylstibestrol and hexestrol induce kidney tumors in Syrian golden hamsters (28). Additionally, the proximate estrogen metabolites, 4-OHE1/2, are carcinogenic in hamsters and mice, but 2-OHE1/2 metabolites are not (29–31). 4-OHE2 and E2-3,4-quinone are mutagenic in mouse skin and rat mammary gland (9,32). The genotoxicity of 4-OHE2 and E2-3,4-quinone was also demonstrated in the Big Blue rat embryonic cell line, but no mutations were observed after treatment of the cells with 2-OHE2 (33). The much greater carcinogenic activity of 4-OHE1/2 compared with 2-OHE1/2 likely reflects the far greater propensity of E1/2-3,4-quinones to form estrogen–DNA adducts compared with E1/2-2,3-quinones (7). Transgenic mice with ERα knocked out (ERKO/wnt-1 mice) provide another model that demonstrates the critical role of estrogen genotoxicity in carcinogenesis. The wnt-1 transgene induced mammary tumors in female ERKO/wnt-1 mice, despite the lack of ERα (34). Mammary tumors developed in these mice even when ovariectomized mice were implanted with both E2 and the antiestrogen ICI-182,780 (35) suggesting that non-ER pathways such as metabolism to the genotoxic quinones that form the adenine and guanine adducts contribute to mammary tumor development.
MCF-10A cells are an immortalized mammary epithelial cell line lacking ERα. Treatment of MCF-10A cells with E2 or 4-OHE2 generates the depurinating estrogen–DNA adducts and transformation of the cells, as detected by their ability to form colonies in soft agar (36). This transformation can also occur in the presence of the antiestrogens, tamoxifen or ICI-182,780 (37). Thus, DNA damage and cell transformation by estrogens do not require a functional ERα signaling pathway. Consequently, strategies to prevent the formation of estrogen–DNA adducts may alter the initiation and development of both ERα positive and negative cancers.
The depurinating estrogen–DNA adducts that efflux from cells and tissues are excreted in urine, allowing their identification and quantification as biomarkers of risk of developing breast cancer (7,12–14). High levels of estrogen–DNA adducts have been observed in analyses of urine and serum from women at high risk for or diagnosed with breast cancer compared with women at normal risk (12–14). Levels of DNA adducts are strongly influenced by the balance of enzymes involved in their bioactivation to reactive intermediates and their detoxication. Protective enzymes such as COMT, GSTs and NQO1 can decrease steady-state levels of E1/2-3-4-quinones and the resulting depurinating estrogen–DNA adducts in cell culture models (Figure 1). For example, inhibition of COMT led to an increase in oxidative DNA damage in human breast cancer-derived MCF-7 cells (38) and formation of E1/2-3-4-quinone adenine and guanine DNA adducts in MCF-10F cells (39). Conjugation of the quinones with glutathione catalyzed by GSTs and reduction by NQO1 of the quinones back to catechol estrogens can be envisioned to mitigate the formation of depurinating adducts. A series of isogenic MCF-10F cells stably expressing polymorphic variants of NQO1 with lower capacity to reduce estrogen quinones compared with wild-type NQO1 consistently led to increased formation of estrogen–DNA adducts from E2-3,4-quinone (40).
As seen in an earlier study using the phytochemical resveratrol in MCF-10F cells, it is possible to reduce the formation of estrogen–DNA adducts and to decrease E2-induced transformation to anchorage-independent growth (4). We show here that the broadly effective chemopreventive agent isolated from broccoli, SFN, also exerts strong protective effects against the DNA damaging actions of estrogens in the MCF-10A cells. The enzymes associated with protection are inducible by SFN in many human cell types, including MCF-12A (20) and primary mammary epithelial cells (21). Given the current preclinical and clinical evaluation of SFN (typically as an enriched component of broccoli sprout extracts; see ClinicalTrials.gov), there is interest in targeting this agent toward breast cancer prevention. Protection against the genotoxicity of estrogens in the MCF-10A cells can be induced by treatment with SFN or genetic activation of Nrf2 signaling. However, the underlying metabolic changes are distinct, indicating that upregulation of Nrf2 signaling may not account for the full effects of SFN on this endpoint. Following treatment with E2, the SFN pretreated cells exhibit significant increases in the production of 4-OCH3 and glutathione conjugates. However, these detoxication metabolites were not elevated by the pretreatment of cells with siKEAP1. Thus, the effects of SFN on COMT and GSTA1 appear to occur independently of Nrf2 signaling. Indeed, siKEAP1 led to a decrease in COMT protein levels and decline in 4-OCH3 formation while nonetheless exhibiting protection. Whether Nrf2 exerts negative regulation on COMT is not known although neither microarray nor ChIP-Seq studies indicate it to be a direct Nrf2 target gene (41,42). Presumably then, SFN-mediated upregulation of COMT levels at the protein, but not transcript level, reflects a distinct, Nrf2-independent mode of action. Given the protective actions of both the pharmacologic and genetic interventions, and the common induction of NQO1 by both modalities, it is likely that reduction of the E1/2-3,4-quinones back to catechol estrogens is central to the effect. SFN also reduces levels of CYP1B1 protein in these cells, which could dampen formation of the catechol estrogens. However, the protection by SFN is also seen when 4-OHE2 is administered to cells, a metabolite that is a product of CYP1B1 action. Thus, it is unlikely that inhibition of estrogen bioactivation is critical to protection in this setting. That bioactivation of E2 is critical to its genotoxicity is underscored by the observation that 20-fold higher levels of depurinating estrogen–DNA adducts are detected following administration of 4-OHE2 than with E2. It should also be noted that considerably more catechol-O-methyl conjugates are formed than glutathione conjugates (~200 pmol/106 cells versus 4 pmol/106 cells), indicating that GST catalyzed detoxication plays a minor role in overall protection against estrogen genotoxicity. Moreover, the absence of induction of GSTA1 by siKEAP1, which is nonetheless protective, also signals that GSTs are not critical in modulating estrogen–DNA adduct burden. Elevation of intracellular glutathione, observed in both the pharmacologic and genetic manipulations, did not lead to elevated 4-OH-estrogen–glutathione conjugates in the siKEAP1-treated cells, suggesting that non-enzymatic conjugation with glutathione too has no protective role.
In conclusion, SFN is the embodiment of phytochemical poly-pharmacy in a single molecule. It interacts with many molecular targets in cells and exerts its chemopreventive actions through actions on multiple pathways (43). The protective effect of SFN against estrogen-mediated DNA damage further highlights its possible role in chemoprevention of mammary carcinogenesis and illustrates that multiple mechanisms likely account for this outcome. Induction of the Nrf2-regulated detoxication gene, NQO1, would seem to be central to the protective alterations in metabolite distribution. At the same time, Nrf2-independent actions of SFN on COMT and GSTA1 are likely to contribute to enhanced protection of the genome.
Funding
Department of Defense Breast Cancer Research Program Postdoctoral Fellowship (103928); United States Public Health Service Breast SPORE (P50 CA088843); Pennsylvania Department of Health Commonwealth Universal Research Enhancement Grant.
Conflict of Interest Statement: None declared.
Glossary
Abbreviations:
- 4-OHE2
4-hydroxyestradiol
- COMT
catechol-O-methyltransferase
- CYP1B1
cytochrome P450 1B1
- E1
estrone
- E2
estradiol
- ER
estrogen receptor
- GST
glutathione-S-transferase
- Keap1
Kelch-like erythroid-derived protein with CNC homology-associated protein 1
- NQO1
NAD(P)H:quinone oxidoreductase 1
- Nrf2
NF-E2-related factor 2
- SFN
sulforaphane
- siRNA
small interfering RNA.
References
- 1. Yager J.D., et al. (2006). Estrogen carcinogenesis in breast cancer. N. Engl. J. Med., 354, 270–282 [DOI] [PubMed] [Google Scholar]
- 2. Yager J.D. (2000). Endogenous estrogens as carcinogens through metabolic activation. J. Natl Cancer Inst. Monogr., 27, 67–73 [DOI] [PubMed] [Google Scholar]
- 3. Lu F., et al. (2008). Resveratrol prevents estrogen-DNA adduct formation and neoplastic transformation in MCF-10F cells. Cancer Prev. Res., 1, 135–145 [DOI] [PMC free article] [PubMed] [Google Scholar]
- 4. Zahid M., et al. (2008). Prevention of estrogen-DNA adduct formation in MCF-10F cells by resveratrol. Free Radic. Biol. Med., 45, 136–145 [DOI] [PMC free article] [PubMed] [Google Scholar]
- 5. Feigelson H.S., et al. (1996). Estrogens and breast cancer. Carcinogenesis, 17, 2279–2284 [DOI] [PubMed] [Google Scholar]
- 6. Hayes C.L., et al. (1996). 17 beta-Estradiol hydroxylation catalyzed by human cytochrome P450 1B1. Proc. Natl Acad. Sci. USA, 93, 9776–9781 [DOI] [PMC free article] [PubMed] [Google Scholar]
- 7. Zahid M., et al. (2006). The greater reactivity of estradiol-3,4-quinone vs estradiol-2,3-quinone with DNA in the formation of depurinating adducts: implications for tumor-initiating activity. Chem. Res. Toxicol., 19, 164–172 [DOI] [PubMed] [Google Scholar]
- 8. Cavalieri E.L., et al. (2011). Unbalanced metabolism of endogenous estrogens in the etiology and prevention of human cancer. J. Steroid Biochem. Mol. Biol., 125, 169–180 [DOI] [PMC free article] [PubMed] [Google Scholar]
- 9. Cavalieri E., et al. (2006). Catechol estrogen quinones as initiators of breast and other human cancers: implications for biomarkers of susceptibility and cancer prevention. Biochim. Biophys. Acta, 1766, 63–78 [DOI] [PubMed] [Google Scholar]
- 10. Mailander P.C., et al. (2006). Induction of A.T to G.C mutations by erroneous repair of depurinated DNA following estrogen treatment of the mammary gland of ACI rats. J. Steroid Biochem. Mol. Biol., 101, 204–215 [DOI] [PubMed] [Google Scholar]
- 11. Singh S., et al. (2005). Relative imbalances in the expression of estrogen-metabolizing enzymes in the breast tissue of women with breast carcinoma. Oncol. Rep., 14, 1091–1096 [PubMed] [Google Scholar]
- 12. Gaikwad N.W., et al. (2008). The molecular etiology of breast cancer: evidence from biomarkers of risk. Int. J. Cancer, 122, 1949–1957 [DOI] [PMC free article] [PubMed] [Google Scholar]
- 13. Gaikwad N.W., et al. (2009). Urine biomarkers of risk in the molecular etiology of breast cancer. Breast Cancer, 3, 1–8 [DOI] [PMC free article] [PubMed] [Google Scholar]
- 14. Pruthi S., et al. (2012). Evaluation of serum estrogen-DNA adducts as potential biomarkers for breast cancer risk. J. Steroid Biochem. Mol. Biol., 132, 73–79 [DOI] [PMC free article] [PubMed] [Google Scholar]
- 15. Fahey J.W., et al. (1997). Broccoli sprouts: an exceptionally rich source of inducers of enzymes that protect against chemical carcinogens. Proc. Natl Acad. Sci. USA, 94, 10367–10372 [DOI] [PMC free article] [PubMed] [Google Scholar]
- 16. Zhang Y., et al. (1992). A major inducer of anticarcinogenic protective enzymes from broccoli: isolation and elucidation of structure. Proc. Natl Acad. Sci. USA, 89, 2399–2403 [DOI] [PMC free article] [PubMed] [Google Scholar]
- 17. Cornblatt B.S., et al. (2007). Preclinical and clinical evaluation of sulforaphane for chemoprevention in the breast. Carcinogenesis, 28, 1485–1490 [DOI] [PubMed] [Google Scholar]
- 18. Kensler T.W., et al. (2010). Nrf2: friend or foe for chemoprevention? Carcinogenesis, 31, 90–99 [DOI] [PMC free article] [PubMed] [Google Scholar]
- 19. Mitsuishi Y., et al. (2012). The Keap1–Nrf2 system in cancers: stress response and anabolic metabolism. Front. Oncol., 2, 200.10.3389/fonc.2012.00200 [DOI] [PMC free article] [PubMed] [Google Scholar]
- 20. Agyeman S.A., et al. (2012). Transcriptomic and proteomic profiling of KEAP1 disrupted and sulforaphane-treated human breast epithelial cells reveals common expression profiles. Breast Cancer Res. Treat., 132, 175–187 [DOI] [PMC free article] [PubMed] [Google Scholar]
- 21. Kensler T.W., et al. (2013). Keap1-nrf2 signaling: a target for cancer prevention by sulforaphane. Top. Curr. Chem., 329, 163–177 [DOI] [PMC free article] [PubMed] [Google Scholar]
- 22. Cao K., et al. (1998). Covalent binding of catechol estrogens to glutathione catalyzed by horseradish peroxidase. Chem. Res. Toxicol., 11, 917–924 [DOI] [PubMed] [Google Scholar]
- 23. Stack D.E., et al. (1996). Molecular characteristics of catechol estrogen quinones in reactions with deoxyribonucleosides. Chem. Res. Toxicol., 9, 851–859 [DOI] [PubMed] [Google Scholar]
- 24. Li K.M., et al. (2004). Metabolism and DNA binding studies of 4-hydroxyestradiol and estradiol-3,4-quinone in vitro and in female ACI rat mammary gland in vivo . Carcinogenesis, 25, 289–297 [DOI] [PubMed] [Google Scholar]
- 25. Debnath J., et al. (2003). Morphogenesis and oncogenesis of MCF-10A mammary epithelial acini grown in three-dimensional basement membrane cultures. Methods, 30, 256–268 [DOI] [PubMed] [Google Scholar]
- 26. Livak K.J., et al. (2001). Analysis of relative gene expression data using real-time quantitative PCR and the 2(-Delta Delta C(T)) method. Methods, 25, 402–408 [DOI] [PubMed] [Google Scholar]
- 27. Prochaska H.J., et al. (1988). Direct measurement of NAD(P)H:quinone reductase from cells cultured in microtiter wells: a screening assay for anticarcinogenic enzyme inducers. Anal. Biochem., 169, 328–336 [DOI] [PubMed] [Google Scholar]
- 28. Li J.J., et al. (1983). Relative carcinogenic activity of various synthetic and natural estrogens in the Syrian hamster kidney. Cancer Res., 43, 5200–5204 [PubMed] [Google Scholar]
- 29. Liehr J.G., et al. (1986). Carcinogenicity of catechol estrogens in Syrian hamsters. J. Steroid Biochem., 24, 353–356 [DOI] [PubMed] [Google Scholar]
- 30. Li J.J., et al. (1987). Estrogen carcinogenesis in Syrian hamster tissues: role of metabolism. Fed. Proc., 46, 1858–1863 [PubMed] [Google Scholar]
- 31. Newbold R.R., et al. (2000). Induction of uterine adenocarcinoma in CD-1 mice by catechol estrogens. Cancer Res., 60, 235–237 [PubMed] [Google Scholar]
- 32. Chakravarti D., et al. (2001). Evidence that a burst of DNA depurination in SENCAR mouse skin induces error-prone repair and forms mutations in the H-ras gene. Oncogene, 20, 7945–7953 [DOI] [PubMed] [Google Scholar]
- 33. Zhao Z., et al. (2006). Mutagenic activity of 4-hydroxyestradiol, but not 2-hydroxyestradiol, in BB2 rat embryonic cells, and the mutational spectrum of 4-hydroxyestradiol. Chem. Res. Toxicol., 19, 475–479 [DOI] [PubMed] [Google Scholar]
- 34. Bocchinfuso W.P., et al. (1999). A mouse mammary tumor virus-Wnt-1 transgene induces mammary gland hyperplasia and tumorigenesis in mice lacking estrogen receptor-alpha. Cancer Res., 59, 1869–1876 [PubMed] [Google Scholar]
- 35. Santen R., et al. (2009). Estrogen mediation of breast tumor formation involves estrogen receptor-dependent, as well as independent, genotoxic effects. Ann. N. Y. Acad. Sci., 1155, 132–140 [DOI] [PubMed] [Google Scholar]
- 36. Huang Y., et al. (2007). Epithelial to mesenchymal transition in human breast epithelial cells transformed by 17beta-estradiol. Cancer Res., 67, 11147–11157 [DOI] [PubMed] [Google Scholar]
- 37. Russo J., et al. (2011). The role of the basal stem cell of the human breast in normal development and cancer. Adv. Exp. Med. Biol., 720, 121–134 [DOI] [PMC free article] [PubMed] [Google Scholar]
- 38. Lavigne J.A., et al. (2012). The effects of catechol-O-methyltransferase inhibition on estrogen metabolite and oxidative DNA damage levels in estradiol-treated MCF-7 cells. Cancer Res., 61, 7488–7494 [PubMed] [Google Scholar]
- 39. Zahid M., et al. (2007). Inhibition of catechol-O-methyltransferase increases estrogen-DNA adduct formation. Free Radic. Biol. Med., 43, 1534–1540 [DOI] [PMC free article] [PubMed] [Google Scholar]
- 40. Singh S., et al. (2009). NAD(P)H:quinone oxidoreductase 1 Arg139Trp and Pro187Ser polymorphisms imbalance estrogen metabolism towards DNA adduct formation in human mammary epithelial cells. J. Steroid Biochem. Mol. Biol., 117, 56–66 [DOI] [PMC free article] [PubMed] [Google Scholar]
- 41. Yates M.S., et al. (2009). Genetic versus chemoprotective activation of Nrf2 signaling: overlapping yet distinct gene expression profiles between Keap1 knockout and triterpenoid-treated mice. Carcinogenesis, 30, 1024–1031 [DOI] [PMC free article] [PubMed] [Google Scholar]
- 42. Malhotra D., et al. (2010). Global mapping of binding sites for Nrf2 identifies novel targets in cell survival response through ChIP-Seq profiling and network analysis. Nucleic Acids Res., 38, 5718–5734 [DOI] [PMC free article] [PubMed] [Google Scholar]
- 43. Zhang Y. (2012). The molecular basis that unifies the metabolism, cellular uptake and chemopreventive activities of dietary isothiocyanates. Carcinogenesis, 33, 2–9 [DOI] [PMC free article] [PubMed] [Google Scholar]