

Abstract
In this work, we show for the first time that the tangential diffusion component is orientationally coherent at the human cortical surface. Using diffusion magnetic resonance imaging (dMRI), we have succeeded in tracking intracortical fiber pathways running tangentially within the cortex. In contrast with histological methods, which reveal little regarding 3-dimensional organization in the human brain, dMRI delivers additional understanding of the layer dependence of the fiber orientation. A postmortem brain block was measured at very high angular and spatial resolution. The dMRI data had adequate resolution to allow analysis of the fiber orientation within 4 notional cortical laminae. We distinguished a lamina at the cortical surface where diffusion was tangential along the surface, a lamina below the surface where diffusion was mainly radial, an internal lamina covering the Stria of Gennari, where both strong radial and tangential diffusion could be observed, and a deep lamina near the white matter, which also showed mainly radial diffusion with a few tangential compartments. The measurement of the organization of the tangential diffusion component revealed a strong orientational coherence at the cortical surface.
Keywords: crossing-fiber tractography, diffusion tensor imaging, layer 1, Stria of Gennari, visual cortex
Introduction
Structural connectivity in the human cadaver brain has been studied with various histological methods. Injection with lipophilic tracers can trace axons and nerve terminals in postmortem tissue (Godement et al. 1987) and shows local connections within a few millimeters, but is limited by long preparation times of months or even years (Mufson et al. 1990; Burkhalter 1993; Tardif and Clarke 2001). Histological staining techniques may occasionally enable fibers to be followed within a single slice (Cajal 1911; Braitenberg 1962). When some axons have degenerated, connections can be followed for even longer distances by identifying the regions of Wallerian degeneration in each brain slice, but only specimens with suitable lesions can be examined in this way (Mesulam 1979; Miklossy et al. 1991).
Recent experiments with polarized light imaging (PLI) show promise as a means to visualize fiber tracts within the brain (Axer, Amunts, et al. 2011; Axer, Grassel, et al. 2011; Dammers et al. 2012). However, this method depends on correct coregistration of adjacent slices and is therefore very sensitive to possible distortions of the fixed tissue.
These limitations make it difficult to acquire information about the organization of connection pathways within the human brain by purely histological means. Furthermore, since there are considerable differences between human and rodent, or even nonhuman primate, brain (Rakic 2009), it is not sufficient to examine connectivity in animals alone.
Connectivity studies within the human brain at lower spatial resolution, but for a wider range of subjects (in particular living subjects) and over larger distances, became possible with the advent of diffusion magnetic resonance imaging (dMRI; Le Bihan et al. 1988; Turner et al. 1990). These methods quantify the mobility of water molecules within tissue in any given direction and can thus provide some evidence of connectivity within 3-dimensional (3D) volumes, enabling reasonably plausible depiction of fiber tracts connecting different brain regions.
Recently, dMRI was used to model the cerebral fiber pathways in the deep white matter (WM) and showed a locally rectilinear 3D grid corresponding to the 3 principal axes of development (Wedeen et al. 2012). Current dMRI methods normally investigate the paths of cortico-cortical pathways within the WM (e.g. Brauer et al. 2011), pathways between the cortex and subcortical areas (e.g. Behrens et al. 2003), or other WM pathways (e.g. Roebroeck et al. 2008).
Intracortical connectivity has yet to be explored using dMRI because of the limited spatial resolution available at normal MRI magnetic field strengths. It is well known that tangential fibers exist in all cortical areas (Anderson and Martin 2009), typically with greatest density in the 2 bands of Baillarger (1840) in cortical layers IV and V, and in Exner's stripe located in the molecular layer I (Vogt and Vogt 1919). However, it is not easy to assess tissue structure and thus fiber orientation within the cortex because the underlying diffusion is more isotropic than in the WM. Also, gray matter (GM) voxels usually contain many crossing fibers, so that high spatial resolution is of the utmost importance (Hoehn-Berlage et al. 1999; McKinstry et al. 2002; Ronen et al. 2003; Tuch et al. 2003; Jaermann et al. 2008; Yassa et al. 2010). Where fiber orientations have already been demonstrated by dMRI within the cortex (Jaermann et al. 2008; McNab et al. 2009; Heidemann et al. 2010, 2012; Jespersen et al. 2012), they have been mostly interpretable as evidence of radial extensions of myelinated axons emerging from the WM (Vogt and Vogt 1919) and of apical dendrites of pyramidal neurons emerging from the deeper cortical layers toward the cortical surface (Demyanenko et al. 2004).
In contrast to radial fibers, tangential fibers are rarely organized over long distances within the cutting plane of histological sections, so pathways of this type are still poorly understood. Observing tangential pathways within 3D volumes is therefore still the biggest challenge concerning the examination of the organizational structure in the cortex, especially since horizontal connections may constitute a large fraction of the inputs to cortical networks (Stepanyants et al. 2009; Boucsein et al. 2011).
Other studies have also revealed other diffusion directions within the cortex (Wedeen et al. 2004; Anwander et al. 2010; Jespersen et al. 2010; Dyrby et al. 2011; Kleinnijenhuis et al. 2011; Leuze et al. 2011; McNab et al. 2011). In these studies, however, there was no attempt to track fibers within the cortex.
Visualizing possible intracortical pathways with dMRI would complement current histological methods for studying structural connectivity, because it can uniquely allow visualization of extended connectivity in 3 dimensions. Furthermore, it might show intracortical pathways that dMRI studies have so far neglected and reveal the orientational coherence of tangential fiber pathways within the cortex layer by layer.
To explore these novel applications, we have implemented a dMRI protocol with very high spatial and angular resolution, for the study of human cadaver brain blocks including primary visual cortex (V1). This enabled cortical lamina-dependent discrimination of orientational structure, which was compared with anatomical cortical information derived from MRI and histology. The cortical area V1 was selected because this region has prominent tangential fiber pathways in a central lamina, which was defined from cytoarchitectonics as the internal granular layer or layer IV (Brodmann 1909), forming the outer band of Baillarger or Stria of Gennari (Gennari 1782; Fatterpekar et al. 2002; Trampel et al. 2011), and the superficial molecular layer or layer I, forming Exner's stripe (Vogt and Vogt 1919). These features have already received extensive histological study (Rockland and Virga 1989).
The cortical laminae with the strongest tangential diffusion component are then examined for their orientational coherence.
Because our spatial resolution was insufficient to define the 6 layers based on the cytoarchitecture, we segmented the cortex based on the MR contrast into 4 laminae (We use the expression layer for the cytoarchitectonic subdivision and lamina for the MR based subdivision.). Within each lamina, we investigated the differences of diffusion properties, in particular the derived fiber orientations, and performed intracortical tractography to analyze the connectivity structure.
Materials and Methods
Samples and MR Scanning
We analyzed the visual cortex in 3 human cadaver brains (2 female, 1 male, age = 61–70 years). Informed consent was provided for all the donated brains. No neurological pathologies were recorded for any of the brains.
Tissue Fixation and Storage
Within a postmortem time of 24–36 h, 2 of the brain samples were fixed in 10% formalin, and 1 in 4% formalin, for several months. A 1.5 × 1.5 × 1 cm3 block was excised from the primary visual cortex (V1) of each brain. The fixed samples were immersed in phosphate-buffered saline (PBS) for at least 2 weeks before scanning. The samples were stored at room temperature. One percentage of NaN3 was inserted to the PBS to prevent the samples from decaying.
Preparation for MR Scanning
The tissue was inserted into a glass-tube sample holder that was fixed inside the coil with plastic wrap.
Together with the V1 sample, a small block containing a part of the corpus callosum (CC) was inserted beside the visual cortex block, providing a region of known, single, and coherent fiber direction that could be used as a reference for the crossing-fiber model (Fig. 1).
Figure 1.

(Top) The right occipital lobe with a black box marking the excised brain block. (Bottom) The b = 0 s/mm2 image showing a slice of the sample holder containing a piece of the primary visual cortex (V1) and a piece of the CC. The highly myelinated Stria of Gennari (SoG) is clearly visible inside V1. The black box shows a flat region of the cortex that was used for quantitative analysis.
MR Scanning
The samples were scanned on a 9.4-T Avance 400 scanner using a Micro 2.5 imaging probe insert with a maximum gradient strength of 1.5 T/m and a 25-mm inner-diameter birdcage coil. The temperature of the imaging probe was maintained at 25 °C with a Gradient Water Cooling Unit BCU20 (all hardware: Bruker Biospin, Germany).
For the high-angular resolution diffusion-weighted scanning protocol, we used a pulsed gradient spin-echo sequence (Stejskal and Tanner 1965); echo time [TE] = 26 ms, repetition time [TR] = 1660–1800 ms, b = 1466–1821 s/mm2, diffusion time [Δ] = 14.56–14.76 ms, diffusion pulse duration [δ] = 1.6–1.8 ms, gradient strength [G] = 0.75 T/m, 60 directions + 3–7 b = 0 s/mm2 images, 16 averages, spatial resolution 242 μm isotropic, field of view [FOV] = 31 mm2, 7 adjacent slices (thickness 242 µm—no gap). The ranges of parameters given in the sequence protocol represent different values used for different samples (Table 1).
Table 1.
Measurement parameters for the different brain samples
| Subject | PMTa | Fixativeb (%) | TR (ms) | b (s/mm2) | Δ (ms) | δ (ms) | b0c | |
|---|---|---|---|---|---|---|---|---|
| Sample 1 | M, 62 year | 36 h | 4 | 1660 | 1466 | 14.76 | 1.6 | 3 |
| Sample 2 | F, 61 year | 24 h | 10 | 1800 | 1821 | 14.56 | 1.8 | 5 |
| Sample 3 | F, 70 year | 28 h | 10 | 1800 | 1821 | 14.56 | 1.8 | 7 |
aPostmortem time.
bPercentage of formalin.
cNumber of measurements with b = 0s/mm2.
Data Analysis
As an anatomical reference with a good contrast between WM and GM in postmortem brain samples (D’Arceuil et al. 2008; Miller et al. 2011), we computed the mean diffusivity (MD) image from the dMR images. In addition to the nondiffusion-weighted b0 (b = 0 s/mm2) images, these maps were used as background images in the following analysis.
Based on the contrast in the MD image, we defined 4 separate depth-dependent laminae within the cortex (visible in the results section in Fig. 4i,ii). We manually segmented a “superficial lamina” (a) near the cortical surface, an “external lamina” (b) an “internal lamina” (c) in the region of the Stria of Gennari and a “deep lamina” (d) near the GM–WM boundary.
Figure 4.

Streamline fiber tracking based on the fODFs was performed for several ROIs covering distinct laminae within the cortex and for the whole cortex in sample 1. (i–ii) The 4 laminae were distinguished based on the MD image (a—superficial lamina, b—external lamina, c—internal lamina, d—deep lamina). The color bar in (i) represents the MD value and has the units ×10−3 mm2/s. (iii and iv) Fiber tracking restricted to the superficial lamina. The fiber tracts are running tangential within the cortical surface. The viewing angle onto the cortical surface in (iii) is equal as in Figure 3. (iv) Shown are 2 slices out of a stack of 7 slices in order to facilitate visualization of the tangential fiber tracts along the cortical surface. The arrow in (iv) points in the same direction as the arrow in (iii). (v) Fiber tracking restricted to the external lamina. Mainly radial fiber tracts can be observed. (vi) Fiber tracking restricted to the internal lamina. In this region, besides the radial fiber tracts many tangential fiber tracts (arrow) running parallel to the cortical surface can be observed. (vii) Fiber tracking restricted to the deep lamina. Most of the fiber tracts are radial with a few tangential fiber tracts near the WM boundary. Part of the WM was included in the ROI of the deep lamina for better observation of the fiber tracts at the WM boundary. (viii) Fiber tracking restricted to the adjacent WM. Fiber tracts are running tangential to the WM boundary. Same as in (iv) 2 slices out of a stack of 7 slices are shown in order to facilitate the visualization of the tangentiality of the fiber tracts. (ix) Fiber tracking performed in the entire cortex. Within the internal lamina, a few tangentially running fiber tracts (arrow) can be observed. Less tangential fiber tracts in the internal lamina can be observed compared with (vi) since the same number of fiber tracts are computed within a much larger volume and the minimum fiber length for tracking was different. At the cortical surface fiber tracts are running orthogonal to the image plane and tangential to the cortical surface. For a 3D view of the fiber tracts view see online verison of Figure 4. The 3D model was integrated in the PDF of the online version using SimLab Composer (SimLab Soft., Amman, Jordan) and requires the use of a compatible PDF reader (e.g. Adobe Reader 9). Click in the figure to activate the 3D view. In the 3D view, the different laminae are color coded: blue—superficial lamina, green—external lamina, yellow—internal lamina, orange—deep lamina, red—whole cortex, purple—WM.
The boundaries of the internal lamina were drawn on the basis of the MD image that shows the following MD values: WM ∼0.3 × 10⁻³ mm²/s, deep lamina ∼0.8 × 10⁻³ mm²/s, internal lamina ∼0.6 × 10⁻³ mm²/s, superficial lamina ∼1 × 10⁻³ mm²/s. Due to the higher myelin density within the Stria of Gennari, this internal lamina appeared much darker on the images compared with the surrounding cortex. The superficial lamina was defined by its proximity to the cortical surface (∼10% of cortical thickness).
In the current study, we named the respective cortical laminae in relation to their visibility in the MR images, and not by the established nomenclature of Brodmann for the cortical layers based on histological findings (Brodmann 1909). If we compare these layers with the segmentation employed in this study, we find a rough correspondence of the cytoarchitectonic layer I to the superficial lamina containing Exner's stripe; layers II and III to the external lamina; layer IV, which also contains the Stria of Gennari, to the internal lamina; and layers V and VI to the deep lamina. This ad hoc procedure was adopted because the spatial resolution of the data did not enable a precise distinction of the 6 cortical layers.
To assess the complex fiber structure within each voxel of the cortex, we computed the fiber orientation distribution function (fODF; Tournier et al. 2007) from the dMRI data. This method allows the estimation of multiple fiber directions within a given voxel and can achieve a good agreement with histological data even in regions with multidirectional crossing-fiber architectures (Leergaard et al. 2010). The fODF is computed with reference to the signal acquired in a region containing only a single-fiber population per voxel which was chosen in the CC sample. Calculation and visualization of the fODF was done using the spherical deconvolution method implemented in the MRTrix package (http://www.brain.org.au/software/mrtrix; Tournier et al. 2012). The maximum harmonic for spherical deconvolution was 8. Fiber tracking was performed using the streamline tracking algorithm of the MRTrix package with standard parameters. These streamline fiber tracts, from now on only called “fiber tracts,” were calculated for 5 regions of interest (ROIs), 1 covering the whole GM (minimum fiber length 10 voxels) and 4 separate ones covering the separate depth-dependent laminae (minimum fiber length 3 voxel). This should enable better visualization of the differences between fiber pathways among the different laminae defined inside the cortex. The randomly distributed seed points and the mask were both covering all the voxels of these ROIs. Besides the mask, there were no other stopping criteria for the fiber tracts. A total of 1000 fiber tracts were computed for the given region. For the minimum curvature radius, the default value of 0 (no restriction) was used for the streamline fiber tracking algorithm.
Additionally, streamline fiber tracking was performed for sample 2 with the internal lamina as the seed region, the entire cortex as the tracking mask, minimum fiber length 3, number of fiber tracts 1000, and the resulting image was overlaid on a histological polarized light image.
Visualization of the fiber tracts was done with the software fibernavigator (http://fibernavigator.googlecode.com).
To investigate the orientational organization within the superficial lamina and the internal lamina, where according to histology most of the tangential connections can be found, we calculated the ordering of the tangential fiber directions in both laminae. The order parameter (OP) computes the degree of alignment of fiber orientations within a given region and is computed from the angular difference of the fiber orientations with respect to the mean direction within a selected region. As used in liquid crystal research (Tsvetkov 1942), this parameter was calculated as
 |
where θ is the angle between the fODF peak direction and the mean direction. The OP is equal to 1 if all peak directions are perfectly aligned and 0 if they are randomly distributed. Thus, the OP is a regional measure that describes the relation of directions across voxels and is not a voxel-based measure characterizing individual voxels.
Based on the MD image, we drew ROIs manually containing 176 ± 25 voxels (mean ± standard deviation) within the superficial lamina and the internal lamina of each subject. Relatively flat regions within the cortex were chosen in order to facilitate unambiguous determination of the fiber direction. The directions of the largest peaks of the fODFs were computed for each voxel by discretizing the spherical harmonic functions on a fine grid of 10 242 nodes. The local maxima on this discrete grid were selected as peak directions of the fODF (Riffert et al. 2012).
In the internal lamina, we selected the directions of the 2 largest fODF peaks. The mean direction and the OP were then calculated for the direction that is more tangential (defined by the angle between the fODF peak and surface normal). In the superficial lamina, where both the primary and secondary fODF peaks were mainly tangential, the primary peak was chosen for the calculation of the mean direction and OP. If the secondary peak had a smaller angle with the mean direction, the secondary peak was chosen for the calculation of the OP instead.
For computation of smooth surface normals, the segmented data were interpolated by a factor of 2 and signed distance functions (φ) were computed for both WM–GM boundary (ФWM) and pial surface (ФPBS) using the MIPAV software (McAuliffe et al. 2001). A voxel-wise approximation of the surface normal was obtained by computing the gradient direction for each voxel within a scalar field derived by a combination of these distance functions (ФWM–ФPBS).
The mean direction and OP were also calculated for a control region with a size of 175 voxels outside the sample, but inside the PBS.
First, the mean direction and the OP inside the control region were calculated for the unordered case where only the primary fODF peak was considered for OP calculation. This was done in order to ensure random fODF peak distribution inside the PBS.
Secondly, the mean direction and the OP inside the control region were calculated for the ordered case. Similar to the superficial lamina, the mean direction was first calculated for the primary fODF peak. If the secondary fODF peak had a smaller angle with the mean direction, the secondary fODF peak was chosen for the calculation of the OP instead.
Finally, the distribution of angles between the fODF peaks and the mean orientation were examined in both laminae and compared with the ordered control region. The difference between the distributions was tested for significance with a Wilcoxon rank-sum test.
Histology
After MR scanning, we performed histology on 2 of the brain samples in order to compare the fiber orientation from the diffusion experiment with respect to the in-plane histological information. Sectioning was performed on a HM 650 V vibratome (Thermo Scientific, Walldorf, Germany).
Histological Stains
Two 50-µm thick histological sections of the examined brains were stained for myelin basic protein [rat monoclonal antibody, avidin-biotin-peroxidase complex method, chromogen: diaminobenzidine tetrahydrochloride hydrate and ammonium nickel(II) sulfate (C)] and examined under an Axio Imager M1 light microscope (Zeiss, Jena, Germany) with a ×5 objective.
Furthermore, 2 sections of the primary visual cortex of a different brain were stained for myelin (Gallyas 1979) and cell bodies (Merker 1983) and examined under the same microscope for general comparison of the underlying tissue structure.
Polarized Light Imaging
A 150-µm thick section of the primary visual cortex of the brain that contained sample 1 was fixed with AquatexTM (Merck Chemicals, Darmstadt, Germany). Additionally, a tangential section along the cortical surface (cutting plane indicated in the results section by arrow in Fig. 5iv, cutting thickness = 200 µm) was prepared with the same method. The effects of birefringence were studied under a Leica DM IRB inverted microscope (Leica Microsystems, Wetzlar, Germany) with a ×2.5 (Fig. 5v) and × 4 (Fig. 5iv) objective and equipped with a CRI PolScope (Cambridge Research, Worcester, MA, United States of America) for PLI (Axer et al. 2001).
Figure 5.

(i–iii) A myelin-stained section in the primary visual cortex of the brain of sample 1 (a—superficial lamina, b—external lamina, c—internal lamina, d—deep lamina). (i–iii) show magnified subregions indicated by the red boxes in the small subfigure at the bottom. Myelinated fibers are extending radially from the WM into the cortex up to the external lamina. Within the cortex, they are crossed by tangentially running fibers with most of the tangentially running myelinated fibers within the Stria of Gennari in the internal lamina (arrow). Within the superficial lamina, myelinated fibers are running horizontally (arrow) along the cortical surface in Exner's stripe. (iv) A polarized light microscopy image of a section within V1 from sample 1. Radial fibers are predominant throughout the deep lamina up to the external lamina. Within the internal lamina, the radial anisotropy of the tissue is decreased (c) due to a large number of tangential crossings. The strong coherence of parallel fibers in the superficial lamina, corresponding to Exner's stripe, can also clearly be observed. The 2D color circle indicates the measured in-plane tissue directions. The color intensity relates to the level of birefringence. (v) A tangential cut along layer 1 (schematic cutting plane indicated by arrow in (iv)) of the brain of sample 2. Large regions of strong fiber coherence can be observed within layer 1. (vi) A Gallyas-stained section showing myelinated axons (left) and the adjacent Merker-stained section marking the cell bodies (right). The cell stain image also shows this radial pattern resulting from the underlying substrate of nerve fibers that are running perpendicular to the cortical surface. The radial pattern is also very strong in the layers II and III (arrow) where not many myelinated axons can be observed. (vii) YFP expression image of the visual cortex (V2) of a mouse. It can be seen how the dendrites extend radially toward layer I where they spread out tangentially along the cortical surface. Reprinted from Demyanenko et al. (2004) with permission from Elsevier.
Additionally, a 50-µm thick section of sample 2 was fixed in AquatexTM and studied with a ×2.5 objective using the same CRI PolScope. The high-spatial resolution and small FOV made it desirable to acquire several images of neighboring areas of the cortex, which were concatenated manually with image editing software. The CRI PolScope always needs a reference region with no birefringence within the FOV. Therefore, the cortex was cut in half in order to be able to measure also the deeper cortical layers.
Results
Diffusion MRI
Figure 2 shows maps of the fODF of all brain samples. The most prominent features are the radial fODF peaks starting at the WM boundary and extending up to the external lamina. In the superficial lamina, the peaks of the fODF are oriented tangentially along the cortical surface. Tangential components of the fODFs can be observed elsewhere in the cortex, mainly in the internal lamina and in parts of the deep lamina near the WM boundary.
Figure 2.
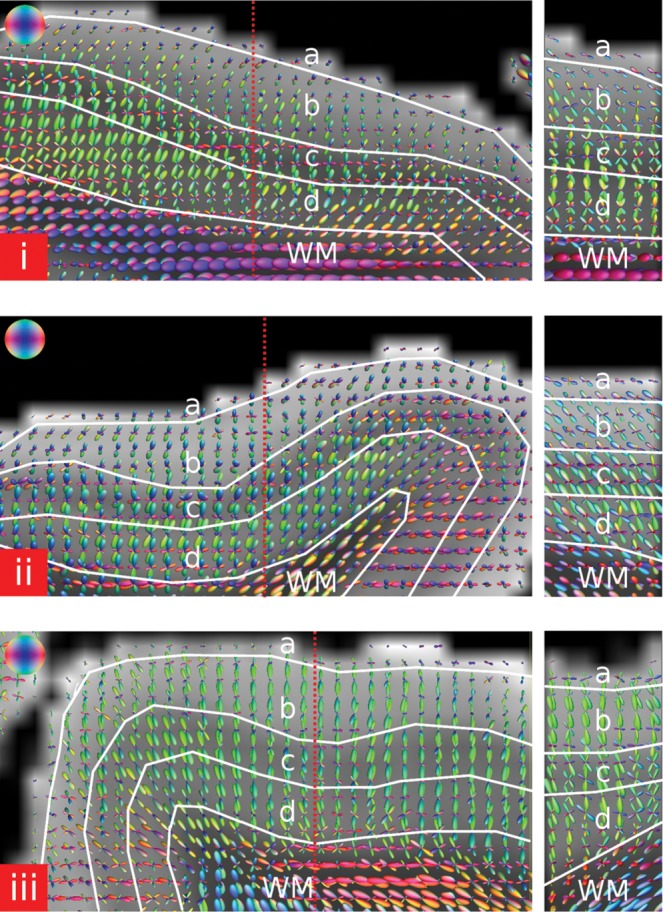
A slice (left) and the corresponding orthogonal slice along the dotted red line (right) showing the fODFs of 3 different brain samples within the primary visual cortex (a–superficial lamina, b—external lamina, c—internal lamina, d—deep lamina). The main direction in the superficial lamina is pointing orthogonal to the slice direction and tangential to the cortical surface. The internal lamina shows strong secondary fODF peaks within many parts of the slice, suggesting more and stronger fiber crossings than in the surrounding regions. Strong secondary peaks can also be observed in the deep lamina near the WM boundary. The colors correspond to the 3D spatial orientation as indicated by the color-coded spheres.
Figure 3 shows the primary fiber direction of the superficial lamina in a top view on the cortical surface. The mean OP for the primary (tangential) fODF peak within the superficial lamina was 0.68 ± 0.19 across all the samples studied, reflecting a highly ordered structure with parallel fODF peaks. The mean OP of the tangential component within the internal lamina was 0.27 ± 0.13. This was comparable with the OP in the ordered control region with a mean of 0.26 ± 0.04.
Figure 3.

The primary fiber direction for 3 brain samples at the cortical surface of the visual cortex and the corresponding mean direction in a top view on the selected region within the brain sample. The arrow in the small image shows the viewing direction on the cortical surface. Orientational coherence could be observed within the superficial laminae of all samples. The strength of the coherence differed between samples. Order Parameters: (i) 0.78, (ii) 0.8, (iii) 0.46.
In the unordered control region, the mean OP was 0.096 ± 0.065 representing the random distribution.
A Wilcoxon rank-sum test for significance between the distribution of angles from the fODF peaks and the corresponding local director showed a significant difference between the superficial lamina and the ordered control region for all 3 samples (P < 10−5).
The same Wilcoxon rank-sum test performed for the internal lamina and the ordered control region showed no significance for sample 1 (P > 0.05) and weak significance for samples 2 and 3 (0.04 < P < 0.05).
Figure 4 shows the different steps of the fiber tracking performed using the fODF data. In the superficial lamina, most fiber tracts are running horizontally along the surface and they are mainly parallel. If the fiber tracking is restricted to the external lamina, the main fiber direction is radial, and almost no tangentially running fiber tracts can be observed. This changes when fiber tracking is performed within the internal lamina. There are also radial fiber tracts, but a striking feature is the high number of tangentially running fiber tracts within that region. In contrast to the superficial lamina, the tangential fiber tracts do not show a strongly ordered structure. In the deep lamina, the fiber tracts are again mainly radial, with a few fiber tracts also running tangentially, especially near the WM boundary.
If the fiber tracking is performed over all regions, the most striking features are the radial fiber tracts extending from the WM into the cortex. However, tangentially running fibers can also be observed in the internal lamina and in the deep lamina near the WM boundary. Additionally, the internal lamina is the region where the fiber tracts are least smooth and where lots of kinks and bends of the fiber tracts can be observed. In the superficial lamina, fiber tracts are again running tangential to the cortical surface orthogonal to the image plane in Figure 4ix. An interactive 3D version of the model of intracortical fibers can be seen in online version of Figure 4. The 3D model was integrated in the portable document format (PDF) of this paper using SimLab Composer (SimLab Soft., Amman, Jordan).
Histology
Figure 5i–iii shows a myelin-stained section within V1 of one of the brain samples. Myelinated fibers can be seen extending from the WM into the cortex. Only tangential fibers can be observed in the superficial lamina (a). A few tangential fibers can be observed throughout all laminae with a higher number of tangential fibers in and adjacent to the strongly myelinated Stria of Gennari in the internal lamina (c) and near the WM boundary.
Figure 5iv shows a PLI image within V1. The colors correspond to the principal directions of the myelinated fibers in each pixel with an angular color coding depicted in the inset. The highest birefringence can be observed in the superficial lamina, showing a very strong tangential anisotropy. The adjacent external lamina is dominated by radial fiber bundles. In the internal lamina, the radial orientation observed in the external lamina is reduced, and the anisotropy appears to be more tangential than the external lamina, as expected from the many crossing fibers observed in the myelin-stained section. The deep lamina again shows mainly a radial fiber direction due to fibers that are extending from the WM radially into the cortex. In the adjacent WM, the fibers run mainly parallel to the GM–WM boundary.
To check the orientational coherence in the superficial lamina observed in the dMRI experiment, a tangential cut along the cortical surface was also checked for its birefringent properties (Fig. 5). Regions with a strong coherence in the fiber direction were observed throughout the section. Figure 5vi,vii shows the general histology within the visual cortex.
Figure 6 shows a comparison of PLI, myelin, and dMRI data of the same slice of sample 2. In the internal lamina, the radiality is again reduced (arrows). This can be explained by the strong tangential fiber component inside that lamina (Fig. 6i). Merging of PLI and myelin-stained image shows that the region with reduced radiality coincides with the Stria of Gennari (blue dots indicated by arrows in Fig. 6ii). Merging the results of dMRI and PLI data shows a good agreement between the different methodologies for both fODF and fiber tracking data (Fig. 6iii,iv).
Figure 6.

(i) A PLI section of sample 2. The blue stripe indicated by the arrows shows the reduced radiality in the Stria of Gennari. The 2D color circle indicates the measured in-plane tissue directions. The color intensity relates to the level of birefringence. (ii) The myelin stain merged with the PL image confirms that the stripe with reduced radiality coincides with the Stria of Gennari (arrows). (iii) The PLI section with an overlay of the fODF of the same area. The arrows indicates fODF peaks with a strong tangential component near the Stria of Gennari. The color coding of the fODF peaks corresponds to the color-coded sphere in Figure 2. (iv) The same PLI section with an overlay of the fiber tracts seeded in the internal lamina. Radial fiber tracts can be observed throughout the whole cortex. Many tangential fiber tracts follow mainly the internal lamina (arrows) where the birefringence in the PL image is decreased.
Discussion
We have shown that diffusion properties vary over cortical laminae and that these variations can be measured with MRI. Furthermore, it was possible to show that the organization of the tissue in the superficial lamina is substantially parallel to the cortical surface, and that within this lamina, the orientations indicated by the primary directions of the fODF are also aligned parallel with each other.
Lamina-wise dMRI also allowed fiber tracking within the cortical laminae. For the first time using dMRI, this allowed fiber pathways running tangentially within the cortex of a human cadaver brain sample to be visualized.
Diffusion anisotropy inside the cortex was first shown in developing animal (Thornton et al. 1997; Baratti et al. 1999; Mori et al. 2001) and human (Maas et al. 2004) brains. In prenatal developmental stage, orientation dependence of water diffusion is still very strong, while it was shown to decrease with maturation (McKinstry et al. 2002; D'Arceuil et al. 2005; Jespersen et al. 2012).
In diffusion tensor studies on adult humans, a strong radial diffusion component inside the cerebral cortex was observed (McNab et al. 2009; Heidemann et al. 2010; Miller et al. 2011) that also allowed fiber tracking into the cortex in animals (D'Arceuil et al. 2008) and humans (Jaermann et al. 2008). By using crossing-fiber approaches, a more complex cortical organization was found. Wedeen et al. (2004) showed that the horizontal component of the probability density function varies within the cortex of an excised mouse brain. Jespersen et al. (2010) showed a variation of a diffusion model parameter that estimates dendrite density (Jespersen et al. 2007) throughout the cortex of fixed mouse brain. In the work of Dyrby et al. (2011), 2 continuous parallel horizontal rims with varying diffusion properties inside the cerebral cortex of a fixed pig brain were observed. Heidemann et al. (2012) showed complex fiber configurations in the cortex using ultra high-field human MRI measurements. Both Leuze et al. (2011) and Kleinnijenhuis et al. (2011) showed variations in the diffusion properties throughout the cortical depth of the fixed human brain.
Diffusion anisotropy inside the cortex is driven by the organization of intracortical nerve fibers. The histological myelin-stained data shows the myelinated axonal component that contributes to diffusion anisotropy. As shown by Jespersen et al. (2007), cortical dendrites can also contribute to diffusion anisotropy, which are not visible in the myelin stains. However, sections stained for cell bodies show a radial pattern for the unstained parts also in the less myelinated upper layers (Fig. 5vi, arrow) providing therefore a “negative” image of the underlying tissue microstructure without restriction to myelinated axons.
PLI in nerve tissue is influenced by the birefringent effect of the orderly aligned lipid bilayers forming the membrane of nerve cells (Wolman 1975). This effect is strongly enhanced for areas with a high myelin content due to the higher number of parallel aligned lipid bilayers in myelinated nerve fibers. But, a high number of unmyelinated dendrites should also provide birefringence if they are anisotropically aligned.
In yellow fluorescent protein (YFP) expression images, a high number of apical dendrites extending radially from layer V to layer I in the visual cortex (V2) of a mouse can be seen in Figure 5vii. At the cortical surface in layer I, these dendrites fan out and run tangentially along the cortical surface. The same behavior can also be observed for dendrites in various other cortical areas (Demyanenko et al. 2004).
The histological data therefore suggests that a large part of the diffusion signal inside the cortex is also driven by dendrites. In particular, the radial anisotropy in the outer lamina and the tangential anisotropy in the superficial lamina cannot be explained solely by myelinated axons.
The high spatial resolution allowed for discrimination of 4 cortical laminae. An even higher spatial resolution might allow probing of more detailed variations between the other layers. However, since a high signal-to-noise ratio (SNR) is essential to probe the differences in tangentiality between the different laminae, this would need an increase in scanning time or application of an accelerated sequence in order to achieve the same SNR.
Previous histological studies have been unable to observe the high ordering in the superficial lamina, mainly due to the difficulty in assessing orientational coherence in 3D using only 2D histological sections, and the limitations of tracer studies in human subjects. However, Figure 5i shows only tangentially running fibers inside the superficial lamina, and Figure 5iv,v shows very high anisotropy in that region. The histological data thus support our dMRI results in the superficial lamina.
Within the internal lamina, the OP was strongly reduced and comparable with the ordered control region. The small difference between samples 2 and 3 and the ordered control region might occur from a difference in the angle distribution of the different populations and is not necessarily a sign of coherence in that region. The OP was measured for a flat piece of the cortex. If the OP has to be measured for a larger piece of the cortex that contains cortical folding, flattening of the direction vectors onto the same plane would have to be performed in order to avoid the effects of folding on the OP. Furthermore in regions where the surface voxels of 2 cortical areas touch due to cortical folding, the fODF peaks inside the superficial lamina may be subject to partial voluming with adjacent tissue.
To ensure that the coherence observed at the cortical surface was not due to partial voluming with the measurement fluid, one sample was measured in fomblin, which has no MRI signal. The high OP (fomblin experiment: OP = 0.7) for the superficial lamina was successfully reproduced, indicating that the results in the superficial lamina are indeed not due to partial volume effects.
The temperature stability of the experiment was ensured by storing the sample for at least 2 weeks at room temperature prior to scanning and by cooling the imaging sample with a water cooling device. A comparison of the MD in PBS and the sample at the beginning and the end of the experiment also showed no significant change in MD and therefore indicates that the temperature remained stable during the experiment. Mechanical stability was ensured by fixing the sample holder with plastic wrap inside the coil, which had also a damping effect on the sample holder. Furthermore, comparison of images at the beginning and the end of the experiment did not show any motion instabilities.
As described in the Materials and Methods section, a piece of the CC was used to compute the spherical deconvolution kernel from measured data with a well-pronounced single-fiber direction. The tissue microstructure such as the axon diameter and the myelination inside the CC may differ from the fiber microstructure inside the cortex. In particular, the lower myelination in the cortex might lead to a lower anisotropy of an optimized deconvolution kernel for the cortex. Our approach of deconvolving with a more anisotropic and sharper kernel computed from the CC results in a less aggressive deconvolution and a conservative approximation of the fODF. This minimizes the risk of false-positive directions.
Alternatively, the issue of finding an appropriate deconvolution kernel could be avoided by the application of an approach that makes no assumptions about the underlying microstructure such as diffusion spectrum imaging (Wedeen et al. 2008).
The long immersion in PBS before the measurement increased the MD of the samples considerably. A similar effect has already been observed for different biological tissue in Han et al. (2000). This allows dMRI also at lower b-values as used in this study.
In Le Bihan et al. (1993) and Clark et al. (2001), no change in the apparent diffusion coefficient was found for diffusion times down to 16 ms, and respectively 8 ms. Therefore, the diffusion times used during the current study are appropriate for probing tissue microstructure. More importantly, a short diffusion time came along with the advantage of a short TE and, therefore, a high SNR. However, if a longer diffusion time at the same SNR could be achieved this might be advantageous for the current study.
Even though immersion in PBS increased the MD considerably, the PLI and myelin-stained sections (Figs 5i–v and 6) show no noticeable changes from the known tissue structure inside the cortex (Fig. 5vi). It can therefore be assumed that the orientational diffusion properties of the PBS samples remained unchanged.
Due to the inherent dMRI fiber tracking problems with finding the correct endings of fibers and false-positive connections (Seehaus et al. 2012), a more detailed comparison with histological and literature findings was performed for all cortical laminae examined in this study.
Superficial Lamina
A finding very consistent with histology, particularly PLI data, is the strong tangential orientation of fiber tracts in the superficial lamina. The functional role of these tangential fibers remains a topic of debate.
In addition to dendritic connections in layer I as observed by Demyanenko et al. (2004) (Fig. 5vii) tangential fibers in the molecular layer I of monkeys were described (Kuypers et al. 1965; Rockland and Virga 1989; Anderson and Martin 2009) as representing projecting fibers from V2 into V1, the so-called “feedback projections.” The limited histological evidence suggests that most axons travel about 1–2mm horizontally within layer I with a few fibers also extending for distances of over 4 mm (Rockland 1994). Near the V1/V2 border, they were even shown to run entirely through GM along the cortical surface in layer I (corresponding to the superficial lamina in the present study). Furthermore, these tangential pathways might correspond to intrastriate connections running tangentially within the cortex. Intrinsic horizontal connections can be found for various cortical layers within V1 (Amir et al. 1993; Gilbert et al. 1996). Confined to layer I horizontal fibers were found in macaque monkeys to spread for “many millimeters,” with some even traversing the V1/V2 border (Coogan and Van Essen 1996). Also, in horseradish peroxidase (HRP) images of squirrel monkeys and macaques (Rockland and Lund 1983), a spread of the HRP along layer I was observed.
The described relatively short lengths are consistent with the interpretation that the fiber tracts observed in Figs 4 and 6 do not describe the pathways of single fibers, but rather the overall direction of fiber pathways in that area.
The fiber tracking data over the whole cortex also showed fiber tracts running parallel to the cortical surface in the superficial lamina that extends from deeper laminae in the cortex. These “L-shaped” fibers running radially through the cortex and making an orthogonal turn close to the surface have also been described for macaque monkeys (Rockland 1994).
External Lamina
The strong radiality in the external lamina may arise from apical dendrites that are running radially from the deeper layer V through the cortex until their terminations in layer I (Peters 1994) and also from feedback connections from V2 to V1 (Rockland 1992). Their axons are traveling below layer VI inside the WM until they make a sharp 90° angle into the GM, where they remain perpendicular till the cortical surface (Rockland 1994). As in all other regions of the cortex, the external lamina also contains a number of fibers running horizontally within the region. Still, according to the results from the dMRI data, these horizontal fiber pathways are much weaker compared with the radial fibers within that region and are hardly visible in the dMRI data.
Internal Lamina
In the internal lamina, the higher number of crossings observed in the fODFs and the higher number of tangential fiber tracts observed in the fiber tracking data resemble the histological data very well. Connections within layer IV, which contains the Stria of Gennari (part of the internal lamina), “spread densely and for long distances within layer IV itself” (Lund et al. 1994). There they cross fibers that travel radially through the cortex into layers III to I. The terminations of the projections from the lateral geniculate nucleus (LGN; Hubel and Wiesel 1972) also lie within the internal lamina and various other afferent connections with their projections are spreading out within that lamina (Lund and Yoshioka 1991).
However, these increased fiber crossings within the internal lamina cannot be observed equally well in all parts of the brain samples studied. As can be seen in Figure 2, the fiber crossing structure in the internal lamina of sample 3 is not as apparent as for the 2 other samples. This might be due to the histology since the myelination in the internal lamina is not entirely homogenous over the whole V1 (Sanides and Vitzthum 1965). The examined piece might therefore be extracted from a part of V1 with little myelin. Another more likely reason is that the increased age of the third subject resulted in general aging and a decrease in myelination of that sample. This might also be the cause for the decrease in coherence in the superficial lamina.
Deep Lamina
The dMRI results in the deep lamina are again very similar to the histological results. In both histological and dMRI data, the predominant direction is radial. From layer V, there are radial projections throughout the whole cortex up to layer I (Lund et al. 1979), while layer VI sends and receives projections to and from the LGN (Lund et al. 1975) and also to layer IV (Lund and Boothe 1975).
Looking at Figures 2i and 4vii in the deep lamina near the WM boundary, bigger tangential fODF peaks and correspondingly more tangential fiber tracts can be seen than in the more superficial part of the deep lamina. In analogy with layer VI, this might be defined by cytoarchitecture. In histology, tangential fibers that spread horizontally within layer VI can also be observed (Blasdel et al. 1985), and there may be an influence from WM fibers near the “fuzzy” GM–WM border.
Additionally there is a vast number of intracortical connections that have not been described in the discussion. An overview can be found in the work from Lund et al. (1994).
Methodological Limitations
To avoid confusing the fiber tracts in Figures 4 and 6 with single nerve fibers (Jones et al. 2012), an explanation of the constraints of the tractography method used should be given.
The only stopping criterion for the streamline fiber tracking was the size of the mask of the ROIs used for tracking. This leads to fiber tracts running over longer distances than the real underlying tissue and therefore to fiber pathways that represent only the overall fiber direction of the underlying tissue rather than real intracortical connections. Similarly, with a minimum length setting for fiber tracts short-distance connections cannot be discovered. Furthermore, as can be seen from the fiber tracts, the method does not allow fiber tracts to split up into different directions as has been demonstrated for many spiny stellate neurons or pyramidal neurons throughout the whole cortex (Rockland 1994). As is known from histology, there are tangential connections throughout all cortical layers. However, in parts where they do not contribute strongly to the tangential diffusion component they remain unnoticed in the fiber tracking results.
Conclusion
The good agreement between dMRI and histological data suggests that this method, within some limits concerning spatial resolution compared with histological data, can provide valuable information about the orientational structure within the visual cortex. Because data are acquired in 3 dimensions in entire tissue blocks, they provide more powerful insights into any possible structured ordering among fiber tracts ex vivo. As regards the primary visual cortex, we observed a highly ordered structure within the superficial lamina, which also allowed us for the first time to follow using dMRI the intracortical fiber pathways that do not pass through the WM.
The functional role of this striking anatomical organization remains poorly understood. The high OP within Exner's stripe may be associated with the high density of feedback projections between V1 and V2, intrastriatal axonal and dendritic connections. Similar studies including adjacent cortical areas such as V1 and V2 may allow the tracking of intracortical fiber pathways between different Brodmann areas that do not enter the WM.
Funding
This study was supported by Max Planck Society (MPG). Funding to pay the Open Access publication charges for this article was provided by the Max Planck Institute for Human Cognitive and Brain Sciences Leipzig.
Notes
The authors thank Prof. Dr Jürgen Haase from the faculty of physics and geosciences at the University of Leipzig for his support and for providing access to the MR scanner, Prof. Dr Josef Käs from the faculty of physics and geosciences at the University of Leipzig for his support and for providing access to the polarized light microscope, Jeff Kershaw from the National Institute of Radiological Sciences Chiba in Japan for proofreading and helpful comments, and Miriam Wähnert, Marcel Weiß and Robert Trampel at the Max Planck Institute for Human Cognitive and Brain Sciences for valuable discussion. Conflict of Interest: None declared.
References
- Amir Y, Harel M, Malach R. Cortical hierarchy reflected in the organization of intrinsic connections in macaque monkey visual cortex. J Comp Neurol. 1993;334:19–46. doi: 10.1002/cne.903340103. doi:10.1002/cne.903340103. [DOI] [PubMed] [Google Scholar]
- Anderson JC, Martin KA. The synaptic connections between cortical areas V1 and V2 in macaque monkey. J Neurosci. 2009;29:11283–11293. doi: 10.1523/JNEUROSCI.5757-08.2009. doi:10.1523/JNEUROSCI.5757-08.2009. [DOI] [PMC free article] [PubMed] [Google Scholar]
- Anwander A, Pampel A, Knösche TR. In vivo measurement of cortical anisotropy by diffusion-weighted imaging correlates with cortex type. 2010 Proceedings of the 18th Annual Meeting of ISMRM; 2010 May 1–7; Stockholm (Sweden). p. 109. [Google Scholar]
- Axer H, Axer M, Krings T, Keyserlingk DG. Quantitative estimation of 3-D fiber course in gross histological sections of the human brain using polarized light. J Neurosci Methods. 2001;105:121–131. doi: 10.1016/s0165-0270(00)00349-6. doi:10.1016/S0165-0270(00)00349-6. [DOI] [PubMed] [Google Scholar]
- Axer M, Amunts K, Grassel D, Palm C, Dammers J, Axer H, Pietrzyk U, Zilles K. A novel approach to the human connectome: ultra-high resolution mapping of fiber tracts in the brain. Neuroimage. 2011;54:1091–1101. doi: 10.1016/j.neuroimage.2010.08.075. doi:10.1016/j.neuroimage.2010.08.075. [DOI] [PubMed] [Google Scholar]
- Axer M, Grassel D, Kleiner M, Dammers J, Dickscheid T, Reckfort J, Hutz T, Eiben B, Pietrzyk U, Zilles K, et al. High-resolution fiber tract reconstruction in the human brain by means of three-dimensional polarized light imaging. Front Neuroinform. 2011;5:34. doi: 10.3389/fninf.2011.00034. [DOI] [PMC free article] [PubMed] [Google Scholar]
- Baillarger J. Recherches sur la structure de la couche corticale des circonvolutions du cerveau. Mem Acad R Med. 1840;8:149–183. [Google Scholar]
- Baratti C, Barnett AS, Pierpaoli C. Comparative MR imaging study of brain maturation in kittens with T1, T2, and the trace of the diffusion tensor. Radiology. 1999;210:133–142. doi: 10.1148/radiology.210.1.r99ja09133. [DOI] [PubMed] [Google Scholar]
- Behrens TE, Johansen-Berg H, Woolrich MW, Smith SM, Wheeler-Kingshott CA, Boulby PA, Barker GJ, Sillery EL, Sheehan K, Ciccarelli O, et al. Non-invasive mapping of connections between human thalamus and cortex using diffusion imaging. Nat Neurosci. 2003;6:750–757. doi: 10.1038/nn1075. doi:10.1038/nn1075. [DOI] [PubMed] [Google Scholar]
- Blasdel GG, Lund JS, Fitzpatrick D. Intrinsic connections of macaque striate cortex: axonal projections of cells outside lamina 4C. J Neurosci. 1985;5:3350–3369. doi: 10.1523/JNEUROSCI.05-12-03350.1985. [DOI] [PMC free article] [PubMed] [Google Scholar]
- Boucsein C, Nawrot MP, Schnepel P, Aertsen A. Beyond the cortical column: abundance and physiology of horizontal connections imply a strong role for inputs from the surround. Front Neurosci. 2011;5:32. doi: 10.3389/fnins.2011.00032. [DOI] [PMC free article] [PubMed] [Google Scholar]
- Braitenberg V. A note on myeloarchitectonics. J Comp Neurol. 1962;118:141–156. doi: 10.1002/cne.901180202. doi:10.1002/cne.901180202. [DOI] [PubMed] [Google Scholar]
- Brauer J, Anwander A, Friederici AD. Neuroanatomical prerequisites for language functions in the maturing brain. Cereb Cortex. 2011;21:459–466. doi: 10.1093/cercor/bhq108. doi:10.1093/cercor/bhq108. [DOI] [PubMed] [Google Scholar]
- Brodmann K. Vergleichende Lokalisationslehre der Grosshirnrinde in ihren Prinzipien dargestellt auf Grund des Zellenbaues. Leipzig: Johann Ambrosius Barth Verlag; 1909. [Google Scholar]
- Burkhalter A. Development of forward and feedback connections between areas V1 and V2 of human visual cortex. Cereb Cortex. 1993;3:476–487. doi: 10.1093/cercor/3.5.476. doi:10.1093/cercor/3.5.476. [DOI] [PubMed] [Google Scholar]
- Cajal SRY. Histologie du système nerveux de l'homme et des vertébrés. Paris: Maloine; 1911. [Google Scholar]
- Clark CA, Hedehus M, Moseley ME. Diffusion time dependence of the apparent diffusion tensor in healthy human brain and white matter disease. Magn Reson Med. 2001;45:1126–1129. doi: 10.1002/mrm.1149. doi:10.1002/mrm.1149. [DOI] [PubMed] [Google Scholar]
- Coogan TA, Van Essen DC. Development of connections within and between areas V1 and V2 of macaque monkeys. J Comp Neurol. 1996;372:327–342. doi: 10.1002/(SICI)1096-9861(19960826)372:3<327::AID-CNE1>3.0.CO;2-4. doi:10.1002/(SICI)1096-9861(19960826)372:3<327::AID-CNE1>3.0.CO;2-4. [DOI] [PubMed] [Google Scholar]
- Dammers J, Breuer L, Axer M, Kleiner M, Eiben B, Grassel D, Dickscheid T, Zilles K, Amunts K, Shah NJ, et al. Automatic identification of gray and white matter components in polarized light imaging. Neuroimage. 2012;59:1338–47. doi: 10.1016/j.neuroimage.2011.08.030. doi:10.1016/j.neuroimage.2011.08.030. [DOI] [PubMed] [Google Scholar]
- D'Arceuil H, Liu C, Levitt P, Thompson B, Kosofsky B, de Crespigny A. Three-dimensional high-resolution diffusion tensor imaging and tractography of the developing rabbit brain. Dev Neurosci. 2008;30:262–275. doi: 10.1159/000110503. doi:10.1159/000110503. [DOI] [PubMed] [Google Scholar]
- D'Arceuil HE, Hotakainen MP, Liu C, Themelis G, de Crespigny AJ, Franceschini MA. Near-infrared frequency-domain optical spectroscopy and magnetic resonance imaging: a combined approach to studying cerebral maturation in neonatal rabbits. J Biomed Opt. 2005;10:11011. doi: 10.1117/1.1852554. doi:10.1117/1.1852554. [DOI] [PMC free article] [PubMed] [Google Scholar]
- Demyanenko GP, Schachner M, Anton E, Schmid R, Feng G, Sanes J, Maness PF. Close homolog of L1 modulates area-specific neuronal positioning and dendrite orientation in the cerebral cortex. Neuron. 2004;44:423–437. doi: 10.1016/j.neuron.2004.10.016. doi:10.1016/j.neuron.2004.10.016. [DOI] [PubMed] [Google Scholar]
- Dyrby TB, Baare WF, Alexander DC, Jelsing J, Garde E, Sogaard LV. An ex vivo imaging pipeline for producing high-quality and high-resolution diffusion-weighted imaging datasets. Hum Brain Mapp. 2011;32:544–563. doi: 10.1002/hbm.21043. doi:10.1002/hbm.21043. [DOI] [PMC free article] [PubMed] [Google Scholar]
- Fatterpekar GM, Naidich TP, Delman BN, Aguinaldo JG, Gultekin SH, Sherwood CC, Hof PR, Drayer BP, Fayad ZA. Cytoarchitecture of the human cerebral cortex: MR microscopy of excised specimens at 9.4 Tesla. AJNR Am J Neuroradiol. 2002;23:1313–1321. [PMC free article] [PubMed] [Google Scholar]
- Gallyas F. Silver staining of myelin by means of physical development. Neurol Res. 1979;1:203–209. doi: 10.1080/01616412.1979.11739553. [DOI] [PubMed] [Google Scholar]
- Gennari F. De peculiari structura cerebri nonnulisque ejus morbis. Parma, Italy: Ex Regio; 1782. [Google Scholar]
- Gilbert CD, Das A, Ito M, Kapadia M, Westheimer G. Spatial integration and cortical dynamics. Proc Natl Acad Sci USA. 1996;93:615–622. doi: 10.1073/pnas.93.2.615. doi:10.1073/pnas.93.2.615. [DOI] [PMC free article] [PubMed] [Google Scholar]
- Godement P, Vanselow J, Thanos S, Bonhoeffer F. A study in developing visual systems with a new method of staining neurones and their processes in fixed tissue. Development. 1987;101:697–713. doi: 10.1242/dev.101.4.697. [DOI] [PubMed] [Google Scholar]
- Han S, Gemmell SJ, Helmer KG, Grigg P, Wellen JW, Hoffman AH, Sotak CH. Changes in ADC caused by tensile loading of rabbit Achilles tendon: evidence for water transport. J Magn Reson. 2000;144:217–227. doi: 10.1006/jmre.2000.2075. doi:10.1006/jmre.2000.2075. [DOI] [PubMed] [Google Scholar]
- Heidemann RM, Anwander A, Feiweier T, Knösche TR, Turner R. k-space and q-space: combining ultra-high spatial and angular resolution in diffusion imaging using ZOOPPA at 7 T. Neuroimage. 2012;60:967–978. doi: 10.1016/j.neuroimage.2011.12.081. doi:10.1016/j.neuroimage.2011.12.081. [DOI] [PubMed] [Google Scholar]
- Heidemann RM, Porter DA, Anwander A, Feiweier T, Heberlein K, Knösche TR, Turner R. Diffusion imaging in humans at 7T using readout-segmented EPI and GRAPPA. Magn Reson Med. 2010;64:9–14. doi: 10.1002/mrm.22480. doi:10.1002/mrm.22480. [DOI] [PubMed] [Google Scholar]
- Hoehn-Berlage M, Eis M, Schmitz B. Regional and directional anisotropy of apparent diffusion coefficient in rat brain. NMR Biomed. 1999;12:45–50. doi: 10.1002/(sici)1099-1492(199902)12:1<45::aid-nbm545>3.0.co;2-6. doi:10.1002/(SICI)1099-1492(199902)12:1<45::AID-NBM545>3.0.CO;2-6. [DOI] [PubMed] [Google Scholar]
- Hubel DH, Wiesel TN. Laminar and columnar distribution of geniculo-cortical fibers in the macaque monkey. J Comp Neurol. 1972;146:421–450. doi: 10.1002/cne.901460402. doi:10.1002/cne.901460402. [DOI] [PubMed] [Google Scholar]
- Jaermann T, De Zanche N, Staempfli P, Pruessmann KP, Valavanis A, Boesiger P, Kollias SS. Preliminary experience with visualization of intracortical fibers by focused high-resolution diffusion tensor imaging. AJNR Am J Neuroradiol. 2008;29:146–150. doi: 10.3174/ajnr.A0742. doi:10.3174/ajnr.A0742. [DOI] [PMC free article] [PubMed] [Google Scholar]
- Jespersen SN, Bjarkam CR, Nyengaard JR, Chakravarty MM, Hansen B, Vosegaard T, Ostergaard L, Yablonskiy D, Nielsen NC, Vestergaard-Poulsen P. Neurite density from magnetic resonance diffusion measurements at ultrahigh field: comparison with light microscopy and electron microscopy. Neuroimage. 2010;49:205–216. doi: 10.1016/j.neuroimage.2009.08.053. doi:10.1016/j.neuroimage.2009.08.053. [DOI] [PMC free article] [PubMed] [Google Scholar]
- Jespersen SN, Kroenke CD, Ostergaard L, Ackerman JJ, Yablonskiy DA. Modeling dendrite density from magnetic resonance diffusion measurements. Neuroimage. 2007;34:1473–1486. doi: 10.1016/j.neuroimage.2006.10.037. doi:10.1016/j.neuroimage.2006.10.037. [DOI] [PubMed] [Google Scholar]
- Jespersen SN, Leigland LA, Cornea A, Kroenke CD. Determination of axonal and dendritic orientation distributions within the developing cerebral cortex by diffusion tensor imaging. IEEE Trans Med Imaging. 2012;31:16–32. doi: 10.1109/TMI.2011.2162099. doi:10.1109/TMI.2011.2162099. [DOI] [PMC free article] [PubMed] [Google Scholar]
- Jones DK, Knösche TR, Turner R. White matter integrity, fiber count, and other fallacies: the do's and don'ts of diffusion MRI. Neuroimage. 2012 doi: 10.1016/j.neuroimage.2012.06.081. doi:10.1016/j.neuroimage.2012.06.081. [DOI] [PubMed] [Google Scholar]
- Kleinnijenhuis M, Sikma KJ, Barth M, Dederen P, Zerbi V, Küsters B, Ruiter D, Slump CH, van Cappellen van Walsum A-M. Validation of diffusion weighted imaging of cortical anisotropy by means of a histological stain for myelin. Proceedings of the 19th Annual Meeting of ISMRM; 2011 May 7–13; Montreal (Canada). p. 2085. 2011 [Google Scholar]
- Kuypers HG, Szwarcbart MK, Mishkin M, Rosvold HE. Occipitotemporal corticocortical connections in the rhesus monkey. Exp Neurol. 1965;11:245–262. doi: 10.1016/0014-4886(65)90016-6. doi:10.1016/0014-4886(65)90016-6. [DOI] [PubMed] [Google Scholar]
- Le Bihan D, Breton E, Lallemand D, Aubin ML, Vignaud J, Laval-Jeantet M. Separation of diffusion and perfusion in intravoxel incoherent motion MR imaging. Radiology. 1988;168:497–505. doi: 10.1148/radiology.168.2.3393671. [DOI] [PubMed] [Google Scholar]
- Le Bihan D, Turner R, Douek P. Is water diffusion restricted in human brain white matter? An echo-planar NMR imaging study. Neuroreport. 1993;4:887–890. doi: 10.1097/00001756-199307000-00012. doi:10.1097/00001756-199307000-00012. [DOI] [PubMed] [Google Scholar]
- Leergaard TB, White NS, de Crespigny A, Bolstad I, D'Arceuil H, Bjaalie JG, Dale AM. Quantitative histological validation of diffusion MRI fiber orientation distributions in the rat brain. PloS One. 2010;5:e8595. doi: 10.1371/journal.pone.0008595. doi:10.1371/journal.pone.0008595. [DOI] [PMC free article] [PubMed] [Google Scholar]
- Leuze C, Dhital B, Anwander A, Pampel A, Heidemann RM, Reimann K, Geyer S, Gratz M, Turner R. Visualization of the orientational structure of the human stria of Gennari with high-resolution DWI. Proceedings of the 19th Annual Meeting of ISMRM; 2011 May 7–13; Montreal (Canada). p. 2371. 2011 [Google Scholar]
- Lund JS, Boothe R. Interlaminar connections and pyramidal neuron organization in the visual cortex, area 17, of the macaque monkey. J Comp Neurol. 1975;159:305–34. doi:10.1002/cne.901590303. [Google Scholar]
- Lund JS, Henry GH, MacQueen CL, Harvey AR. Anatomical organization of the primary visual cortex (area 17) of the cat. A comparison with area 17 of the macaque monkey. J Comp Neurol. 1979;184:599–618. doi: 10.1002/cne.901840402. doi:10.1002/cne.901840402. [DOI] [PubMed] [Google Scholar]
- Lund JS, Lund RD, Hendrickson AE, Bunt AH, Fuchs AF. The origin of efferent pathways from the primary visual cortex, area 17, of the macaque monkey as shown by retrograde transport of horseradish peroxidase. J Comp Neurol. 1975;164:287–303. doi: 10.1002/cne.901640303. doi:10.1002/cne.901640303. [DOI] [PubMed] [Google Scholar]
- Lund JS, Takahashi Y, Levitt JB. Primary visual cortex in primates. New York: Plenum Press; 1994. [Google Scholar]
- Lund JS, Yoshioka T. Local circuit neurons of macaque monkey striate cortex: III. Neurons of laminae 4B, 4A, and 3B. J Comp Neurol. 1991;311:234–258. doi: 10.1002/cne.903110206. doi:10.1002/cne.903110206. [DOI] [PubMed] [Google Scholar]
- Maas LC, Mukherjee P, Carballido-Gamio J, Veeraraghavan S, Miller SP, Partridge SC, Henry RG, Barkovich AJ, Vigneron DB. Early laminar organization of the human cerebrum demonstrated with diffusion tensor imaging in extremely premature infants. Neuroimage. 2004;22:1134–1140. doi: 10.1016/j.neuroimage.2004.02.035. doi:10.1016/j.neuroimage.2004.02.035. [DOI] [PubMed] [Google Scholar]
- McAuliffe MJ, Lalonde FM, McGarry D, Gandler W, Csaky K, Trus BL. Medical image processing, analysis and visualization in clinical research. Proceedings of the 14th IEEE Symposium on Computer-Based Medical Systems; 2001 July 26–27; Washington DC (USA) 2001:381–386. [Google Scholar]
- McKinstry RC, Mathur A, Miller JH, Ozcan A, Snyder AZ, Schefft GL, Almli CR, Shiran SI, Conturo TE, Neil JJ. Radial organization of developing preterm human cerebral cortex revealed by non-invasive water diffusion anisotropy MRI. Cereb Cortex. 2002;12:1237–1243. doi: 10.1093/cercor/12.12.1237. doi:10.1093/cercor/12.12.1237. [DOI] [PubMed] [Google Scholar]
- McNab JA, Jbabdi S, Deoni SC, Douaud G, Behrens TE, Miller KL. High resolution diffusion-weighted imaging in fixed human brain using diffusion-weighted steady state free precession. Neuroimage. 2009;46:775–785. doi: 10.1016/j.neuroimage.2009.01.008. doi:10.1016/j.neuroimage.2009.01.008. [DOI] [PubMed] [Google Scholar]
- McNab JA, Polimeni JR, Wald LL. Surface based analysis of diffusion orientation for identifying architectonic domains in the in vivo human cortex. Proceedings of the 19th Annual Meeting of ISMRM; 2011 May 7–13; Montreal (Canada) 2011:412. [Google Scholar]
- Merker B. Silver staining of cell bodies by means of physical development. J Neurosci Methods. 1983;9:235–241. doi: 10.1016/0165-0270(83)90086-9. doi:10.1016/0165-0270(83)90086-9. [DOI] [PubMed] [Google Scholar]
- Mesulam MM. Tracing neural connections of human-brain with selective silver impregnation – observations on geniculocalcarine, spinothalamic, and entorhinal pathways. Arch Neurol. 1979;36:814–818. doi: 10.1001/archneur.1979.00500490028004. doi:10.1001/archneur.1979.00500490028004. [DOI] [PubMed] [Google Scholar]
- Miklossy J, Clarke S, Vanderloos H. The long-distance effects of brain-lesions – visualization of axonal pathways and their terminations in the human brain by the nauta method. J Neuropathol Exp Neurol. 1991;50:595–614. doi:10.1097/00005072-199109000-00006. [PubMed] [Google Scholar]
- Miller KL, Stagg CJ, Douaud G, Jbabdi S, Smith SM, Behrens TE, Jenkinson M, Chance SA, Esiri MM, Voets NL, et al. Diffusion imaging of whole, post-mortem human brains on a clinical MRI scanner. Neuroimage. 2011;57:167–181. doi: 10.1016/j.neuroimage.2011.03.070. doi:10.1016/j.neuroimage.2011.03.070. [DOI] [PMC free article] [PubMed] [Google Scholar]
- Mori S, Itoh R, Zhang J, Kaufmann WE, van Zijl PC, Solaiyappan M, Yarowsky P. Diffusion tensor imaging of the developing mouse brain. Magn Reson Med. 2001;46:18–23. doi: 10.1002/mrm.1155. doi:10.1002/mrm.1155. [DOI] [PubMed] [Google Scholar]
- Mufson EJ, Brady DR, Kordower JH. Tracing neuronal connections in postmortem human hippocampal complex with the carbocyanine dye DiI. Neurobiol Aging. 1990;11:649–653. doi: 10.1016/0197-4580(90)90031-t. doi:10.1016/0197-4580(90)90031-T. [DOI] [PubMed] [Google Scholar]
- Peters A. Primary visual cortex in primates. New York: Plenum Press; 1994. [Google Scholar]
- Rakic P. Evolution of the neocortex: a perspective from developmental biology. Nat Rev Neurosci. 2009;10:724–735. doi: 10.1038/nrn2719. doi:10.1038/nrn2719. [DOI] [PMC free article] [PubMed] [Google Scholar]
- Riffert TW, Knösche TR, Anwander A. Quantification of fiber bundle properties using a decomposition of the fiber orientation distribution function. Proceedings of the 20th Annual Meeting of ISMRM; 2012 May 5–11; Melbourne (Australia). p. 3592. 2012 [Google Scholar]
- Rockland KS. Laminar distribution of neurons projecting from area V1 to V2 in macaque and squirrel monkeys. Cereb Cortex. 1992;2:38–47. doi: 10.1093/cercor/2.1.38. doi:10.1093/cercor/2.1.38. [DOI] [PubMed] [Google Scholar]
- Rockland KS. Primary visual cortex in primates. New York: Plenum Press; 1994. [Google Scholar]
- Rockland KS, Lund JS. Intrinsic laminar lattice connections in primate visual cortex. J Comp Neurol. 1983;216:303–318. doi: 10.1002/cne.902160307. doi:10.1002/cne.902160307. [DOI] [PubMed] [Google Scholar]
- Rockland KS, Virga A. Terminal arbors of individual “feedback” axons projecting from area V2 to V1 in the macaque monkey: a study using immunohistochemistry of anterogradely transported Phaseolus vulgaris-leucoagglutinin. J Comp Neurol. 1989;285:54–72. doi: 10.1002/cne.902850106. doi:10.1002/cne.902850106. [DOI] [PubMed] [Google Scholar]
- Roebroeck A, Galuske R, Formisano E, Chiry O, Bratzke H, Ronen I, Kim DS, Goebel R. High-resolution diffusion tensor imaging and tractography of the human optic chiasm at 9.4 T. Neuroimage. 2008;39:157–168. doi: 10.1016/j.neuroimage.2007.08.015. doi:10.1016/j.neuroimage.2007.08.015. [DOI] [PubMed] [Google Scholar]
- Ronen I, Kim KH, Garwood M, Ugurbil K, Kim DS. Conventional DTI vs. slow and fast diffusion tensors in cat visual cortex. Magn Reson Med. 2003;49:785–790. doi: 10.1002/mrm.10431. doi:10.1002/mrm.10431. [DOI] [PubMed] [Google Scholar]
- Sanides F, Vitzthum HG. Zur Architektonik der menschlichen Sehrinde und den Prinzipien ihrer Entwicklung. Dtsch Z Nervenheilkd. 1965;187:680–707. [Google Scholar]
- Seehaus AK, Roebroeck A, Chiry O, Kim DS, Ronen I, Bratzke H, Goebel R, Galuske RA. Histological validation of DW-MRI tractography in human postmortem tissue. Cereb Cortex. 2013;23:442–450. doi: 10.1093/cercor/bhs036. [DOI] [PMC free article] [PubMed] [Google Scholar]
- Stejskal EO, Tanner JE. Spin diffusion measurements: spin echoes in the presence of a time-dependent field gradient. J Chem Phys. 1965;42:288–292. doi:10.1063/1.1695690. [Google Scholar]
- Stepanyants A, Martinez LM, Ferecsko AS, Kisvarday ZF. The fractions of short- and long-range connections in the visual cortex. Proc Natl Acad Sci USA. 2009;106:3555–3560. doi: 10.1073/pnas.0810390106. doi:10.1073/pnas.0810390106. [DOI] [PMC free article] [PubMed] [Google Scholar]
- Tardif E, Clarke S. Intrinsic connectivity of human auditory areas: a tracing study with DiI. Eur J Neurosci. 2001;13:1045–1050. doi: 10.1046/j.0953-816x.2001.01456.x. doi:10.1046/j.0953-816x.2001.01456.x. [DOI] [PubMed] [Google Scholar]
- Thornton JS, Ordidge RJ, Penrice J, Cady EB, Amess PN, Punwani S, Clemence M, Wyatt JS. Anisotropic water diffusion in white and gray matter of the neonatal piglet brain before and after transient hypoxia-ischaemia. Mag Reson Imag. 1997;15:433–440. doi: 10.1016/s0730-725x(96)00378-5. doi:10.1016/S0730-725X(96)00378-5. [DOI] [PubMed] [Google Scholar]
- Tournier JD, Calamante F, Connelly A. MRtrix: diffusion tractography in crossing fiber regions. Int J Imag Syst Tech. 2012;22:53–66. doi:10.1002/ima.22005. [Google Scholar]
- Tournier JD, Calamante F, Connelly A. Robust determination of the fibre orientation distribution in diffusion MRI: non-negativity constrained super-resolved spherical deconvolution. Neuroimage. 2007;35:1459–1472. doi: 10.1016/j.neuroimage.2007.02.016. doi:10.1016/j.neuroimage.2007.02.016. [DOI] [PubMed] [Google Scholar]
- Trampel R, Ott D, Turner R. Do the congenitally blind have a stria of Gennari? First intracortical insights in vivo. Cereb Cortex. 2011;21:2075–2081. doi: 10.1093/cercor/bhq282. doi:10.1093/cercor/bhq282. [DOI] [PubMed] [Google Scholar]
- Tsvetkov VN. Acta Physicochim. URSS. 1942;16:132. [Google Scholar]
- Tuch DS, Reese TG, Wiegell MR, Wedeen VJ. Diffusion MRI of complex neural architecture. Neuron. 2003;40:885–895. doi: 10.1016/s0896-6273(03)00758-x. doi:10.1016/S0896-6273(03)00758-X. [DOI] [PubMed] [Google Scholar]
- Turner R, Le Bihan D, Maier J, Vavrek R, Hedges LK, Pekar J. Echo-planar imaging of intravoxel incoherent motion. Radiology. 1990;177:407–414. doi: 10.1148/radiology.177.2.2217777. [DOI] [PubMed] [Google Scholar]
- Vogt C, Vogt O. Allgemeinere Ergebnisse unserer Hirnforschung. J Psychol Neurol. 1919;25:1–189. [Google Scholar]
- Wedeen VJ, Rosene DL, Wang R, Dai G, Mortazavi F, Hagmann P, Kaas JH, Tseng WY. The geometric structure of the brain fiber pathways. Science. 2012;335:1628–1634. doi: 10.1126/science.1215280. doi:10.1126/science.1215280. [DOI] [PMC free article] [PubMed] [Google Scholar]
- Wedeen VJ, Song S, Wald L, Reese TG, Benner T, Tseng WY. Diffusion spectrum MRI of cortical architectonics: visualization of cortical layers and segmentation of cortical areas by analysis of planar structure. Proceedings of the 12th Annual Meeting of ISMRM; 2004 May 15–21; Kyoto (Japan). p. 622. 2004 [Google Scholar]
- Wedeen VJ, Wang RP, Schmahmann JD, Benner T, Tseng WY, Dai G, Pandya DN, Hagmann P, D'Arceuil H, de Crespigny AJ. Diffusion spectrum magnetic resonance imaging (DSI) tractography of crossing fibers. Neuroimage. 2008;41:1267–1277. doi: 10.1016/j.neuroimage.2008.03.036. doi:10.1016/j.neuroimage.2008.03.036. [DOI] [PubMed] [Google Scholar]
- Wolman M. Polarized light microscopy as a tool of diagnostic pathology. J Histochem Cytochem. 1975;23:21–50. doi: 10.1177/23.1.1090645. doi:10.1177/23.1.1090645. [DOI] [PubMed] [Google Scholar]
- Yassa MA, Muftuler LT, Stark CE. Ultrahigh-resolution microstructural diffusion tensor imaging reveals perforant path degradation in aged humans in vivo. Proc Natl Acad Sci USA. 2010;107:12687–12691. doi: 10.1073/pnas.1002113107. doi:10.1073/pnas.1002113107. [DOI] [PMC free article] [PubMed] [Google Scholar]