

Abstract
It has been proposed that task control is functionally implemented by a distributed frontoparietal system. It has been argued that one component of this system, the lateral frontal cortex, is functionally organized through a caudal to rostral gradient. Here, we tested 2 competing models, the Information Cascade and Rule Abstraction hypotheses, which suggest different principles underlying the rostrocaudal gradient. We presented participants with 4 vertical lines on a screen and asked them to indicate the position of the shortest line. We manipulated the difficulty of the task in 3 simple ways: By increasing the number of lines, by decreasing the difference between short and normal line length, and by changing the stimulus–response mapping. As expected, these manipulations evoked widespread frontoparietal activation, with activity much more anterior than predicted by Information Cascade and Rule Abstraction models. There were also striking individual differences in the rostrocaudal extent of activity. The results suggest an integrated frontoparietal system, which can be recruited as a whole even by very simple task demands.
Keywords: functional magnetic resonance imaging, Information Cascade, multiple demand, prefrontal cortex, Rule Abstraction
Introduction
The understanding that the prefrontal cortex (PFC) is important in the control of purposeful, coordinated thought and behavior is well established (Luria 1966). However, it is far from clear how the organization/neural architecture of the PFC facilitates this functional role. Over the last decade, studies using functional magnetic resonance imaging (fMRI) have shown a system of frontal, parietal, and insular functional regions whose activity increases when a subject is “on-task,” regardless of the particular cognitive manipulations required by that task (Cabeza and Nyberg 2000; Duncan and Owen 2000; Fox et al. 2005; Dosenbach et al. 2006; Cole and Schneider 2007; Duncan 2010). This multiple demand (MD) system, also referred to as the “frontoparietal control system” (Vincent et al. 2008), “task-activation ensemble” (Seeley et al. 2007), and “cognitive control network” (Cole and Schneider 2007), appears to be crucial in the structuring of mental control for goal-oriented behavior and has also been strongly associated with fluid intelligence (Duncan et al. 2000; Bishop et al. 2008; Woolgar et al. 2010). Specifically, the MD system includes a part of the dorsolateral prefrontal cortex (DLPFC), particularly in the region of the inferior frontal sulcus (IFS) and sometimes extending to anterior PFC (APFC); dorsal anterior cingulate (DACC) expanding into the pre-supplementary motor area (pre-SMA); bilateral parietal cortex, in and around the intraparietal sulcus (IPS); and bilateral regions of the anterior insula and frontal operculum (AI/FO). As well as reliable and consistent co-activation while participants are performing a task, analyses of resting-state fMRI data have found that these regions also exhibit significant activity correlations (Cole and Schneider 2007; Dosenbach et al. 2007; Cole et al. 2010; Power et al. 2011).
Taken together, the evidence suggests a central role for the MD system as a whole in directed cognition and task representation (Stiers et al. 2010). However, how the MD system represents and manipulates information is unclear. Some results suggest a division of labor between the MD regions, such as DACC/pre-SMA in error detection (Botvinick et al. 2001; Kim et al. 2011) and AI/FO in attentional control (Nelson et al. 2010).
The DLPFC is the largest component of the MD system, extending caudally from around the region of the inferior frontal junction (IFJ) along the IFS and middle frontal gyrus (MFG) to the APFC. With such a large area of cortex, an obvious question is whether the whole region is relatively homogeneous in function, or whether there is specialization and organization, for example, along the rostrocaudal axis. Two influential models of lateral frontal cortex organization suggest that this is the case.
The Rule Abstraction model proposed by Badre and D'Esposito (2007, 2009) and Badre (2008) states that as one moves in a caudal to rostral direction across the lateral frontal cortex, the cortex is functionally organized to represent increasingly more abstract action goals/motor acts according to a scheme of policy abstraction. One representation is said to be higher than another in policy abstraction when it generalizes over the latter. This hypothesis can be tested using tasks in which appropriate behavior is determined by the application of several levels of rules—where the outcome of a decision at one level guides the appropriate action at the next level down. For example, at the lowest level, a rule might be: “if the presented shape is red press button 1, if the shape is blue press button 2.” According to Badre and D'Esposito (2007, 2009), activity in a task of this sort would be restricted to the dorsal pre-motor cortex (PMd), the red region A in Figure 1. The second level brings in an additional constraint, such as: “if the shape is a square use your right hand to make the red-1, blue-2 response, if it is a circle use your left hand.” This additional level of abstraction, it is argued, will lead to recruitment of the pre-PMd, red region B in Figure 1, but no significant activation of the more anterior lateral frontal regions. The addition of further rule layers is proposed to require representation in IFS, red region C, and APFC, red region D (Fig. 1).
Figure 1.

Frontal regions from the Rule Abstraction and Information Cascade theories. Peak voxels taken from the Rule Abstraction theory (Badre and D'Esposito 2007), in red, and the Information Cascade theory (Koechlin et al. 2003), in blue. In MNI coordinates: A = (−30, −10, 68), PMd; B = (−37, 10, 34), pre-PMd; C = (−51, 26, 24), IFS; D = (−36, 51, 9), APFC; X = (−32, −8, 53) PMd; Y = (−43, 7, 20), pre-PMd; Z = (−50, 35, 23), IFS. Note that coordinates B and Y fall within the precentral sulcus, but for illustration are shown here on the surface.
An alternative account of lateral frontal cortex functional organization suggests a rostrocaudal gradient that is grounded in information theory: The Information Cascade model (Koechlin et al. 2003; Koechlin and Summerfield 2007). According to this hypothesis, as one moves rostrally along the lateral frontal cortex, the nature of what information is being represented changes. The most caudal region (PMd, blue region X in Fig. 1) is associated with processing information pertaining to the current stimulus. More rostrally, the posterior PFC (Fig. 1, blue region Y) begins to represent information regarding the current and immediate context in which the stimulus appears, for example, in tasks where an instruction cue indicates how the stimulus should be processed. Yet more, anterior activity is seen when behavior is instructed by events further back in time, for example, an instruction cue for an entire test block (Fig. 1, IFS, blue region Z). At the highest, most rostral end of the hierarchy, frontopolar cortex encodes information which is currently not required, but which may become relevant in the near future (not shown in Fig. 1).
In the present study, we use 3 different task difficulty manipulations to test both models of rostrocaudal hierarchy across the lateral frontal cortex. Manipulation of task difficulty has previously provided a strong contrast for the DLPFC and other regions of MD cortex in neuroimaging experiments (Duncan and Owen 2000; Woolgar et al. 2011). Perhaps surprisingly, even a simple manipulation of stimulus discrimination difficulty, with little need for complex cognitive control, has been shown to activate quite anterior regions of the PFC (Jiang and Kanwisher 2003a). In this study, Jiang and Kanwisher presented subjects with 4 lines, one of which was shorter or longer than the other three. The task was to identify the position of the odd one out. Along much of the rostrocaudal extent of the DLPFC, activity increased when the length discrimination was made more difficult. According to the Rule Abstraction theory, a fine discrimination manipulation of the stimulus should involve no additional rule level to make the appropriate response. Likewise, according to the Information Cascade account, all of the information relevant to the response is present within the stimulus itself. Accordingly, both theories would predict that frontal lobe activation should be limited to, or at least strongest in the posterior frontal cortex—specifically PMd, regions A and X in Figure 1.
In the present study, we attempt to replicate the above findings by adopting a similar task design to Jiang and Kanwisher (2003a, 2003b), but applying 3 different types of difficulty manipulation, illustrated in Figure 2:
-
(1)
Increasing the number of lines to be attended to, the 8-line (8L) condition.
-
(2)
Decreasing the difference in length of the shorter line, the FD condition.
-
(3)
Switching to an unnatural stimulus–response mapping, the MS condition.
Figure 2.

Task conditions. In each case, the task was to respond to the position of the shorter line, using either 4 (conditions 4L, FD, and MS) or 8 alternative response buttons. Icons below each example display show the correct response for that display. (a) 4L condition, (b) 8L condition, (c) FD condition, and (d) MS condition; arrows show correct key presses for each target stimulus (shorter line) position.
According to both the Rule Abstraction and Information Cascade hypotheses, increases in activation following manipulations 1 and 2 should be restricted to PMd (A and X, Fig. 1). According to the Rule Abstraction model, with the 8L and FD conditions only one rule needs to be applied—“where is the location of the shortest line?”—thus, only the most basic level of their control hierarchy (PMd) is required for both tasks. With respect to the Information Cascade model, all of the information that is required to perform the task is present in the stimulus itself for the 8L and FD conditions. Again, therefore, both tasks require only the basic level of control, associated with processing in PMd. For the MS condition, in contrast, the 2 models might propose different patterns of spreading activation. For the Rule Abstraction model, predictions depend on assumptions about how the task is controlled. If mapping is implemented simply by a list of 4 independent stimulus–response links, then again there is no reason to predict activity anterior to the PMd. Another plausible model, however, is that participants first choose the spatial rule to apply to the current stimulus (e.g., “move right by two”), then apply this transformation to obtain the correct response (Duncan 1977). In this case, activity for this 2-level decision might spread forward to include pre-PMd (B, Fig. 1). The Information Cascade model, in contrast, might predict recruitment up to the mid-dorsolateral PFC, around the IFS, (Z, Fig. 1), as information from the past (a cue at the start of the block) is needed to instruct correct behavior (the alternative mapping). For both models, critically, only the MS condition gives reason to anticipate control beyond the lowest, most posterior prefrontal level.
A further question motivating this study was to what extent are there individual differences in the rostro-caudal spread of activation for different manipulations of task difficulty? If the lateral frontal cortex is functionally segregated as suggested, one would expect this to be preserved across individuals. However, if the lateral frontal cortex is more flexible, there may be less constraint on the extent of anterior spread of activation. For example, from a basic demand perspective, some participants may simply need to recruit more cortex to make a decision than others. If this was the case, one may predict considerable variation in the spread of activation across the lateral surface. We were interested in whether activation patterns across the frontal lobe were consistent or variable for the different difficulty manipulations, thus reflecting more qualitative or quantitative differences between the different task manipulations.
Materials and Methods
Task Design
The task control program was created using Visual Studio 2008. Within the scanner, the stimulus display was projected onto a mirror mounted to a 12-channel head-coil.
Participants were required to perform a visual discrimination task with 4 different conditions, as shown in Figure 2. In the baseline 4-line (4L) condition, each trial began with a uniform gray screen. The onset of a new trial was indicated by the appearance of a small fixation cross in the centre of the screen for 200 ms. Next, 4 vertical lines were briefly (100 ms) displayed, whose mid-points were aligned along the middle of the screen and distributed symmetrically either side of the fixation cross (total width 8.3° visual angle; Fig. 2a). Of the 4 lines, 3 were the same length (13.4°) with the oddball line always being 50% shorter than the others (6.7°). Using the middle 4 keys (left middle, left index, right index, and right middle fingers) of an 8-button response box, the participant was instructed to indicate the position of the shorter line by pressing the spatially corresponding key (e.g., Fig. 2a, leftmost line shortest, response with the left middle finger). After the lines disappeared from the display, the fixation cross remained until the participant made a response. After a response, there was a 500- to 1500-ms jittered interstimulus interval, before the onset of the next trial.
Remaining conditions were similar, with the following changes. In the 8L condition, there were an additional 2 vertical lines displayed either side of the original 4 lines (total display width 16.7°; Fig. 2b), requiring the additional use of the little and ring fingers of each hand to indicate a response. In the FD condition, there were 4 lines as in the 4L condition, but the shortest line was now only 10% shorter (12°) than the other 3 lines (Fig. 2c). For the MS condition, the stimulus–response mapping was changed from the natural one to the alternative shown in Figure 2d. This mapping was learned prior to scanning and practiced until the participant had responded to 5 consecutive trials correctly. Participants also performed a fifth condition with 2 lines, but as brain activity did not significantly differ from that in the 4L condition, this condition will not be considered further.
Trials were grouped into blocks each devoted to one task condition. Each block began with the presentation of a single character instruction cue, which indicated the upcoming condition, in the middle of the screen for 200 ms. Following the cue, there was a 3800-ms pause before the onset of the first trial. Each block terminated 16 s after this pause, with participants performing as many trials as they could during the block (usually 7–9 trials). While there were no enforced differences between the number of trials completed within a block and task difficulty manipulation, naturally the harder tasks, which were associated with a longer reaction time, usually had 1 or 2 fewer trials completed per block. There was a 10-s interval between blocks. To encourage task engagement, at the end of a block, participants were shown the number of errors made during that block and asked in general to respond as quickly and accurately as possible.
The whole experiment was separated into 3 scanning runs, with a 30-s break between runs. Each run was composed of 25 task blocks—5 blocks for each of the 5 conditions. Block order was pseudorandomized.
Participants
Thirteen right-handed participants, 7 females, aged between 18 and 37 (mean = 25 years) were recruited from the Medical Research Council Cognition and Brain Sciences Unit (MRC CBU) subject panel. Of 20 original subjects scanned, 1 had to be removed for excessive head movements (>10 mm translation and/or 6° rotation), and a further 6 were removed due to poor behavioral performance (<50% correct for at least one condition). All participants had normal or corrected-to-normal vision, and no participants had a history of neurological or psychiatric illness. Participants were reimbursed for their time. Ethical approval was given by the Cambridge Psychology Research Ethics Committee.
Data Acquisition
Scans were acquired with a 3-T Siemens Trim Trio scanner. Thirty two 3-mm slices (0.75-mm interslice gap) gave an in-plane resolution of 3 × 3 mm and were acquired using a time repetition of 2 s. T2*-weighted echoplanar images depicting the blood oxygenation level-dependent (BOLD) contrast were acquired with a flip angle of 78°. For both experiments, the first 10 images were discarded to avoid T1 equilibrium effects.
Data Analysis
Images were preprocessed and analyzed with SPM5 (Wellcome Department of Cognitive Neurology). In the first preprocessing step, data were checked for obvious artifacts, and all images were realigned to the first image. Next, we performed slice-time correction and coregistration of the structural with the functional echo planar images. Finally, data were normalized to the standard Montreal Neurological Institute (MNI) template, smoothed with an 8-mm full-width at half-maximum (FWHM) Gaussian kernel and subject to a high-pass filter with cutoff at 128 s. Smoothing was omitted for the analysis of regions of interest (ROIs) from the single-subject localizer (see below), as it may blur activation across distinct functional regions (Nieto-Castanon et al. 2003).
Fixed-effects analyses were performed on each individual's data using a general linear model. Regressor functions for each condition were created by convolving timing functions, modeled as time from each stimulus onset to response, with a basis function representing the canonical hemodynamic response. Incorrect responses were modeled in separate condition-specific error regressors. Explicitly, modeling the duration of each event rather than entire blocks ensured that the resultant beta values estimated the neural response per unit time.
The resultant beta weight images from the fixed-effects analysis were further examined by random-effects analysis. Contrasts were performed to identify the regions that were recruited more for the 8L, FD, and MS conditions relative to the 4L condition. Activation maps (threshold 0.05, false discovery rate [FDR] corrected) were visualized using MRIcroN (Rorden et al. 2007). MRIcroN was also used to produce overlap maps of significant activations (P< 0.05, FDR corrected) in individual participants.
Localizer Task and ROI Analysis
In addition to the main experiment, all participants also performed an additional task as part of a separate experiment. For current purposes, this additional task was used as a localizer to define ROIs covering major components of the MD system. By definition, MD regions are activated by widely divergent tasks; to emphasize this, our localizer used stimuli in a different sensory modality from the main task, with an entirely different task format.
Participants were required to perform an auditory match to sample task. Each block began with the onset of an 800-ms duration pure tone (sample tone) between 900 and 1000 Hz, which participants were instructed to remember. During the subsequent block participants heard a series of 5 test tones and were required to classify each as match/mismatch to the sample, indicating this choice with a button press (right index finger for a match, left index finger for a mismatch). There were 4 conditions which varied the inter stimulus interval between test tones (1500 or 5000 ms) and the frequency difference between sample and mismatching tests (±30 or ±500 Hz) in a 2 × 2 factorial design. The condition was fixed within a block. The whole experiment was separated into 3 scanning runs, with a 30-s break between runs. Each run was composed of 20 blocks, 5 for each of the 4 conditions. Block order was pseudorandomized.
All scanning parameters were the same as in the main experiment. Again, events within each block were estimated using 4 regressor functions, 1 for each condition. Regressors were created by convolving timing functions, extending from the onset of the stimulus to the moment of the response, with the hemodynamic response basis function.
To identify MD ROIs, we used a contrast of all event types greater than baseline (P < 0.05 uncorrected) in each individual. Individual ROIs were defined by overlap of this event > baseline image with selected anatomical (aal) regions based on the MNI standard brain (Tzourio-Mazoyer et al. 2002). For this purpose, aal regions from the left and right hemispheres were combined on a single hemisphere, smoothed with an 8-mm FWHM Gaussian kernel, and then projected back to both hemispheres to produce smoothed, symmetrical regions on the 2 sides. To define MD ROIs in left and right parietal cortex, we used overlap of localizer activity with combined inferior and superior parietal aal regions. For pre-SMA/DACC, we used overlap with the anterior cingulum, mid-cingulum, and SMA aal regions for both hemispheres (restricted to ±18 on the x axis, MNI space). For AI, we used the insula aal ROI for each hemisphere (restricted to activations rostral to the anterior commissure). For lateral PFC, activations overlapping with all lateral frontal aal regions were used and then separated into 4 segments. The following boxes describe the limits of the resulting 4 lateral PFC ROIs in each hemisphere (Fig. 3). A right superior frontal junction (SFJ) ROI (Fig. 3, pink) was defined by (15 ≤ x ≤ 75, 0 ≤ y ≤ 22, 40 ≤ z ≤ 75). A right IFJ ROI (Fig. 3, blue) was defined by (15 ≤ x ≤ 75, 0 ≤ y ≤ 22, 0 ≤ z ≤ 40). A right IFS ROI (Fig. 3, green) was defined by (15 ≤ x ≤ ± 75, 22 ≤ y ≤ 45, 0 ≤ z ≤ 40). A right anterior frontal ROI (APFC, Fig. 3, red) was defined by (15 ≤ x ≤ 75, 45 ≤ y ≤ 75, 0 ≤ z ≤ 40). Left hemisphere ROIs were symmetrical to the right hemisphere ROIs. Example, MD ROIs from 1 subject are shown in Figure 3.
Figure 3.
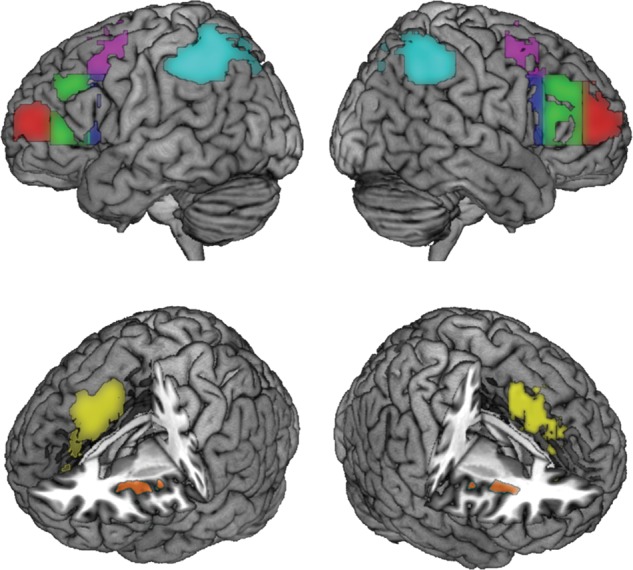
Example MD ROIs from the localizer task. Pink—around the SFJ; blue—around the IFJ; green—around the mid-IFS; red—APFC; cyan—around the IPS; yellow—around pre-SMA and DACC; orange—around the AI.
In addition to these localizer-defined ROIs, we also used spherical ROIs of 6 mm radius centered on each coordinate in Figure 1, along with symmetrically placed ROIs in the opposite hemisphere. While the localizer-based ROIs have the advantage of functional definition based on each individual participant's data, we include the spherical ROIs to make our results more easily comparable with previous work.
Results
Behavior
Mean reaction times are shown in Figure 4. A repeated-measures analysis of variance (ANOVA) revealed a significant main effect of difficulty (F3,39 = 63.27, P < 0.001). Planned, paired 1-tailed t-tests revealed a significant increase in reaction time between the 4L condition and each of the difficulty manipulations (8L: t12 = 11.8, P < 0.001; FD: t12 = 8.31, P < 0.001; MS: t12 = 10.1, P < 0.001). Mean accuracies for the 4L, 8L, FD, and MS conditions were 98%, 97%, 98%, and 92%, respectively.
Figure 4.

Mean reaction times for each condition. Error bars represent the standard error of the mean.*P < 0.05.
Whole-brain Analysis
To establish brain regions sensitive to increase in the different forms of difficulty, we performed random-effects contrasts of 8L > 4L, FD > 4L, and MS > 4L. Figure 5 shows the resulting group contrast images, evaluated at a threshold of P < 0.05 corrected for the FDR (8L, T = 2.70; FD, T = 2.50, MS, T = 2.29). The 8L > 4L contrast is shown in red, the FD > 4L contrast in green, and MS > 4L contrast in yellow. Representative peak voxels are shown in Table 1. Each contrast produced extensive activation across the frontoparietal cortex. Parietal activations for the 8L condition were more widespread and slightly more anterior and dorsal to the FD and MS activations in both hemispheres. In all 3 conditions, activation was observed around the IPS bilaterally. On the medial surface of the PFC (Fig. 5a, bottom), all 3 contrasts again showed regions of significant activity, most extensive for MS and most restricted for 8L. The 8L peak medial PFC activation (−12, 0, 66) was also more caudal than those for FD (6, 12, 51) and MS (0, 15, 48). Joint activation for all 3 contrasts was also bilaterally seen in the AI/FO (Fig. 5a, bottom), again most restricted for the 8L > 4L contrast.
Figure 5.

Whole-brain analysis. Overlaid activation maps from 3 whole-brain analyses: 8L > 4L in red, FD > 4L in green, MS > 4L in yellow. (a) All 3 activation patterns overlaid on a single brain. Clockwise from top left: Lateral surface of the left hemisphere, lateral surface of the right hemisphere, right PFC cut away revealing medial PFC and right insula activations, and left PFC cut away revealing medial PFC and left insula activations. (b) Bilateral view of lateral surface showing activations from the 8L > 4L contrast only. ROI outlines from Figure 1 also shown: Rule Abstraction ROIs in red outline, Information Cascade ROIs in blue outline. (c) Bilateral view of the lateral surface showing activations from the FD > 4L contrast only. (d) Bilateral view of the lateral surface showing activations from the MS > 4L contrast only.
Table 1.
Peak voxels in frontal cortex and other MD regions for the three comparisons
| Condition | ROI | Hemisphere | x | y | z | t-statistic |
|---|---|---|---|---|---|---|
| 8L > 4L | SFJ | Left | −15 | 0 | 69 | 4.24 |
| Right | 27 | 0 | 60 | 5.43 | ||
| IFJ | Left | −60 | 6 | 15 | 5.19 | |
| Right | 54 | 6 | 21 | 5.86 | ||
| IFS | Left | −36 | 33 | 9 | 3.45 | |
| Right | 51 | 36 | 21 | 4.58 | ||
| IPS | Left | −27 | −48 | 63 | 8.73 | |
| Right | 24 | −48 | 66 | 7.69 | ||
| AI | Left | −30 | 15 | 12 | 5.1 | |
| Right | 42 | 3 | 9 | 4.63 | ||
| Pre-SMA/DACC | −12 | 0 | 66 | 4.95 | ||
| FD > 4L | SFJ | Left | −21 | 0 | 45 | 4.1 |
| Right | 30 | 3 | 48 | 6.43 | ||
| IFJ | Left | −33 | 18 | 9 | 7.14 | |
| Right | 57 | 15 | 33 | 6.21 | ||
| IFS | Left | −33 | 21 | 12 | 6.69 | |
| Right | 42 | 33 | 39 | 5.99 | ||
| APFC | Left | −39 | 45 | 6 | 2.96 | |
| Right | 48 | 45 | 6 | 5.39 | ||
| IPS | Left | −48 | −36 | 39 | 8.1 | |
| Right | 45 | −36 | 45 | 8.73 | ||
| AI | Left | −30 | 15 | 12 | 8.31 | |
| Right | 30 | 27 | 3 | 6.87 | ||
| Pre-SMA/DACC | 6 | 12 | 51 | 4.11 | ||
| MS > 4L | SFJ | Left | −27 | 0 | 51 | 10.67 |
| Right | 24 | 6 | 57 | 16.48 | ||
| IFJ | Left | −39 | 18 | 27 | 8.26 | |
| Right | 48 | 9 | 24 | 7.61 | ||
| IFS | Left | −33 | 42 | 12 | 7.84 | |
| Right | 48 | 30 | 36 | 11.59 | ||
| APFC | Left | −33 | 45 | 6 | 9.6 | |
| Right | 33 | 51 | 24 | 7.71 | ||
| IPS | Left | −51 | −36 | 39 | 13.77 | |
| Right | 48 | −39 | 54 | 10.28 | ||
| AI | Left | −27 | 21 | 6 | 10.81 | |
| Right | 33 | 27 | 0 | 9.77 | ||
| Pre-SMA/DACC | 0 | 15 | 48 | 9.85 |
Each region was defined using the same aal masks that were used to constrain the functional ROIs. These masks were then applied to the whole-brain map and representative peak voxels identified.
Most interestingly, this analysis suggested quite different patterns of activity for the 3 conditions in the lateral frontal lobe. In the left frontal lobe, 8L activations were largely limited to motor/premotor cortex, although there was a small cluster around (−36, 33, 9; not visible on the surface render), but no significant voxels in the APFC region. The FD condition was additionally associated with a small cluster of activity around the mid-DLPFC (−33, 21, 12). Most strikingly, the MS condition was correlated with widespread activation along the IFS, extending into the adjacent inferior and middle frontal gyri (IFG and MFG).
In the right lateral frontal lobe, again, the 8L pattern was the most caudal, but with additional more rostral clusters of significant activation either side of the IFS, with a peak at 51, 36, 21, but no peaks in the APFC. Most striking, though, is the degree of overlap between the FD and MS conditions, stretching from the premotor cortex, down the precentral sulcus, along the IFS to APFC. This finding is particularly important in light of the predictions made by both the Rule Abstraction and Information Cascade models, which predict activation limited to PMd in the FD condition and mid-IFS in the MS condition.
ROI Analysis
For the ROI analyses, we used 3 sets of ROIs. The first set was based on MD regions defined by the single-subject localizer task; the second set was 6-mm radius spheres, representative of the different levels within the information-theory model, shown in blue in Figure 1 (Koechlin et al. 2003); and the third set was also 6-mm radius spheres, representative of the different levels within the Rule Abstraction theory, as shown in red in Figure 1 (Badre and D'Esposito 2007). ROI results are shown in Figure 6. In each case, plots show % signal change for each of the 8L, FD, and MS conditions compared with the 4L baseline.
Figure 6.

ROI results. Graphs plot the percentage signal change between each comparison condition (8L, FD, and MS) and the 4L baseline. Black bars: 8L; gray bars: FD; white bars: MS. Error bars represent the standard error of the mean signal change between that condition and the 4L baseline. *P < 0.05 for each condition > baseline comparison, **P < 0.005. (a) Localizer ROIs outside the lateral frontal lobe. (b) Localizer ROIs in the left and right frontal lobes. SFJ, superior fontal junction; IFJ, inferior frontal junction; IFS, inferior frontal sulcus; APFC, anterior prefrontal cortex, (c) Information Cascade ROIs. PMd, dorsal pre-motor cortex; pre-PMd, pre-dorsal pre-motor cortex. (d) Rule Abstraction ROIs.
For each of the 8L > 4L, FD > 4L, and MS > 4L contrasts, data were examined with a separate 3-way repeated-measures ANOVA with factors of the task (2, e.g., 8L vs. 4L), hemisphere (2), and ROI (3). For this and all subsequent ANOVAs, a Greenhouse–Geisser correction was applied when sphericity was violated. As interest is focused on the contrast of each task (8L, FD, MS) against the 4L baseline, we report only main effects of task and its interactions with hemisphere and ROI. Results that were nonsignificant (P > 0.05) are not reported.
Initially considering ROIs outside of the lateral frontal cortex (Fig. 6a), for the 8L > 4L comparison, there was only a main effect of task (F1,12 = 5.5, P = 0.038). Figure 6a also shows the results of planned 8L > 4L comparisons (t-test) for each ROI separately. Results suggest an increase of activity in 8L over 4L in most or all ROIs.
For the FD > 4L comparison, there was a significant main effect of task (F1,12 = 24.7, P < 0.001), and interactions of task and hemisphere (F1,12 = 18.1, P = 0.001) and task and ROI (F2,24 = 4.3, P = 0.024). Despite these interactions, planned comparisons (Fig. 6a) showed significant task effects in all ROIs.
For the MS > 4L comparison, again, there was a significant main effect of task (F1,12 = 135.0, P < 0.001), and interactions between task and hemisphere (F1,12 = 5.3, P = 0.04), and task and ROI (F1.3,15.6 = 22.0, P < 0.001). Again, too, planned comparisons (Fig. 6a) showed significant task effects in all ROIs.
For localizer ROIs in the lateral frontal cortex (Fig. 6b), increases over the 4L baseline were clear in both hemispheres for the MS and FD task difficulty manipulations. Only small increases over the baseline, particularly in posterior ROIs, were seen for the 8L manipulation. Again, separate 3-way repeated-measures ANOVAs compared each of the 8L, FD, and MS tasks with the 4L baseline.
For the 8L > 4L comparison, there was a significant interaction between task and ROI (F1.9,22.6 = 4.3, P = 0.01). Planned comparisons (Fig. 6b) showed significantly stronger activation for the 8L difficulty manipulation over the 4L baseline only in the left and right SFJ, though with nonsignificant trends in all ROIs.
For the 8L > FD comparison, there was a main effect of the task (F1,12 = 15.9, P = 0.002) and an interaction between task and hemisphere (F1,12 = 7.7, P = 0.017). Planned comparisons (Fig. 6b) revealed significantly greater activation for the FD task over the 4L baseline in all ROIs, but particularly on the right.
For the MS > 4L comparison, there was a significant effect of task (F1,12 = 187.6, P < 0.001), and interactions of both task and hemisphere (F1,12 = 30.8, P < 0.001) and task and ROI (F3,36 = 14, P < 0.001). Planned comparisons (Fig. 6b) revealed a significantly greater activation for the MS task over the 4L baseline in all ROIs, particularly on the left.
Using 6-mm spheres around the Information Cascade coordinates (Koechlin et al. 2003) produced broadly similar results (Fig. 6c).
For the ANOVA comparing 8L with 4L, there was a main effect of task (F1,12 = 12.0, P = 0.005) and an interaction of task and ROI (F2,24 = 19.0, P < 0.001). Again, the 8L > 4L contrast was strongest in the posterior region, PMd, though significant also in more anterior regions of the right hemisphere. For the FD > 4L comparison, there was a main effect of task (F1,12 = 17.9, P = 0.001) and an interaction of task and hemisphere (F1,12 = 5.4, P = 0.04), showing a stronger FD > 4L contrast on the right. For the MS > 4L comparison, there was only a significant main effect of task (F1,12 = 26.4, P < 0.001).
For the final set of analyses, we used ROIs based on the Rule Abstraction coordinates (Badre and D'Esposito 2007; Fig. 6d). The 8L > 4L comparison showed only an interaction of task and ROI (F3,36 = 15.2, P < 0.001), again with a strong task effect only in the most posterior region. The FD > 4L comparison, as before, showed a significant main effect of task (F1,12 = 5.6, P = 0.04), and an interaction of task and hemisphere (F1,12 = 9.8, P = 0.009). The MS > 4L comparison showed only a significant main effect of task (F1,12 = 24.7, P < 0.001).
Overall, all 3 sets of ROI results tell a consistent story. For FD (particularly in the right hemisphere) and MS (bilateral), increases over the 4L baseline condition showed no clear anterior–posterior gradient, with activity extending to the APFC. In contrast, the difference between the 8L and 4L conditions was strongest in posterior lateral frontal regions, particularly PMd/SFJ.
Single-Subject Results
An additional whole-brain analysis examined individual participant activations. Figure 7 shows individual-participant results for the 3 contrasts: 8L > 4L (Fig. 7a), FD > 4L (Fig. 7b), and MS > 4L (Fig. 7c). Each participant's activation was thresholded at P < 0.05, FDR corrected for multiple comparisons across the whole brain.
Figure 7.
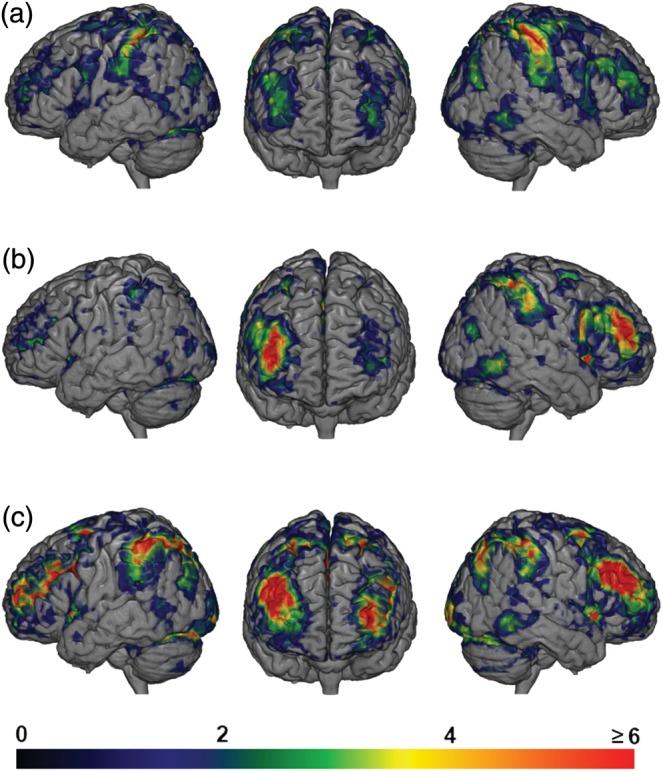
Overlap of significant activations found in single subjects. Warmer colors indicate that more subjects showed activations in that region. (a) Contrast of 8L > 4L. Some overlap found in anterior regions shown in green (3 subjects) and yellow (4 subjects). (b) Contrast of FD > 4L. Most individuals show activity along the rostrocaudal extent of the right IFS, while a few show accompanying activity on the left. (c) Contrast of MS > 4L. Robust activations across most individuals over much of the IFS, APFC, and pre-motor regions.
The most striking result concerns the 8L > 4L contrast (Fig. 7a). In some individuals, unlike random-effects findings, even this contrast showed bilateral anterior spread of activation along the IFS. For some subjects, much of the lateral PFC was recruited even during this relatively simple manipulation. For FD > 4L, broadly like random-effects findings, many individuals showed anterior activity on the right, but only a small number of individuals on the left. For MS > 4L, bilateral activity was seen in many individuals. Overall, these results suggest quantitative rather than qualitative differences between difficulty manipulations, in each case with activity through most or all of the MD system at least in some individuals.
Discussion
It has been suggested that underlying lateral frontal lobe functional organization is a rostrocaudal gradient, with rostral regions representing more abstract representations or information regarding pending behavioral episodes (Koechlin and Summerfield 2007; Badre and D'Esposito 2009). However, the current study provides evidence that rostral regions of the lateral frontal lobes may be recruited for tasks apparently devoid of any strong abstraction or temporal aspect. In our data, increasing the complexity of the stimulus–response mapping produced strong bilateral recruitment of the APFC, increasing the need for fine discrimination was associated with significant activation of APFC in the right hemisphere, and increasing the number of stimulus–response alternatives was associated with APFC activity in some individual participants.
Of our 3 manipulations, changing from a natural to an unnatural stimulus–response mapping (MS condition) produced the greatest increase in reaction time. Correspondingly, both the random-effects and ROI analyses revealed the greatest increase in activation throughout the MD system, including the bilateral DLPFC. This finding is highly consistent with the results reported by Jiang and Kanwisher (2003a, 2003b). In both of their studies, changing from a natural to an unnatural mapping produced significant activations across the DLPFC in both hemispheres. According to the Rule Abstraction model, even assuming a 2-stage process of choosing a spatial transformation and then applying this to the individual stimulus, the most anterior activity for this contrast should have been around pre-PMd (Fig. 1, region B). Similarly, the Information Cascade model might predict that the MS condition required episodic control: The need to incorporate past information into the current moment to direct the appropriate response. In this experiment, the past information was the cue at the start of the block, indicating that participants should adopt an alternative stimulus response mapping. This type of processing is predicted to occur caudal to APFC, region Z in Figure 1. Against both of these predictions, both the whole-brain and ROI analyses show that, when participants were performing this task, APFC was strongly activated.
With the FD condition, we found that increasing difficulty by reducing the difference in the length of lines from 50% to 10% provided robust activations across the right lateral frontal cortex, with suprathreshold voxels as rostral as (38, 56, 11). In the left lateral frontal lobe, activity was more restricted though still significant. This lateralization of function was also apparent from the ROI analysis, which showed a significant interaction between task and hemisphere across the lateral frontal lobe ROIs, with stronger activations associated with the right hemisphere. Again, this pattern of activation is a replication of Jiang and Kanwisher (2003a), who also showed strong rostral PFC activation unilaterally in the right hemisphere when participants made a fine discrimination of line length. The reason for this lateralization is unclear, but could reflect the known right-hemisphere bias in processing visuospatial information (Mesulam 1981; de Schotten et al. 2011). Again results are contrary to both Rule Abstraction and Information Cascade models, which would have predicted activation restricted to the premotor cortex (Fig. 1, regions A and X).
Our third difficulty manipulation (8L condition) was an increase in the number of stimulus–response alternatives. Both the Rule Abstraction model and Information Cascade models predict significant activation no further forward than PMd, regions A and X in Figure 1. The ROI results are largely consistent with this prediction; however, the whole-brain analysis (Fig. 5b) suggests that in both hemispheres activation actually spread down the precentral sulcus to around the IFJ and that a small cluster of activation was found in both the left and right DLPFC. Furthermore, some individual participants showed significant activations in more rostral regions of the DLPFC of both hemispheres (Fig. 7a). These results suggest significant individual differences, with a dominant pattern of caudal activity, but rostral spread in some individuals. A variety of motor factors might explain the especially strong 8L > 4L difference in the premotor cortex, for example, more distributed activity with the use of more response fingers, or reduced across-trial motor adaptation.
Across all 3 difficulty manipulations, perhaps the individual-participant data tell the most informative story. Even in 8L > 4L and FD > 4L contrasts, results from some participants varied considerably from the random effects group mean. Qualitatively, the pattern of activation shown by the single-participant overlay (Fig. 7) is remarkably similar for the 3 different manipulations, with activation in the PFC following the IFS from the IFJ into APFC, spreading into the neighboring MFG and IFG, but otherwise largely absent from the rest of the PFC. The results suggest, not qualitative differences between manipulations, but quantitative variations in the degree of recruitment in a distributed rostrocaudal system.
In a recent paper, Reynolds et al. (2012) have also examined the Information Cascade and Rule Abstraction models and likewise found that neither predicted their observed patterns of activity. To test the Rule Abstraction model, they manipulated the number of task-relevant cues that needed to be attended to direct the correct response. In one condition, participants needed to use a number cue to guide their response when shown a subsequent letter. According to the Rule Abstraction model, this manipulation should recruit pre-PMd, but not more anterior regions of the frontal cortex. However, reminiscent of our data, they found that the more rostral mid-DLPFC was significantly activated following this manipulation. To test the Information Cascade model, they manipulated the number of trials over which cue information needed to be maintained: either a single trial or several trials. This is argued to differentially tax episodic control, and therefore mid-DLPFC, with activation expected only with the longer maintenance durations. It was found that the mid-DLPFC was recruited for both single and multiple trial conditions, rather than selectively for just the multiple trials condition.
The Adaptive Context Maintenance hypothesis is offered by Reynolds et al. as an alternative to the Information Cascade and Rule Abstraction models. According to this model, both anterior and posterior PFC represent task-relevant information, but the dynamics of their activity changes depending on whether this information needs to be sustained over longer durations or transiently updated. Their study shows that when information was being regularly updated, as in the single-trial conditions, there was a significant increase in the transient BOLD response, but a decrease in the sustained BOLD response. In contrast when information was being maintained over longer durations, as in the multiple-trial conditions, both the transient and sustained BOLD responses were increased. In related work, Dosenbach et al. (2006) have also reported a difference in the temporal dynamics across the frontoparietal cortex. As the current study used a block-related design, we are limited to investigating sustained signals across blocks and cannot thoroughly test the predictions of the Adaptive Context Maintenance hypothesis.
Our results show that complex task demands, such as hierarchical decision rules and control by temporally distant events, are not necessary to recruit even very anterior regions of the DLPFC. Such recruitment can follow even the simplest difficulty manipulations, such as decreased stimulus discriminability. We also find evidence for important individual differences in the rostocaudal extent of lateral frontal cortex activity. These results suggest an integrated frontoparietal system, broadly recruited by a range of different cognitive challenges.
Funding
This work was funded by the Medical Research Council (United Kingdom) intramural program MC_US_A060_0001. Funding to pay the Open Access publication charges for this article was provided by UK Medical Research Council (MC_US_A060_0001).
Notes
Conflict of Interest: None declared.
References
- Badre D. Cognitive control, hierarchy, and the rostro-caudal organization of the frontal lobes. Trends Cogn Sci. 2008;12:193–200. doi: 10.1016/j.tics.2008.02.004. doi:10.1016/j.tics.2008.02.004. [DOI] [PubMed] [Google Scholar]
- Badre D, D'Esposito M. Functional magnetic resonance imaging evidence for a hierarchical organization of the prefrontal cortex. J Cogn Neurosci. 2007;19:2082–2099. doi: 10.1162/jocn.2007.19.12.2082. doi:10.1162/jocn.2007.19.12.2082. [DOI] [PubMed] [Google Scholar]
- Badre D, D'Esposito M. Is the rostro-caudal axis of the frontal lobe hierarchical? Nat Rev Neurosci. 2009;10:659–669. doi: 10.1038/nrn2667. doi:10.1038/nrn2667. [DOI] [PMC free article] [PubMed] [Google Scholar]
- Bishop SJ, Fossella J, Croucher CJ, Duncan J. COMT val158met genotype affects recruitment of neural mechanisms supporting fluid intelligence. Cereb Cortex. 2008;18:2132–2140. doi: 10.1093/cercor/bhm240. doi:10.1093/cercor/bhm240. [DOI] [PMC free article] [PubMed] [Google Scholar]
- Botvinick MM, Braver TS, Barch DM, Carter CS, Cohen JD. Conflict monitoring and cognitive control. Psychol Rev. 2001;108:624–652. doi: 10.1037/0033-295x.108.3.624. doi:10.1037/0033-295X.108.3.624. [DOI] [PubMed] [Google Scholar]
- Cabeza R, Nyberg L. Imaging cognition II: an empirical review of 275 PET and fMRI studies. J Cogn Neurosci. 2000;12:1–47. doi: 10.1162/08989290051137585. doi:10.1162/08989290051137585. [DOI] [PubMed] [Google Scholar]
- Cole MW, Pathak S, Schneider W. Identifying the brain's most globally connected regions. Neuroimage. 2010;49:3132–3148. doi: 10.1016/j.neuroimage.2009.11.001. doi:10.1016/j.neuroimage.2009.11.001. [DOI] [PubMed] [Google Scholar]
- Cole MW, Schneider W. The cognitive control network: integrated cortical regions with dissociable functions. Neuroimage. 2007;37:343–360. doi: 10.1016/j.neuroimage.2007.03.071. doi:10.1016/j.neuroimage.2007.03.071. [DOI] [PubMed] [Google Scholar]
- de Schotten MT, Dell'Acqua F, Forkel SJ, Simmons A, Vergani F, Murphy DGM, Catani M. A lateralized brain network for visuospatial attention. Nat Neurosci. 2011;14:1245–1246. doi: 10.1038/nn.2905. doi:10.1038/nn.2905. [DOI] [PubMed] [Google Scholar]
- Dosenbach NUF, Fair DA, Miezin FM, Cohen AL, Wenger KK, Dosenbach RAT, Fox MD, Snyder AZ, Vincent JL, Raichle ME, et al. Distinct brain networks for adaptive and stable task control in humans. Proc Natl Acad Sci USA. 2007;104:11073–11078. doi: 10.1073/pnas.0704320104. doi:10.1073/pnas.0704320104. [DOI] [PMC free article] [PubMed] [Google Scholar]
- Dosenbach NUF, Visscher KM, Palmer ED, Miezin FM, Wenger KK, Kang HC, Burgund ED, Grimes AL, Schlaggar BL, Petersen SE. A core system for the implementation of task sets. Neuron. 2006;50:799–812. doi: 10.1016/j.neuron.2006.04.031. doi:10.1016/j.neuron.2006.04.031. [DOI] [PMC free article] [PubMed] [Google Scholar]
- Duncan J. Response selection errors in spatial choice reaction tasks. Q J Exp Psychol. 1977;29:415–423. doi: 10.1080/00335557843000034. doi:10.1080/14640747708400618. [DOI] [PubMed] [Google Scholar]
- Duncan J. The multiple-demand (MD) system of the primate brain: mental programs for intelligent behaviour. Trends Cogn Sci. 2010;14:172–179. doi: 10.1016/j.tics.2010.01.004. doi:10.1016/j.tics.2010.01.004. [DOI] [PubMed] [Google Scholar]
- Duncan J, Owen AM. Common regions of the human frontal lobe recruited by diverse cognitive demands. Trends Neurosci. 2000;23:475–483. doi: 10.1016/s0166-2236(00)01633-7. doi:10.1016/S0166-2236(00)01633-7. [DOI] [PubMed] [Google Scholar]
- Duncan J, Seitz RJ, Kolodny J, Bor D, Herzog H, Ahmed A, Newell FN, Emslie H. A neural basis for general intelligence. Science. 2000;289:457–460. doi: 10.1126/science.289.5478.457. doi:10.1126/science.289.5478.457. [DOI] [PubMed] [Google Scholar]
- Fox MD, Snyder AZ, Vincent JL, Corbetta M, Van Essen DC, Raichle ME. The human brain is intrinsically organized into dynamic, anticorrelated functional networks. Proc Natl Acad Sci USA. 2005;102:9673–9678. doi: 10.1073/pnas.0504136102. doi:10.1073/pnas.0504136102. [DOI] [PMC free article] [PubMed] [Google Scholar]
- Jiang Y, Kanwisher N. Common neural mechanisms for response selection and perceptual processing. J Cogn Neurosci. 2003a;15:1095–1110. doi: 10.1162/089892903322598076. doi:10.1162/089892903322598076. [DOI] [PubMed] [Google Scholar]
- Jiang Y, Kanwisher N. Common neural substrates for response selection across modalities and mapping paradigms. J Cogn Neurosci. 2003b;15:1080–1094. doi: 10.1162/089892903322598067. doi:10.1162/089892903322598067. [DOI] [PubMed] [Google Scholar]
- Kim C, Kroger JK, Kim J. A functional dissociation of conflict processing within anterior cingulate cortex. Hum Brain Mapp. 2011;32:304–312. doi: 10.1002/hbm.21020. doi:10.1002/hbm.21020. [DOI] [PMC free article] [PubMed] [Google Scholar]
- Koechlin E, Ody C, Kouneiher F. The architecture of cognitive control in the human prefrontal cortex. Science. 2003;302:1181–1185. doi: 10.1126/science.1088545. doi:10.1126/science.1088545. [DOI] [PubMed] [Google Scholar]
- Koechlin E, Summerfield C. An information theoretical approach to prefrontal executive function. Trends Cogn Sci. 2007;11:229–235. doi: 10.1016/j.tics.2007.04.005. doi:10.1016/j.tics.2007.04.005. [DOI] [PubMed] [Google Scholar]
- Luria AR. Higher cortical functions in man. Oxford, UK: Basic Books; 1966. [Google Scholar]
- Mesulam MM. A cortical network for directed attention and unilateral neglect. Ann Neurol. 1981;10:309–325. doi: 10.1002/ana.410100402. doi:10.1002/ana.410100402. [DOI] [PubMed] [Google Scholar]
- Nelson SM, Dosenbach NUF, Cohen AL, Wheeler ME, Schlaggar BL, Petersen SE. Role of the anterior insula in task-level control and focal attention. Brain Struct Funct. 2010;214:669–680. doi: 10.1007/s00429-010-0260-2. doi:10.1007/s00429-010-0260-2. [DOI] [PMC free article] [PubMed] [Google Scholar]
- Nieto-Castanon A, Ghosh SS, Tourville JA, Guenther FH. Region of interest based analysis of functional imaging data. Neuroimage. 2003;19:1303–1316. doi: 10.1016/s1053-8119(03)00188-5. doi:10.1016/S1053-8119(03)00188-5. [DOI] [PubMed] [Google Scholar]
- Power JD, Cohen AL, Nelson SM, Wig GS, Barnes KA, Church JA, Vogel AC, Laumann TO, Miezin FM, Schlaggar BL, et al. Functional network organization of the human brain. Neuron. 2011;72:665–678. doi: 10.1016/j.neuron.2011.09.006. doi:10.1016/j.neuron.2011.09.006. [DOI] [PMC free article] [PubMed] [Google Scholar]
- Reynolds JR, O'Reilly RC, Cohen JD, Braver TS. The function and organization of lateral prefrontal cortex: a test of competing hypotheses. PLoS One. 2012;7:e30284. doi: 10.1371/journal.pone.0030284. doi:10.1371/journal.pone.0030284. [DOI] [PMC free article] [PubMed] [Google Scholar]
- Rorden C, Karnath H-O, Bonilha L. Improving lesion-symptom mapping. J Cogn Neurosci. 2007;19:1081–1088. doi: 10.1162/jocn.2007.19.7.1081. doi:10.1162/jocn.2007.19.7.1081. [DOI] [PubMed] [Google Scholar]
- Seeley WW, Menon V, Schatzberg AF, Keller J, Glover GH, Kenna H, Reiss AL, Greicius MD. Dissociable intrinsic connectivity networks for salience processing and executive control. J Neurosci. 2007;27:2349–2356. doi: 10.1523/JNEUROSCI.5587-06.2007. doi:10.1523/JNEUROSCI.5587-06.2007. [DOI] [PMC free article] [PubMed] [Google Scholar]
- Stiers P, Mennes M, Sunaert S. Distributed task coding throughout the multiple demand network of the human frontal–insular cortex. Neuroimage. 2010;52:252–262. doi: 10.1016/j.neuroimage.2010.03.078. doi:10.1016/j.neuroimage.2010.03.078. [DOI] [PubMed] [Google Scholar]
- Tzourio-Mazoyer N, Landeau B, Papathanassiou D, Crivello F, Etard O, Delcroix N, Mazoyer B, Joliot M. Automated anatomical labeling of activations in SPM using a macroscopic anatomical parcellation of the MNI MRI single-subject brain. Neuroimage. 2002;15:273–289. doi: 10.1006/nimg.2001.0978. doi:10.1006/nimg.2001.0978. [DOI] [PubMed] [Google Scholar]
- Vincent JL, Kahn I, Snyder AZ, Raichle ME, Buckner RL. Evidence for a frontoparietal control system revealed by intrinsic functional connectivity. J Neurophysiol. 2008;100:3328–3342. doi: 10.1152/jn.90355.2008. doi:10.1152/jn.90355.2008. [DOI] [PMC free article] [PubMed] [Google Scholar]
- Woolgar A, Hampshire A, Thompson R, Duncan J. Adaptive coding of task-relevant information in human frontoparietal cortex. J Neurosci. 2011;31:14592–14599. doi: 10.1523/JNEUROSCI.2616-11.2011. doi:10.1523/JNEUROSCI.2616-11.2011. [DOI] [PMC free article] [PubMed] [Google Scholar]
- Woolgar A, Parr A, Cusack R, Thompson R, Nimmo-smith I, Torralva T, Roca M, Antoun N, Manes F, Duncan J. Fluid intelligence loss linked to restricted regions of damage within frontal and parietal cortex. Proc Natl Acad Sci USA. 2010;107:14899–14902. doi: 10.1073/pnas.1007928107. doi:10.1073/pnas.1007928107. [DOI] [PMC free article] [PubMed] [Google Scholar]