

Abstract
This review examines changing perspectives on the biomechanics of vulnerable plaque rupture over the past 25 years from the first FEA showing that the presence of a lipid pool significantly increases the local tissue stress in the atheroma cap to the latest imaging and 3D FEA studies revealing numerous microcalcifications in the cap proper and a new paradigm for cap rupture. The first part of the review summarizes studies describing the role of the fibrous cap thickness, tissue properties and lesion geometry as main determinants of the risk of rupture. Advantages and limitations of current imaging technologies for assessment of vulnerable plaques are also discussed. However, the basic paradoxes as to why ruptures frequently did not coincide with location of PCS and why caps > 65 μm thickness could rupture at tissue stresses significantly below the 300 kPa critical threshold still remained unresolved. The second part of the review describes recent studies in the role of microcalcifications, their origin, shape and clustering in explaining these unresolved issues including the actual mechanism of rupture due to the explosive growth of tiny voids (cavitation) in locals regions of high stress concentration between closely spaced microinclusions oriented along their tensile axis.
Keywords: human atheroma, biomechanics of rupture, vulnerable plaque, fibrous cap, microcalcification hypothesis
Introduction
The rupture of the thin fibrous cap overlying the necrotic core of a vulnerable plaque is widely viewed as the primary cause of acute coronary syndrome accounting for more than half of all cardiovascular deaths. Pathological studies have defined a vulnerable plaque as a positively remodeled lesion rich in vasa-vasorum containing a lipid rich pool with a fibrous cap that is infiltrated by macrophages,10-11,85-86 as shown in Figure 1. Pathologists have emphasized the role of inflammation,5,21 matrix metalloproteinases, macrophages,86 smooth muscle cell apoptosis4,35 and the presence of neovascularization and intraplaque hemorrage in advanced coronary lesions.38 In contrast, biomechanicians have emphasized tissue properties,2,25,87 3D imaging of actual plaque geometries,13,25,65,77,82 analysis of circumferential stresses,13,25,32,61,82 fluid-induced shear stresses,6,65 residual stresses,60 and more recently the importance of microcalcifications (μCalcs) in cap rupture.6,36,54-55,82-83 This review will emphasize the latter studies, the vast improvement in imaging techniques and the changing views of the rupture process that have resulted from these greatly refined 3D imaging approaches. This increased resolution has led to the development of much more sophisticated 3D finite element analyses (FEA)61,82 and fluid-structure interaction (FSI) models6,44,77,79 of local tissue stresses, new insights into the cap rupture process and a new paradigm for the actual cap rupture mechanism.
Figure 1.
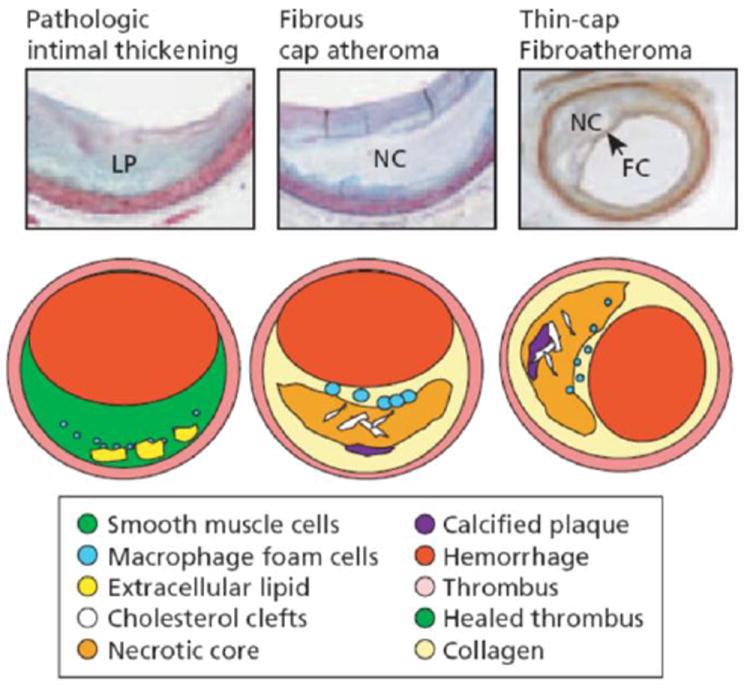
The tissue over the lipid pools is rich in SMCs and proteoglycans, some scattered macrophages, and lymphocytes may also be present. The more definitive lesions, of fibrous cap atheroma, classically shows a true necrotic core (NC) containing cholesterol esters, free cholesterol, phospholipids, and triglycerides. The fibrous cap consists of SMCs in a proteoglycan–collagen matrix, with a variable number of macrophages and lymphocytes. The thin-cap fibroatheroma (vulnerable plaque): thin-cap fibroathomas are lesions with large necrotic cores containing numerous cholesterol clefts. The overlying fibrous cap (FC) is thin (< 65 μm) and heavily infiltrated by macrophages; SMCs are rare and microvessels are generally present in the adventitia. (Reproduced with permission from Virmani R, et al., Arteriosclero Thromb Vasc Biol 2000;20:1262 75.3).
A. Early studies
The landmark paper by Richardson et al.66 is generally considered the first biomechanical analysis in which tissue stresses are related to lesion morphology and tissue properties. These authors were the first to show through 2D FEA of lesion cross-sections that the presence of a lipid pool would lead to a concentration of tissue stress in the overlying fibrous cap. A typical lesion geometry showing a fibrous cap, underlying lipid pool and its various constituents is sketched in Figure 1. In subsequent studies these authors showed that the size of the lipid pool correlated with the risk of cap rupture17 and mechanically demonstrated that the caps were locally weakened in regions where there was a locally increased macrophage density.48 Furthermore, the strength of the cap depended locally on its collagen content.12 A fundamental and unexplained mystery was the observation that 37% of cap ruptures were observed in the cap center,66 as opposed to the cap shoulders, where 2D FEA predicted peak circumferential stress (PCS) and macrophages were present in greater concentration. This critical observation was subsequently confirmed in a more recent extensive study of 300 rupture sites where again 37% of cap tears were at the center.52 Ruptures were most frequently found in regions of positive remodeling, rather than minimal lumen area, and thus were asymptomatic.
These initial studies by Davies, Born, and Richardson, which are described in a recent memorial tribute to Davies,8 were greatly enhanced by a series of investigations by RT Lee and coworkers.45-46 The latter investigators first showed that calcification increased the stiffness (elastic modulus E) of the cap in the abdominal aorta,45 and then demonstrated through 2D FEA that decreasing cap thickness greatly increased PCS51 in coronary arteries whereas stenosis decreased PCS. This analysis was then applied to 24 coronary artery lesions, 12 ruptured and 12 intact.13 This widely cited study predicted that the threshold PCS for rupture was 300 kPa and that the average rupture stress was 545 kPa, but surprisingly in only seven of the 12 ruptured lesions did the site of rupture occur at the predicted location of PCS. This was attributed at the time to variation in cap tissue properties. Subsequently, these investigators demonstrated using 2D FEA that PCS did not correlate with the presence of calcification and that PCS would decrease substantially if the lipid pool was replaced by fibrous tissue.34
B. Fibrous cap thickness
The prediction in Loree et al.51 that decreasing cap thickness could significantly increase the risk of cap rupture led to series of experimental investigations eventually leading to the widely cited criterion that caps ≤ 65 μm were prone to rupture.85 This criterion was based on the frequently quoted results in Burke et al.11 where the mean ± SD cap thickness for rupture is given as 23 ± 19 μm and that 95% of ruptured caps were < 65 μm. These measurements were based on the measured thickness at the tear. However, if one examines the tears in Figure 1 of Burke et al.11, they are at an acute angle where the tissue is severely tapered towards the thin edge of the tear as opposed to where the tear had started. More recent results indicate that caps as thick as 100 μm can rupture52 and in the case of exertion ruptured caps as thick as 160 μm were observed.75 The < 65 μm criterion has been challenged by the detailed 3D FEA in Maldonado et al.55 In the latter study the PCS has been quantitatively analyzed in sixty-two non-ruptured fibrous caps in all three coronary arteries. The thinnest non-ruptured cap was 66 μm, very close to the < 65 μm criterion, but the PCS in this cap was only 107 kPA, far less than the 300 kPa threshold proposed in Cheng et al.,13 and the predicted cap thickness for this threshold to be achieved was only 30 μm. This 3D FEA confirmed the earlier 2D predictions in Finet et al.25 that fibrous caps > 65 μm thickness had PCS less than the 300 kPa threshold and this result appeared to be insensitive to lipid pool geometry. These predictions and the observation that caps > 100 μm do rupture strongly suggests that cap thickness, though important, is not the only criterion for rupture, as discussed next.
C. Other criteria for rupture
The inability to explain rupture in thick caps and the fact that in only 58% of caps did rupture occur at the location of PCS13 prompted a number of studies where other biomechanical aspects of cap rupture were examined. This included lipid core composition,25 necrotic core size,61 location and shape of lipid pool,2,76 residual stresses,60 and the proximity of calcifications to the lipid pool.32 Collectively, these studies indicated that large, thick lipid pools increased risk of rupture,61 residual stresses reduced the PCS in the fibrous cap proper,60 that the PCS was increased near the edges of calcifications32 and that the PCS could occur in healthy thin regions of a vessel wall opposite a lesion or regions of high lumen curvature.77 The fluid-structure interaction (FSI) analyses in Tang et al.76-77 were the first 3D numerical studies to calculate tissue stresses in actual in vivo MRI images of human coronary arteries. Shortly thereafter, Ohayon et al.62 provided the first 3D FEA of human coronary arteries as seen using IVUS imaging. The latter study pointed out the major limitations of 2D FEA and showed that the predictions of the PCS in 2D cross-sections could be off by as much as a factor of two. Despite these advances, the basic paradoxes as to why so many cap tears occurred in the center of the cap, why ruptures frequently did not coincide with location of PCS and why caps > 65 μm thickness could rupture at tissue stresses far below the 300 kPa critical threshold still remained unresolved. A summary of plaque rupture criteria is provided in Table 1.
Table 1.
Main determinants of Fibroatheroma rupture risk
| Reference | Fibroatheroma Feature | Type of Feature |
|---|---|---|
| Born and Richardson (1989) | Cap elastic modulus & Abundant macrophages | Elastic properties |
| Virmani et al., (2003) | Cap thickness | Morphology |
| Finet et al., (2004) | Lipid core composition | Composition |
| Tang et al., (2004), Akyildis et al.,(2012) | Location and shape lipid pool | Morphology |
| Vengrenyuk et al., (2006) | Stress concentration due to Microcalcifications in caps | Elastic properties, Morphology, Composition |
| Ohayon et al., (2007) | Residual stresses | Elastic Properties |
| Ohayon et al., (2008) | Necrotic core size | Morphology |
| Hosino et al., (2009) | Proximity of calcification to lipid pool | Morphology, Composition |
D. Mechanical properties of atheroma
Plaque rupture occurs when the soft tissue in the atheroma cap is torn, ripped or fissured under the action of high blood pressure.10,18-19 Co-localization of cap fissuring and thrombus formation in the cap tissue was first demonstrated in the studies by Davies and Thomas,18-19 and then ascribed to increased mechanical stresses in the studies by Richardson et al.66 and Born and Richardson.9 Since then, it is widely accepted that plaque rupture would initiate when the ultimate stress (i.e. maximum stress at failure) of the cap tissue is exceeded.9,66 Therefore, accurate knowledge of mechanical properties and stresses developed in both healthy and diseased blood vessels (i.e. elastic modulus and ultimate stress) is critical in analyzing the main biomechanical determinants of plaque rupture. Unfortunately, measurements of elastic modulus and ultimate stress in human arterial tissues are scarce, particularly in atherosclerotic lesions.
Mechanical properties of human atherosclerotic plaques obtained from aorta,45-50 iliac,31 carotid3,22-23,40,43,53,71,80 and coronary vessels16,30,40 are summarized in Table 2. The study by Born and Richardson9 was the first tensile test to determine the elastic modulus of human coronary fibrous caps, and the studies by Lendon et al.47-49 were the first to determine the ultimate stress in the circumferential direction of atheroma caps from the human aorta. Lee et al.45-46 measured the elastic modulus, E, of isolated fibroatheroma caps from the abdominal aorta using cyclic compression tests (900 ± 220 kPa) and unconfined compression tests (82 ± 33 kPa), respectively. Loree et al.50 used a quasi-static creep tensile test to determine E in both abdominal and thoracic aorta atheroma caps in the circumferential direction (2,312 ± 2,180 kPa). The elastic modulus E of carotid samples was also estimated using a nanoindentation test in the study by Ebenstein et al.,23 and in the study by Barret et al.3 The elastic modulus was reported as 270 ± 150 kPa in Ebenstein et al.23 and varied between 21 - 300 kPa, with a mean value of 33 kPa in Barret et al.3 While nanoindentation tests provide valuable information about the material properties of individual plaque constituents, these tests are performed in unconfined compression under small deformations in the radial direction of the atheroma. These results are influenced by the thickness of the atheroma and the presence of lipid under the cap. Also, it does not capture the nonlinear behavior of fibrous plaque tissues at large deformations.
Table 2.
Elastic modulus and ultimate stress of human fibroatheroma.
| Reference | Elastic Modulus (kPa) | Ultimate stress (kPa) | Tissue | Method | ||
|---|---|---|---|---|---|---|
| Lendon et al., 1988 (47) | --- | --- | 12-1,938 | C, Cap | Thoracic aorta, Isolated cap | Uniaxial tensile test |
|
| ||||||
| Lendon et al., 1991 (49) | --- | --- | ~590±100 | C, Healthy | Aorta, Isolated cap | Uniaxial tensile test |
| --- | --- | ~200±50 | C, Cap | |||
|
| ||||||
| Lee et al., 1991 (45) | 510±220 | R, Ce | --- | --- | Abdominal aorta, Isolated cap | Cyclic compression test @ 1Hz, LEM |
| 900±220 | R, HCe | --- | --- | |||
| 2,190±990 | R, Cal | --- | --- | |||
|
| ||||||
| Lee et al., 1992 (46) | 41±19 | NF | --- | --- | Abdominal aorta, Isolated cap | Unconfined compression creep test, LEM |
| 82±33 | F | --- | --- | |||
| 355±245 | Cal | --- | --- | |||
|
| ||||||
| Lendon et al., 1993 (50) | --- | --- | 100 and 500 | --- | Aorta | --- |
|
| ||||||
| Cheng et al., 1993 (13) | --- | --- | 545±160 | C, Hist, Ruptured | Coronary | 2D FEA, LEM |
|
| ||||||
| Loree et al., 1994 (51) | 927±468 | C, Ce | 484±216 | C, Cap | Abdominal / Thoracic aorta, Isolated cap | Quasi-static creep tensile test, QSF Tangential modulus |
| 2,312±2,180 | C, HCe | |||||
| 1,466±1,284 | C, Cal | |||||
|
| ||||||
| Huang et al., 2001 (34) | --- | --- | 286 | C, Hist, Stable | Coronary | 2D FEA, SEDF using Mooney-Rivlin mat. |
| --- | --- | 458 | C, Hist, Ruptured | |||
|
| ||||||
| Holzapfel et al., 2004 (31) | 12,600±4,700 | In, Cal | 179±56 | In, Cal | Iliac | One cyclic quasi-static uniaxial tensile test, followed by single tensile test to failure |
| --- | --- | 489±186 | C, In, NAth | |||
| --- | --- | 944±272 | L, In, NAth | |||
| --- | --- | 255±80 | C, In, Cap | |||
| --- | --- | 469±100 | L, In, Cap | |||
| --- | --- | 777±336 | C, In, F | |||
| --- | --- | 278±98 | L, In, F | |||
|
| ||||||
| Holzapfel et al., 2005 (30) | 8 ± 5 | C, Ad, μ | 1,430±604 | C, Ad, NAth | Coronary Non atherosclerotic | Uniaxial tensile test SEDF using Mooney-Rivlin material |
| 39 ± 33 | L, Ad, k1 | 1,300±692 | L, Ad, NAth | |||
| 1 ± 1 | C, Me, μ | 446±194 | C, Me, NAth | |||
| 22 ± 7 | L, Me, k1 | 419±188 | L, Me, NAth | |||
| 28 ± 11 | C, In, μ | 394±223 | C, In, NAth | |||
| 264 ± 491 | L, In, k1 | 391±144 | L, In, NAth | |||
|
| ||||||
| Ebestein et al., 2009 (23) | 230 ± 210 | Thrombus | --- | --- | Carotid | Indentation test |
| 270 ± 150 | F | --- | --- | |||
| 2,100 ± 5,400 | Par Calc F | --- | --- | |||
| (690 ± 2300)×103 | Calc | --- | --- | |||
|
| ||||||
| Barret et al., 2009 (3) | 33 (21-300) | F | --- | --- | Carotid | Indentation test |
|
| ||||||
| Teng et al., 2009 (81) | --- | --- | 1,996±867 | L, Ad | Carotid | Uniaxial tension test SEDF using first Piola-Kirchoff stress |
| --- | --- | 519±270 | L, Me | |||
| --- | --- | 1,047±536 | L, W | |||
| --- | --- | 1,802±703 | C, Ad | |||
| --- | --- | 1,230±533 | C, Me | |||
| --- | --- | 1,022±427 | C, W | |||
|
| ||||||
| Maher et al., 2009 (54) | 23±34 | C10 | --- | --- | Carotid | Uniaxial tensile test SEDF using Mooney-Rivlin material |
| 65±106 | C01 | --- | --- | |||
| 817±2,441 | C20 | --- | --- | |||
| 206±461 | C11 | --- | --- | |||
| 324±818 | C02 | --- | --- | |||
|
| ||||||
| Claes et al., 2010 (16) | --- | --- | 390±70 | C, W, NAth | Coronary, Non atherosclerotic | Uniaxial tensile test |
|
| ||||||
| Sommer et al., 2010 (72) | 28±14 | L, Whole | --- | --- | Carotid Non atherosclerotic | Extension-Inflation test @ 1.1 stretch |
| 77±23 | L, Ad | --- | --- | |||
| 97±10 | L, Me-In | --- | --- | |||
| 55±9 | C, Whole | --- | --- | |||
| 140±24 | C, Ad | --- | --- | |||
| 129±21 | C, Me-In | --- | --- | |||
|
| ||||||
| Lawlor et al., 2011 (43) | --- | --- | 366±220 | C, W | Carotid | Uniaxial tensile test |
|
| ||||||
| Kural et al., 2012 (40) | 8±3 | L, LM | --- | --- | Coronary | Biaxial tensile test Low and high modulus from 2 linear regions of stress-strain curves. Coronary: LM (15±5), HM (175±25); Carotid LM (7.5±2.5), HM (45±5) kPa |
| 17±19 | C, LM | --- | --- | Coronary | ||
| 97±31 | L, HM | --- | --- | Coronary | ||
| 90±39 | C, HM | --- | --- | Coronary | ||
| 1±0 | L, LM | --- | --- | Carotid | ||
| 1±0 | C, LM | --- | --- | Carotid | ||
| 5±0 | L, HM | --- | --- | Carotid | ||
| 6±1 | C, HM | --- | --- | Carotid | ||
Abbreviations: Cellular (Ce), hypocellular (HCe), calcified (Cal), Fibrous (F), Non-Fibrous (NF), Longitudinal (L), Circumferential (C), Radial (R), Non-atherosclerotic (NAth), Histology cross section (Hist), Linear elastic model (LEM), Cubic strain function (QSF), Finite element analysis (FEA), Strain energy density function (SEDF),
Cij, i+j=1,2 material constants of hyperelastic model. Fraction numbers were rounding to its nearest whole integer value.
Holzapfel and coworkers performed uniaxial tests on separated layers of the iliac artery using one cyclic quasi-static tension test, followed by a tensile test to failure31 in both circumferential and longitudinal directions. They reported the E only for isolated intima layer samples with macrocalcifications (12,600 ± 4,700 kPa) because this was the only layer that exhibited a linear stress-strain curve. Kural et al.40 measured the elastic moduli along the longitudinal and circumferential directions in coronary and carotid vessels using a biaxial tensile test. Here, a linear regression was used to calculate both high (90 ± 39 kPa) and low (17 ± 19 kPa) modulus in different linear regions of the stress-strain plots, within a low or high range of stress (see Table 2). For comparison with diseased tissue, we included the studies in non atherosclerotic tissue by Holzapfel et al.30 and Sommer et al.71 The former study used a uniaxial tensile test and reported a modulus of 28 ± 11 kPa in the circumferential direction of the intima layer. The later study used an extension-inflation test to determine E in the adventitia and media-intima layers from non atherosclerotic carotid arteries, reporting 97 ± 10 kPa for the longitudinal direction and 127 ± 21 kPa in the circumferential direction, indicating that healthy tissue is much more compliant than atherosclerotic tissue.30,71 Tensile studies have shown that large deformation tests of atheroma caps, isolated layers of atheromas, and whole atheromas showed a nonlinear behavior, and therefore the stress-strain relationship is not properly described by a single elastic constant (Young modulus). Instead, this nonlinear behavior has been studied30,40,53,71 using different hyperelastic material constitutive models (Fung, Choi-Vito, Mooney-Rivlin, etc.), in which the strain energy density function is a linear combination of the invariants of either Cauchy-Green, 1st or 2nd Piola-Kirchoff deformation tensors.
The ultimate stress in human aorta was first determined in the studies by Lendon et al.,47-49 reporting a large range of variability and a decreased ultimate stress in diseased tissue when compared to healthy tissue. In the subsequent study by Loree at al.,50 the ultimate stress 484 ± 216 kPa, was found similar to the ultimate stress reported by Holzapfel et al.31 in non-atherosclerotic tissue tested in the circumferential direction, 489 ± 186 kPa. Holzapfel also found that the ultimate stress for an iliac artery containing an atheroma (255 ± 80 kPa) was about half the ultimate stress of healthy tissue. Importantly, atheroma containing calcified tissue failed at two thirds the ultimate stress required to rupture atheroma without calcification, indicating that macrocalcification could play a role in plaque vulnerability. In a subsequent study Holzapfel et al.30 reported the ultimate stress of human non-atherosclerotic coronary arteries to be 394 ± 223 kPa, similar to values reported by Claes et al.16 obtained in the circumferential direction, 390 ± 70 kPa. The ultimate stress was also derived from histology of ruptured coronary atheromas from reconstructed images of the approximate morphology before rupture and analyzed using 2D linear elastic FEA in Cheng et al.13 The average ultimate stress in Cheng et al.13 was 545 ± 160 kPa, in agreement with the experimental measurements by Lendon et al.48-49 However, it should be noted that the elastic modulus used in this study was the one obtained using compression tests by Lee et al.,45 which differs from tensile tests. FEA was also used in the study by Huang et al.34 considering large deformations, in which the tissue material properties were described by the Mooney-Rivlin hyperelastic solid material model. The ultimate stress in Huang et al.34 was 286 kPa in stable lesions and 458 kPa in ruptured samples. Ultimate stress measurements in whole (intact) carotid samples under uniaxial tensile test were reported in the circumferential direction as 1,022 ± 427 kPa by Teng et al.,80 402 ± 339 kPa by Maher et al.,53 and 366 ± 221 kPa by Lawlor et al.43
E. Imaging modalities
Diverse imaging technologies have been used to investigate morphology and composition of atheromatous plaque. There are three main types of non-invasive imaging technologies used in vivo, including Cardiac Computed Tomography (CT),14,37,39,57 Cardiac Magnetic Resonance (MRI)15,89 and Single Positron Emission Computed Tomography (SPECT).68,70,74,81 Clinical CT has shown potential to identify soft, intermediate and calcified plaques, as well as spotty macrocalcifications. MRI has the ability to identify different tissue densities present in the necrotic core, fibrous cap and tissue inflammation. These imaging approaches allow a rapid, non-invasive identification of advanced lesions. However, their main limitation is the resolution, ~250μm for CT, ~400μm for MRI, and 1000μm for SPECT, which does not allow identifying neither early plaques nor thin caps prone to rupture. Therefore, invasive vascular imaging approaches have been developed to achieve in vivo and ex vivo images with greater contrast and resolution. Among current invasive in vivo approaches we can include Intravascular Ultrasound (IVUS),52,64 IVUS Elastography,20,69 Virtual Histology and Tissue Characterization,58,67 Optical Coherence Tomography,63,88 Near Infrared (NIR) Spectroscopy,56 Intracoronal Magnetic Resonance Imaging (MRI),41-42 and Molecular Imaging (MI).59 Ultrasound based approaches can provide morphology, tissue characterization (i.e. fibrotic, lipid, calcification, etc.) and mechanical properties; however, current clinical systems at 40-45 MHz have an axial resolution of about 80-100 μm, and lateral resolution of 200-250 μm, which is limited in distinguishing thin caps. OCT has a much greater resolution than IVUS, reaching ~15 μm axial resolution, and provides information on tissue composition. The drawback of OCT is its limited depth of penetration and the light scattering due to red blood cells. The latter requires “flushing” the artery with a transparent saline solution to image the vessel wall.
The key role microcalcifications play in plaque biomechanics has become evident since the studies by Vengrenyuk and coworkers,36,54-55,82-84 in which the use of high resolution micro computed tomography (μCT) was introduced. Prior to 2006 there was no apparent need for 3D imaging of an entire vessel preserving cellular level microcalcifications. Nearly all studies of coronary artery calcification were based on macrocalcifications that could be seen using available in vivo imaging techniques IVUS, MRI and OCT. Except for OCT, the two main in vivo imaging modalities, IVUS and MRI, detected primarily mm size calcifications and the rough boundaries of lipid pools. The gold standard for visualization was histology, which required fixation, dehydration and/or some degree of decalcification before paraffin embedding to allow for sectioning. The most important limitation was that one was restricted to a small number of 2D sections and was, therefore, unable to obtain 3D reconstructions of entire and intact lesions. At the electron microscopic level one could see 100-300 nm matrix vesicles a small fraction of which were calcified.1,7 The catalyst for developing such an imaging technique was the microcalcification hypothesis described in the next section.
High resolution μCT is highly sensitive to calcified tissue, and has been shown to also distinguish lipid from necrotic core and soft tissue in human coronary arteries.36,54-55,82-84 The μCT image taken from Vengrenyuk et al.83 and shown in Figure 2 was the first use of μCT to visualize cellular level μCalcs in human coronary vessels. In Figure 2, a cross section of a human atherosclerotic lesion that exhibits three cellular-level μCalcs of approximately 10-20 μm diameter in the cap and numerous calcified deposits at the bottom of the lipid pool (7μm resolution). The imaging and characterization of hundreds and even thousands of μCalcs using μCT has been refined in recent studies36,54-55 with up to ~2μm resolution. This greatly enhanced resolution has enabled one to quantify the number, location, shape, clustering and degree of mineralization of microcalcifications in unprocessed (non-dehydrated, infiltrated nor embedded) whole coronary vessels (see subsection F.c).
Figure 2.
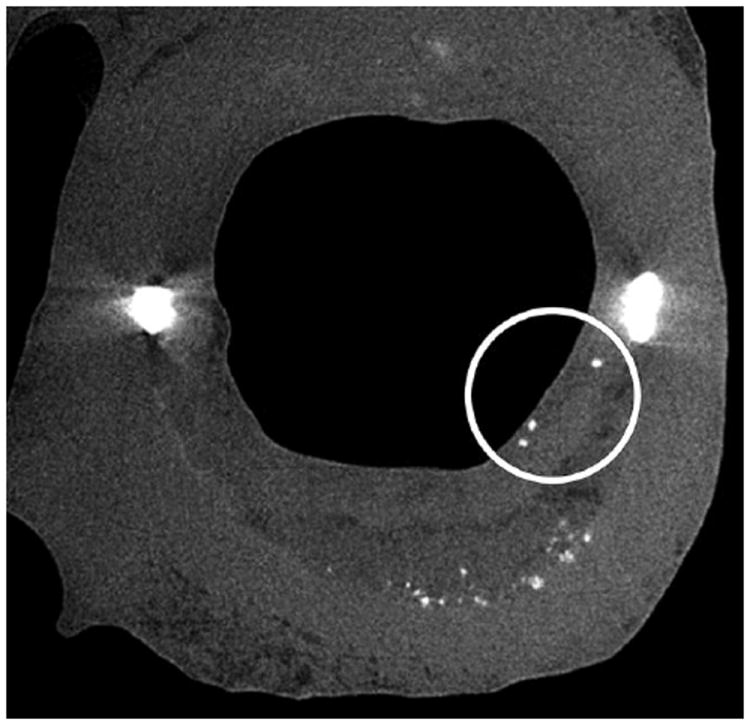
μCT detection of cellular-level microcalcifications in a fibrous cap. A cross-section of the lesion with cellular-level microcalcifications ~15 to 20-μm diameter in the cap (circled) and numerous calcific deposits at the bottom of the lipid pool shown by arrows (7-μm resolution). (Reproduced with permission from Vengrenyuk et al., Proc Natl Acad Sci U S A 2006 103(40):14678-14683).
F. Microcalcification hypothesis
a. Initial formulation of the microcalcifiction hypothesis
The inability to explain the basic paradoxes mentioned at the end of section C led to a search for a new paradigm for cap rupture. The fundamental question asked was whether there were cellular level calcifications in the fibrous cap proper that lied below the resolution of the three main in vivo imaging modalities IVUS, MRI and OCT, and therefore, had not previously been seen, that could act as local stress concentrators. The basic idea was suggested by the rupture of rubber tires due to small solid impurities in the 1920’s when balloon tires were first introduced.29 Goodier in a now classic paper had shown that solid spherical inclusions in an infinite elastic medium caused a doubling of the local stress along the poles of the tensile axis for a unidirectional applied force. Vengrenyuk et al.83 developed an equivalent analytical model for a spherical calcified inclusion in a thin fibrous cap of uniform thickness. This analysis showed that with small differences a near doubling of the stress would occur at the poles of the inclusion and, surprisingly, this result was nearly independent of the size of the inclusion and its asymmetry within the cap.
The prediction in Vengrenyuk et al.83 is shown in Figure 3 where the increase in PCS is shown as a function of cap thickness for three different cases, a cap without a microinclusion using the 2D FEA in Finet et al.25 curve 1, and how this PCS would increase for a solid spherical inclusion of 10 and 20 μm diameter, curves 2 and 3, respectively. The key observations are that caps significantly thicker than 65 μm could exceed the 300 kPa threshold for rupture if they contained μCalcs, curves 2 and 3, and that the cap thickness required to achieve an average rupture stress of 545 kPa was ~ 75 μm if μCalcs were present and not 25 μm as predicted for a cap without μCalcs. These results assume that the inclusions are located in a region where the background tissue stress without the spherical μCalcs was close to the PCS of curve 1. Furthermore, with a local doubling of the local tissue stress one now had a plausible explanation as to how caps could rupture at their center where the background stress would seldom exceed the 300 kPa threshold.13,25,29,36,55,62
Figure 3.
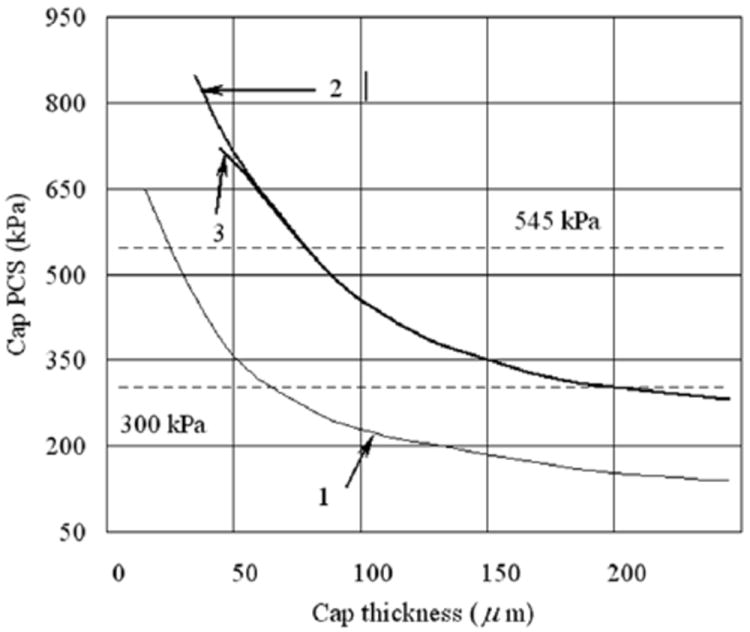
Changes in cap peak circumferential stress (PSC) with cap thickness for the case when cap tissue is homogeneous (line 1) and when it contains a rigid inclusion of 10 and 20 μm in diameter (lines 2 and 3 respectively). (Reproduced with permission from Vengrenyuk et al., Proc Natl Acad Sci U S A 2006 103(40):14678-14683).
The foregoing theoretical predictions were the catalyst for developing new imaging tools for searching for μCalcs in the fibrous cap proper. While small cellular level calcifications had been reported in histological studies72-73,85 these had largely been associated with lipid pools. These local regions had been observed in IVUS24, where they were referred to as spotty calcification, and in histology where they were defined as diffuse calcification.26,86 The fact that one could see μCalcs using HR-μCT, as shown in Figure 2, was an important breakthrough since μCalcs in the cap proper were thought to be rare, and therefore, hard to find by either histology or confocal sectioning. In Vengrenyuk et al.83 five vulnerable lesions were identified at 6.7 μm resolution and in only one of these five did one observe distinct cellular size μCalcs in the cap proper as shown in Figure 2. The three 15-20 μm μCalcs in Figure 2 were believed to be macrophages or smooth muscle cells that had undergone apoptosis and subsequently calcified. In contrast, the numerous μCalcs observed in the lipid pool in Figure 2 can be thought of as floating debris, and thus, not dangerous.
The ability to obtain detailed 3D in vitro images of entire coronary vessels, their lipid pool boundaries and μCalcs down to the cellular level made it possible to develop high resolution models for 3D numerical analysis. The first such model using patient-specific 3D reconstruction of coronary vessels is described in Vengrenyuk et al.82 Using three different levels of subnesting involving more than a million tetrahedral elements at each level, one was able to predict the stress distribution throughout the tissue including the local region surrounding each of the three μCalcs in Figure 2. The results in Vengrenyuk et al.82 confirmed the doubling of the local tissue stress at the tensile poles of the μCalcs, showed that μCalcs in close proximity could significantly increase the stress in the tissue region between them and that elongated ellipsoidal μCalcs could increase the tissue stress by a factor of four or more when they were aligned along the tensile axis. In Bluestein et al.6 a 3D FSI simulation was developed for larger μCalcs and then refined and applied to the patient-specific 3D reconstruction of the coronary artery in Figure 2 of Rambhia et al.65 The results of the 3D FEA and the FSI model agreed closely. The FSI simulation had the additional feature that it could predict fluid shear stresses (FSS) and relate these stresses to the time varying pressure in the lumen. While FSS on endothelial cells are typically five orders of magnitude less than the tissue stresses required for cap rupture, they play an important role in LDL permeability and atherogenesis.78
The microcalcification hypothesis initially had limited acceptance, because the sample size in Vengrenyuk et al.83 was small and it was hard for investigators to understand how such small solid inclusions could cause rupture when macrocalcifications several orders of magnitude larger, as described in section B, did not correlate with cap rupture. These concerns were addressed in a much more comprehensive recent study in Maldonado et al.,55 where 62 non-ruptured fibrous cap atheroma were examined in 92 of the three major coronary arteries, at the same 6.7-μm resolution μCT used in Figure 2. These 92 arteries had on average 4,160 μCalcs, 85% μCalcs < 50 μm, the vast majority residing in lipid pools. Only 0.2% of these μCalcs (81 total) were in the fibrous cap proper where they could act as tissue stress concentrators. Strikingly, all 81 of the imbedded μCalcs were confined to just nine (15 percent) of the 62 fibroatheroma and their average size was 28 ± 13 μm. The remaining 53 non-ruptured atheroma had no visible μCalcs at 6.7-μm resolution μCT, the thinnest non-ruptured cap being the 66 μm specimen described below.
Three-dimensional FEA was performed on all 81 of the μCalcs described above and the thinnest cap (66 μm cap) without visible μCalcs. The highest predicted tissue stress for all 81 μCalcs was 275 kPa, confirming the 300 kPa threshold for rupture proposed in Cheng et al.13 and, as mentioned in section B, FEA predicted that this cap would need to thin to 30 μm in order to reach the 300 kPa threshold, yet there was not a single non-ruptured cap between 30 and 66 μm. Maldonado et al.55 conjectured that this paradoxical observation could be explained if all caps between 30 and 66 μm had ruptured, not due to their thickness, but due to the presence of μCalcs that were just not visible using 6.7-μm resolution μCT. This hypothesis is discussed in section F.c. The spatial distribution of the 81 μCalcs within their respective caps was determined and 42% were observed to occur in the cap mid-region correlating well with the 37% of tears found in the cap center.52,66
b. The rupture mechanism; cavitation or interfacial debonding
While the microcalcification hypothesis can explain why caps can rupture where the background tissue stress is not maximum, e.g. the cap center, it does not describe the actual rupture mechanism other than defining a minimum value of the PCS where this should occur. Why from basic mechanics does one have a 300 kPa threshold? In Vengrenyuk et al.83 it was proposed that rupture was triggered by an interfacial debonding at the tensile poles of the microinclusion due to a large mismatch in the elastic moduli E of the tissue and the μCalc. In interfacial debonding a small detachment or void at the tensile poles of the particle will explosively grow if the energy stored in the deformed tissue near its poles exceeds the bonding energy of the tissue adhesions at the inclusion interface, frequently referred to as the Griffith criterion.27-28 This critical debonding stress is denoted as σd. The other mechanism is cavitation in a hyperelastic medium, not to be confused with cavitation in a liquid where a bubble will grow when it is subjected to pressures at or below its vapor pressure. In cavitation in a hyperelastic medium a tiny void, such as a gas bubble within the connective tissue itself, will grow when the tensile forces exceed the elastic strength of the tissue to hold itself together. Experiments in polymeric materials have shown for a particle > 20 μm under triaxial tension this critical stress for cavitation σc ~ 5/6 E.28 However, the presence of a void as a free surface in the tissue creates a surface tension γ that opposes the growth of the void. Initial voids of radius ‘a’ rarely exceed r/10, where r is the particle radius.28 However, they add an additional term 2γ/a to σc that can grow larger than 5/6 E as the void decreases in size. The theory for predicting which failure mechanism will occur, interfacial debonding or cavitation, is described in detail in Maldonado et al.54
The preferential mode of failure is determined by the size of the μCalc, the strength of the bond between the μCalc and the tissue, the size of the initial void and the Young’s modulus of elasticity E. For a particle of a given size, cavitation will occur if σc < σd, and the reverse is true for σd < σc. In Figure 4 we have plotted curves of σc and σd for representative values of E, γ, and void radius ‘a’ as a function of effective particle diameter. The horizontal lines are the rupture threshold stress 300 kPa and the average rupture stress of 545 kPa experimentally predicted in Cheng et al.13 Three important results are observed in Figure 4. First, σc < σd for all particles < 65 μm. The largest of the 81 μCalcs observed in the fibrous caps in Maldonado et al.55 was 50 μm indicating that cavitation is clearly the preferential mode of failure. Second, for the most widely used value of E, 500 kPa, 5/6 E is 416 kPa, a value that agrees well with the average rupture stress summarized in section D, and also falls nearly in the middle of the two horizontal lines for the threshold and average stress values for rupture reported in Cheng et al.,(13) again strongly indicating cavitation as the mode of failure. Third, as the particle size falls below ~ 5 μm, σc rises rapidly exceeding the average rupture stress due to the large surface tension energy required for a very small void to grow. This will be particularly important in the subsection, F.c, where thousands of very small μCalcs derived from matrix vesicles in the cap proper are discussed. Finally, while it is not currently possible to observe tiny initial voids, one does occasionally see larger voids in thick caps where the void started to grow in a region of high local stress and then spread to a region of less stress where it stabilized without breaking through the cap to the lumen of the vessel. Figure 5 is the first direct experimental evidence of this behavior where two voids were created in the space between neighboring μCalcs which then merged and stabilized without causing final cap rupture.54
Figure 4.
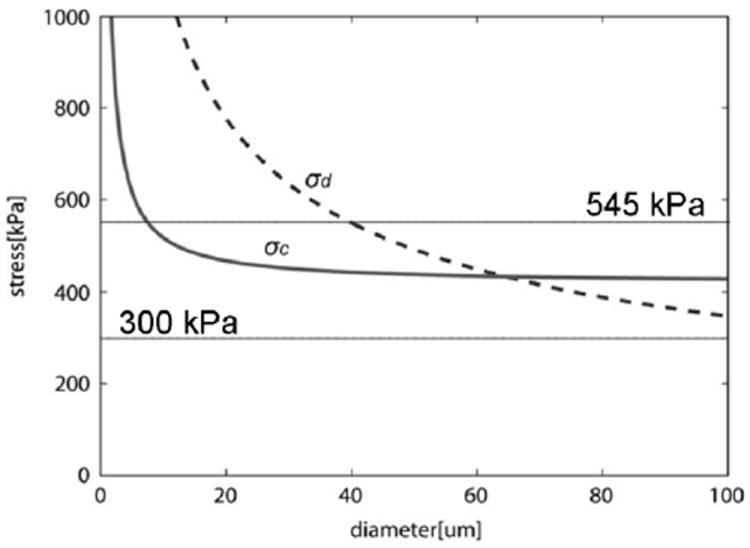
Calculated cavitation and debonding stress threshold vs. diameter of μCalc (θ = 5°, Ga = 0.5 J/m2). Figure shows that for μCalcs < 70μm σc < σd, and cavitation should be the preferential mode of failure (rupture of the fibrous cap), and for very small calcifications D < 5μm no cavitation nor debonding would occur. Solid horizontal lines indicate minimum and average rupture thresholds 300kP and 545kPa (Cheng et al. 1993). (Reproduced with permission from Maldonado et al., J Biomech 2012 46(2):396-401).
Figure 5.
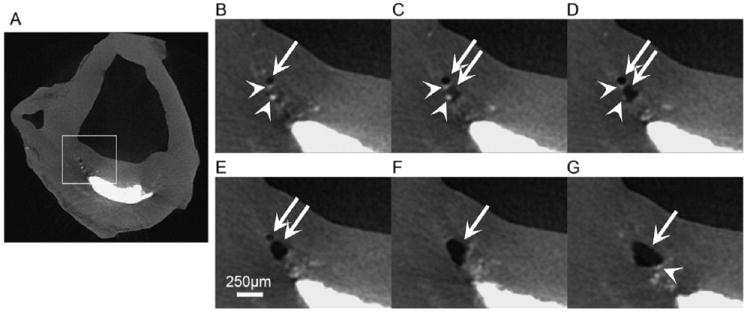
μCT images at 6.7 μm resolution showing a bubble (white arrow) growing in a fibrous cap in the vicinity of μCalcs (arrow heads). (A) Dark area corresponds to air, gray to soft tissue and bright areas are calcifications. (B) Images corresponding to highlighted area in panel A, (C-D) sequence of images 67 μm apart from panel B (Scale bar is 250 μm).
c. Revised formulation of microcalcification hypothesis
The conjecture that the 81 μCalcs observed in the fibrous cap proper in Maldonado et al.55 were just the tip of the iceberg was the catalyst for a much more detailed study at 2.1 μm μCT resolution36 where it was possible to observe all μCalcs > 5 μm with particular emphasis on just those in the fibrous caps. In addition, one was able using non-decalcified histology to observe even smaller μCalcs between 0.5 and 5.0 μm to provide the critical connecting link between the agglomeration of calcified matrix vesicles1,7,33 and the smallest μCalcs visible at 2.1 μm resolution μCT. This latest study has brought the analysis into a different realm and has led to a major revision of the original μCalc hypothesis. This study, using the same 92 coronary vessels as Maldonado et al.,55 has led to the identification of nearly 35,000 μCalcs in 22 caps including the nine caps where the original 81 μCalcs were observed. At this higher resolution one was able to identify four more lipid pools, raising the number of fibroatheroma to 66.
The reasons for the huge difference in the number of visible μCalcs in the two studies is clearly seen by comparing panels A and B in Figure 6, the same section at 2.1 and 6.7 μm resolution. First, at 6.7 μm resolution the average size of the μCalcs observed was 28 ± 13 μm, the smallest visible μCalcs being ~ 15μm. In the study by Kelly-Arnold et al.,36 80% of the visible μCalcs were between 5 and 15 μm. Second, what was thought to be a single inclusion at 6.7 μm resolution was in many cases a cluster of smaller μCalcs. These clusters we shall now show are particularly important. While one could analyze 81 μCalcs using optimized 3D FEA this was clearly impossible for 35,000 μCalcs and a new simplified quantitative approach had to be developed. In Vengrenyuk et al.83 and Maldonado et al.54 it was realized that the stress in the region between two μCalcs could be substantially increased if the particles were in close proximity and aligned along their tensile axis, the alignment for the maximum increase in stress. Maldonado et al.54 also show using 2D FEA that that the increase in stress in the region between μCalcs is relatively insensitive to the size of the particles and the thickness of the cap, and that the maximum increase in stress could be approximated by a single dimensionless ratio h/D, where h is the gap between particles and D their effective diameter. A 3D FEA was then conducted for spherical μCalcs between 15 and 40 μm diameter as a function of h/D for a cap of 140 μm thickness.36 These results are shown in Figure 7A and compared with the results of the 2D simulation in Maldonado et al.54 One observes that for h/D ≥ 1.0 the stress concentration factor (SCF) is roughly two, the same as for a single spherical μCalc, that the increase in tissue stress rises sharply for h/D < 0.5, and that for h/D < 0.4 the SCF is > 5.0. The detailed stress field is shown in Figure 7B where a 45% strain develops in the region between the particles when h/D = 0.3 and the particles are aligned along the tensile axis. When the tensile force is applied transverse to the particle axis the initial gap narrows by 30% and the region between the particles is in compression, rather than tension.
Figure 6.
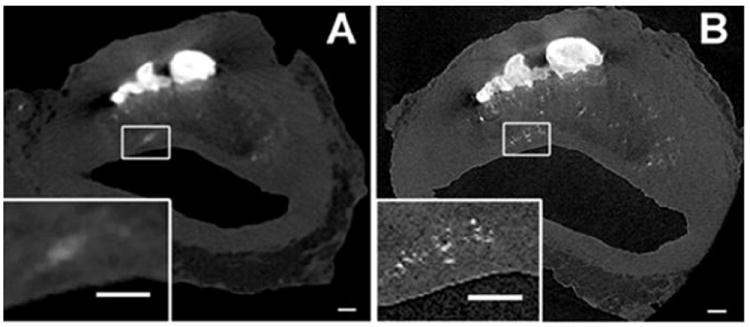
High resolution μCT images of human coronary atheroma with μCalcs embedded in the fibrous cap proper. Panel A shows images scanned at 6.7-μm resolution. B was scanned at 2.1-μm resolution. Multiple μCalcs in the cap are visible in panel B magnified view, previously undetected in panel A. Magnified view of panels A and B show the difference between what appears to be a single μCalc at 6.7-μm and μCalc clusters when viewed at 2.1-μm resolution. Scale bar = 200 μm. (Reproduced with permission from Kelly-Arnold et al., Proc Natl Acad Sci U S A).
Figure 7.
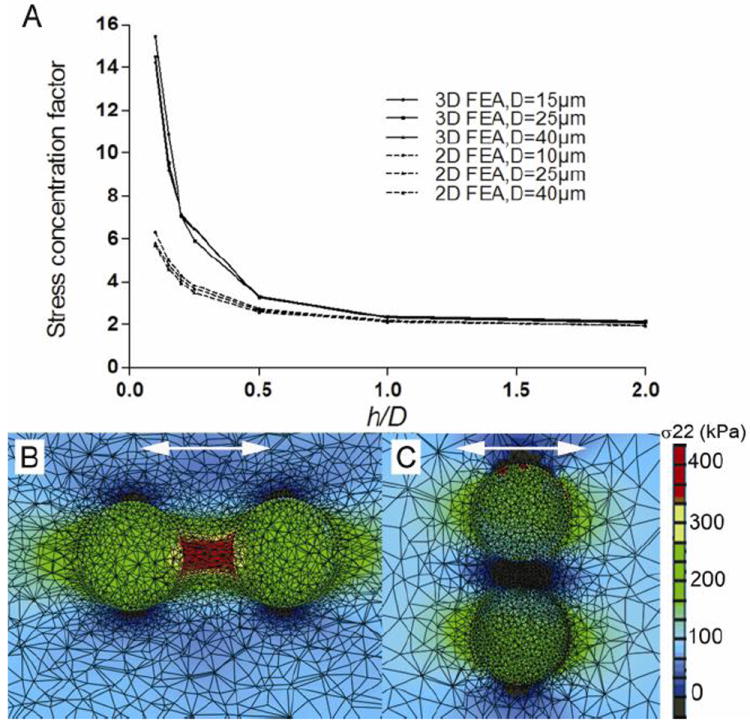
A) 3D FEA results of stress concentration factor calculated for the area between two particles located along the tensile axis in a fibrous cap. Stress concentration factor rises exponentially when the distance between the two spherical μCalcs decreases. Results are compared with previous 2D FEA reported in Maldonado et al. 55. B and C show FEA results for particles with initial h/D=0.3 oriented along and transverse the tensile axis respectively. (Reproduced with permission from Kelly-Arnold et al., Proc Natl Acad Sci U S A).
The results in Figure 7A provide for an enormous simplification of the tissue stress analysis. One can estimate the maximum increase in the SCF just by determining the h/D for all particle pairs, computing the background stress for the lesion geometry without the microinclusions and then applying the SCF. This simplified approach for estimating the PCS has made it possible to analyze all 35,000 μCalcs in the 22 fibrous caps in36 in less than one hour of computer time. The first remarkable result shown in Figure 8 was that there were only 193 μCalc pairs with h/D < 2.0 and of these pairs only three had an h/D < 0.4 where the SCF would be > 5 if the particles were located along the local tensile axis. Two of these three pairs were in a thick region of the cap where the background stress was low and in the third pair the μCalcs were oriented more transverse than parallel to the tensile axis, the net result being that there was not a single μCalc pair among the 35,000 μCalcs observed where the threshold stress of 300 kPa was exceeded. When these results for μCalcs > 5 μm are combined with the requirements for cavitation, which show that μCalcs < 5 μm are not dangerous because of the large surface energy of their voids, see Figure 4, one has a very plausible explanation as to why none of the 66 fibroatheroma examined in Kelly-Arnold et al.36 ruptured. Detailed results for all 22 caps with μCalcs > 5 μm visible at 2.1 μCT resolution are presented in Kelly-Arnold et al.36
Figure 8.
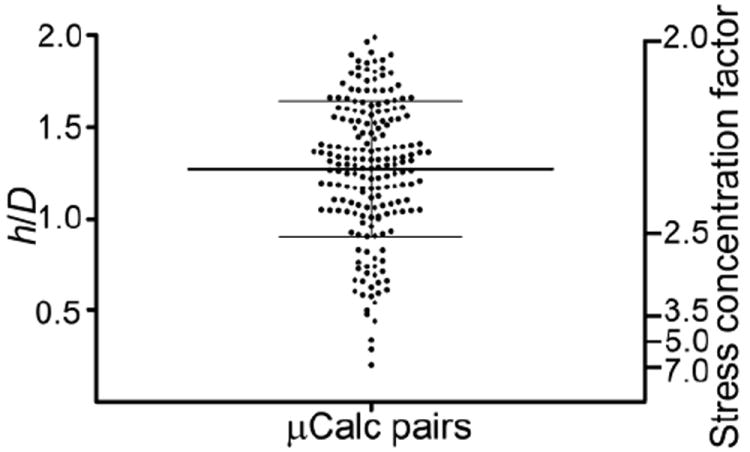
Ratio h/D for 193 pairs of μCalcs embedded in fibrous caps where h/D < 2, and the corresponding stress concentration factor when embedded in a fibrous cap along the tensile axis. Lines indicate mean ± SD. (Reproduced with permission from Kelly-Arnold et al., Proc Natl Acad Sci U S A).
The non-decalcified histology in Kelly-Arnold et al.36 revealed that nearly all of the 44 remaining fibrous caps had μCalcs that were < 5 μm and, thus, too small to detect at 2.1 μm resolution μCT. As already explained, these very small μCalcs are not dangerous but they do provide crucial insights into how μCalcs grow and agglomerate starting as matrix vesicles and also their typical shape after they have grown to a size large enough, ~5μm, to be seen at 2.1 μm resolution μCT. Figures 9A, which is a TEM from E. Aikawa’s laboratory, and 9B, which is from our own laboratory using von Kossa stain show μCalcs embedded in a mouse atheroma and human fibrous cap, respectively. Both μCalcs have a shape consistent with the agglomeration of several enlarged cell-derived matrix vesicles where the region beneath membrane has started calcifying after coalescence. As observed in Figures 9A and 9B an elongated μCalc is an agglomeration of smaller calcified particles which individually have the shape of ellipsoids of revolution. These figures strongly suggest that the matrix vesicles described in Bobryshev et al.7 first fuse to form larger vesicular bodies typically 1-2 μm diameter that then calcify and agglomerate. Calcification appears to start at the membrane and then may proceed inward. Even at 2.1-μm resolution μCT it is difficult to image the shape of small μCalcs. However, volume and sphericity measurements indicate that 65% of the μCalcs have an aspect ratio > 2.
Figure 9.
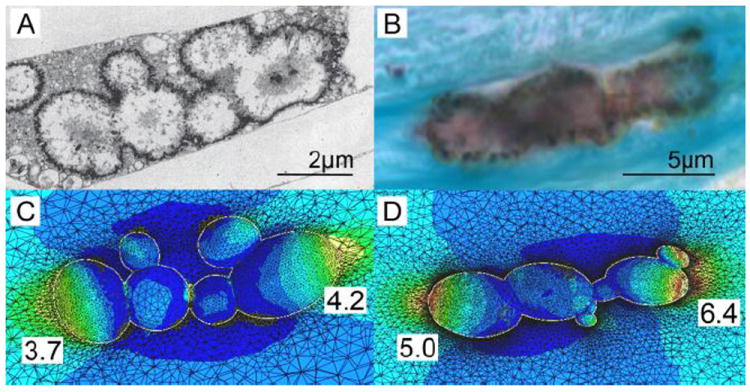
TEM and histology based FEA. A) TEM image of aggregated calcifying matrix vesicles forming μCalcs in a mouse atheroma. B) Image of a μCalc embedded in a human fibrous cap, obtained from non-decalcified histology, stained von Kossa. C) and D) Stress distribution at the interface of the μCalcs in A and B respectively, assuming they are embedded in fibrous caps under tension. Numbers show calculated stress concentration factor at the poles. (Reproduced with permission from Kelly-Arnold et al., Proc Natl Acad Sci U S A).
While there appears to be general agreement that the threshold stress for rupture is 300 kPa, can this threshold be achieved in the absence of μCalcs and, in particular, at the ‘shoulders’ of a lesion where ~60% of ruptures occur and the cap is often thinnest. Prior to 2005 all such estimates were based on 2D FEA as shown by curve 1 in Figure 3. While curve 1 intersects the 300 kPa threshold at 65 μm thickness, where Virmani et al. (86) predicted that 95% of caps would rupture, this estimate has been greatly changed as a result of more recent 3D FEA. Ohayon et al. (63) were the first to show that 2D FEA overestimated PCS on average by 73%, 113.8 kPa compared to 65.6 kPa for 3D FEA, and that the 2D analysis was an unreliable predictor of the actual rupture site. In other words curve 1 in Figure 3 should lie significantly below where it is now shown and if the PCS were corrected by this 73% factor the revised curve 1 would intersect the 300 kPa threshold at ~ 30 μm. A similar prediction is reported in Table 3 of Kelly-Arnold et al. (36) where a cap thinned to 35 μm at its shoulder without rupturing and the predicted PCS was 313 kPa, very close to the 300 kPa threshold. This cap had over 600 μCalcs > 5μm but the shoulder itself was devoid of μCalcs. This cap was the thinnest of the 66 non-ruptured caps reported in ref. (36). Thus, caps can rupture at their shoulders when they thin to 30-35 μm in the absence of μCalcs, but it is clear that this risk would be far greater if even a single μCalc with effective diameter > 5 μm were present.
Table 3.
Imaging technologies used to identify and characterize the morphology and composition of atheromas.
| Technology | Resolution | 2D / 3D | In vivo /Ex vivo | Clinical / Research | Comment |
|---|---|---|---|---|---|
|
| |||||
| MRI | ~400 μm | 3D | In vivo | Clinical | Diagnosis of coronary stenosis and macrocalcifications - Non invasive but expensive - Cannot resolve plaque morphology |
| CTA | ~250 μm | 3D | In vivo | Clinical | Diagnosis of stenosis and calcifications - Non invasive, significant dose of ionizing radiation - Cannot resolve plaque morphology |
| IVUS | ~50 μm | 3D | In vivo | Clinical | Provides plaque morphology, tissue composition and elastography |
| OCT | ~15 μm | 3D | In vivo | Clinical | Provides plaque morphology and tissue composition |
| MI | ~5 μm | 2D / 3D | Ex vivo | Research | Assessment of inflammation and/or cells expressing specific antigens |
| μCT | ~1 μm | 3D | Ex vivo | Research | Incoherent X-ray light, relatively large field of view |
Abbreviations: Computed tomography angiography (CTA), magnetic resonance imaging (MRI), intra vascular ultrasound (IVUS), optical coherence tomography (OCT), molecular imaging (MI), bioluminescence (BL), micro-computed tomography (μCT).
Collectively, these recent results have led to a major modification of the original microcalcification hypothesis in Vengrenyuk et al.83 μCalcs in fibrous caps are not rare but numerous, that they are not calcified macrophages or smooth muscle cells, but an agglomeration of cell derived calcified matrix vesicles, that the SCF depends critically on their spacing and orientation, and that there is a minimum critical size ~ 5 μm for them to be potentially dangerous.
G. Conclusions
a. Main determinants of plaque rupture
Recent studies have provided evidence indicating that plaque’s morphology, tissue composition and tissue elastic properties, all play a role in fibroatheroma rupture. Mechanical properties of atheroma tissues (i.e. non-linear stress-strain behavior, ultimate stress, anisotropy, hysteresis, viscoelasticity, poroelasticity, etc.) are a consequence of both tissue composition and ultrastructure of the vessel layers. In addition to the cap thickness, the tissue modulus, lipid core composition, necrotic core size, location and shape of lipid pool, residual stresses, proximity of calcifications to the lipid pool, and most importantly, microcalcifications in the fibrous cap need to be considered as determinants of plaque rupture.
b. Material properties
Overall, data from the studies in table 2 indicate that the mechanical behavior of human atherosclerotic plaques is non-linear, time/rate dependent (i.e. viscoelastic and poroelastic), reliant on the composition of the layer and the type of artery tested, anisotropic (direction dependent), and its loading-unloading path exhibits hysteresis. The elastic modulus seems to also be dependent on the measurement technique and the approach used to estimate the tissue modulus (i.e. compression, tension, biaxial, dynamic testing, nanoindentation, inflation test, etc.). Elastic moduli of atherosclerotic (fibrotic) plaques in table 2 exhibit a large range of variability (1-2,300 kPa), with an average value of ~530 kPa. Studies reporting both healthy and disease tissue indicate that plaques are always stiffer than non-diseased tissue. Also, the modulus in the intima and adventitia is higher in the axial direction than in the circumferential direction, and the opposite is true for the media layer. The ultimate stress measured in healthy and atheroscleritic plaques presented in Table 2 also exhibit a large range of variability (~100-1,000 kPa), with an average value of ~500 kPa. The ultimate stress measured in atherosclerotic plaques is generally lower than in healthy tissue and depends on both morphology and tissue composition of the vessel and atheroma. While the causal relationship between local maximum stress and plaque rupture is supported by both experimental data and FEA studies, further experimental studies are needed to better understand plaque rupture mechanisms and for improved prediction of plaque rupture risk.
c. Improved imaging of atherosclerotic plaques
Both OCT and IVUS keep continuing to improve their contrast, penetration depth and lateral resolution. However, current imaging technologies are still below the optimal level of imaging resolution to well identify vulnerable from non vulnerable plaques in vivo. The role that microcalcifications play as stress concentrators in fibrous caps requires improving imaging technologies to identify the size and location of such microcalcifications, and their effect on increasing plaque rupture risk.
d. Effect of microcalcifications on cap vulnerability
The overall effect of microcalcifications in plaque vulnerability can be summarized as an intensifier of the background circumferential stress in the cap. The stress concentration factor (SCF) produced by μCalcs does not depend on the specific μCalc location within the cap (center or shoulders); it is now known that it depends on the size and shape of the μCalc as well as the proximity between two or more μCalcs where the SCF, which is typically in the range of 2-5, can exceed five or more if the μCalcs are very closely spaced and aligned along the tensile axis of the cap. In turn, the magnitude of the background stress in the cap depends on the atheroma morphology (i.e. cap thickness, necrotic core size, location and shape of lipid core) and tissue composition (i.e. lipid core composition, residual stresses). Therefore, if the cap has no μCalcs, the cap needs to thin to ~30μm to reach the rupture threshold and become prone to rupture. Also, if μCalc(s) are located in caps with very low background stress, the increase in stress concentration produced by μCalcs may not be sufficient to reach the rupture threshold. However, the presence of μCalc(s) in the cap with a background stress of about one fifth - one half the rupture threshold (a stable plaque), will produce a significant increase on local stress, which may exceed the cap rupture threshold, and thus transform a non vulnerable plaque into a vulnerable one.
e. Experimental evaluation of the microcalcification hypothesis
A number of studies have demonstrated the existence of thousands of microcalcifications in fibroatheromas. Analytical and numerical studies in patient specific atheromas scanned at high resolution using μCT indicate that individual spherical μCalcs increase the risk of cap rupture by a factor 2 when they are located within the cap, and by a factor > 5 when they are clustered, with h/D < 0.4 and oriented along the tensile axis in the circumferential direction. Importantly, the effect of stress concentration by microcalcification is much higher than the effect produced by changes in elastic properties of the tissue alone. An experimental evaluation of the ultimate stress of atheromas with and without microcalcifications in their cap is needed to prove the effect of microcalcification in plaque rupture and the overall microcalcification hypothesis.
Acknowledgments
This research has been supported by NIH ARRA grant RCI HL101151 to SW, AG034198, NSF MRI 0723027, 1229449 and PSC CUNY award to LC.
Footnotes
Conflict of interest
The authors have no conflict of interest.
References
- 1.Aikawa E, et al. Osteogenesis associates with inflammation in early-stage atherosclerosis evaluated by molecular imaging in vivo. Circulation. 2007;116(24):2841–2850. doi: 10.1161/CIRCULATIONAHA.107.732867. [DOI] [PubMed] [Google Scholar]
- 2.Akyildiz AC, et al. Effects of intima stiffness and plaque morphology on peak cap stress. Biomed Eng Online. 2011;10:25. doi: 10.1186/1475-925X-10-25. [DOI] [PMC free article] [PubMed] [Google Scholar]
- 3.Barrett SR, Sutcliffe MP, Howarth S, Li ZY, Gillard JH. Experimental measurement of the mechanical properties of carotid atherothrombotic plaque fibrous cap. J Biomech. 2009;42(11):1650–1655. doi: 10.1016/j.jbiomech.2009.04.025. [DOI] [PubMed] [Google Scholar]
- 4.Bennett MR, Evan GI, Schwartz SM. Apoptosis of human vascular smooth muscle cells derived from normal vessels and coronary atherosclerotic plaques. J Clin Invest. 1995;95(5):2266–2274. doi: 10.1172/JCI117917. [DOI] [PMC free article] [PubMed] [Google Scholar]
- 5.Berliner JA, et al. Atherosclerosis: basic mechanisms. Oxidation, inflammation, and genetics Circulation. 1995;91(9):2488–2496. doi: 10.1161/01.cir.91.9.2488. [DOI] [PubMed] [Google Scholar]
- 6.Bluestein D, et al. Influence of microcalcifications on vulnerable plaque mechanics using FSI modeling. J Biomech. 2008;41(5):1111–1118. doi: 10.1016/j.jbiomech.2007.11.029. [DOI] [PubMed] [Google Scholar]
- 7.Bobryshev YV, Killingsworth MC, Lord RS, Grabs AJ. Matrix vesicles in the fibrous cap of atherosclerotic plaque: possible contribution to plaque rupture. J Cell Mol Med. 2008;12(5B):2073–2082. doi: 10.1111/j.1582-4934.2008.00230.x. [DOI] [PMC free article] [PubMed] [Google Scholar]
- 8.Born GV, Richardson PD. A classic collaboration: Michael Davies on plaque vulnerability. Atherosclerosis. 2012;220(2):593–597. doi: 10.1016/j.atherosclerosis.2011.11.022. [DOI] [PubMed] [Google Scholar]
- 9.Born GVR, Richardson PD. Mechanical properties of human atherosclerotic lesions. In: Glagov S, Newman WP, Shaffer S, editors. Pathology of the Human Atherosclerotic Plaque. Berlin: Springer; 1989. [Google Scholar]
- 10.Burke AP, et al. Plaque rupture and sudden death related to exertion in men with coronary artery disease. JAMA. 1999;281(10):921–926. doi: 10.1001/jama.281.10.921. [DOI] [PubMed] [Google Scholar]
- 11.Burke AP, et al. Coronary risk factors and plaque morphology in men with coronary disease who died suddenly. N Engl J Med. 1997;336(18):1276–1282. doi: 10.1056/NEJM199705013361802. [DOI] [PubMed] [Google Scholar]
- 12.Burleigh MC, et al. Collagen types I and III, collagen content, GAGs and mechanical strength of human atherosclerotic plaque caps: span-wise variations. Atherosclerosis. 1992;96(1):71–81. doi: 10.1016/0021-9150(92)90039-j. [DOI] [PubMed] [Google Scholar]
- 13.Cheng GC, Loree HM, Kamm RD, Fishbein MC, Lee RT. Distribution of circumferential stress in ruptured and stable atherosclerotic lesions. A structural analysis with histopathological correlation. Circulation. 1993;87(4):1179–1187. doi: 10.1161/01.cir.87.4.1179. [DOI] [PubMed] [Google Scholar]
- 14.Choi BJ, et al. Comparison of 64-slice multidetector computed tomography with spectral analysis of intravascular ultrasound backscatter signals for characterizations of noncalcified coronary arterial plaques. Am J Cardiol. 2008;102(8):988–993. doi: 10.1016/j.amjcard.2008.05.060. [DOI] [PubMed] [Google Scholar]
- 15.Choudhury RP, Fuster V, Badimon JJ, Fisher EA, Fayad ZA. MRI and characterization of atherosclerotic plaque: emerging applications and molecular imaging. Arterioscler Thromb Vasc Biol. 2002;22(7):1065–1074. doi: 10.1161/01.atv.0000019735.54479.2f. [DOI] [PubMed] [Google Scholar]
- 16.Claes E, et al. Mechanical properties of human coronary arteries. Conf Proc IEEE Eng Med Biol Soc. 2010;2010:3792–3795. doi: 10.1109/IEMBS.2010.5627560. [DOI] [PubMed] [Google Scholar]
- 17.Davies MJ, Richardson PD, Woolf N, Katz DR, Mann J. Risk of thrombosis in human atherosclerotic plaques: role of extracellular lipid, macrophage, and smooth muscle cell content. Br Heart J. 1993;69(5):377–381. doi: 10.1136/hrt.69.5.377. [DOI] [PMC free article] [PubMed] [Google Scholar]
- 18.Davies MJ, Thomas AC. Plaque fissuring--the cause of acute myocardial infarction, sudden ischaemic death, and crescendo angina. Br Heart J. 1985;53(4):363–373. doi: 10.1136/hrt.53.4.363. [DOI] [PMC free article] [PubMed] [Google Scholar]
- 19.Davies MJ, Thomas T. The pathological basis and microanatomy of occlusive thrombus formation in human coronary arteries. Philos Trans R Soc Lond B Biol Sci. 1981;294(1072):225–229. doi: 10.1098/rstb.1981.0101. [DOI] [PubMed] [Google Scholar]
- 20.de Korte CL, Cespedes EI, van der Steen AF, Pasterkamp G, Bom N. Intravascular ultrasound elastography: assessment and imaging of elastic properties of diseased arteries and vulnerable plaque. Eur J Ultrasound. 1998;7(3):219–224. doi: 10.1016/s0929-8266(98)00043-3. [DOI] [PubMed] [Google Scholar]
- 21.Demer LL. Vascular calcification and osteoporosis: inflammatory responses to oxidized lipids. Int J Epidemiol. 2002;31(4):737–741. doi: 10.1093/ije/31.4.737. [DOI] [PubMed] [Google Scholar]
- 22.Ebenstein DM, et al. Assessing structure-property relations of diseased tissues using nanoindentation and FTIR. In: Moss S, editor. Advanced Biomaterials: Characterization, Tissue Engineering, and Complexity. Boston, MA: Materials Research Society; 2002. pp. 47–52. [Google Scholar]
- 23.Ebenstein DM, Coughlin D, Chapman J, Li C, Pruitt LA. Nanomechanical properties of calcification, fibrous tissue, and hematoma from atherosclerotic plaques. J Biomed Mater Res A. 2009;91(4):1028–1037. doi: 10.1002/jbm.a.32321. [DOI] [PubMed] [Google Scholar]
- 24.Ehara S, et al. Spotty calcification typifies the culprit plaque in patients with acute myocardial infarction: an intravascular ultrasound study. Circulation. 2004;110(22):3424–3429. doi: 10.1161/01.CIR.0000148131.41425.E9. [DOI] [PubMed] [Google Scholar]
- 25.Finet G, Ohayon J, Rioufol G. Biomechanical interaction between cap thickness, lipid core composition and blood pressure in vulnerable coronary plaque: impact on stability or instability. Coron Artery Dis. 2004;15(1):13–20. doi: 10.1097/00019501-200402000-00003. [DOI] [PubMed] [Google Scholar]
- 26.Fitzpatrick LA, Severson A, Edwards WD, Ingram RT. Diffuse calcification in human coronary arteries. Association of osteopontin with atherosclerosis. J Clin Invest. 1994;94(4):1597–1604. doi: 10.1172/JCI117501. [DOI] [PMC free article] [PubMed] [Google Scholar]
- 27.Gent AN. Detachment of an elastic matrix from a rigid spherical inclusion. J Mater Sci. 1980;15(11):2884–2888. [Google Scholar]
- 28.Gent AN, Park B. Failure processes in elastomers at or near a rigid spherical inclusion. J Mater Sci. 1984;19(6):1947–1956. [Google Scholar]
- 29.Goodier JN. Concentration of stress around spherical and sylindrical inclusion and flaws. Trans ASME. 1933;55:39–44. [Google Scholar]
- 30.Holzapfel GA, Sommer G, Gasser CT, Regitnig P. Determination of layer-specific mechanical properties of human coronary arteries with nonatherosclerotic intimal thickening and related constitutive modeling. Am J Physiol Heart Circ Physiol. 2005;289(5):H2048–2058. doi: 10.1152/ajpheart.00934.2004. [DOI] [PubMed] [Google Scholar]
- 31.Holzapfel GA, Sommer G, Regitnig P. Anisotropic mechanical properties of tissue components in human atherosclerotic plaques. J Biomech Eng. 2004;126(5):657–665. doi: 10.1115/1.1800557. [DOI] [PubMed] [Google Scholar]
- 32.Hoshino T, et al. Mechanical stress analysis of a rigid inclusion in distensible material: a model of atherosclerotic calcification and plaque vulnerability. Am J Physiol Heart Circ Physiol. 2009;297(2):H802–810. doi: 10.1152/ajpheart.00318.2009. [DOI] [PMC free article] [PubMed] [Google Scholar]
- 33.Hsu HH, Camacho NP. Isolation of calcifiable vesicles from human atherosclerotic aortas. Atherosclerosis. 1999;143(2):353–362. doi: 10.1016/s0021-9150(98)00322-0. [DOI] [PubMed] [Google Scholar]
- 34.Huang H, et al. The impact of calcification on the biomechanical stability of atherosclerotic plaques. Circulation. 2001;103(8):1051–1056. doi: 10.1161/01.cir.103.8.1051. [DOI] [PubMed] [Google Scholar]
- 35.Isner JM, Kearney M, Bortman S, Passeri J. Apoptosis in human atherosclerosis and restenosis. Circulation. 1995;91(11):2703–2711. doi: 10.1161/01.cir.91.11.2703. [DOI] [PubMed] [Google Scholar]
- 36.Kelly-Arnold A, et al. A revised microcalcification hypothesis for fibrous cap rupture in human coronary arteries. Proc Natl Acad Sci USA. 2013 doi: 10.1073/pnas.1308814110. Published online before print June 3, 2013. [DOI] [PMC free article] [PubMed] [Google Scholar]
- 37.Knollmann F, et al. Quantification of atherosclerotic coronary plaque components by submillimeter computed tomography. Int J Cardiovasc Imaging. 2008;24(3):301–310. doi: 10.1007/s10554-007-9262-4. [DOI] [PubMed] [Google Scholar]
- 38.Kolodgie FD, et al. Intraplaque hemorrhage and progression of coronary atheroma. N Engl J Med. 2003;349(24):2316–2325. doi: 10.1056/NEJMoa035655. [DOI] [PubMed] [Google Scholar]
- 39.Kopp AF, et al. Non-invasive characterisation of coronary lesion morphology and composition by multislice CT: first results in comparison with intracoronary ultrasound. Eur Radiol. 2001;11(9):1607–1611. doi: 10.1007/s003300100850. [DOI] [PubMed] [Google Scholar]
- 40.Kural MH, et al. Planar biaxial characterization of diseased human coronary and carotid arteries for computational modeling. J Biomech. 2012;45(5):790–798. doi: 10.1016/j.jbiomech.2011.11.019. [DOI] [PMC free article] [PubMed] [Google Scholar]
- 41.Larose E, et al. Improved characterization of atherosclerotic plaques by gadolinium contrast during intravascular magnetic resonance imaging of human arteries. Atherosclerosis. 2008;196(2):919–925. doi: 10.1016/j.atherosclerosis.2007.02.020. [DOI] [PubMed] [Google Scholar]
- 42.Larose E, et al. Characterization of human atherosclerotic plaques by intravascular magnetic resonance imaging. Circulation. 2005;112(15):2324–2331. doi: 10.1161/CIRCULATIONAHA.105.538942. [DOI] [PubMed] [Google Scholar]
- 43.Lawlor MG, O’Donnell MR, O’Connell BM, Walsh MT. Experimental determination of circumferential properties of fresh carotid artery plaques. J Biomech. 2011;44(9):1709–1715. doi: 10.1016/j.jbiomech.2011.03.033. [DOI] [PubMed] [Google Scholar]
- 44.Leach JR, et al. Carotid atheroma rupture observed in vivo and FSI-predicted stress distribution based on pre-rupture imaging. Ann Biomed Eng. 2010;38(8):2748–2765. doi: 10.1007/s10439-010-0004-8. [DOI] [PMC free article] [PubMed] [Google Scholar]
- 45.Lee RT, Grodzinsky AJ, Frank EH, Kamm RD, Schoen FJ. Structure-dependent dynamic mechanical behavior of fibrous caps from human atherosclerotic plaques. Circulation. 1991;83(5):1764–1770. doi: 10.1161/01.cir.83.5.1764. [DOI] [PubMed] [Google Scholar]
- 46.Lee RT, et al. Prediction of mechanical properties of human atherosclerotic tissue by high-frequency intravascular ultrasound imaging. An in vitro study. Arterioscler Thromb. 1992;12(1):1–5. doi: 10.1161/01.atv.12.1.1. [DOI] [PubMed] [Google Scholar]
- 47.Lendon CL, Briggs AD, Born GVR, Burleigh MC, Davies MJ. Mechanical Testing of Connective-Tissue in the Search for Determinants of Atherosclerotic Plaque Cap Rupture. Biochem Soc T. 1988;16(6):1032–1033. [Google Scholar]
- 48.Lendon CL, Davies MJ, Born GV, Richardson PD. Atherosclerotic plaque caps are locally weakened when macrophages density is increased. Atherosclerosis. 1991;87(1):87–90. doi: 10.1016/0021-9150(91)90235-u. [DOI] [PubMed] [Google Scholar]
- 49.Lendon CL, Davies MJ, Richardson PD, Born GVR. Testing of Small Connective-Tissue Specimens for the Determination of the Mechanical-Behavior of Atherosclerotic Plaques. J Biomed Eng. 1993;15(1):27–33. doi: 10.1016/0141-5425(93)90089-h. [DOI] [PubMed] [Google Scholar]
- 50.Loree HM, Grodzinsky AJ, Park SY, Gibson LJ, Lee RT. Static circumferential tangential modulus of human atherosclerotic tissue. J Biomech. 1994;27(2):195–204. doi: 10.1016/0021-9290(94)90209-7. [DOI] [PubMed] [Google Scholar]
- 51.Loree HM, Kamm RD, Stringfellow RG, Lee RT. Effects of fibrous cap thickness on peak circumferential stress in model atherosclerotic vessels. Circ Res. 1992;71(4):850–858. doi: 10.1161/01.res.71.4.850. [DOI] [PubMed] [Google Scholar]
- 52.Maehara A, et al. Morphologic and angiographic features of coronary plaque rupture detected by intravascular ultrasound. J Am Coll Cardiol. 2002;40(5):904–910. doi: 10.1016/s0735-1097(02)02047-8. [DOI] [PubMed] [Google Scholar]
- 53.Maher E, et al. Tensile and compressive properties of fresh human carotid atherosclerotic plaques. J Biomech. 2009;42(16):2760–2767. doi: 10.1016/j.jbiomech.2009.07.032. [DOI] [PubMed] [Google Scholar]
- 54.Maldonado N, Kelly-Arnold A, Cardoso L, Weinbaum S. The explosive growth of small voids in vulnerable cap rupture; cavitation and interfacial debonding. J Biomech. 2013;46(2):396–401. doi: 10.1016/j.jbiomech.2012.10.040. [DOI] [PMC free article] [PubMed] [Google Scholar]
- 55.Maldonado N, et al. A mechanistic analysis of the role of microcalcifications in atherosclerotic plaque stability: potential implications for plaque rupture. Am J Physiol Heart Circ Physiol. 2012;303(5):H619–628. doi: 10.1152/ajpheart.00036.2012. [DOI] [PMC free article] [PubMed] [Google Scholar]
- 56.Moreno PR, et al. Detection of lipid pool, thin fibrous cap, and inflammatory cells in human aortic atherosclerotic plaques by near-infrared spectroscopy. Circulation. 2002;105(8):923–927. doi: 10.1161/hc0802.104291. [DOI] [PubMed] [Google Scholar]
- 57.Motoyama S, et al. Multislice computed tomographic characteristics of coronary lesions in acute coronary syndromes. J Am Coll Cardiol. 2007;50(4):319–326. doi: 10.1016/j.jacc.2007.03.044. [DOI] [PubMed] [Google Scholar]
- 58.Nasu K, et al. Accuracy of in vivo coronary plaque morphology assessment: a validation study of in vivo virtual histology compared with in vitro histopathology. J Am Coll Cardiol. 2006;47(12):2405–2412. doi: 10.1016/j.jacc.2006.02.044. [DOI] [PubMed] [Google Scholar]
- 59.New SEP, Aikawa E. Molecular Imaging Insights Into Early Inflammatory Stages of Arterial and Aortic Valve Calcification. Circulation Research. 2011;108(11):1381–1391. doi: 10.1161/CIRCRESAHA.110.234146. [DOI] [PMC free article] [PubMed] [Google Scholar]
- 60.Ohayon J, et al. Influence of residual stress/strain on the biomechanical stability of vulnerable coronary plaques: potential impact for evaluating the risk of plaque rupture. Am J Physiol Heart Circ Physiol. 2007;293(3):H1987–1996. doi: 10.1152/ajpheart.00018.2007. [DOI] [PubMed] [Google Scholar]
- 61.Ohayon J, et al. Necrotic core thickness and positive arterial remodeling index: emergent biomechanical factors for evaluating the risk of plaque rupture. Am J Physiol Heart Circ Physiol. 2008;295(2):H717–727. doi: 10.1152/ajpheart.00005.2008. [DOI] [PMC free article] [PubMed] [Google Scholar]
- 62.Ohayon J, Finet G, Treyve F, Rioufol G, Dubreuil O. A three-dimensional finite element analysis of stress distribution in a coronary atherosclerotic plaque: In-vivo prediction of plaque rupture location. Biomechanics Applied to Computer Assisted Surgery. 2005;661:225–241. [Google Scholar]
- 63.Patwari P, et al. Assessment of coronary plaque with optical coherence tomography and high-frequency ultrasound. Am J Cardiol. 2000;85(5):641–644. doi: 10.1016/s0002-9149(99)00825-5. [DOI] [PubMed] [Google Scholar]
- 64.Potkin BN, et al. Coronary artery imaging with intravascular high-frequency ultrasound. Circulation. 1990;81(5):1575–1585. doi: 10.1161/01.cir.81.5.1575. [DOI] [PubMed] [Google Scholar]
- 65.Rambhia SH, et al. Microcalcifications increase coronary vulnerable plaque rupture potential: a patient-based micro-CT fluid-structure interaction study. Ann Biomed Eng. 2012;40(7):1443–1454. doi: 10.1007/s10439-012-0511-x. [DOI] [PubMed] [Google Scholar]
- 66.Richardson PD, Davies MJ, Born GV. Influence of plaque configuration and stress distribution on fissuring of coronary atherosclerotic plaques. Lancet. 1989;2(8669):941–944. doi: 10.1016/s0140-6736(89)90953-7. [DOI] [PubMed] [Google Scholar]
- 67.Rodriguez-Granillo GA, et al. In vivo intravascular ultrasound-derived thin-cap fibroatheroma detection using ultrasound radiofrequency data analysis. J Am Coll Cardiol. 2005;46(11):2038–2042. doi: 10.1016/j.jacc.2005.07.064. [DOI] [PubMed] [Google Scholar]
- 68.Russell RR, 3rd, Zaret BL. Nuclear cardiology: present and future. Curr Probl Cardiol. 2006;31(9):557–629. doi: 10.1016/j.cpcardiol.2006.05.002. [DOI] [PubMed] [Google Scholar]
- 69.Schaar JA, et al. Characterizing vulnerable plaque features with intravascular elastography. Circulation. 2003;108(21):2636–2641. doi: 10.1161/01.CIR.0000097067.96619.1F. [DOI] [PubMed] [Google Scholar]
- 70.Sinusas AJ. Molecular imaging in nuclear cardiology: translating research concepts into clinical applications. Q J Nucl Med Mol Imaging. 2010;54(2):230–240. [PubMed] [Google Scholar]
- 71.Sommer G, Regitnig P, Koltringer L, Holzapfel GA. Biaxial mechanical properties of intact and layer-dissected human carotid arteries at physiological and supraphysiological loadings. Am J Physiol Heart Circ Physiol. 2010;298(3):H898–912. doi: 10.1152/ajpheart.00378.2009. [DOI] [PubMed] [Google Scholar]
- 72.Stary HC. Atlas of Atherosclerosis: Progression and Regression. 2. The Parthenon Publishing Group CRC Press; 2003. p. 144. The Encyclopedia of Visual Medicine Series. [Google Scholar]
- 73.Stary HC. The development of calcium deposits in atherosclerotic lesions and their persistence after lipid regression. Am J Cardiol. 2001;88(2A):16e–19e. doi: 10.1016/s0002-9149(01)01713-1. [DOI] [PubMed] [Google Scholar]
- 74.Strauss HW, Grewal RK, Pandit-Taskar N. Molecular imaging in nuclear cardiology. Semin Nucl Med. 2004;34(1):47–55. doi: 10.1053/j.semnuclmed.2003.09.006. [DOI] [PubMed] [Google Scholar]
- 75.Tanaka A, et al. Morphology of exertion-triggered plaque rupture in patients with acute coronary syndrome: an optical coherence tomography study. Circulation. 2008;118(23):2368–2373. doi: 10.1161/CIRCULATIONAHA.108.782540. [DOI] [PubMed] [Google Scholar]
- 76.Tang D, Yang C, Kobayashi S, Ku DN. Effect of a lipid pool on stress/strain distributions in stenotic arteries: 3-D fluid-structure interactions (FSI) models. J Biomech Eng. 2004;126(3):363–370. doi: 10.1115/1.1762898. [DOI] [PubMed] [Google Scholar]
- 77.Tang D, et al. Local maximal stress hypothesis and computational plaque vulnerability index for atherosclerotic plaque assessment. Ann Biomed Eng. 2005;33(12):1789–1801. doi: 10.1007/s10439-005-8267-1. [DOI] [PMC free article] [PubMed] [Google Scholar]
- 78.Tarbell JM. Shear stress and the endothelial transport barrier. Cardiovasc Res. 2010;87(2):320–330. doi: 10.1093/cvr/cvq146. [DOI] [PMC free article] [PubMed] [Google Scholar]
- 79.Teng Z, et al. 3D critical plaque wall stress is a better predictor of carotid plaque rupture sites than flow shear stress: An in vivo MRI-based 3D FSI study. J Biomech Eng. 2010;132(3):031007. doi: 10.1115/1.4001028. [DOI] [PMC free article] [PubMed] [Google Scholar]
- 80.Teng Z, Tang D, Zheng J, Woodard PK, Hoffman AH. An experimental study on the ultimate strength of the adventitia and media of human atherosclerotic carotid arteries in circumferential and axial directions. J Biomech. 2009;42(15):2535–2539. doi: 10.1016/j.jbiomech.2009.07.009. [DOI] [PMC free article] [PubMed] [Google Scholar]
- 81.Tsimikas S, Shaw PX. Non-invasive imaging of vulnerable plaques by molecular targeting of oxidized LDL with tagged oxidation-specific antibodies. J Cell Biochem Suppl. 2002;39:138–146. doi: 10.1002/jcb.10420. [DOI] [PubMed] [Google Scholar]
- 82.Vengrenyuk Y, Cardoso L, Weinbaum S. Micro-CT based analysis of a new paradigm for vulnerable plaque rupture: cellular microcalcifications in fibrous caps. Mol Cell Biomech. 2008;5(1):37–47. [PubMed] [Google Scholar]
- 83.Vengrenyuk Y, et al. A hypothesis for vulnerable plaque rupture due to stress-induced debonding around cellular microcalcifications in thin fibrous caps. Proc Natl Acad Sci U S A. 2006;103(40):14678–14683. doi: 10.1073/pnas.0606310103. [DOI] [PMC free article] [PubMed] [Google Scholar]
- 84.Vengrenyuk Y, Kaplan TJ, Cardoso L, Randolph GJ, Weinbaum S. Computational stress analysis of atherosclerotic plaques in ApoE knockout mice. Ann Biomed Eng. 2010;38(3):738–747. doi: 10.1007/s10439-009-9897-5. [DOI] [PubMed] [Google Scholar]
- 85.Virmani R, Burke AP, Kolodgie FD, Farb A. Pathology of the thin-cap fibroatheroma: a type of vulnerable plaque. J Interv Cardiol. 2003;16(3):267–272. doi: 10.1034/j.1600-0854.2003.8042.x. [DOI] [PubMed] [Google Scholar]
- 86.Virmani R, Narula J, Leon M, Willerson JTE. The Vulnerable Atherosclerotic Plaque: Strategies for Diagnosis and Management. Malden, MA: Blackwell; 2007. [Google Scholar]
- 87.Wenk JF. Numerical modeling of stress in stenotic arteries with microcalcifications: a parameter sensitivity study. J Biomech Eng. 2011;133(1):014503. doi: 10.1115/1.4003128. [DOI] [PubMed] [Google Scholar]
- 88.Yabushita H, et al. Characterization of human atherosclerosis by optical coherence tomography. Circulation. 2002;106(13):1640–1645. doi: 10.1161/01.cir.0000029927.92825.f6. [DOI] [PubMed] [Google Scholar]
- 89.Yang F, et al. Segmentation of wall and plaque in in vitro vascular MR images. Int J Cardiovasc Imaging. 2003;19(5):419–428. doi: 10.1023/a:1025829232098. [DOI] [PubMed] [Google Scholar]