

Abstract
Purpose
To evaluate the feasibility of image fusion (IF) of preprocedural arterial-phase computed tomography with intraprocedural fluoroscopy for roadmapping in endovascular repair of complex aortic aneurysms, and to compare this approach versus current roadmapping methods (ie, two-dimensional [2D] and three-dimensional [3D] angiography).
Materials and Methods
Thirty-seven consecutive patients with complex aortic aneurysms treated with endovascular techniques were retrospectively reviewed; these included aneurysms of digestive and/or renal arteries and pararenal and juxtarenal aortic aneurysms. All interventions were performed with the same angiographic system. According to the availability of different roadmapping software, patients were successively placed into three intraprocedural image guidance groups: (i) 2D angiography (n = 9), (ii) 3D rotational angiography (n = 14), and (iii) IF (n = 14). X-ray exposure (dose–area product [DAP]), injected contrast medium volume, and procedure time were recorded.
Results
Patient characteristics were similar among groups, with no statistically significant differences (P ≥ .05). There was no statistical difference in endograft deployment success between groups (2D angiography, eight of nine patients [89%]; 3D angiography and IF, 14 of 14 patients each [100%]). The IF group showed significant reduction (P < .0001) in injected contrast medium volume versus other groups (2D, 235 mL ± 145; 3D, 225 mL ± 119; IF, 65 mL ± 28). Mean DAP values showed no significant difference between groups (2D, 1,188 Gy · cm2 ± 1,067; 3D, 984 Gy · cm2 ± 581; IF, 655 Gy · cm2 ± 457; P = .18); nor did procedure times (2D, 233 min ± 123; 3D, 181 min ± 53; IF, 189 min ± 60; P = .59).
Conclusions
The use of IF-based roadmapping is a feasible technique for endovascular complex aneurysm repair associated with significant reduction of injected contrast agent volume and similar x-ray exposure and procedure time.
Since the advent of cone-beam computed tomography (CT) and its first use in interventional radiology, notable achievements in image acquisition, postprocessing, and intraprocedural guidance software have been made. Cone-beam CT imaging enables three-dimensional (3D) volumetric imaging, and the volumetric images it produces can be used to guide procedures through multimodality image fusion (IF) (1). IF and coregistration can combine different 3D imaging modalities together, such as multidetector CT and magnetic resonance (MR) imaging, with fluoroscopy to allow for 3D specific intraprocedural targeting.
IF-based guidance has been shown to be feasible, accurate, and useful for multiple applications in interventional radiology (1,2). IF guidance in which preprocedural CT angiography is overlaid onto intraprocedural fluoroscopy can facilitate 3D endovascular navigation, and it has therefore been shown to reduce the volume of contrast agent needed for catheter navigation for neurointerventional radiology procedures (3). Similarly, IF-based guidance has been used for endovascular repair of thoracic and thoracoabdominal aortic aneurysms, and was also shown to reduce contrast agent volume (4,5).
The aim of the present study was to evaluate the feasibility of IF of preprocedural arterial-phase CT angiography with intraprocedural fluoroscopy for roadmapping in endovascular repair of complex aortic aneurysms. Additionally, we compared this approach versus current roadmapping methods (ie, 2D and 3D angiography) with regard to x-ray exposure, injected contrast agent volume, and procedure time.
MATERIALS AND METHODS
This report follows the Society of Interventional Radiology guidelines for the development and use of transluminally placed endovascular prosthetic endografts in the arterial system (6). Institutional review board approval was obtained for the study.
Study Population
In the present single-center retrospective study, all patients who underwent endovascular aneurysm repair (EVAR) of complex aortic aneurysms (“complex EVAR”) between March 2009 and January 2011 were evaluated. The inclusion criteria for complex EVAR were (i) complex aortic aneurysm, including aortic aneurysms involving the digestive and/or renal arteries, pararenal aneurysm, and juxtarenal aortic aneurysm; (ii) high risk in the setting of open surgical repair per the Haute Autorité de Santé (the French counterpart of the Food and Drug Administration) and reported by Haulon et al (7); (iii) unsuitable aortic neck anatomy for standard endovascular repair (< 10 mm long or > 34 mm in diameter); (iv) renal, celiac, and mesenteric arteries with anatomy suitable for fenestrated, branched, or “chimney” EVAR; and (v) CT angiography within 3 months before the procedure (8–10). The exclusion criteria were (i) contraindications to iliac and/or brachial approach in the presence of occlusive disease, (ii) unstable atheromatous arterial lesions with risk of embolization, (iii) proximal aortic neck angulations greater than 60°, and (iv) external iliac diameter less than 9 mm or greater than 16 mm.
Three guidance methods were chosen based on their availability in three consecutive periods (Fig 1): 2D angiography, 3D rotational angiography, and preprocedural CT angiographic IF. Patients were grouped into three groups depending on the method of roadmapping. The methods of image acquisition, fusion, and roadmap creation are described later.
Figure 1.
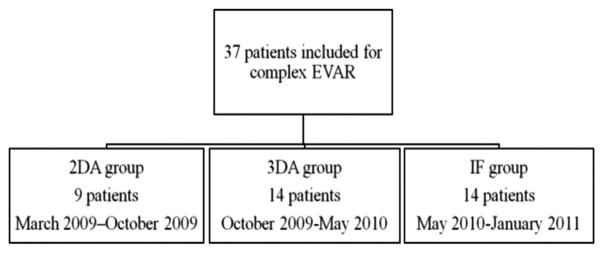
Study design chart. Patients were grouped chronologically into the three image guidance roadmapping types as they became available: 2D angiography (2DA), 3D rotational angiography (3DA), and preprocedural CT angiography IF.
Preprocedural Imaging
All patients underwent preprocedural multidetector CT imaging with contrast agent injection at the study institution or elsewhere. All images were acquired no more than 3 months before intervention. Preprocedural CT angiograms were evaluated on a 3D workstation to measure the extent of the aneurysm and to determine the endovascular repair strategy (type and sizing of endograft, number of target vessels for stent treatment) (10–14). The CT angiograms were also used to generate roadmapping guidance for the IF group (as described in further detail later). In our institution, all multidetector CT scans were performed with a bolus of nonionic contrast medium (1.5 mL/kg Xenetix 300; Guerbet, Aulnay-sous-Bois, France) and a saline solution “chaser” injected at a rate of 3–4 mL/s via a 20-gauge intravenous cannula in a superficial brachial vein. Automatic triggering was set in the descending thoracic aorta at 110 HU. Imaging parameters were as follows: slice thickness, 1 mm; pitch, 1; table speed, 4 mm/s; reconstruction slice thickness, 1 mm; peak voltage, 140 kVp; tube current and exposure time, 250 mAs (Light-Speed Ultra Advantage; 164 slices; GE Medical Systems, Milwaukee, Wisconsin).
Intraprocedural Image Guidance
Endograft deployment and stent placement were performed under general anesthesia. Three types of endograft devices were implanted depending on the patients’ anatomy: fenestrated, chimney, and branched (Zenith; Cook, Bloomington, Indiana; or Talent; Medtronic, Santa Rosa, California). The team performing the procedures included two vascular surgeons (P.D. and J.P.B.) and one interventional radiologist (H.K.). All interventions were performed by using the same angiographic system (Allura Xper FD20; Philips, Best, The Netherlands) with commercially available software, equipped with 3D angiography and XperCT options. The XperCT option enabled cone-beam CT acquisition with 3D volumetric image reconstruction. All 2D or 3D roadmaps were acquired with power contrast agent injection. All patients received the same nonionic iodinated contrast agent (iodixanol; Visipaque 270 mgI/mL; GE Healthcare). Manual contrast agent injections were performed under 2D fluoroscopy just before and after stent placement in the target vessel to ensure proper stent placement and patency (10 mL at approximately 5 mL/ s). A final proximal 2D angiogram with power injection was acquired with 20–30 mL of contrast medium (injected at 15 mL/s) to confirm successful endograft deployment. Technical success in endograft placement was defined by aneurysm exclusion and perfusion of all target vessels, including celiac trunk and superior mesenteric, renal, and internal iliac arteries. All endoleaks were treated in the same session by additional balloon angioplasty to ensure optimal deployment of stents and devices. The intraprocedural parameters recorded were technical success, total injected contrast agent volume, x-ray exposure (in dose–area product [DAP]), fluoroscopy time, and procedure time. One-week follow-up CT angiography was performed to confirm aneurysm exclusion, target vessel perfusion, and detect endoleak.
Two-dimensional Angiography Group
Only 2D angiography roadmapping was used for guidance in one group of patients. Two roadmaps, which were digital subtraction angiography (DSA) images, were generated from images acquired at two frames per second for 15 seconds with power injection of contrast medium. The two initial roadmaps were generated with the injection of nondiluted contrast medium (10 mL) through a catheter (at 15 mL/s) positioned in the aorta at the celiac artery trunk level to visualize the stent-graft proximal attachment zone (Fig 2). The anterior/posterior view was used to assist in deployment of the endograft’s proximal attachment zone and renal stent placement, whereas the lateral view was used to guide catheterization and stent placement of the superior mesenteric artery (and eventually the celiac trunk). Two additional roadmaps were generated with nondiluted contrast agent injection (10 mL) through a catheter (at 5 mL/s) placed at the level of the aortic bifurcation to visualize both iliac components of graft deployment. For each of these roadmaps, two different positions of the C-arm were used to confirm the origins of the internal iliac arteries (30°–45° left anterior oblique projection for the right internal iliac artery and 30°–45° right anterior oblique projection for the left internal iliac artery). Each roadmap was automatically overlaid on live fluoroscopy with a 19 × 25-cm field of view (FOV) as a 2D background. The 2D roadmap was not synchronized to the C-arm/table positions.
Figure 2.
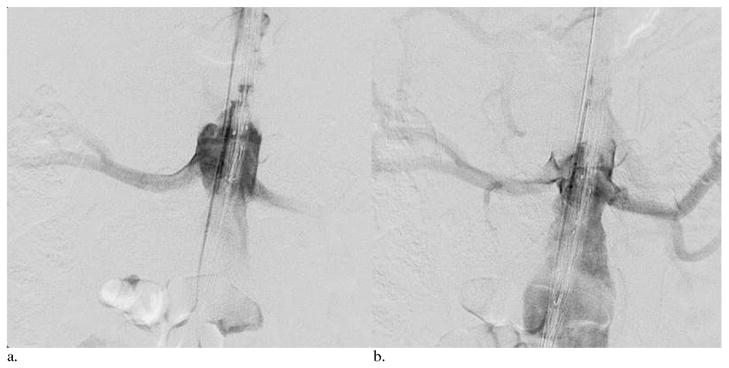
Two DSA images at two different time points after contrast medium injection through a catheter at the level of the celiac trunk. DSA images (a) 2 seconds and (b) 4 seconds after the start of injection. These images were used as a 2D roadmap for the positioning of a fenestrated endograft device before deployment for a juxtarenal abdominal aortic aneurysm in a 71-year-old patient. The roadmap was overlaid as a background on 2D live fluoroscopy.
Three-dimensional Rotational Angiography Group
In one group of patients, 3D rotational angiography roadmapping was used for intraprocedural image guidance for the endograft’s proximal attachment zone positioning and visceral artery stent placement. After the patient was prepared and draped, a 3D roadmap was generated while the catheter was positioned into the abdominal aorta at the level of the celiac artery. The patient’s arms remained alongside the body for the cone-beam CT acquisition. The 3D angiogram was acquired from 120 projections (15 frames per second) over one continuous 180° rotation of the C-arm around the patient with power contrast agent injection for the entire scan duration through the catheter (nondiluted contrast agent, 50 mL at 5 mL/s). The images were then automatically transferred and reconstructed around the center of the rotation to generate the 3D rotational angiography images. The roadmap was overlaid as a background on live fluoroscopy with a 19 × 25-cm FOV and synchronized to C-arm/table positions (Fig 3). In cases of mismatch between the 3D roadmap and fluoroscopy/DSA images (caused by patient motion or deformation of the patient’s arterial anatomy by the rigidity of the material inserted), 3D roadmaps were manually adjusted directly on fluoroscopy/DSA images based on landmarks such as the catheter position within the targeted vessels or the opacification of the targeted vessels. To control roadmap adjustment in 3D, a few degrees of C-arm rotation were applied to correct the overlay between the two data sets. Two additional 2D roadmaps were generated with a nondiluted contrast medium injection through a catheter (10 mL at 5 mL/s) placed at the level of the aortic bifurcation for the deployment of both iliac components of the endograft with the same two positions of the C-arm described earlier to confirm the origins of the internal iliac arteries. Each roadmap was automatically overlaid on live fluoroscopy with a 19 × 25-cm FOV as a 2D background. These 2D roadmaps were not synchronized to the C-arm/table positions.
Figure 3.

A 3D rotational angiogram was used for roadmapping guidance in a 77-year-old patient with a juxtarenal aortic aneurysm. The fenestrated endograft was partially deployed, and the left renal artery was catheterized by a guide wire. The 3D rotational angiography images (red) served as a background overlay on live fluoroscopy.
IF Group
Immediately before the intervention, the same preprocedural CT angiographic images described earlier were loaded onto a dedicated 3D workstation (Xtra Vision Release 8; Philips Healthcare) to register with intraprocedural imaging. The IF process enabled an overlay of fluoroscopy acquisition on a preprocedural CT angiogram. It required the acquisition of an unenhanced intraoperative cone-beam CT study to register the two 3D data sets in the same spatial coordinates. The patient’s arms remained alongside the body for the cone-beam CT acquisition. The unenhanced cone-beam CT reference image acquisition was made at the beginning of the procedure and before the patient was prepared and draped. The area of interest was positioned in the system isocenter, and 120 projections (15 frames per second) were acquired over a 180° arc. The images were reconstructed into a 3D volume on the workstation. The same interventional radiologist who would later perform the intervention (H.K., 12 years of experience) manually registered the CT angiography and cone-beam CT images. Coregistration of unenhanced cone-beam CT and preprocedural CT angiograms was performed less than 5 minutes after image acquisition in all patients. Landmarks such as aortic wall calcifications, target vessels, or vertebra were used as registration references (Fig 4). The coregistration was executed to ensure that the CT angiographic roadmap was precisely overlaid on live 2D fluoroscopy (Fig 5). The whole volume-rendering technique of the arterial tree was used to create the 3D roadmap (Fig 6). The volume-rendered overlay provided the projection of the target vessel on its entire length. This information was used to select the optimal C-arm angulation during catheterization. Stent implantation and control of stent placement success were evaluated by using a DSA acquisition. The transparency of the volume-rendered roadmap could have been adjusted if needed. Additional software (Stent Boost; Philips Healthcare) was used to enhance stent visualization. The generated 3D roadmap was synchronized with the C-arm/table positions to provide a live update of and to match the 2D fluoroscopy at any C-arm/table angle, position, and magnification. In case of mismatches between the IF-based roadmap and DSA, the roadmap could have been manually adjusted in the same way as for 3D angiography.
Figure 4.
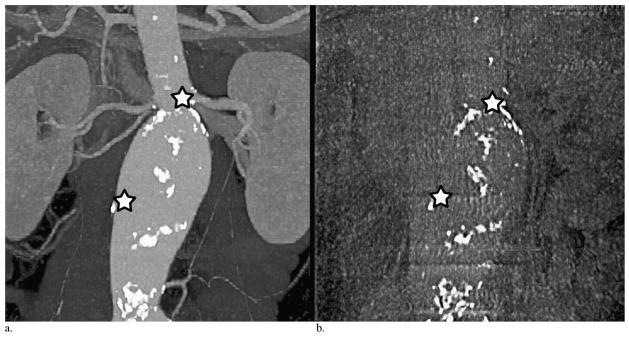
Landmarks of the aortic wall and target vessel calcifications used on preoperative CT angiography (a) to match intraprocedural cone-beam CT (b) for coregistration. The upper star is a landmark of left renal artery ostia calcification, and the lower star is a landmark of calcifications on the right aortic wall.
Figure 5.
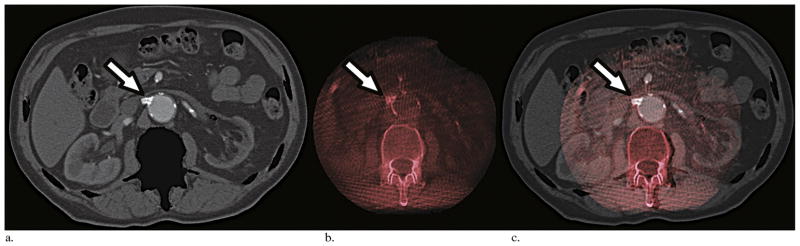
Steps of image overlay between CT angiography and cone-beam CT imaging. The overlay was done in three planes (axial, coronal, and sagittal) for all IF cases. This example shows axial slices of a CT angiogram with bone suppression (a), a cone-beam CT image in red scales (b), and the coregistration of these two imaging data sets (c). The coregistration could have been set on the 3D volume. Landmarks such as renal ostia calcification (arrows) in this case were used for the overlay.
Figure 6.

Images from the same patient in Figures 4 and 5 shows IF of the 3D arterial tree from preprocedural CT angiography (displayed with volume rendering in red) overlaid under live 2D fluoroscopy. The fenestrated endograft was positioned, and the left renal artery was catheterized by a guide wire. The target vessel for preprocedural CT angiographic IF matched the position of the catheter and guide wire seen on fluoroscopy.
Statistical Analysis
Comparison between groups was done with a Fisher exact test for dichotomous variables and Kruskal–Wallis test for continuous variables. In case of statistically significant differences, further comparison between the groups was performed by Mann–Whitney and Fisher exact tests (experiment-wise error rate of .05) for pairwise comparisons between IF and 2D angiography groups and between IF and 3D angiography groups. To measure the potential influence of the operators’ learning curve and the endograft type chosen on the endpoint values, a Pearson χ2 test was performed. A two-sided P value less than .05 was considered statistically significant. Statistical analysis was performed with the SPSS statistical software program (version 20.0; SPSS, Chicago, Illinois).
RESULTS
The three groups did not show statistically significant differences in terms of patient characteristics or aneurysm types (P ≥ .05; Table 1). As for the types of endograft placed, a significant difference among groups was observed in the number of fenestrated EVAR devices (P = .04): fewer fenestrated EVAR devices were placed in the 2D angiography group compared with the 3D rotational angiography group (P = .02). Further study endpoint results are described in detail later and summarized in Table 2.
Table 1.
Patient Data, Type of Aneurysm, and Endograft Characteristics
| Characteristic | 2D Angiography (n = 9) | 3D Angiography (n = 14) | IF (n = 14) | P Value |
|---|---|---|---|---|
| Age (y) | 69 ± 20 | 74 ± 11 | 70 ± 8 | .49 |
| Male sex | 8 (89) | 14 (100) | 13 (93) | .52 |
| Coronary heart disease | 3 (33) | 4 (29) | 9 (64) | .18 |
| Hypertension | 6 (67) | 5 (38) | 8 (57) | .35 |
| Congestive heart failure | 2 (22) | 1 (7) | 4 (29) | .43 |
| Cardiac surgery | 1 (11) | 2 (14) | 2 (14) | .99 |
| Thoracic surgery | 0 | 1 (7) | 0 | .99 |
| Aortic abdominal surgery | 3 (33) | 1 (7) | 1 (7) | .26 |
| COPD/no respiratory insufficiency | 0 | 1 (7) | 2 (14) | .77 |
| Respiratory insufficiency | 0 | 1 (7) | 4 (29) | .22 |
| Chronic renal failure | 1 (11) | 1 (7) | 1 (7) | .99 |
| Diabetes | 0 | 3 (21) | 2 (14) | .41 |
| Neurologic trouble | 0 | 0 | 2 (14) | .33 |
| Vein thrombosis (DVT/PE) | 0 | 1 (7) | 0 | .99 |
| Cancer | 1 (11) | 1 (7) | 4 (29) | .40 |
| Pacemaker | 0 | 1 (7) | 3 (21) | .42 |
| Myocardial infarction | 2 (22) | 2 (14) | 5 (36) | .50 |
| Valvular disease | 0 | 0 | 3 (21) | .42 |
| Atrial fibrillation | 0 | 1 (7) | 2 (14) | .77 |
| POAD | 0 | 3 (21) | 1 (7) | .42 |
| Dyslipidemia | 1 (11) | 5 (36) | 8 (57) | .09 |
| Graft | 0 | 0 | 1 (7) | .62 |
| Type of aneurysm, n (%) | ||||
| Juxta-renal aneurysm | 1 (11) | 0 | 2 (14) | .44 |
| Para-renal aneurysm | 7 (78) | 14 (100) | 12 (88) | .27 |
| False aneurysm | 1 (11) | 0 | 0 | .24 |
| Aneurysm diameter (mm) | 56 ± 12 | 56 ± 10 | 63 ± 16 | .37 |
| Endograft characteristic, n (%) | ||||
| Fenestrated | 4 (44) | 13 (93) | 9 (64) | .04 |
| Total target vessels | 20 | 60 | 38 | .14 |
| Total scallop | 1 | 12 | 9 | .08 |
| Chimney | 2 (22) | 0 | 4 (29) | .12 |
| Total target vessels | 8 | 0 | 14 | – |
| Branched | 3 (33) | 1 (7) | 1 (7) | .26 |
| Total target vessels | 18 | 5 | 6 | – |
| Total target vessels | 46 | 65 | 58 | .06 |
| Per patient | 5 | 5 | 4 | |
Values presented as means ± standard deviation where applicable. Values in parentheses are percentages. Target vessels included celiac trunk and superior mesenteric, renal, and internal iliac arteries.
COPD = chronic obstructive pulmonary disease, DVT = deep vein thrombosis, PE = pulmonary embolism, POAD = peripheral obstructive arterial disease.
Table 2.
Intraprocedural Data and Study Endpoint Measurements According to Image Guidance Type
| Outcome | 2D Angiography (n = 9) | 3D Angiography (n = 14) | IF (n = 14) | P Value |
|---|---|---|---|---|
| Procedure success | 8 (89) | 14 (100) | 14 (100) | .24 |
| Target vessel | 45 | 65 | 58 | .27 |
| Lost artery | 1 (4.35) | 0 | 0 | .24 |
| Procedure time (min) | 233 ± 123 | 181 ± 53 | 189 ± 60 | .59 |
| Fluoroscopy time (min) | 82 ± 46 | 42 ± 22 | 80 ± 36 | .04 |
| DAP (Gy · cm2) | 1,188 ± 1,067 | 984 ± 581 | 656 ± 457 | .18 |
| Contrast agent dose (mL) | 235 ± 145 | 225 ± 119 | 65 ± 28 | < .0001 |
Values presented as mean ± standard deviation where applicable. Values in parentheses are percentages.
Eight of nine patients in the 2D angiography group (89%), 14 patients (100%) in the 3D angiography group, and 14 patients (100%) in the IF group had successful endograft deployment, with no statistically significant difference between groups (P = .24). One patient in the 2D angiography group had an unsuccessful endograft deployment. This resulted from a complication (occlusion) during renal artery catheterization, which appeared to be secondary to technical difficulties. The mean contrast medium volumes injected were 235 mL ± 145, 225 mL ± 119, and 65 mL ± 28 in the 2D angiography, 3D angiography, and IF groups, respectively (Fig 7). There was a statistically significant reduction in contrast medium volume injected in the IF group versus the two other groups (P = .0002 vs 2D angiography; P < .0001 vs 3D angiography). The mean DAPs were 1,188 Gy · cm2 ± 1,067, 984 Gy · cm2 ± 581, and 656 Gy · cm2 ± 457 in the 2D angiography, 3D angiography, and IF groups, respectively (Fig 8). In the IF group, x-ray exposure was reduced by 45% versus the 2D angiography group and by 33% versus the 3D angiography group, but this was not statistically significant (P = .18). The mean fluoroscopy times were 82 minutes ± 46, 42 minutes ± 22, and 80 minutes ± 36 in the 2D angiography, 3D angiography, and IF groups, respectively (P = .04). There was a significant reduction in fluoroscopy time in the 3D angiography group versus the two other groups (P = .18 vs 2D; P = .02 vs IF). The mean procedure durations were 233 minutes ± 123, 181 minutes ± 53, and 189 minutes ± 60 in the 2D angiography, 3D angiography, and IF groups, respectively. There was no statistically significant difference between groups (P = .59).
Figure 7.

Mean contrast agent volume (in milliliters, with standard deviation) injected in each group, with P values of comparisons between groups. The graph shows a significant reduction in contrast agent injection volume in the IF group compared with the two other groups: P = .0002 versus 2D angiography and P < .0001 versus 3D rotational angiography.
Figure 8.

Mean x-ray exposure in each group (as DAP, in Gy · cm2, with standard deviation), with P values of comparisons between groups. The graph shows a trend toward x-ray exposure reduction in the IF group versus the 2D and 3D angiography groups.
No additional visceral artery stent occlusion was seen on the 1-week follow-up CT angiograms in all groups of patients. All data with respect to endoleak detection on 1-week follow-up CT angiography are shown in Table 3. Five endoleaks in the 2D angiography group (56%), five endoleaks in the 3D angiography group (36%), and one endoleak in the IF group (7%) were found on 1-week follow-up CT angiography. There was a nonsignificant reduction in the number of type I endoleaks in the IF group versus the 2D and 3D angiography groups (P = .07). No type III or IV endoleaks were observed in any group on 1-week follow-up CT angiography. The remaining endoleaks detected were classified as incidental type II endoleaks. The influence of the operators’ experience across time and endograft type used within each group did not show any significant correlation with any study endpoint data (P ≥ .05).
Table 3.
Endoleak on 1-week Follow-up CT Angiography per Image Guidance Type
| Endoleak | 2D Angiography (n = 9) | 3D Angiography (n = 14) | IF (n = 14) | P Value |
|---|---|---|---|---|
| Total | 5 (56) | 5 (36) | 1 (7) | .04 |
| Type I | 3 (33) | 1 (7) | 0 | .07 |
| Type II | 2 (22) | 4 (29) | 1 (7) | .38 |
| Types III/IV | 0 | 0 | 0 | – |
DISCUSSION
Complex EVAR is a therapeutic option with a trend toward lower 30-day mortality and spinal cord ischemia rates versus open surgical repair (0.8% vs 5.4% and 1% vs 1.4%, respectively) (15,16). Complex EVAR is facilitated by a variety of therapeutic endograft options available, ie, fenestrated, branched, and chimney EVAR (13,17–21). Although endovascular repair of aortic aneurysms has proven to be technically successful, it has been reported that the procedure itself requires high levels of x-ray exposure and large volumes of contrast medium (22,23). Meanwhile, the use of recently developed multimodality IF-guided procedures appears to be accurate and offers multiple applications in vascular and oncologic interventional radiology (1). In the present study, IF-guided complex EVAR showed a 100% success rate in stent-graft positioning, deployment, and catheterization of the target vessels. IF guidance has been considered as feasible and safe when used for intraprocedural imaging guidance for complex EVAR. This result is also supported by the trend toward a reduction of type I endoleak on 1-week follow-up CT angiography compared with the 2D angiography and 3D rotational angiography groups (2). This can be explained by more precise image guidance leading to a higher technical success rate and fewer postprocedural endoleak complications. In addition, a technical contribution to the improved outcomes in the IF group can be attributed to the 3D overlaid roadmap synchronization with live fluoroscopy at any C-arm/table position, angle, and magnification. The 2D angiographic roadmapping does not allow any change of the table or C-arm position without losing image registration. Therefore, any movement requires a new roadmap, increasing x-ray exposure and injected contrast agent volume, whereas 3D road-map registration allowed manual correction of the overlay.
In the 3D angiography group, roadmapping had a limited FOV (19 × 25 cm). Therefore, multiple roadmaps of the entire abdominal aorta and target vessels were needed for the proximal and lower attachment zones, whereas, in the IF group, a single roadmap could accomplish this task. In addition, 2D angiography was limited by vessel superposition or foreshortening. This increased the number of additional roadmapping scans and the volume of injected contrast medium. Therefore, IF guidance was capable of overcoming the limitations of 2D angiographic roadmap registration. To create an IF roadmap, the volume rendering from CT angiography was used, which enabled C-arm/table repositioning to minimize vessel overlap and foreshortening, without further need for additional x-ray acquisitions. This allowed the visualization of the entire CT angiographic arterial tree (aorta, ostia, and branches). IF guidance did not require intraprocedural contrast agent injection to generate a roadmap, whereas it was required for 2D and 3D angiographic image guidance. The contrast agent volume used in the IF group was significantly lower than that used for other image guidance techniques. Contrast agent injections in the IF group were mainly used before and after visceral stent placement, as well as for the final control imaging of endograft deployment (ie, final DSA).
General anesthesia was used in all treatment groups to minimize patient movement. This helped maintain the precision of roadmapping guidance with live fluoroscopy during the entire procedure. In patients with major aortic tortuosity, the rigidity of material might influence and alter the shape of the aorta’s anatomy. In such cases, 3D and IF roadmapping guidance were adjusted sequentially and intraprocedurally, for example, during the first step while the intervention was focused on the upper part of the endograft deployment and visceral stent placement, and then for the second step when the lower part of the endograft was deployed at the aortic bifurcation.
The x-ray exposure of a cone-beam CT scan varies with the angiographic system, but remains lower than that of a conventional multidetector CT scan (24–26). A threshold dose of 2 Gy has been previously described as acceptable (27). The estimated dose absorbed after a cone-beam CT scan in a porcine animal model was as high as 0.77 mSv (28). In the present study, the mean DAP at the end of the intervention was reduced in the IF group even though cone-beam CT was used. This was most likely a result of the reduction of the need to perform multiple DSA procedures. This trend of a reduction in x-ray exposure with IF guidance needs to be further investigated to confirm our preliminary results. Although multiple methods of image guidance (eg, 3D electromagnetic navigation) are available, clinical experience in aortic grafting remains limited (29–31).
The present study has four main limitations: First, the study was a retrospective analysis on a limited number of patients. A future study should include more patients and, ideally, be designed as a prospective randomized trial. Second, the chronologic enrollment of the patients into three groups could be considered as a bias based on the influence of the operator’s learning curve. However, in our institution, the operators had 8 years of experience in performing complex EVAR procedures. As a result, the procedure times for the treatment were consistent within each group and between groups. Third, patients in the 2D angiography group underwent fewer fenestrated EVAR procedures than patients in the other groups, potentially influencing the data endpoints. Finally, no accuracy measurements of the technique were performed.
In conclusion, with the benefits of successful therapy and reduction of injected contrast agent volume while maintaining x-ray exposure and procedure time, IF road-mapping guidance has the potential to reduce or replace 2D and 3D conventional roadmaps for complex EVAR.
Acknowledgments
This work was funded by National Institute of Health/National Cancer Institute Grant R01 CA160771 (to M.L.).
ABBREVIATIONS
- DAP
dose–area product
- DSA
digital subtraction angiography
- EVAR
endovascular aneurysm repair
- FOV
field of view
- IF
image fusion
- 2D
two-dimensional
- 3D
three-dimensional
Footnotes
M.L. and T.G. are paid employees of Philips Healthcare (Best, The Netherlands). None of the other authors have identified a conflict of interest.
References
- 1.Abi-Jaoudeh N, Kruecker J, Kadoury S, et al. Multimodality image fusion–guided procedures: technique, accuracy, and applications. Cardiovasc Intervent Radiol. 2012;35:986–998. doi: 10.1007/s00270-012-0446-5. [DOI] [PMC free article] [PubMed] [Google Scholar]
- 2.Ruijters D, Homan R, Mielekamp P, van de Haar P, Babic D. Validation of 3D multimodality roadmapping in interventional neuroradiology. Phys Med Biol. 2011;56:5335–5354. doi: 10.1088/0031-9155/56/16/017. [DOI] [PubMed] [Google Scholar]
- 3.Lin CJ, Blanc R, Clarencon F, et al. Overlying fluoroscopy and preacquired CT angiography for road-mapping in cerebral angiography. AJNR Am J Neuroradiol. 2010;31:494–495. doi: 10.3174/ajnr.A1757. [DOI] [PMC free article] [PubMed] [Google Scholar]
- 4.Dijkstra ML, Eagleton MJ, Greenberg RK, Mastracci T, Hernandez A. Intraoperative C-arm cone-beam computed tomography in fenestrated/branched aortic endografting. J Vasc Surg. 2011;53:583–5890. doi: 10.1016/j.jvs.2010.09.039. [DOI] [PubMed] [Google Scholar]
- 5.Kobeiter H, Nahum J, Becquemin JP. Zero-contrast thoracic endovascular aortic repair using image fusion. Circulation. 2011;124:280–282. doi: 10.1161/CIRCULATIONAHA.110.014118. [DOI] [PubMed] [Google Scholar]
- 6.Veith FJ, Abbott WM, Yao JS, et al. Guidelines for development and use of transluminally placed endovascular prosthetic grafts in the arterial system. J Vasc Interv Radiol. 2003;14(suppl):S405–S417. doi: 10.1097/01.rvi.0000094612.61428.e0. [DOI] [PubMed] [Google Scholar]
- 7.Haulon S, Amiot S, Magnan PE, et al. An analysis of the French multicentre experience of fenestrated aortic endografts: medium-term outcomes. Ann Surg. 2010;251:357–362. doi: 10.1097/SLA.0b013e3181bfda73. [DOI] [PubMed] [Google Scholar]
- 8.Greenhalgh RM, Brown LC, Powell JT, Thompson SG, Epstein D, Sculpher MJ. Endovascular versus open repair of abdominal aortic aneurysm. New Engl J Med. 2010;362:1863–1871. doi: 10.1056/NEJMoa0909305. [DOI] [PubMed] [Google Scholar]
- 9.Linsen MAM, Jongkind V, Nio D, Hoksbergen AWJ, Wisselink W. Para-renal aortic aneurysm repair using fenestrated endografts. J Vasc Surg. 2012;56:238–246. doi: 10.1016/j.jvs.2011.10.092. [DOI] [PubMed] [Google Scholar]
- 10.Moulakakis KG, Mylonas SN, Avgerinos E, et al. The chimney graft technique for preserving visceral vessels during endovascular treatment of aortic pathologies. J Vasc Surg. 2012;55:1497–1503. doi: 10.1016/j.jvs.2011.10.009. [DOI] [PubMed] [Google Scholar]
- 11.Crawford ES, Crawford JL, Safi HJ, et al. Thoracoabdominal aortic aneurysms: preoperative and intraoperative factors determining immediate and long-term results of operations in 605 patients. J Vasc Surg. 1986;3:389–404. doi: 10.1067/mva.1986.avs0030389. [DOI] [PubMed] [Google Scholar]
- 12.Bakoyiannis CN, Economopoulos KP, Georgopoulos S, et al. Fenestrated and branched endografts for the treatment of thoracoabdominal aortic aneurysms: a systematic review. J Endovasc Ther. 2010;17:201–209. doi: 10.1583/09-2964.1. [DOI] [PubMed] [Google Scholar]
- 13.Greenberg R, Eagleton M, Mastracci T. Branched endografts for thoracoabdominal aneurysms. J Thorac Cardiovasc Surg. 2010;140 (suppl):S171–S178. doi: 10.1016/j.jtcvs.2010.07.061. [DOI] [PubMed] [Google Scholar]
- 14.Crawford ES, DeNatale RW. Thoracoabdominal aortic aneurysm: observations regarding the natural course of the disease. J Vasc Surg. 1986;3:578–582. doi: 10.1067/mva.1986.avs0030578. [DOI] [PubMed] [Google Scholar]
- 15.Tsilimparis N, Perez S, Dayama A, Ricotta JJ., II Endovascular repair with fenestrated-branched stent grafts improves 30-day outcomes for complex aortic aneurysms compared with open repair. Ann Vasc Surg. 2013;27:267–673. doi: 10.1016/j.avsg.2012.05.022. [DOI] [PubMed] [Google Scholar]
- 16.Coselli JS, Bozinovski J, LeMaire SA. Open surgical repair of 2286 thoracoabdominal aortic aneurysms. Ann Thorac Surg. 2007;83(suppl):S862–S864. doi: 10.1016/j.athoracsur.2006.10.088. [DOI] [PubMed] [Google Scholar]
- 17.Verhoeven EL, Tielliu IF, Bos WT, Zeebregts CJ. Present and future of branched stent grafts in thoracoabdominal aortic aneurysm repair: a single-centre experience. Eur J Vasc Endovasc Surg. 2009;38:155–161. doi: 10.1016/j.ejvs.2009.05.002. [DOI] [PubMed] [Google Scholar]
- 18.Amiot S, Haulon S, Becquemin JP, et al. Fenestrated endovascular grafting: the French multicentre experience. Eur J Vasc Endovasc Surg. 39:537–544. doi: 10.1016/j.ejvs.2009.12.008. [DOI] [PubMed] [Google Scholar]
- 19.Coscas R, Kobeiter H, Desgranges P, Becquemin JP. Technical aspects, current indications, and results of chimney grafts for juxtarenal aortic aneurysms. J Vasc Surg. 2011;53:1520–1527. doi: 10.1016/j.jvs.2011.01.067. [DOI] [PubMed] [Google Scholar]
- 20.Becquemin JP, Pillet JC, Lescalie F, et al. A randomized controlled trial of endovascular aneurysm repair versus open surgery for abdominal aortic aneurysms in low- to moderate-risk patients. J Vasc Surg. 2011;53:1167–1173. doi: 10.1016/j.jvs.2010.10.124. [DOI] [PubMed] [Google Scholar]
- 21.Jongkind V, Yeung KK, Akkersdijk GJ, et al. Juxtarenal aortic aneurysm repair. J Vasc Surg. 2010;52:760–767. doi: 10.1016/j.jvs.2010.01.049. [DOI] [PubMed] [Google Scholar]
- 22.Walsh SR, Tang TY, Boyle JR. Renal consequences of endovascular abdominal aortic aneurysm repair. J Endovasc Ther. 2008;15:73–82. doi: 10.1583/07-2299.1. [DOI] [PubMed] [Google Scholar]
- 23.Weerakkody RA, Walsh SR, Cousins C, Goldstone KE, Tang TY, Gaunt ME. Radiation exposure during endovascular aneurysm repair. Br J Surg. 2008;95:699–702. doi: 10.1002/bjs.6229. [DOI] [PubMed] [Google Scholar]
- 24.Suzuki S, Yamaguchi I, Kidouchi T, Yamamoto A, Masumoto T, Ozaki Y. Evaluation of effective dose during abdominal three-dimensional imaging for three fiat-panel-detector angiography systems. Cardiovasc Interv Radiol. 2011;34:376–382. doi: 10.1007/s00270-010-9893-z. [DOI] [PubMed] [Google Scholar]
- 25.Hirota S, Nakao N, Yamamoto S, et al. Cone-beam CT with fiat-panel-detector digital angiography system: early experience in abdominal interventional procedures. Cardiovasc Interv Radiol. 2006;29:1034–1038. doi: 10.1007/s00270-005-0287-6. [DOI] [PubMed] [Google Scholar]
- 26.Brenner DJ, Hall EJ. Computed tomography—an increasing source of radiation exposure. New Engl J Med. 2007;357:2277–2284. doi: 10.1056/NEJMra072149. [DOI] [PubMed] [Google Scholar]
- 27.Mountford PJ, Temperton DH. Recommendations of the International Commission on Radiological Protection (ICRP) 1990. Eur J Nucl Med. 1992;19:77–79. doi: 10.1007/BF00184120. [DOI] [PubMed] [Google Scholar]
- 28.Loffroy R, Lin M, Yenokyan G, et al. Intraprocedural C-arm dual-phase cone-beam ct: can it be used to predict short-term response to TACE with drug-eluting beads in patients with hepatocellular carcinoma? Radiology. 2013;266:636–648. doi: 10.1148/radiol.12112316. [DOI] [PMC free article] [PubMed] [Google Scholar]
- 29.Abi-Jaoudeh N, Glossop N, Dake M, et al. Electromagnetic navigation for thoracic aortic stent-graft deployment: a pilot study in swine. J Vasc Interv Radiol. 2010;21:888–895. doi: 10.1016/j.jvir.2009.12.402. [DOI] [PMC free article] [PubMed] [Google Scholar]
- 30.Cochennec F, Riga C, Hamady M, Cheshire N, Bicknell C. Improved catheter navigation with 3D electromagnetic guidance. J Endovasc Ther. 2013;20:39–47. doi: 10.1583/12-3951.1. [DOI] [PubMed] [Google Scholar]
- 31.Manstad-Hulaas F, Tangen GA, Dahl T, Hernes TA, Aadahl P. Three-dimensional electromagnetic navigation vs. fluoroscopy for endovascular aneurysm repair: a prospective feasibility study in patients. J Endovasc Ther. 2012;19:70–78. doi: 10.1583/11-3557.1. [DOI] [PubMed] [Google Scholar]