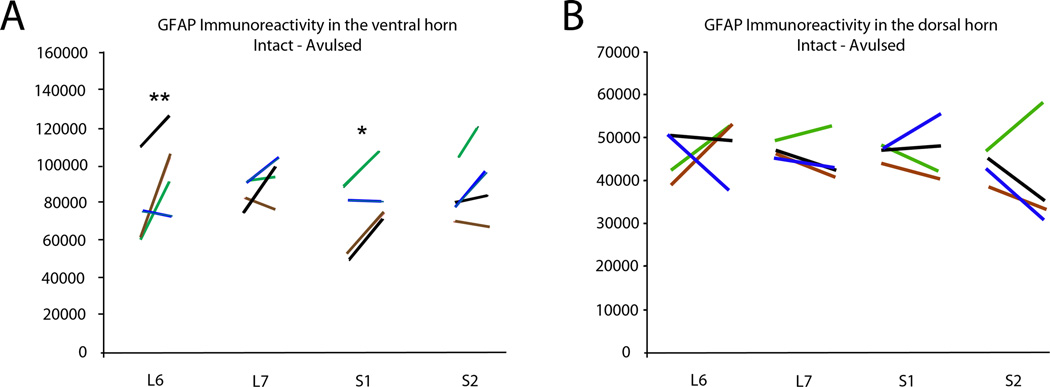
Figure 5.

Graph demonstrating immunoreactivity for GFAP in the ventral horn (A) and dorsal horn (B) of the L6-S2 segments. The left and right ends of each line represent the number of pixels corresponding to GFAP labeling for the intact and avulsed sides, respectively. The black, blue, brown, and green color codes for the lines each represent a different subject. Note a significantly increased GFAP immunoreactivity in the ventral horn of the L6 and S1 segments with * indicating p < 0.05 and ** indicating p < 0.01.
