

Abstract
Coordinated studies with adults, infants, and nonhuman animals provide evidence for two distinct systems of nonverbal number representation. The “parallel individuation” (PI) system selects and retains information about one to three individual entities and the “numerical magnitude” system establishes representations of the approximate cardinal value of a group. Recent event‐related potential (ERP) work has demonstrated that these systems reliably evoke functionally and temporally distinct patterns of brain response that correspond to established behavioral signatures. However, relatively little is known about the neural generators of these ERP signatures. To address this question, we targeted known ERP signatures of these systems, by contrasting processing of small versus large nonsymbolic numbers, and used a source localization algorithm (LORETA) to identify their cortical origins. Early processing of small numbers, showing the signature effects of PI on the N1 (∼150 ms), was localized primarily to extrastriate visual regions. In contrast, qualitatively and temporally distinct processing of large numbers, showing the signatures of approximate number representation on the mid‐latency P2p (∼200–250 ms), was localized primarily to right intraparietal regions. In comparison, mid‐latency small number processing was localized to the right temporal–parietal junction and left‐lateralized intraparietal regions. These results add spatial information to the emerging ERP literature documenting the process by which we represent number. Furthermore, these results substantiate recent claims that early attentional processes determine whether a collection of objects will be represented through PI or as an approximate numerical magnitude by providing evidence that downstream processing diverges to distinct cortical regions. Hum Brain Mapp 33:2189–2203, 2012. © 2011 Wiley Periodicals, Inc.
Keywords: cognition, attention, parietal lobe, brain electrophysiology
INTRODUCTION
Behavioral and brain imaging research demonstrates robust signatures of nonsymbolic, abstract number representation in human infants, human adults, and many non‐human animals (see Dehaene [ 1997], Feigenson et al. [ 2004], and Gallistel [ 1990] for reviews). Furthermore, studies of both healthy and brain‐damaged human adults show certain regions of the parietal lobe, most notably, the intraparietal sulci (IPS), are essential to representing and comparing quantities [Dehaene et al., 2003; Nieder and Dehaene, 2009]. Neurophysiologic research with non‐human primates in proposed homologous brain regions to IPS suggests number may even be represented at the level of single neurons [Neider and Miller, 2003; Roitman et al., 2007]. Taken together, this work suggests that numerical representation is a fundamental cognitive ability that is continuous across ontogeny and phylogeny (for a review, see Dehaene [ 2009] or Feigenson et al. [ 2004]).
Despite the wealth of knowledge regarding the nature of and neural mechanisms involved in number representation, relatively little work has been done to probe the process of number representation. This may result, in part, from a lack of temporal precision in the primary methods that have been deployed, namely fMRI, behavioral reaction time/accuracy, and infant looking‐time. Overt responses collected in behavioral experiments are the output sum of many cognitive and brain processes, making it difficult to determine the contribution of each process without sophisticated experimental procedures designed to tease them apart [Posner, 1986; Scarborough and Sternberg, 1998] Likewise, most studies of numerical processing in the brain have used fMRI, a method with notoriously poor temporal resolution, resulting in activation maps with little detail on the order of activation for different brain regions. In other words, it is still unclear when we see arrays of objects, what are the processes and corresponding brain structures that allow us to abstract away, compare, and operate on their numerosities?
By investigating the process of number representation, we may come to better understand how abstract number is derived from sensory stimulation. We may also gain an understanding of the role that more general‐purpose cognitive/brain systems play in producing, limiting, and altering representations of number. Event‐related potentials (ERPs) are particularly well suited for studying number processing given their precise temporal resolution that allows neural processes to be tracked millisecond by millisecond. In addition, the spatial resolution of scalp ERPs can be increased by applying source localization algorithms to estimate the neural generators from the distribution of electrical activity on the scalp (see Pascual‐Marqui [1999] for a review). This method of source estimation from ERPs, albeit more spatially coarse than fMRI, provides the unique possibility of localizing differences at specific time points/stages of processing at the resolution of milliseconds.
By understanding the processing stream and the neural generators involved in representing number at different stages of the processing stream, we may also gain insight into a currently debated issue within the literature on number processing: whether small and large numbers are represented by the same cognitive system or by distinct cognitive systems. The “two core systems” view proposes that small numbers of objects or events (one to three or four items) are represented through a parallel individuation system (PI) as distinct items simultaneously in space. Large numbers (>4 items), in contrast, are represented through the approximate number system (ANS) that forms a summary representation of the objects as a group with an approximate numerical magnitude [Feigenson et al., 2004]. In contrast, others propose, regardless of whether PI occurs for small numbers, that all numbers are represented by the ANS [Cordes and Brannon, 2009; Cordes et al., 2001; Gallistel and Gelman, 2000]. Both views are supported by empirical evidence making it difficult to determine the correct interpretation.
Recent ERP work on number processing has begun to reconcile this literature [Hyde and Spelke, 2009, 2011; Libertus et al., 2007]. The ERP work has shown that small and large number processing dissociates in pattern and in time: small numbers modulate an early visuospatial attentional component (N1) by the cardinal value of the display: irrespective of the previous numerical context, the response is largest for three objects, smaller for two objects, and smallest for one object. In contrast, large numbers modulate a mid‐latency component (P2p) by ratio of change irrespective of cardinal value: responses of equal magnitude occur for arrays of 8, 16, and 24 elements, but responses are greater when the current magnitude is closer in value (hence, less easily discriminated from) to the previous magnitude [Hyde and Spelke, 2009]. These signatures map onto the behavioral signature limits shown in human infants and adults, suggesting that, in this situation, distinct cognitive/brain systems are engaged to represent small and large numbers.
Further research provides evidence that the earliest ERP differences result from differences in selection by visual attention. The cardinal value modulation for small numbers can be inhibited if objects are presented outside the resolution of visual‐spatial attention, such that the objects in an array cannot be individuated [Hyde and Wood, in press]. Such inhibition of individuation results in the absence of an early N1 effect for cardinal value and the presence of a later modulation of P2p by ratio irrespective of cardinal value [Hyde and Wood, in press]. Together, this ERP work on number processing suggests that differences observed between small and large number representation result from early differences in attentional selection, and these differences determine whether an array of objects will be represented by the approximate numerical magnitude system or through PI. In other words, it seems to be the case that the two systems are not specialized for small and large numbers per se, rather early attentional selection and its corresponding limits determine whether objects will be represented as distinct individuals or approximate numerical magnitudes.
What brain regions underlie these dissociations? Do individuation and numerical approximation engage the same brain area in different ways or do different brain regions serve to represent distinct individuals and approximate numerical magnitudes? A complete picture of the timing, pattern, and localization of these effects can provide a better basis not only for linking these components to identifiable brain processes but also for understanding the dissociations between processing of individuals and of numerical magnitudes.
In the present study, we apply high‐density ERP recordings to investigate the brain mechanisms involved in numerical processing of small and large numbers, under conditions in which the former have been found to activate processes of PI and the latter have been found to activate processes of the ANS. In particular, we were interested in isolating ERP differences between small and large numbers over the first 400 msec and estimating the source of these differences in the brain. We focused our analysis on two temporally distinct components identified in the previous studies to be related to number processing: N1 (∼150 ms) and P2p (∼250 ms) [Dehaene, 1996; Hyde and Spelke, 2009; Libertus et al., 2007; Temple and Posner, 1998].
In addition to being modulated by cardinal value for small numbers presented under conditions that favor PI, N1 has been shown to be modulated by variations in numerical format (symbolic vs. nonsymbolic) and more broadly by visual attention in a variety of classic paradigms (see Hillyard and Anllo‐Vento [ 1998], Hillyard et al. [ 1990], Hillyard et al. [ 1998], and Luck [ 2005]). For example, the N1 is greater in magnitude (more negative) for an object appearing at a cued location compared to a noncued location. Attempts to localize the early visual‐attentional processing using ERP source localization as well as multimodal imaging approaches in these contexts have estimated it to originate from ventral visual areas including extrastriate cortex (fusiform and middle occipital regions) regions [Di Russo et al., 2001, 2003; Heinze et al., 1994; Hillyard and Anllo‐Vento, 1998].
In contrast, the P2p has been shown to respond to numerical ratio in both symbolic number comparison tasks and nonsymbolic passive viewing tasks [Dehaene, 1996; Hyde and Spelke, 2009; Libertus et al., 2007; Pinel et al., 2001; Temple and Posner, 1998]. That is, P2p responds to the distance between two numbers to be compared or between two numbers presented sequentially in an adaptation context. Effects on the P2p have been estimated to occur in parietal regions including bilateral regions of the intraparietal sulcus [Dehaene, 1996; Pinel et al., 2001], an area showing the same patterns of modulation in fMRI studies [Ansari et al., 2006; Cantlon et al., 2006; Dehaene, 1996; Piazza et al., 2004]. These intraparietal regions show some degree of specialization for number, as they respond to numerical but not non‐numerical variables such as shape [Hyde et al., 2010; Piazza et al., 2004]. If the P2p is the electrophysiological instantiation of number‐specific activity, then it should show the same specialization profile and a comparable localization as the BOLD response to nonsymbolic number in fMRI studies.
However, from the literature, it is still unclear whether arrays presenting small numbers of individuals will engage IPS regions during this same time window. One recent study suggests processing small quantities (one to five) does, in fact, activate superior parietal and anterior IPS regions increasingly by number [Santens et al., 2010]. It is possible that the processes of PI may also activate distinct or additional brain structures. For example, Ansari and colleagues [ 2007] showed using fMRI that nonsymbolic number comparison in the small number range resulted in an increase in activity in right temporal‐parietal junction (RTPJ) in contrast to a deactivation of this area for large number comparison. If individuation and enumeration depend on the same cognitive system, then observed ERP differences may be localized to the same brain region. On the other hand, if distinct cognitive systems are engaged, localization of distinct ERP differences may reveal spatial differences in processing.
We tested these predictions by analyzing the ERP during the time windows of interest, identifying significant differences between small and large number processing, and applying low‐resolution electromagnetic tomography (LORETA) to estimate the neural generators of the significant ERP effects [Pascual‐Marqui et al., 1994, 1999, 2002].
METHODS
Participants
Sixteen adult participants aged 18–30 from the Cambridge, MA, community participated in the experiment for either psychology course credit or 15 dollars. Informed consent was obtained from all participants before beginning the experiment.
Procedure
Participants viewed the sequential presentation of novel images containing arrays of objects. Images were presented for 250 msec and separated by an interstimulus‐interval for a random duration between 750 and 1500 ms. An adaptation paradigm was used in which a majority of the images contained the same number of objects all of the same shape [Cantlon et al., 2006; Hyde and Spelke, 2009; Izard et al., 2008; Piazza et al., 2004, 2007]. Occasionally, test images were presented that contained either the same number of objects of the same shape as the context (no‐change), a different number of objects of the same shape (number change), or the same number of objects but all of a different shape (shape change). Participants were instructed to focus on a fixation cross that was continually present in the middle of the screen throughout the experiment and to pay attention to the pictures that were presented in order to answer questions about them afterward. Participants were not instructed to focus on any particular aspect of the pictures, and they were not told that the experiment aimed to probe responses to number.
Stimuli
Images (650 × 650 pixels) consisted of white objects on a gray background and were constructed using a method and automated program that allowed us to control for continuous parameters other than the number within the experiment ([Hyde and Spelke, 2009; Hyde and Wood, in press; Izard et al., 2008; Piazza et al., 2004; Xu and Spelke, 2000]; see Dehaene et al.1 for documentation). Because all continuous properties of object arrays cannot be controlled at one time between arrays of different numbers (i.e., equating the size of individual objects necessarily produces a correlation between number and total occupied area), some properties were equated during the adaptation displays and the others during test images. We equated the intensive parameters (individual item size and interitem spacing) of the arrays across the test stimuli and varied the extensive parameters (total occupied area and total luminance) of the test arrays randomly. These extensive parameters, however, were equated across the adaptation arrays of different numbers, by varying them across adaptation stimuli with the constraint that the values for the extensive parameters were drawn randomly from fixed distributions that spanned the range of values used for test stimuli. This process resulted in test stimuli that were equally familiar with regard to the continuous parameters other than number, because these values had already been presented equally often in the adaptation images [Hyde and Spelke, 2009; Hyde and Wood, in press; Izard et al., 2008; Piazza et al., 2004, 2007].
Design
Participants were presented with two large number blocks and two small number blocks, the order of which was random with the constraint that either both large or both small blocks were presented first and order (small or large blocks first) was counterbalanced across participants. During the small number blocks, participants were adapted to two circles with occasional test arrays of two circles (no change), three circles (number change), or two squares (shape change) and adapted to three circles with occasional test arrays of three circles, two circles, or three squares. During the large number blocks, participants were adapted to 16 circles with occasional test arrays of 16 circles (no change), 24 circles (number change), or 16 squares (shape change) and 24 circles with occasional test arrays of 24 circles, 16 circles, or 24 squares. Within each block, subjects saw a total of 900 images. Thirty test trials per experimental condition were presented per adaptation block for a total of 60 test trials per experimental condition over the entire experiment.
Apparatus
Stimuli were presented via E‐Prime software (PST, Pittsburg, PA) on a 16‐in. computer monitor located ∼150 cm from the seated participant. While viewing stimuli, the ongoing EEG was recorded from 128 channels using a Geodesic Sensor Net (EGI, Eugene, OR) digitally filtered at 0.1–100 Hz with a sampling rate of 250 Hz.
Data reduction and analysis
After testing, recordings were low pass filtered at 30 Hz. Test trials were segmented into experimental conditions based on 200 msec of recording before to 700 msec of recording after each stimulus presentation. Segments containing artifacts (eye blink, eye movement, head movement, or excessive noise) and/or more than 10 bad channels were detected and rejected by computer algorithm. Bad channels during trials that contained no artifacts and less than 10 total bad channels were corrected using automated spherical spline interpolation. The remaining artifact‐free trials were averaged for each of the experimental conditions for each subject, re‐referenced to the average reference, and baseline corrected to 200 msec before stimulus onset. Grand means for each of the experimental conditions and grand averages of small and large number processing were computed for analysis and visualization purposes.
Scalp ERP analysis
Two posterior components of interest were targeted given the previous literature implicating them in small/large number processing differences: N1 and P2p. N1 has been shown to be modulated by cardinal value for small, but not large numbers and P2p have been shown to be modulated by ratio of change for large but not small numbers [Hyde and Spelke, 2009; Libertus et al., 2007]. To decide whether to analyze the components evoked by small and large numbers together or separately, we conducted a preliminary analysis comparing the peak latencies and scalp topography (10 sites with the greatest mean amplitude out of all 60 posterior sites between 100–200 msec for N1 and 200–400 msec for P2p). Similarities in either peak latency or scalp topography warranted a combined analysis with numerical range (large or small numbers) as a factor in the design; differences in both peak latency and peak electrode sites warranted separate analysis of small and large number processing.
Specific experimental effects were tested on averages over ten scalp sites and determined based the overlapping electrode sites shown to characterize these components in two previous experiments (EGI GSN 128 electrode sites: 59, 60, 65, 66, 67, 78, 85, 86, 91, and 92) [Hyde and Spelke, 2009]. Using our previous analysis of peak latency, specific time windows were chosen based on 10 msec before to 10 msec after the N1 peak and 20 msec before to 20 msec after the peak for P2p (see Results section below for exact time windows used for each analysis).
Source localization
The source of significant ERP results was investigated by computing the 3D cerebral current density using LORETA [Pascual‐Marqui et al., 1994, 2002]. LORETA is based on a three‐shell spherical head model [Pascual‐Marqui et al., 1994, 1999, 2002] with electrode coordinates derived from cross‐registrations between spherical and realistic head geometry registered to standardized stereotactic space available as digitized MRI from the Brain Imaging Centre (Montreal Neurologic Institute, MNI305) [Towle et al., 1993]. LORETA solves the inverse problem by assuming synchronous and simultaneous activation of neighboring neurons. Importantly, the number of identified sources is driven by the data; LORETA assumes no specific number of underlying sources. Solution space consists of 2,394 voxels restricted to cortical gray matter and hippocampi. Each voxel's current density is computed as the linear, weighted sum of scalp electric potentials over the same time window used for the ERP analysis. Data were normalized to a total current density of 1 and then log transformed for each subject before statistical analysis. Given the a priori hypotheses regarding timing and localization, we defined a cluster as any group of three or more significant voxels adjacent in 3D space (significance threshold of P < 0.05). All clusters meeting this significance threshold are reported below.
RESULTS
N1
Preliminary analysis
To test whether small and large number processing during this time frame (100–200 ms) should be characterized as the same or different components, we compared peak latency and scalp topography. The analysis of peak latency revealed a small but significant difference, with the N1 peak at 173 msec for small numbers and at 155 msec for large numbers [F(1,15) = 15.22, P < 0.005, η = 0.50] (see Fig. 1). A comparison of the top 10 sites (out of all 60 posterior sites) showing the greatest magnitude N1 (collapsed across experimental change conditions) revealed 9 of the top 10 sites with the greatest mean amplitude between 100 and 200 msec overlapped for small and large numbers (see Fig. 1). Given the highly overlapping scalp topography and small peak latency difference (18 ms) between small and large number processing, we analyzed the N1 jointly for small and large numbers.
Figure 1.

Grand average ERP response to small and large numbers. A: Grand average waveform for small and large numbers over the posterior scalp. B: Average scalp topography for large and small numbers at time points characterizing the N1, P2p, and P3.
Experimental analysis
N1 was specifically defined, based on the peak latencies, as the mean amplitude between 163–183 msec for small numbers and 145–165 for large numbers (10 msec before to 10 milliseconds after the peak) over 10 posterior parietal sites identified in previous studies to be sensitive to number processing (see Methods section). A repeated measures ANOVA with the variables of Cardinal Value, Numerical Range, and Hemisphere revealed a significant main effect of Cardinal Value [F(1,15) = 10.52, P < 0.01, η = 0.41], a significant main effect of Numerical Range [F(1,15) = 12.59, P < 0.005, η = 0.46], and a significant Cardinal Value by Numerical Range interaction [F(1,15) = 6.69, P < 0.05, η = 0.31]. Post hoc tests revealed a significant effect of Cardinal Value for small numbers [t(15) = 4.11, P < 0.005], where N1 amplitude was greater for instances of “3” compared to instances of “2” (see Fig. 2). No significant effect of Cardinal Value on N1 was observed for large numbers [t(15) = 0.91, P > 0.37].
Figure 2.

Effects of cardinal value on N1. A: Average ERP waveforms over the posterior scalp for each cardinal value presented from −200 to 600 msec after stimulus onset. B: Source localization of N1 cardinal value effect for small numbers. C: Mean N1 amplitudes for cardinal values presented in the small and large number range. The “*” indicates a significant (P < 0.05) difference or interaction.
Source localization of the entire scalp topography during this time frame revealed greater current density in response to cardinal value (greater for images of “ 3” compared to images of “2”) in nine distinct brain regions (see Table I and Fig. 2). Four distinct frontal regions including left and right middle and superior frontal, right insular cortex, and medial frontal regions showed greater current density for the greater cardinal value. Frontal differences observed most likely characterize ERP differences over frontal and central electrode sites not directly targeted in our study. Similarly, three distinct temporal regions showed greater current density for the greater cardinal value including left middle temporal, right superior temporal, and right anterior temporal regions. Finally, greater response for the greater cardinal value was observed in right extrastriate visual regions including middle occipital and fusiform areas and left inferior parietal regions. The posterior N1 response targeted in our study most likely originates from the combination of activity from these two posterior regions. No region responded more to the smaller cardinal value (2) compared to the larger cardinal value (3) during this time window.
Table I.
Source localization of scalp response to cardinal value during time window characterizing the N1 for small numbers
| Primary lobe | Region (s) | Cluster size | Broadman's area(s) BA | Peak voxel (t value, P value, MNI coordinates) |
|---|---|---|---|---|
| Frontal | Left superior and middle frontal | 14 | 10, 11 | t(15) = −3.16, P < 0.01; MNI: −31, 52, −13 |
| Frontal | Right superior and middle frontal | 18 | 10, 11 | t(15) = −4.54, P < 0.0005; MNI: 25, 52, 15 |
| Frontal | Right insula | 33 | 13, 45, 47 | t(15) = −4.05, P < 0.005; MNI: 39, 24, 8 |
| Occipitala | Right middle occipital | 5 | 18, 19 | t(15) = −3.15, P < 0.01; MNI: 32, −95, 1 |
| Parietala | Left inferior parietal/precuneus | 5 | 19 | t(15) = −2.41, P < 0.05; MNI: −24, −81, 36 |
| Temporal | Left middle temporal | 10 | 39, 40 | t(15) = −3.41, P < 0.005; MNI: −52, −74, 22 |
| Temporal | Right superior temporal | 6 | 39, 40 | t(15) = −2.58, P < 0.05; MNI: 53, −60, 22 |
| Frontal | Medial frontal | 7 | 9 | t(15) = −2.45, P < 0.05; MNI: −3, 52, 29 |
| Temporal | Anterior temporal | 4 | 42, 43 | t(15) = −2.47, P < 0.05; MNI: 53, −18, 15 |
Indicates likely source of N1 cardinal value effect for small numbers.
P2p
Preliminary analysis
To determine whether to analyze small and large numbers as the same or different components, we compared peak latency and scalp topography between 200 and 400 ms. A test of peak latency revealed a significant difference between small and large numbers [F(1,15) = 66.61, P < 0.001, η = 0.82], with a positive peak at 334 msec for small numbers and at 280 msec for large numbers (see Fig. 1). A comparison of mean amplitudes across all posterior electrode sites (60 total) for large and small numbers revealed only 6 of the 10 sites with the greatest mean amplitudes overlapped between large and small numbers (see Fig. 1). The combination of both large latency differences (54 msec) and scalp topography differences suggested that scalp activity during this time range could be explained by separate components for large and small numbers and therefore warranted independent analysis. Topography and timing of large number processing were consistent with previous reports of P2p; small number processing was better characterized as P3, given its timing and scalp topography (see Fig. 1).
Experimental analysis
Large numbers (P2p)
Based on our latency analysis, we defined P2p as the mean amplitude between 260 and 300 msec for large numbers over 10 sites identified as sensitive to number processing in previous studies (see Methods section). A repeated measures ANOVA with the variables of Number Change (no change and number change) and Hemisphere (left and right) revealed a significant interaction between Number Change and Hemisphere [F(1,15) = 4.66, P < 0.05, η = 0.24]. Post hoc analysis revealed that this interaction could be explained by the fact that greater P2p amplitudes were observed for the change condition compared to the no change condition over right [t(15) = −2.54, P < 0.05] but not left lateralized sites [t(15) = −0.31, P > 0.76] (see Fig. 3).
Figure 3.

Effects of number change on P2p for large numbers and P3 for small numbers. A: Average waveform over the posterior scalp for each of the experimental conditions within the large number range. B: Graph comparing mean P2p amplitude across large number experimental conditions. C: Average waveform over the posterior scalp for each of the experimental conditions within the small number range. D: Graph comparing mean P3 amplitude across small number experimental conditions.
The source localization algorithm comparing scalp topography in this time frame between the large number no‐change and change conditions revealed greater current density for the change condition in eight distinct brain regions (see Table II and Fig. 4). Four frontal regions and two temporal regions including regions spanning left middle temporal, right middle and superior temporal, left and right middle and inferior frontal, right superior frontal, and medial frontal regions showed greater current density for the change condition in contrast to the no‐change condition. The P2p effect observed on the scalp, however, most likely resulted from the combination of three distinct posterior clusters observed to show greater current density for change compared to no change: right superior parietal, right inferior parietal, and right middle/inferior occipital regions. Only one small cluster, located in the left middle temporal region, showed greater response to the no‐change condition during this time window for large numbers.
Table II.
Source localization of scalp response to “no‐change” versus “number change” during the time window characterizing the P2p for large numbers
| Condition (greater current density) | Primary lobe | Region (s) | Cluster size | Broadman's area(s) BA | Peak voxel (t value, P value, MNI coordinates) |
|---|---|---|---|---|---|
| No change | Temporal | Left middle temporal | 3 | 21 | t(15) = 2.91, P < 0.01; MNI: −66, −39, −13 |
| Change | Temporal | Right middle and superior temporal | 17 | 37, 22, 21 | t(15) = −4.46, P < 0.0005; MNI: 60, −53, 1 |
| Change | Parietala | Right inferior parietal/superior occipital | 8 | 19, 18, 7 | t(15) = −4.31, P < 0.001; MNI: 25, −88, 36 |
| Change | Parietala | Right superior parietal/postcentral | 3 | 5, 7 | t(15) = −2.42, P < 0.05; MNI: 25, −46, 71 |
| Change | Frontal | Medial frontal/ACC | 16 | 10, 32, 24 | t(15) = −2.98, P < 0.01; MNI: 11, 52, 8 |
| Change | Frontal | Left middle and inferior frontal | 36 | 6, 8, 9, 45, 46 | t(15) = −3.20, P < 0.01; MNI: −38, 3, 36 |
| Change | Frontal | Right middle frontal | 7 | 6, 8 | t(15) =−3.17, P < 0.01; MNI: 32, 10, 57 |
| Change | Occipitala | Right middle and inferior occipital | 6 | 19 | t(15) = −3.05, P < 0.01; MNI: 46, −81, −6 |
| Change | Frontal | Right superior frontal/precentral | 6 | 6, 44 | t(15) = −2.56, P < 0.05; MNI: 53, 3, 8 |
Indicates likely source of P2p number change effect for large numbers.
Figure 4.
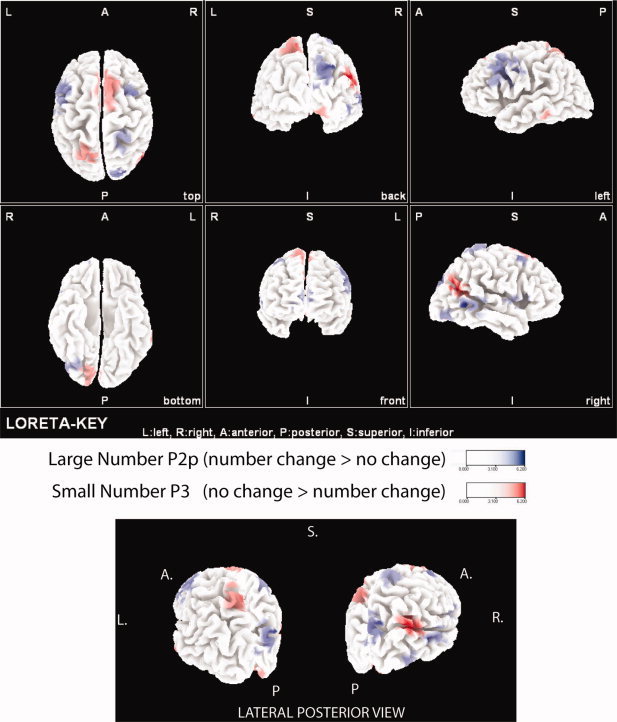
Source localization of number change effects. Blue represents localization of the large number P2p effect (number change > no change). Red represents the localization of the small number P3 effect (no change > number change).
To test the numerical specificity of this response, we compared the P2p of the number change condition to that of the shape change condition for the right lateralized response. This analysis showed that the number changes elicited a greater amplitude P2p compared to shape changes [t(15) = 3.69, P < 0.005], just like in the comparison of the number change condition to the no‐change condition (see Figs. 3 and 5). This suggests that the response to number was specific to “number” change and not simply any sort of perceptual change.
Figure 5.

Source localization for P2p number‐specificity effects. Blue highlights represent ERP localization of areas that responded more to large number‐shape changes compared to large number‐number changes. Red areas represent the ERP localization of areas that responded more to large‐number number changes compared to large‐number shape changes.
Small numbers (P3)
On the basis of our analysis of peak latency, we defined the P3 as the mean amplitude between 315 and 355 msec for small numbers (see Fig. 1). A repeated measures ANOVA revealed a significant main effect of Hemisphere [F(1,15) = 7.05, P < 0.05, η = 0.32] and a significant interaction between Number Change and Hemisphere on the P3 [F(1, 15) = 11.94, P < 0.005, η = 0.44]. Post hoc testing revealed that this interaction could be explained by the fact that P3 amplitude was greater for the no‐change condition compared to the change condition over left [t(15) = 2.76, P < 0.05] but not right hemisphere electrode sites [t(15) = 0.25, P > 0.80] (see Fig. 3). A comparison of the number change to shape change P3 over the left hemisphere group revealed no significant difference [t(15) = 0.78, P > 0.44], suggesting that this modulation was not number specific (see Fig. 3).
Source localization showed four distinct regions with greater current density for the no‐change condition compared to the change condition on the P3 for small numbers (see Table III and Fig. 4). These clusters included a medial frontal/cingulate, a left superior frontal, a right temporal‐parietal, and a left superior parietal region (see Fig. 4). The left lateralized ERP effects most likely result from the left superior parietal region. It is also possible that the ERP effects result from the combination of activity from both the left parietal and right temporal‐parietal regions. Four distinct clusters showed greater current density for the change condition (opposite the ERP effect) including a right inferior temporal, a right inferior parietal, a left superior frontal, and a right ventral occipital region.
Table III.
Source localization of scalp response to “no‐change” compared to “number change” during the time window characterizing the P3 for small numbers
| Condition (greater current density) | Primary lobe | Primary region (s) | Cluster size | Broadman's area(s) BA | Peak voxel (t value, P value, MNI coordinates) |
|---|---|---|---|---|---|
| No change | Temporala | Right temporal‐parietal junction | 21 | 39, 22, 40 | t(15) = 6.13, P < 0.00005; MNI 46, −60, 22 |
| No change | Parietala | Left superior parietal | 17 | 7 | t(15) = 4.07, P < 0.001; MNI −10, −67, 64 |
| No change | Frontal | Right superior frontal | 25 | 6, 8, 24, 32 | t(15) = 3.07, P < 0.005; MNI 4, 31, 57 |
| No change | Frontal | Medial frontal/cingulate | 12 | 24 | t(15) = 2.67, P < 0.01; MNI = −10, 3, 43 |
| Change | Occipital | Inferior occipital | 6 | 18 | t(15) = 2.58, P < 0.05; MNI: 11, −88, −13 |
| Change | Temporal | Right inferior temporal | 16 | 10, 13, 20, 37 | t(15) = −3.48, P < 0.005; MNI 46, −32, −20 |
| Change | Parietal | Right inferior parietal | 6 | 7, 40 | t(15) = −2.55, P < 0.05; MNI 60, −32, 22 |
| Change | Frontal | Left superior frontal | 11 | 4, 9, 22, 10 | t(15) = −3.01, P < 0.005; MNI: −17, 45, 36 |
Indicates likely source of P3 number change effect for small numbers.
DISCUSSION
The aim of this study was to better understand number processing by investigating the neural generators of several distinct ERP components shown to be modulated differentially by small and large numbers. ERP results showed early modulation of the N1 by cardinal value for small but not large numbers, replicating previous ERP work [Hyde and Spelke, 2009; Hyde and Wood, in press; Libertus et al., 2007]. These ERP scalp differences were localized to right extrastriate visual and left parietal regions. These localization results accord with independent research investigating the neural basis of spatial attention using both ERP and fMRI, where effects of attention on N1 have also been localized to ventral extrastriate and posterior parietal regions [Di Russo et al., 2001, 2003; Heinze et al., 1994; Hillyard and Anllo‐Vento, 1998]. Ventral activity during this time frame may be indicative of enhanced processing of that contained in the attended location, as these ventral areas are routinely associated with object and pattern recognition in other experiments [Martínez et al., 2001]. In contrast, posterior parietal activity seen during this time frame may be indicative of sustained attention to the particular locations in space, as these parietal regions are routinely activated in tasks that require sustained covert attention [Corbetta and Shulman, 2000; Hopfinger et al., 2000; Kastner et al., 1999; Sereno et al., 2001]. The emerging picture, then, given our localization and recent experiments of the role of attention in number processing [Burr et al., 2010; Hyde and Spelke, 2009; Hyde and Wood, in press], is that N1 modulation reflects the distribution and maintenance of attention to particular locations in space evoked by particular items. Furthermore, differences between small and large number processing can be attributed to differences in the distribution and maintenance of spatial attention.
It should also be noted that N1 peak latency differences were observed between small and large numbers, where N1 peaked nearly 20 msec earlier for large numbers compared to small numbers. This latency difference falls nicely into the proposed framework that N1 modulation in number processing experiments reflects attentional selection and the attentional system is taxed differentially for small and large numbers in our experiment. In particular, for large numbers, one item (the group) is always selected, but for small numbers (at least those greater than one), multiple items are selected in parallel. As a result, it may take the attentional system longer, on average, to select multiple items in parallel compared to the selecting the group as a whole.
ERP results also showed small and large numbers to evoke distinct mid‐latency components over posterior scalp sites between 200 and 400 msec that were modulated in contrasting ways. Large numbers evoked a P2p that peaked around 280 msec over widespread left and right posterior sites while small numbers evoked a P3 that peaked around 334 msec over more left posterior and central sites. The spatiotemporal distinction between the P2p for large numbers and a later peaking P3 for small numbers on the scalp is novel, given that previous studies have analyzed small and large number processing during this time frame according to the same time window and scalp sites [Dehaene 1996; Hyde and Spelke, 2009; Hyde and Wood, in press; Libertus et al., 2007; Temple and Posner, 1998]. The observed distinction suggests that assumptions regarding similar neural origins of processing small and large numbers during mid‐latency time windows may be incorrect.
It should be noted that the pattern of modulation of mid‐latency processing for small and large numbers was also different than previously observed. We observed the “number change” condition to produce greater magnitude ERPs compared to the “no‐change” condition, and previous studies have shown the opposite pattern of results [Hyde and Spelke, 2009; Hyde and Wood, in press]. This difference may be accounted for by the differences in the experimental design, in particular the probability of “number change” events to “no‐change” events. In previous studies, multiple ratio changes appeared within each block; subjects saw the number change from the adaptation number about every seven to eight images. In contrast, the present study presented only one type of “number change” event, and number change events were interspersed with shape change events that contained the same number of items as the adaptation context; this design presented a number change every 15 images or so. The substantial difference in probability of a number change to no‐change in the current study compared to the probability of number change to no‐change in previous studies may account for the difference in the pattern of P2p response. This result raises an interesting question about the relationship between P2p modulation, cognitive number representation, and the physiological properties that give rise to it. Future work should systematically examine how different factors including probability of number change, active versus passive number processing, and task demands relate to the functional response of the P2p and its relationship to number representation.
Further novel evidence for a distinction between small and large number processing was obtained through the LORETA source analysis of the significant mid‐latency ERP effects. Large number P2p modulation was localized primarily to right‐lateralized parietal and occipital regions. Crucially, the observed parietal regions correspond with those identified in other studies of numerical cognition using a wide variety of neural measures [Ansari et al., 2006; Hyde et al., 2010; Piazza et al., 2004; Pinel et al., 2001]. More specifically, Figure 6 depicts the nearest LORETA voxel to the peak voxels reported in several recent fMRI studies of nonsymbolic number processing superimposed over the localization of the significant mid‐latency ERP effects found in the present study [Ansari et al., 2006; Cantlon et al., 2006; Piazza et al., 2004]. As can be seen in Figure 6, our localization of P2p falls amidst the peak voxels identified by fMRI researchers to respond selectively to nonsymbolic number [Ansari et al., 2006; Cantlon et al., 2006; Piazza et al., 2004]. Furthermore, several studies have used the combination of fMRI and ERPs to localize large number processing during the P2p time frame to similar bilateral parietal regions [Dehaene et al., 1999; Pinel et al., 2001]. Together, this provides a strong functional link between the IPS activity seen in fMRI studies and P2p modulation found in ERP studies. These convergent findings suggest that P2p modulation arises from the same or spatially similar structures identified through neuroimaging [Ansari et al., 2006; Cantlon et al., 2006; Piazza et al., 2004] and neurophysiologic techniques (see Dehaene [ 2003]) to be important to nonsymbolic number processing.
Figure 6.

Comparison of our ERP source localization to peak voxels activated in previous fMRI studies of nonsymbolic large number processing. Red and blue areas represent LORETA voxels showing significant P2p effects for large numbers and P3 effects for small numbers. Other colored areas represent closest LORETA voxel to reported peak voxels in several prominent fMRI studies of nonsymbolic large number processing. Please note that the spatial resolution and actual voxel size varies substantially between fMRI and ERP source localization using LORETA. Furthermore, only reported peaks of fMRI activity transformed to LORETA space are mapped. Therefore, this figure is meant as an approximation and conclusions regarding exact overlap or distinctness should be made with caution.
Small number P3 modulation, in contrast to large number P2p modulation, was associated with a distinct left‐lateralized parietal response. Importantly, the P3 effect was also localized, in part, to similar left‐lateralized parietal regions shown to be modulated by number in previous fMRI studies [Ansari et al., 2006; Cantlon et al., 2006; Piazza et al., 2004; Santens et al., 2010]. As can be seen in Figure 6, localization of the P3 effect is seated in the middle of the mapping of peak left intraparietal voxels shown to be activated in other fMRI nonsymbolic number studies. In addition to showing a spatial distinction in processing of small and large numbers, the contrast in IPS lateralization between small and large number seen in our study may be indicative of a more meaningful processing difference that corresponds to a behavior. Small number arrays can be recognized by all subjects as exactly one, two, or three objects, and thus they may have automatically evoked the symbolic representation for one, two, and three. If this is the case, left lateralized IPS responses then may be related to the evocation of representations of the symbolic number system, not evoked for large numbers (because cardinal value could not be reliably acquired exactly for large numbers given the quick presentation rate and variability in images). Previous work shows that symbolic number processing is characterized by bilateral and, in some cases, only left lateralized IPS activity (see Dehaene et al. [ 2003] for a review). For example, a recent study showed a conjunction of activity between symbolic and nonsymbolic small number (one to five) processing only in left IPS (Santens et al., 2010]. Furthermore, developmental imaging studies suggest that number processing begins right‐lateralized [Hyde et al., 2010] and that left IPS becomes increasingly more active for numerical tasks over later childhood, while right IPS activity is developmentally more constant [Ansari and Dhital, 2006]. Specifically, near‐infrared spectroscopy with 6‐month‐old infants shows only a right lateralized parietal response to number changes [Hyde et al., 2010]. In addition, neuropsychological patients with brain damage to the left IPS are impaired on symbolic but not nonsymbolic number tasks (see Dehaene et al. [ 2003] for a review), and TMS studies show that temporary impairment of this region impairs behavioral responses in explicit symbolic number comparison tasks [Cappelletti et al., 2007]. Although the crucial experiment has not yet been conducted, testing children before and after acquiring a symbolic number system, it is reasonable to propose based on the current literature that left IPS activation is related to the acquisition, development, and engagement of a symbolic number system, and right IPS activation underlies naturally occurring approximate number representations from near birth. Lateralization effects in our study could be explained by this discrepancy if small numbers evoked the symbolic number system and large numbers did not.
In addition, localization of the small number P3 effect revealed activity in the RTPJ. This activation accords with a recent fMRI study that found similar activation when directly contrasting small versus large number processing in a number comparison task [Ansari et al., 2007]. Ansari and colleagues [ 2007] suggested that this activation was related to heightened stimulus‐driven attention for small number comparisons compared to large comparisons. Other studies of RTPJ function suggest that RTPJ enables the “bottom‐up” reorientation of attention to novel, salient stimuli, or “odd‐ball” stimuli like those presented in our study [Corbetta and Shulman, 2002; Marois et al., 2000]. Based on the localization and previous work on the functional profile of this region, P3 modulation in our study may reflect the reorientation of attention upon the overt detection of a number change in the small number range, a process that is not seen for large numbers.
The localization of P2p and P3 also included middle and inferior occipital activity. Although the exact nature of this activity is unclear, it is thought that activity in these occipital regions during mid‐latency time windows reflects neural feedback from higher brain areas rather than feedforward activity (see Di Russo et al. [ 2003]). This argument is made, in part, from studies showing effects of attention in such occipital regions only after about 100 milliseconds but not earlier [Martínez et al., 2001].
Other effects were seen in anterior regions of the brain including the frontal and temporal lobes. The interpretation of these effects is beyond the scope of this article, as we focused on the role of posterior regions extensively hypothesized to be at the core of numerical cognition. Nonetheless, with a better understanding of the posterior neural processes involved in numerical cognition, future work may now begin to investigate the role of the anterior brain in attending to, representing, and maintaining number.
Until this point, most theories of numerical cognition have assumed that all numbers are represented by the ANS [Brannon and Terrace, 1998; Cordes and Brannon, 2009; Cordes et al., 2001; Dehaene and Changeux, 1993] while others propose two distinct systems for representation of small and large numbers (see Feigenson et al. [ 2004]). Part of the difficulty in this debate is that the process of numerical representation was poorly understood. The emerging evidence on numerical processing using ERPs with high temporal sensitivity suggests a resolution. Consistent with the majority view, a single system serves to represent approximate number across the full numerical range, but it can be inhibited by early attentional selection processes [Ansari et al., 2007; Burr et al., 2010; Hyde and Spelke, 2009, 2011; Hyde and Wood, in press; Libertus et al., 2007]. The results of the current experiment extend this explanation by localizing early temporal differences to extrastriate visual and parietal regions known to be involved in the distribution and enhancement of attention to particular spatial locations. These early attention processing differences have consequences for later engagement of distinct brain regions and corresponding brain processes indicative of representational differences between processing of small numbers of individuals and processing of larger numerical magnitudes. Furthermore, small number changes engage a right TPJ region indicative of change detection and left intraparietal regions known to be related to the corresponding numerical symbols automatically evoked. In contrast, large number changes engage right parietal regions associated with approximate number representation and occipital regions. Accurate theories of numerical cognition must take seriously the notion that, under many conditions, small numbers are represented as arrays of numerically distinct individuals, not as sets with approximate cardinal values. Although representations of individuals and of numerical magnitudes are both “numerical” in some sense [Carey, 2009], they engage different brain regions in qualitatively different ways.
Acknowledgements
We thank Diego Pizzagalli and Avram Holmes for their help with the source localization analysis.
Footnotes
Control over non‐numerical parameters in numerosity experiments. Unpublished manuscript retrieved October 1, 2009 from http://www.unicog.org/main/pages.php?page=Documentation.
REFERENCES
- Ansari D, Dhital B ( 2006): Age‐related changes in the activation of the intraparietal sulcus during non‐symbolic magnitude processing: An event‐related fMRI study. J Cogn Neurosci 18: 1820–1828. [DOI] [PubMed] [Google Scholar]
- Ansari D, Dhital B, Siong SC ( 2006): Parametric effects of numerical distance on the intraparietal sulcus during passive viewing of rapid numerosity changes. Brain Res 1067: 181–188. [DOI] [PubMed] [Google Scholar]
- Ansari D, Lyons IM, van Eimeren L, Xu F ( 2007): Linking visual attention and number processing in the brain: The role of the right temporal‐parietal junction in the small and large non‐symbolic number comparison. J Cogn Neurosci 19: 1845–1853. [DOI] [PubMed] [Google Scholar]
- Brannon EM, Terrace HS ( 1998): Ordering of the numerosities 1–9 by monkeys. Science 282: 746–749. [DOI] [PubMed] [Google Scholar]
- Burr DC, Turi M, Anobile G ( 2010): Subitizing but not estimation of numerosity requires attentional resources. J Vis 10: 20. [DOI] [PubMed] [Google Scholar]
- Cantlon JF, Brannon EM, Carter EJ, Pelphrey KA ( 2006): Functional imaging of numerical processing in adults and 4‐y‐old children. PLOS Biol 4: e125. [DOI] [PMC free article] [PubMed] [Google Scholar]
- Cappelletti M, Barth H, Fregni F, Spelke ES, Pascual‐Leone A ( 2007): rTMS over the intraparietal sulcus disrupts numerosity processing. Exp Brain Res 179: 631–642. [DOI] [PMC free article] [PubMed] [Google Scholar]
- Carey S ( 2009): The Origin of Concepts. New York: Oxford University Press. [Google Scholar]
- Corbetta M, Shulman GL ( 2000): Imaging set signals and attentional modulations in the human brain In: Braun J, Kock C, Davis J, editors. Visual Attention and Neural Circuits. Cambridge, MA: MIT Press; pp 1–24. [Google Scholar]
- Corbetta M, Shulman GL ( 2002): Control of goal‐directed and stimulus‐driven attention in the brain. Nat Rev Neurosci 3: 201–215. [DOI] [PubMed] [Google Scholar]
- Cordes S, Brannon EM ( 2009): Crossing the divide: Infants discriminate small from large numerosities. Dev Psychol 45: 1583–1594. [DOI] [PMC free article] [PubMed] [Google Scholar]
- Cordes S, Gelman R, Gallistel CR ( 2001): Variability signatures distinguish verbal from nonverbal counting in both large and small numbers. Psychol Bull Rev 8: 698–707. [DOI] [PubMed] [Google Scholar]
- Dehaene S ( 1996): The organization of brain activations in number comparison: Event‐related potentials and the additive‐factors method. J Cogn Neurosci 8: 47–68. [DOI] [PubMed] [Google Scholar]
- Dehaene S ( 1997): The Number Sense. Oxford University Press: Cambridge, UK. [Google Scholar]
- Dehaene S ( 2007): Symbols and quantities in parietal cortex: Elements of a mathematical theory of number representation and manipulation In: Haggard P, Rossetti Y, editors. Attention and Performance XXII. Sensori‐Motor Foundations of Higher Cognition. Cambridge, MA: Harvard University Press. [Google Scholar]
- Dehaene S ( 2009): Origins of mathematical intuitions: The case of arithmetic. Ann NY Acad Sci 1156: 232–259. [DOI] [PubMed] [Google Scholar]
- Dehaene S, Changeux J ( 1993): Development of elementary numerical abilities: A neuronal model. J Cogn Neurosci 5: 390–407. [DOI] [PubMed] [Google Scholar]
- Dehaene S, Spelke ES, Pinel P, Stanescu R, Tsivkin S ( 1999): Sources of mathematical thinking: Behavioral and brain‐imaging evidence. Science 284: 970–974. [DOI] [PubMed] [Google Scholar]
- Dehaene S, Piazza M, Pinel P, Cohen L ( 2003): Three parietal circuits for number processing. Cogn Neuropsychol 20: 487–506. [DOI] [PubMed] [Google Scholar]
- Di Russo F, Martinez A, Sereno M, Pitzalis S, Hillyard SA ( 2001): The cortical sources of the early components of the visual evoked potential. Human Brain Mapp 15: 95–111. [DOI] [PMC free article] [PubMed] [Google Scholar]
- Di Russo F, Martinez A, Hillyard SA ( 2003): Source analysis of event‐related cortical activity during visuo‐spatial attention. Cereb Cortex 13: 486–499. [DOI] [PubMed] [Google Scholar]
- Feigenson L, Dehaene S, Spelke ES ( 2004): Core systems of number. Trends Cogn Sci 8: 307–314. [DOI] [PubMed] [Google Scholar]
- Gallistel CR ( 1990): The Organization of Learning. Cambridge, MA: Bradford Books/MIT Press. [Google Scholar]
- Gallistel CR, Gelman R ( 2000): Non‐verbal numerical cognition: From reals to integers. Trends Cogn Sci 4: 59–65. [DOI] [PubMed] [Google Scholar]
- Heinze HJ, Luck SJ, Munte TF, Goes A, Mangun GR, Hillyard SA ( 1994): Attention to adjacent and separate positions in space: An electrophysiological analysis. Perception Psychophys 56: 42–52. [DOI] [PubMed] [Google Scholar]
- Hillyard SA, Anllo‐Vento L ( 1998): Event‐related brain potentials in the study of visual selective attention. Proc Natl Acad Sci USA 95: 781–787. [DOI] [PMC free article] [PubMed] [Google Scholar]
- Hillyard SA, Mangun GR, Luck SJ, Heinze HJ ( 1990): Electrophysiology of visual attention In: John ER, Harmony T, Prichep L, Valdez M, Valdez P, editors. Machinery of the Mind. Boston: Birkhausen: pp 186–205. [Google Scholar]
- Hillyard SA, Teder‐Sälejärvi WA, Münte TF ( 1998): Temporal dynamics of early perceptual processing. Curr Opin Neurobiol 8: 202–210. [DOI] [PubMed] [Google Scholar]
- Hopfinger JB, Buonocore MH, Mangun GR ( 2000): The neural mechanisms of top‐down attentional control. Nat Neurosci 3: 284–291. [DOI] [PubMed] [Google Scholar]
- Hyde DC, Spelke ES ( 2011): Neural signatures of number processing in human infants: Evidence for two core systems underlying non‐verbal numerical cognition. Dev Sci 14: 360–371. [DOI] [PMC free article] [PubMed] [Google Scholar]
- Hyde DC, Spelke ES ( 2009): All numbers are not equal: An electrophysiological investigation of small and large number representations. J Cogn Neurosci 21: 1039–1053. [DOI] [PMC free article] [PubMed] [Google Scholar]
- Hyde DC, Wood JN: Spatial attention determines the nature of nonverbal numerical cognition. J Cogn Neurosci (in press). [DOI] [PubMed] [Google Scholar]
- Hyde DC, Boas D, Blair C, Carey S ( 2010): Near‐infrared spectroscopy reveals right parietal specialization for number in pre‐verbal infants. NeuroImage 53: 647–652. [DOI] [PMC free article] [PubMed] [Google Scholar]
- Izard V, Dehaene‐Lambertz G, Dehaene S ( 2008): Distinct cerebral pathways for object identity and number in 3‐month‐old infants. PLOS Biol 2: e11. [DOI] [PMC free article] [PubMed] [Google Scholar]
- Kastner S, Pinsk MA, DeWeerd P, Desimone R, Ungerleider LG ( 1999): Increased activity in human visual cortex during directed attention in the absence of visual stimulation. Neuron 22: 751–761. [DOI] [PubMed] [Google Scholar]
- Libertus ME, Woldorff MG, Brannon EM ( 2007): Electrophysiological evidence for notation intendance in numerical processing. Behav Brain Funct 3: 1. [DOI] [PMC free article] [PubMed] [Google Scholar]
- Luck SJ ( 2005): The operation of attention‐millisecond‐by‐millisecond‐over the first half second In: Ogmen H, Breitmeyer BG, editors. The First Half‐Second: The Microgenesis and Temporal Dynamics of Unconscious and Conscious Visual Processes. Cambridge, MA: MIT Press; pp 187–206. [Google Scholar]
- Marois R, Leung HC, Gore JC ( 2000): A stimulus‐driven approach to object identity and location processing in the human brain. Neuron 25: 717–728. [DOI] [PubMed] [Google Scholar]
- Martinez A, Di Russo F, Anllo‐Vento L, Sereno MI, Buxton RB, Hillyard SA ( 2001): Putting spatial attention on the map: Timing and localization of stimulus selection processes in striate and extrastriate visual areas. Vis Res 41: 1437–1457. [DOI] [PubMed] [Google Scholar]
- Nieder A, Dehaene S ( 2009): Representation of number in the brain. Annu Rev Neurosci 35: 185–208. [DOI] [PubMed] [Google Scholar]
- Nieder A, Miller EK ( 2003): Coding of cognitive magnitude: Compressed scaling of numerical information in the primate prefrontal cortex. Neuron 37: 149–157. [DOI] [PubMed] [Google Scholar]
- Pascual‐Marqui RD, Michel CM, Lehmann D ( 1994): Low resolution electromagnetic tomography: A new method for localizing electrical activity in the brain. Int J Psychophysiol 18: 49–65. [DOI] [PubMed] [Google Scholar]
- Pascual‐Marqui RD, Lehmann D, Koenig T, Kochi K, Merlo MCG, Hell D, Koukkou M ( 1999): Low resolution brain electromagnetic tomography (LORETA) functional imaging in acute, neuroleptic‐naive, first‐episode, productive schizophrenia. Psychiatry Res‐Neuroimaging 90: 169–179. [DOI] [PubMed] [Google Scholar]
- Pascual‐Marqui RD, Esslen M, Kochi K, Lehmann D ( 2002): Functional imaging with low resolution brain electromagnetic tomography (LORETA): A review. Methods Findings Exp Clin Pharmacol 24C: 91–95. [PubMed] [Google Scholar]
- Piazza M, Izard V, Pinel P, Le Bihan D, Dehaene S ( 2004): Tuning curves for approximate numerosity in the human intraparietal sulcus. Neuron 44: 547–555. [DOI] [PubMed] [Google Scholar]
- Piazza M, Pinel P, Le Bihan D, Dehaene S ( 2007): A magnitude code common to numerosities and number symbols in human intraparietal cortex. Neuron 53: 293–305. [DOI] [PubMed] [Google Scholar]
- Pinel P, Dehaene S, Riviere D, LeBihan D ( 2001): Modulation of parietal activation of semantic distance in a number comparison task. Neuroimage 14: 1013–1026. [DOI] [PubMed] [Google Scholar]
- Posner MI ( 1986): Chronometric Explorations of Mind (Paperback Edition). New York: Oxford. [Google Scholar]
- Roitman J, Brannon EM, Platt ML ( 2007): Monotonic coding of numerosity in macaque lateral intraparietal area. PLoS Biol 5: e208. [DOI] [PMC free article] [PubMed] [Google Scholar]
- Santens S, Roggeman C, Fias W, Verguts T ( 2010): Number processing pathways in human parietal cortex. Cereb Cortex 20: 77–88. [DOI] [PMC free article] [PubMed] [Google Scholar]
- Sereno MI, Pitzalis S, Martinez A ( 2001): Mapping of contralateral space in retinotopic coordinates by a parietal cortical area in humans. Science 294: 1350–1354. [DOI] [PubMed] [Google Scholar]
- Scarborough D, Sternberg S, editors ( 1998): Invitation to Cognitive Science, Vol. 4: Methods, Models, and Conceptual Issues. MIT Press: Cambridge, MA. [Google Scholar]
- Towle VL, Bolanos J, Suarez D, Tan K, Grzeszczuk R, Levin DN, Cakmur R, Frank SA, Spire JP ( 1993): The spatial location of EEG electrodes: Locating the best‐ fitting sphere relative to cortical anatomy. Electroencephalogr Clin Neurophysiol 86: 1–6. [DOI] [PubMed] [Google Scholar]
- Temple E, Posner MI ( 1998): Brain mechanisms of quantity are similar in 5‐year‐old children and adults. Proc Natl Acad Sci USA 95: 7836–7841. [DOI] [PMC free article] [PubMed] [Google Scholar]
- Xu F, Spelke ES ( 2000): Large number discrimination in 6‐month‐old infants. Cognition 74: B1–B11. [DOI] [PubMed] [Google Scholar]