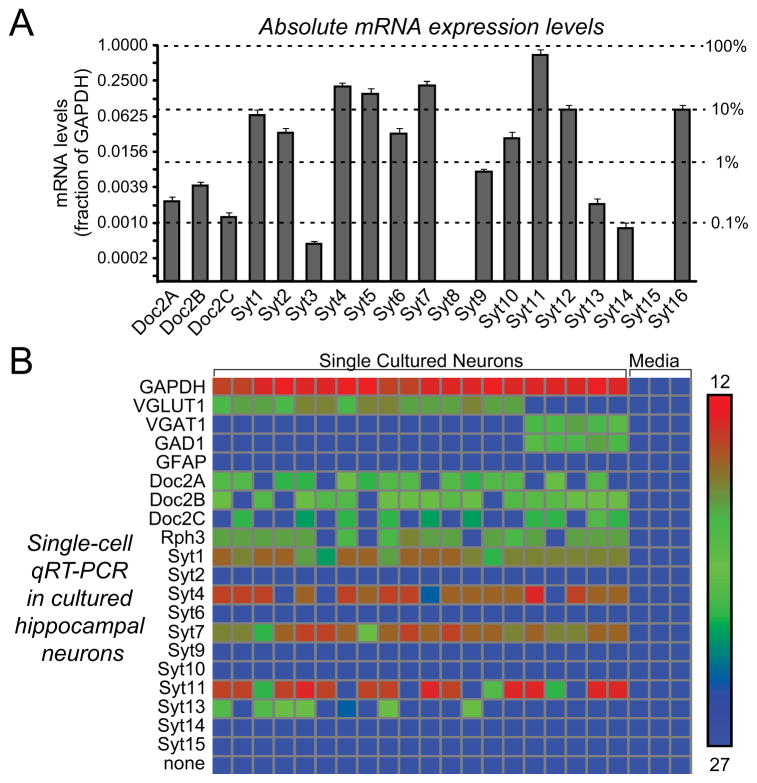
Figure 1. Expression profiling of candidate Ca2+-sensors in hippocampal neurons.
A, mRNA expression levels of candidate Ca2+-sensor genes in cultured hippocampal neurons. mRNA levels were measured by quantitative RT-PCR (normalized to GAPDH). Absolute and relative mRNA levels are depicted on the left and right, respectively, on a logarithmic scale (data are means ± SEM; n=3 independent cultures).
B, mRNA levels of candidate Ca2+-sensor genes measured in individual hippocampal neurons by quantitative RT-PCR using Fluidigm technology (media = negative control). Measurements were performed on cytosol aspirated with a pipette from patched cultured neurons (calibration bar = absolute critical cycle numbers on the Fluidigm chip). Note that most neurons co-express Doc2A, 2B, and 2C together with Syt1, Syt4, Syt7, and Syt11. For the effect of Doc2 KDs on release, see Fig. S1.

