

Abstract
The mechanism of polyethylenimine–DNA and poly(L-lysine)–DNA complex formation at pH 5.2 and 7.4 was studied by a time-resolved spectroscopic method. The formation of a polyplex core was observed to be complete at approximately N/P = 2, at which point nearly all DNA phosphate groups were bound by polymer amine groups. The data were analyzed further both by an independent binding model and by a cooperative model for multivalent ligand binding to multisubunit substrate. At pH 5.2, the polyplex formation was cooperative at all N/P ratios, whereas for pH 7.4 at N/P < 0.6 the polyplex formation followed independent binding changing to cooperative binding at higher N/Ps.
INTRODUCTION
The development of safe and effective nonviral vectors for gene medicines (DNA, siRNA, miRNA) is an important biomedical challenge.1 Viral vectors are more effective than nonviral systems, but the latter have advantages of easier up-scaling and better safety. Polyethylenimine (PEI) is a cationic polymer that is able to complex DNA and it is widely used for DNA transfection in vitro.2–5 PEI constitutes a high concentration of positively charged amine groups (primary, secondary, tertiary) which enable effective electrostatic binding and condensation of negatively charged DNA.6 Similarly, poly(L-lysine) (PLL), a polycation with primary amines only, has been used to condense DNA into nanoparticles. However, in the presence of a competing polyelectrolyte, such as heparin sulfate, a glycosaminoglycan, PEI and PLL respond differently; PEI–DNA complexes dissociate, whereas PLL–DNA complexes do not dissociate as readily.7–9 These different responses to a competing polyelectrolyte may in part explain the 100-fold higher transfection efficacy for branched PEI compared to PLL polyplexes as DNA must release from the polyplexes prior to its transcription and translation.9,10
Linear and branched PEI have been used to construct polyplex systems that have been applied in gene delivery and transfection studies.2,5,11 Linear PEI (LPEI) is composed almost exclusively of secondary amines while branched PEI (BPEI) is composed of primary, secondary and tertiary amines (Figure 1). The chemical structure of PLL constitutes primary amines in the side chains which take part on binding DNA. At the physiological pH range (5.0–7.4), primary amines are in the protonated state, whereas the secondary and tertiary amines are only partially ionized.12 Due to its secondary and tertiary amines, PEI shows buffering capacity and polymer swelling at the acidic pH of the endosomes.12 PLL does not have these features that augment gene transfection at the cellular level.12 Although the differences in the chemical structures account for the transfection efficiency and toxicity, differences in structure–activity relationship are not well understood.5 Elucidating these structure–activity relationships is critical for controlling the functionality of novel biomaterials to be used for gene therapy.
Figure 1.

Molecular structures of BPEI, LPEI, and PLL.
Recently, we compared the DNA-complexation behavior of various PEI species (small, linear, and branched). Using time-resolved fluorescence spectroscopy, the binding constants for polyplex formation were determined using an independent binding model.13 The independent binding model, in contrast to the cooperative binding model, does not take into account the simultaneous or subsequent binding of other amine ligands at unoccupied phosphate sites on DNA. Based on this analysis, we found that for both linear and branched PEI the complexation process was biphasic, suggesting the mechanism of polyplex formation varies as a function of amine concentration. In the present study, we continue investigate the mechanism of polyplex formation by comparing the DNA-complexation behavior of branched and linear PEI and PLL at two different pH values in the pH range of endocytic vesicles. The binding equilibrium was analyzed using the independent13 and cooperative14 binding models.
EXPERIMENTAL METHODS
Materials
The plasmid pCMVβ (7164 bp) encoding for the beta-galactosidase enzyme as a reporter gene was purified using a QIAfilter Plasmid Giga Kit (QIAGEN) according to the manufacturer’s instructions. Branched polyethylenimine (BPEI; Figure 1) with a mean weight-average molecular weight of 25 kDa was purchased from Sigma-Aldrich, titrated to pH 7, and used as a 1 mg/mL aqueous solution.
Linear polyethylenimine (LPEI; Figure 1), ExGen 500, with a mean molecular weight of 22 kDa was obtained from Fermentas. Poly(L-lysine) (PLL; Figure 1), with a mean molecular weight of 200 kDa (Sigma-Aldrich), was chosen for this study, since at physiological levels of salt the polyplexes formed with 20 kDa PLL are less soluble due to aggregation.11,15 For PLL, the backbone amines are part of the peptide bonds. Thus, only the side chain amines bind DNA and only they were taken into account when calculating the N/P ratios (the molar ratio of polymer nitrogen to DNA phosphate). Thus, for PLL only primary, for LPEI only secondary, and for BPEI all primary, secondary, and tertiary amines are participating to the formation of nanoparticles. Ethidium bromide (ETI) used as a fluorescent probe was purchased from Sigma-Aldrich.
Sample Preparation
All solutions were prepared in a buffer containing 50 mM MES, 50 mM HEPES, and 75 mM NaCl (adjusted to a pH of 5.2 and 7.4 using 5 M NaOH). The final nucleotide concentration of DNA used was 300 μM; the molar ETI/nucleotide ratio was 1:15. The polyplexes were prepared by a stepwise method: Independent of the final N/P ratio between the cationic polymer and DNA, an initial solution with N/P ratio 0.2 was prepared by vigorous mixing of equal volumes of ETI–DNA solution and cationic polymer solution. The complexation was followed by measuring the fluorescence spectrum of this initial solution. After the measurement, the next N/P ratio was adjusted by addition of the appropriate amount of polymer solution. The measured N/P range was from 0.2 to 8 in each polymer at pH 5.2 and at pH 7.4.
Fluorescence Measurements
The time-resolved fluorescence was measured by a time-correlated single photon counting (TCSPC) system as described earlier.13 The decays were collected using a constant accumulation time with wavelengths of 560–670 nm with steps of 10 nm. The instrumental response function was measured separately, and the fluorescence decays were deconvoluted and analyzed by iterative least-squares method by simultaneously fitting to the sum of exponents in the equation
| (1) |
where τi is the global lifetime and ai(λ) is the local amplitude (pre-exponential factor) at a particular wavelength. The quality of the fit was judged in terms of the weighted mean-square deviation χ2 for the individual curves and for the global fit (for acceptable fit χ2 < 1.1) and by visual inspection of the weighted residuals and their autocorrelation function. The amplitudes ai(λ) represent the decay associated spectra (DAS). In the case of a mixture of multiple noninteracting fluorescing species, the DAS corresponds to the individual spectra of the species. The local amplitudes (ai(λ)) were corrected depending on the sensitivity of the detector at different wavelengths and the corrected spectral areas were calculated as . The relative quantum yield of ETI free in the solution versus ETI bound by the DNA, φrel, was determined from steady state absorption (UV–vis spectrophotometer Shimadzu UV-3600) and fluorescence (Fluorolog Yobin Yvon-SPEX λexc = 483 nm) measurements according to
| (2) |
In eq 2, φETI is the quantum yield of free ETI, φED is the quantum yield of ETI–DNA complex, Ii is area of the fluorescence spectra with excitation wavelength of 483 nm, and Ai is the absorbance at wavelength of 483 nm. The φrel values of 0.130 and 0.136 were obtained at pH 5.2 and 7.4, respectively. The quantum yield corrected spectral area of the short-living component can be calculated as . The proportion of the short-living decay component, B, corresponding to ETI free in the solution, was calculated from the spectral areas of the components as follows:
| (3) |
where A2 is the spectral area of the long-living component (ETI:DNA complex).
We used ETI as a fluorescent probe for monitoring the equilibrium between DNA and the polymers (P). We chose the amount of ETI in the system so that in the beginning all ETI is intercalated in the DNA. When the polyplex is formed ETI is freed to the bulk solution:
| (4) |
Simultaneously the fluorescence lifetime of ETI decreases from 24 ns for ETI–DNA complex to 1.8 ns for free ETI. Thus, in the presence of polymer, a two-exponential decay curve is observed. As the relative amount of free ETI in the solution, B (eq 3), is directly proportional to the amount of formed polyplexes, the formation of polyplexes can be monitored by plotting B as a function of N/P ratio.
Binding Constants: Independent Binding Model
In the independent binding model reported in our previous studies,13,16,17 binding of a ligand (polymer carrier) to a site on a macromolecule (DNA) has no impact on simultaneous or subsequent binding to other unoccupied sites and the reaction can be written as
| (5) |
Thus, the proportion of DNA bound by the polymer, B, can be correlated to the binding constant of the polyplex formation, KI, by
| (6) |
From the fluorescence measurements, we get B = A1,QY/(A1,QY + A2). Combining this with eq 6 and taking reciprocal of the resulting equation, we obtain:
| (7) |
where KI is the independent binding constant of the overall equilibrium and [P] is the concentration of the polymer amine groups (mol N-groups dm−3). In eqs 6 and 7, [P] should be the free N-group concentration, but in our analysis it was approximated by the total N-group concentration. According to eq 7, plotting the ratio A2/A2,QY as a function of the inverse polymer concentration, we should obtain a linear dependence with the binding constant equal to the inverse of the slope.
Binding Constants: Cooperative Binding Model
In cooperative binding the binding of a ligand to a site on a target molecule can influence the binding of other ligands to other unoccupied sites on the same target. For positive cooperativity the binding of first ligand makes it easier for the next one to be bound. In a plot of B as a function of free ligand concentration a characteristic sigmoidal shape is observed.18 The Hill plot model for multivalent ligand binding to multisubunit substrate19–22 was used to estimate the cooperativity of our systems through eq 8 (derivation presented in the Supporting Information).
| (8) |
where (KCO)α is the overall cooperative binding constant for the reaction DNA + NP ⇌ DNA:PN, KCO is the average cooperative binding constant for the binding of one functional amine group according to the reaction DNA:Px−1 + P ⇌ DNA:Px (x = 1, 2, …, N), and α is the experimental Hill’s coefficient. The values for the calculated curve of cooperative binding in Figures 6 and Supporting Information Figure S4 were obtained from
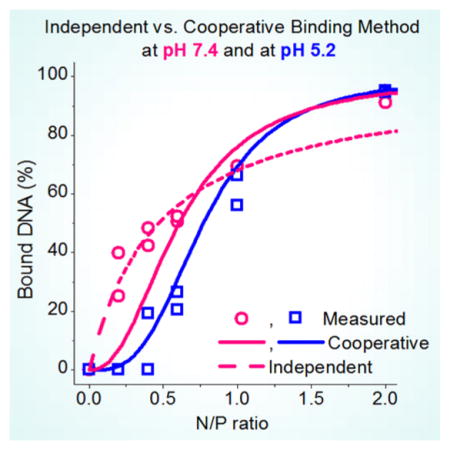
Figure 6.
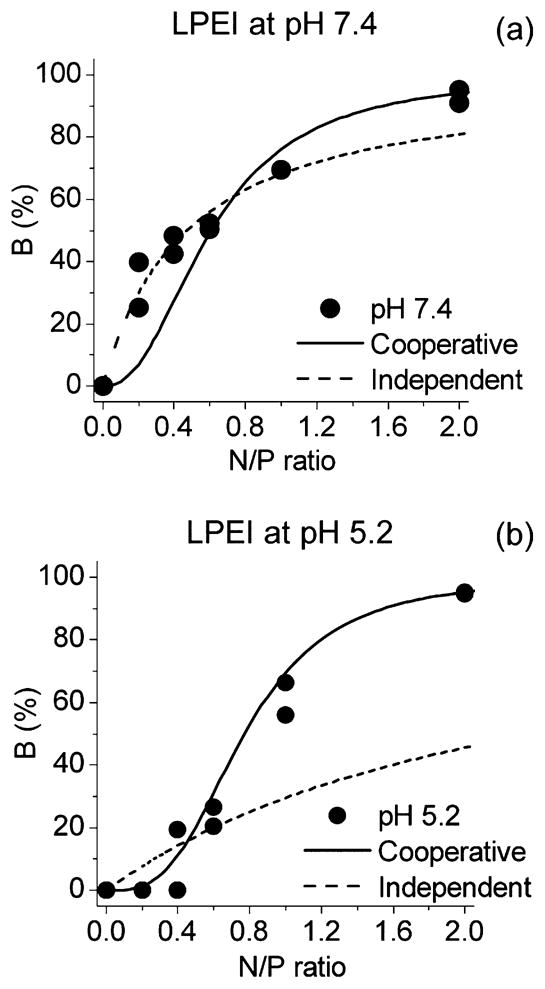
Proportion of DNA bound by the polymer, B, as a function of polymer amine group concentration for LPEI at pH 7.4 (a) and at pH 5.2 (b). (●) Measured points, calculated by (solid line) independent binding model and (dashed line) cooperative binding model.
| (9) |
Particle Size
Samples for the polyplex size measurements were prepared at both pHs with N/P ratios ranging from 0.4 to 8. The mean hydrodynamic diameters were measured by dynamic light scattering technique (Malvern Zetasizer Auto Plate Sampler, APS; medium refractive index of water = 1.33 and scattering angle of 90°) in triplicate from two different samples. Thus, each N/P-ratio was measured six times. The ages of the samples at different N/P-ratios differed from each other at the time of measuring. From the initial time of forming the first N/P polyplex formulation, the 0.4, 0.6, 1, 2, 4, and 8 N/P formulations were measured at 1.25, 2.5, 3.5, 4.75, 6.25, and 7.75 h, respectively.
Transfection
CHO cells (Chinese hamster ovary cell line) and CV1-P cells (monkey kidney fibroblasts) were grown in DMEM supplemented with 10% heat-inactivated fetal bovine serum, 2 mM L-glutamine, and antibiotics. ARPE-19 cells (human retinal pigment epithelial cell line) were cultured in DMEM/F-12 supplemented with 10% heat-inactivated fetal bovine serum, 2 mM L-glutamine, and antibiotics. Cells were maintained at 37 °C in a humidified atmosphere containing 7% CO2 (CHO and ARPE-19) or 5% CO2 (CV1-P) and subcultured twice a week. All cell culture media and reagents were purchased from Invitrogen.
Polyplexes were prepared in 50 mM MES-HEPES buffer (pH 7.2) by adding polymer solution to DNA solution (in equal volumes) at an N/P ratio of 8 (PEIs) and 4 (PLL). The complexes were allowed to incubate for 20 min at room temperature. DNA concentration in the resulting solution was 20 μg/mL of complex.
CHO (48 000 cells/well), CV1–P (32 000 cells/well), and ARPE-19 (50 00 cells/well) cells were seeded into 48-well plates 24 h prior to experiment to reach 80% confluency on the day of transfection. Immediately before transfection, cell culture medium was replaced with fresh DMEM without serum and 50 μL of polyplex solutions (corresponding to 1 μg DNA/well) was added dropwise per well. After 5 h incubation, polyplexes were aspirated, cells were washed twice with PBS and incubated in cell culture media for an additional 43 h at 37 °C in a 7% CO2 humidified air atmosphere. Thereafter, cells were washed twice with PBS and lysed with 150 μL of lysis buffer (250 mM Tris-HCl buffer (pH 8.0), 0.1% Triton X-100) overnight at −70 °C. The β-galactosidase activity was determined by ONPG assay as described previously7 and normalized to the protein content of each sample using a Bio-Rad protein assay kit (Bio-Rad) according to the manufacturer’s microtiter plate protocol.
RESULTS
Formation of Polymer–DNA Polyplexes
Formation of polyplex can be monitored by plotting B as a function of N/P ratio. These plots are presented in Figure 2 for all polymers in both pHs. In all cases, B reaches close to 100% values at N/P = 2. This indicates that nearly all ETI is free in the solution (eq 3). The behavior of all polymers at a given pH is similar, but the pH has a clear effect. The sigmoidal shape of the curves observed at pH 5.2 is absent at pH 7.4.
Figure 2.
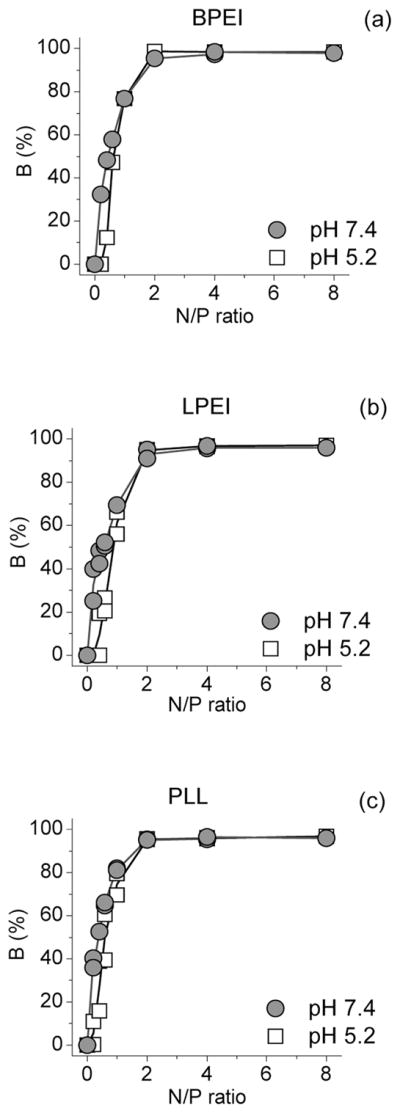
Proportion of the short-living component (B) versus N/P ratio at pH 5.2 and 7.4 for BPEI (a), LPEI (b), and PLL (c).
The results of the particle size measurements are shown in Figure 3. At low N/P ratios, the particle sizes were 300–400 nm at pH 5.2 and 400–500 nm at pH 7.4. At N/P = 2, the particle size increases to values over 2000 nm with a simultaneous increase in the polydispersity index (PDI) of the sample reflecting a wider particle size distribution. At higher N/P ratios, the particle sizes of BPEI and PLL decrease again to values lower than 300 nm and PDI decreases to values < 0.2, indicating a fairly narrow size distribution. For LPEI, some decrease is observed at pH 5.2, but at pH 7.4 no decrease in particle size or PDI takes place up to N/P = 8. During the particle size measurements, the ages of the samples increased with increasing N/P ratio (see Experimental Methods). The particle sizes of LPEI and BPEI polyplexes have been observed to grow as a function of time in salt containing buffers.23–27 Without salt in the buffer, the particle sizes are smaller and their sizes remain constant over time.23,27 The particle sizes obtained in the present study are in agreement with these studies. The large particle sizes measured at N/P = 2 coincide with a visual change in the samples: at this N/P ratio, large particles can be seen by the naked eye. This effect was stronger at pH 7.4 than at pH 5.2. Similar effect has been observed for 50–60 kDa PEI by light scattering measurements.28 According to the zeta potential measurements,12,25,29 the appearance of very large particle sizes coincides with the change from negative to positive potential and takes place close to N/P ratio 2. Thus, the large particle sizes are probably due to aggregation of the nanoparticles when they are at nearly charge neutral state. The same phenomenon has been seen with cationic liposome–DNA complexes.30 The particle sizes for all polymers are higher at pH 7.4 than at pH 5.2 which is likely due to the more positively charged environment at pH 5.2.
Figure 3.
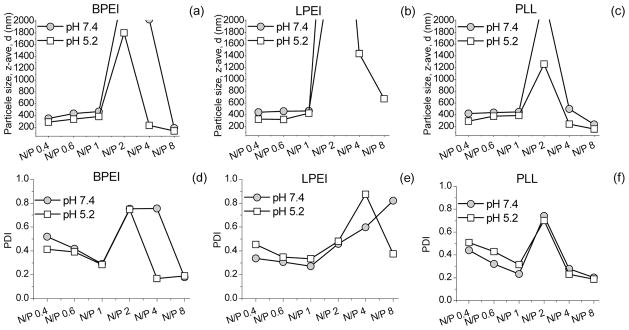
Mean hydrodynamic diameters and PDI values at different N/P ratios for BPEI (a, d), LPEI (b, e), and PLL (c, f) at pH 5.2 and 7.4. The upper limit of the device for the hydrodynamic diameter is 2000 nm, and thus, values higer than this are not shown in the figures. The errors in BPEI and PLL particles sizes were 1–7% for PDI < 0.6 and 21–47% for PDI > 0.6. For LPEI large errors were obtained between N/P 1 and 4 at pH 5.2 and N/P 2 and 8 at pH 7.4.
The differences between the polymers are also observed in the changes of the fluorescence lifetimes with increasing N/P ratio (Supporting Information Figure S1). For PLL at both pHs the changes in the fluorescence lifetimes are relatively small for both components and take place only at N/P < 2 (Figure S1a and b). For PEIs at N/P < 2, where the polyplexes still have some negative charges, the lifetime of the short-living component corresponding to free ETI varies from 0.6 to 1.9 ns (Figure S1c and e) and the lifetime of the long-living component corresponding to ETI–DNA complex decreases from 24 to 18.5 ns (Figure S1d and f). The fluorescence lifetime of ETI decreases in the presence of positive charges.31 Thus, it is possible that at low N/P ratios, when the polyplex is still negatively charged, the ETI freed in the solution during polyplex formation does not all escape to the bulk solution, but part of it stays close to DNA. At N/P ≥ 2, the polyplexes are positively charged, ETI escapes to the bulk solution, and its lifetime is equal to that of free ETI in the absence of DNA. The changes in the fluorescence lifetimes observed for PEIs are smaller at pH 5.2 than at pH 7.4. Since the environment at pH 5.2 is positively charged, the addition of cationic polymers does not change the lifetimes as much as at pH 7.4.
According to the present studies, the largest particle sizes, coinciding with the change from negatively charged polyplexes to positively charged polyplexes, are observed at N/P = 2 (Figure 3). According to the fluorescence measurements, at this point all ETI has been freed into the solution (Figure 2) and reaction 4 has gone to completion. At higher N/P ratios, excess polymer is bound to the polyplex, causing the size of the polyplex to decrease again.12,25,27,32–36
Independent Binding Model
In Figure 4, the ratio A2/A1,QY (eq 7) is plotted as a function of the inverse amine concentration for LPEI. At low polymer concentrations corresponding to N/P ratios from 0.2 to 2, A2/A1,QY decreases linearly with increasing concentration. At higher concentrations, that is, N/P ≥ 2, A2/A1,QY stays nearly constant with increasing concentration. This behavior corresponds to that observed in Figure 2: at low concentrations, the polyplex formation is observed, and at higher N/Ps the reaction (eq 4) has reached completion. At pH 5.2, the slope at low N/P ratios is clearly greater than at pH 7.4. Similar behavior is observed also for the BPEI and PLL (Supporting Information Figure S2). The binding constants KI calculated from the slopes at N/P ≤ 2 are listed in Table 1. For all polymers, the binding constants using the independent binding model are smaller at pH 5.2 than at pH 7.4. For PEIs, the binding constants are nearly equal at each pH, but 1.3–2.0 times larger binding constants are observed for PLL.
Figure 4.
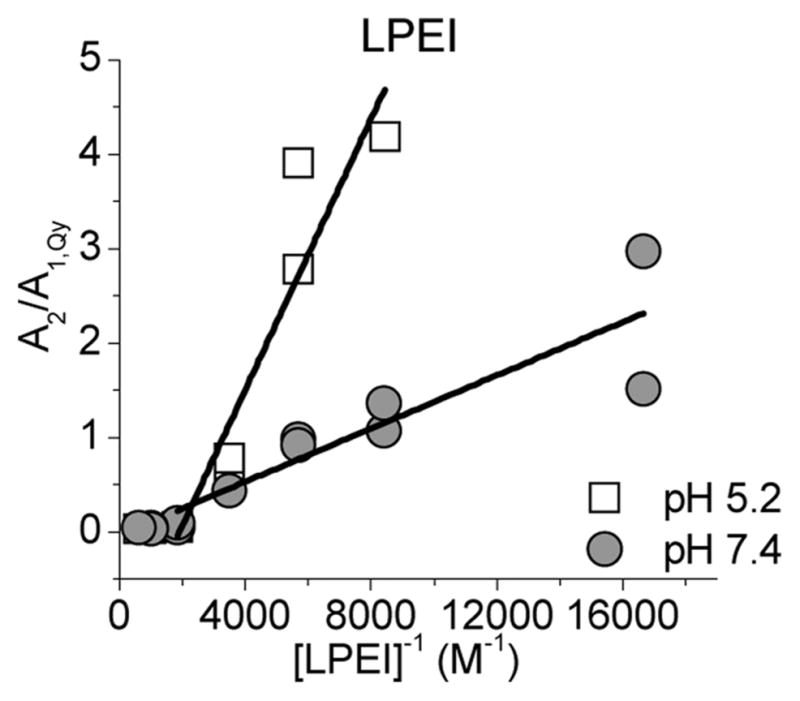
Ratio A2/A1,QY as a function of the inverse polymer concentration for LPEI at pHs 5.2 and 7.4.
Table 1.
Independent Binding Constants per amine (KI), Hill’s cooperativity coefficients (α), overall cooperative binding constant (KCO)α and average cooperative binding constants per amine KCO for PEIs and PLL at pH 5.2 and 7.4
| independent model
|
cooperative model
|
|||||
|---|---|---|---|---|---|---|
| polymer | pH | KI (M−1) | N/P range | α | (KCO)α | KCO (M−1) |
| BPEI | 5.2 | (9.5 ± 3.2) × 102 | 0.4–2.0 | 3.78 | (1.0 ± 0.1) × 1014 | (5.1 ± 0.1) × 103 |
| 7.4 | (7.3 ± 0.4) × 103 | 0.6–2.0 | 2.31 | (5.4 ± 0.6) × 108 | (6.1 ± 0.2) × 103 | |
| 0.2–0.6 | 0.97 | (5.7 ± 0.2) × 103 | (7.7 ± 0.2) × 103 | |||
| LPEI | 5.2 | (1.4 ± 0.2) × 103 | 0.4–2.0 | 3.16 | (3.0 ± 0.3) × 1011 | (4.3 ± 0.2) × 103 |
| 7.4 | (7.1 ± 1.2) × 103 | 0.6–2.0 | 2.32 | (4.8 ± 0.5) × 108 | (5.5 ± 0.2) × 103 | |
| 0.2–0.6 | 0.76 | (7.5 ± 2.4) × 102 | (6.3 ± 1.4) × 103 | |||
| PLL | 5.2 | (1.9 ± 0.7) × 103 | 0.4–2.0 | 2.63 | (6.8 ± 0.7) × 109 | (5.5 ± 0.2) × 103 |
| 7.4 | (9.4 ± 0.5) × 103 | 0.6–2.0 | 2.06 | (9.7 ± 0.4) × 107 | (7.4 ± 1.5) × 103 | |
| 0.2–0.6 | 1.01 | (1.1 ± 0.1) × 104 | (1.01 ± 0.09) × 104 | |||
Cooperative Binding Model
For the present systems, the Hill plot (eq 8) did not appear as single straight line but a composite of two (at pH 5.2) or three (at pH 7.4) lines with different slopes (Figure 5 and Supporting Information Figure S3). For pH 7.4 at low polymer concentrations (N/P ≤ 0.6), the α-values were 0.76–1.01, that is, close to 1 (Table 1). This implies that interaction between the polymers and DNA represents independent binding without cooperativity or, in the case of LPEI, slightly negative cooperativity. For pH 5.2, this was not the case and positive cooperativity was observed (α = 2.63–3.78). At very high polymer concentrations (N/P ≥ 2), the bound fraction reaches a maximum and additional binding does not take place.
Figure 5.

Hill plots (eq 8) for LPEI at pH 7.4 (a) and at pH 5.2 (b).
The α-values obtained at intermediate N/Ps for pH 7.4 and at N/P ≤ 2 for pH 5.2 (Table 1) indicate positive cooperativity of binding. The degree of cooperativity is higher at pH 5.2 for all polymers. Also, the overall cooperative binding constant (KCO)α increases with decreasing pH (Table 1). For PEIs, the amount of protonated amine groups increases as the pH decreases, and thus, both the degree of cooperativity and the overall binding constant correlate with the amount of active amine groups present in the system. For PLL, all the active amine groups are protonated at the pH range studied and the effect of pH is smaller than that for PEIs. However, both α and (KCO)α increase with decreasing pH also for PLL. This could be due to increased activity of the amine groups at lower pH.
The independent and cooperative binding models are compared in Figure 6 where the curves calculated from the parameters listed in Table 1 and the corresponding eqs 6 and 9 are shown together with the measured points for LPEI at both pHs. At pH 5.2, the cooperative model fits better to the measured points. At pH 7.4, the measured points follow the independent model up to N/P ≈ 0.6. Thus, at these N/P ratios, the B values are higher than those for pH 5.2. This gives an impression that the formation of the nanoparticles at low N/Ps would be more efficient at pH 7.4, although the real reason for the higher B values is the difference in the mechanism of polyplex formation. At higher N/Ps, the cooperative model gives more accurate results also for pH 7.4. Thus, it seems that pH has a clear influence on the mechanism of polyplex formation. The same behavior is observed also for BPEI and PLL (Supporting Information Figure S4).
With the independent binding model at pH 5.2, very small KI values are obtained. Since at this pH the system follows cooperative binding model, these values are not relevant. For pH 7.4, the values from independent model are nearly equal to those obtained with the cooperative model at low N/Ps were the cooperativity degree indicates independent binding.
The transfection experiments are done at high N/Ps (N/P = 8 for PEIs and N/P = 4 for PLL). At intermediate N/P ratios (0.6–2.0), PEIs have both high overall cooperative binding constants (Supporting Information Figure S5) and transfection efficiencies compared with those of PLL. According to our data, 22 kDa LPEI is not quite as effective as 25 kDa BPEI to form nanoparticles with DNA, but the transfection experiments have proved that at these conditions and with these cell lines the most effective carrier is 22 kDa LPEI (Figure S5b). The binding constants reflect only the formation of the polyplexes according to reaction 4, which has gone to completion at N/P = 2. At higher N/Ps, extra polymer is bound to the nearly neutral core polyplexes. LPEI and BPEI are both functioning DNA carriers, but only LPEI still forms large agglomerates at N/P = 8 in salt containing buffers which seem to be important for in vitro and in vivo transfection.23,37
DISCUSSION
Very few binding constants for PEI and PLL polyplex formation have been reported in the literature.25,28,29,38–40 The reported values have been mainly obtained by isothermal titration calorimeter (ITC) measurements. However, the heat exchange during ligand binding is often small and it cannot be separated from the heat associated with conformational changes during polyplex formation. For instance, Choosakoonkriang et al.29 did not report binding constants for PEIs (2–750 kDa BPEIs and 25 kDa LPEI at pH range 6.0 – 9.0). Ikonen et al.25 did not report a binding constant for 750 kDa PLL, although they did obtain a value for 750 kDa BPEI. The values reported in the literature correspond to the KI values obtained in the present study, but they were reported per polymer molecule. The KI values per N-group listed in Table 1 can be converted to the binding constant per molecule, KI′, by multiplying with the average number of amine groups per polymer molecule. In Table 2, the binding constants obtained for BPEI and PLL in the present study are compared with the values reported in the literature. Taking into account the differences in molecular weights of the polymers and properties of the solutions, the values are in agreement.
Table 2.
Independent Binding Constants Per Molecule KI′ from the Present Study and Literature for BPEI and PLL
| polymer | binding constant (M−1) | solution | pH | method | ref |
|---|---|---|---|---|---|
| BPEI 25 kDa | 4.3 × 10⁶ 5.5 × 10⁵ |
50 mM Mes, 50 mM Hepes, 75 mM NaCl | 7.4 5.2 |
TCSPC with ETI, independent method | present study |
| BPEI 50–60 kDa | 1.2 × 10⁵ | Tris-HCl buffer, ionic strength 0.03 | 7 | luminescence (with ETI) | 28 |
| BPEI 750 kDa | (2.3 ± 1.8) × 106 | 5% glucose | a | ITC (25 °C) | 25 |
| BPEI 600 Da | 2 × 10⁵ | 0.1 mM NaCl | 6 | ITC, SSIS model | 38 |
| BPEI 600 Da | 1.8 × 10⁴ | 0.1 mM NaCl | 7 | ITC, SSIS model | |
| BPEI 600 Da | 1.0 × 10⁴ | 0.1 mM NaCl | 8 | ITC, SSIS model | |
| BPEI 600 Da | 1 × 10⁶ 1 × 10⁵ |
Mes or Hepes H2O |
7 7 |
ITC ITC |
|
| BPEI 25 kDa | (5.98 ± 1.79) × 106 | 20 mM phosphate buffer | 7.4 | ITC (25 °C) | 39 |
| PLL 200 kDa | 1.5 × 10⁷ 3.0 × 10⁶ |
50 mM Mes, 50 mM Hepes, 75 mM NaCl | 7.4 5.2 |
TCSPC with ETI, independent method | present study |
| PLLb | 9.08 × 10⁷ | c | 4.8 | ITC | 40 |
| PLLb | 1.97 × 10⁵ | d | 6.8 |
Not specified.
Size of PLL not reported.
10 mM sodium cacodylate-acetic acid, 200 mM sodium chloride, and 20 mM magnesium chloride.
10 mM sodium cacodylate-cacodylic acid, 200 mM sodium chloride, and 20 mM magnesium chloride.
Effect of pH
pH has a clear effect on the mechanism of polyplex formation for all polymers. At pH 7.4, the independent binding mechanism changes to a cooperative mechanism at N/P ratios close to 0.6, whereas for pH 5.2 the mechanism is cooperative for all N/P ratios. This change is also reflected in the degree of cooperativity and the overall cooperative binding constants which both are higher at pH 5.2 than at pH 7.4. Thus, once one amine is bound to the DNA, it induces the subsequent binding of other amine groups more efficiently at pH 5.2 than at pH 7.4. The pKa values for PLL vary between 9 and 11.41–44 Thus, at pH ≪ 9, all the primary amine groups taking part in the binding of DNA are positively charged and changing the pH from 7.4 to 5.2 has only relatively small effect on the α and(KCO)α values. For LPEI, the pKa = 7.4–8.5.29,45 Thus, at pH 7.4, about 50% of the LPEI amine groups are protonated and decreasing the pH to 5.2 increases the degree of protonation. This is observed as a clear increase in (KCO)α values with decreasing pH. The average pKa for BPEI is equal to that of LPEI, that is, 7.4–8.5.29,45,46 However, BPEI contains primary (100% protonated at pH ≪ 9), secondary (50% protonated at pH 7.4), and tertiary amine groups (pKa = 6–7, less than 50% protonated at pH 7.4).33,47 Thus, the effect of pH on (KCO)α values is even larger than that for LPEI. The opposite is observed for the average cooperative binding constant per amine, KCO: the values are higher at pH 7.4 than at pH 5.2. This is due to the lower cooperativity at pH 7.4 which in turn is due to the smaller amount of other positive species at pH 7.4 compared with pH 5.2. Thus, the competition from the negative phosphate groups is lower at pH 7.4 compared with pH 5.2.
Effect of Polymer
The α-values obtained for both PEIs are nearly equal at both pHs and clearly higher than those obtained for PLL. Also the (KCO)α values were higher for PEIs than for PLL at both pHs. This is likely due to the different molecular structures of the polymers: for PEIs, there are only two carbon atoms between the amines, whereas in PLL there are 12. Since the active amine groups of PLL are at the ends of the flexible side chains, the difference in the average distance between the amine groups is actually not very large. However, the large hydrocarbon skeleton of PLL can cause steric hindrance and thus reduce the degree of cooperativity. At pH 7.4 the differences in α and (KCO)α values are much smaller, since the higher degree of amine group protonation of PLL can partly compensate the structural differences. On the other hand, the KCO values are always somewhat (1.1–1.6 times) higher for PLL than for PEIs (Table 1). Thus, the primary amine groups of PLL seem to bind DNA more strongly than the secondary amine groups of LPEI and the combined affinity between the primary, secondary, and tertiary amine groups of BPEI. This is in line with the observations indicating that the PEI–DNA complexes are more easily disrupted than PLL–DNA complexes in the presence of competing polyanions.7,8
Comparing the (KCO)α values and transfection efficiencies (Supporting Information Figure S5), there is a similarity in the behavior of PLL. However, despite the lower overall binding constant, PLL forms nanoparticles with DNA and these nanoparticles do enter the cells.7,9 The low transfection efficiency of PLL is a sum of many factors. One factor is the high pKa values for PLL causing all its amine groups to be totally protonated at the pH of the transfection studies. Thus, PLL has little buffering capacity and has a minor effect on the pH of its environment. The amine groups of PEIs are not fully protonated at pH 7.4 and can buffer the pH of their environment to some extent, causing the proton sponge effect.33,45,47–50 Also the average binding constant per amine group is higher for PLL than PEIs. This can make the release of DNA from the PLL-polyplexes more difficult than from PEI-polyplexes. It has been shown that the extracellular and cellular glycosoaminoglycans (GAGs) do not affect the release of DNA from PLL-carrier but they do affect the release of DNA from the BPEI-carrier.7,9 The (KCO)α values of 25 kDa BPEI are somewhat larger (1.1–333 times) than those of 22 kDa LPEI. However, the transfection efficiency of 22 kDa LPEI is higher than that of 25 kDa BPEI. The (KCO)α values describe only the formation of the nanoparticle core, that is, until all the phosphate groups of the DNA are bound at about N/P = 2. After this, excess polymer binds to the nanoparticle core forming a protective shell around it.33 This excess polymer has been shown to be a crucial factor in getting DNA to its destination, into the nucleus of the cell.13,36,51
CONCLUSIONS
Our studies explore the complexation of DNA with polyethylenimine and poly(L-lysine) by a spectroscopic method. Applying the cooperative binding model for multivalent ligand binding to multisubunit substrate showed that at pH 7.4 the mechanism of polyplex formation changes from independent binding to cooperative binding at N/P close to 0.6, whereas at pH 5.2 the polyplex formation is cooperative at all N/P values. The overall cooperative binding constants were higher at pH 5.2 than at 7.4, reflecting the higher degree of amine group protonation at lower pH. Thus, especially for polymer containing secondary and tertiary amine groups, it can be beneficial to prepare the nanoparticles at lower pH although the transfection is performed at biological pH. Both the amine density and overall cooperative binding constants are higher for PEIs than for PLL. However, the average binding constants per amine group were higher for PLL which contains only primary amine groups. For the present polymers, formation of the polyplex core is complete at approximately N/P = 2, at which point nearly all DNA phosphate groups are bound by polymer amine groups and all ETI has been freed to the solution. Thus, with the present fluorescence measurements, we cannot observe what happens to the polyplex at higher N/Ps using this TCSPC spectroscopic method. More studies involving fluorescently labeled polymers are needed to unravel this.
Supplementary Material
Acknowledgments
A Natural Science Foundation Graduate Research Fellowship and Nordic Research Opportunity Grant DGE-0707427 to C.J.B. are acknowledged. This work was supported in part by the National Institutes of Health (R21CA152473), Tekes PrinCell II 40050/09 Finland, and the Academy of Finland. The authors thank the Microscopy and Imaging Core Module of the Wilmer Core Grant (EY001765).
Footnotes
Author Contributions
The manuscript was written through contributions of all authors. All authors have given approval to the final version of the manuscript.
The authors declare no competing financial interest.
ASSOCIATED CONTENT
Theory of Hill plot model for multivalent ligand binding to multisubunit substrate and the following figures: Figure S1, fluorescence lifetimes of PLL, LPEI, BPEI, free ETI, and ETI:DNA complex at both pH-values; Figure S2, for PLL and BPEI ratio A2/A1,QY as a function of the inverse polymer concentration; Figure S3, Hill Plots of BPEI and PLL at both pH-values; Figure S4, independent vs cooperative models for BPEI, PLL, and LPEI at both pH-values; Figure S5, overall cooperative binding constants at pH 7.4 and transfection efficiencies in different cell lines at pH 7.4 for BPEI, LPEI, and PLL. This material is available free of charge via the Internet at http://pubs.acs.org.
References
- 1.Mintzer MA, Simanek EE. Nonviral Vectors for Gene Delivery. Chem Rev. 2009;109:259–302. doi: 10.1021/cr800409e. [DOI] [PubMed] [Google Scholar]
- 2.Boussif O, Lezoualc’h F, Zanta MA, Mergny MD, Scherman D, Demeneix B, Behr JP. A Versatile Vector for Gene and Oligonucleotide Transfer into Cells in Culture and in Vivo: Polyethylenimine. Proc Natl Acad Sci US A. 1995;92:7297–7301. doi: 10.1073/pnas.92.16.7297. [DOI] [PMC free article] [PubMed] [Google Scholar]
- 3.Lungwitz U, Breunig M, Blunk T, Göpferich A. Polyethylenimine-Based Non-Viral Gene Delivery Systems. Eur J Pharm Biopharm. 2005;60:247–266. doi: 10.1016/j.ejpb.2004.11.011. [DOI] [PubMed] [Google Scholar]
- 4.Neu M, Fischer D, Kissel T. Recent Advances in Rational Gene Transfer Vector Design Based on Poly(ethyleneimine) and Its Derivatives. J Gene Med. 2005;7:992–1009. doi: 10.1002/jgm.773. [DOI] [PubMed] [Google Scholar]
- 5.Parhamifar L, Larsen AK, Hunter AC, Andresen TL, Moghimi SM. Polycation Cytotoxicity: a Delicate Matter for Nucleic Acid Therapy – Focus on Polyethylenimine. Soft Matter. 2010;6:4001–4009. [Google Scholar]
- 6.Dunlap DD, Maggi A, Soria MR, Monaco L. Nanoscopic Structure of DNA Condensed for Gene Delivery. Nucleic Acids Res. 1997;25:3095–3101. doi: 10.1093/nar/25.15.3095. [DOI] [PMC free article] [PubMed] [Google Scholar]
- 7.Ruponen M, Ylä-Herttuala S, Urtti A. Interactions of Polymeric and Liposomal Gene Delivery Systems with Extracellular Glycosaminoglycans: Physicochemical and Transfection Studies. Biochim Biophys Acta, Biomembr. 1999;1415:331–341. doi: 10.1016/s0005-2736(98)00199-0. [DOI] [PubMed] [Google Scholar]
- 8.Ruponen M, Rönkkö S, Honkakoski P, Pelkonen J, Tammi M, Urtti A. Extracellular Glycosaminoglycans Modify Cellular Trafficking of Lipoplexes and Polyplexes. J Biol Chem. 2001;36:33875–33880. doi: 10.1074/jbc.M011553200. [DOI] [PubMed] [Google Scholar]
- 9.Männistö M, Reinisalo M, Ruponen M, Honkakoski P, Tammi M, Urtti A. Polyplex-Mediated Gene Transfer and Cell Cycle: Effect of Carrier on Cellular Uptake and Intracellular Kinetics, and Significance of Glycosaminoglycans. J Gene Med. 2007;9:479–487. doi: 10.1002/jgm.1035. [DOI] [PubMed] [Google Scholar]
- 10.Matsumoto Y, Itaka K, Yamasoba T, Kataoka K. Intranuclear Fluorescence Resonance Energy Transfer Analysis of Plasmid DNA Decondensation from Nonviral Gene Carriers. J Gene Med. 2009;11:615–623. doi: 10.1002/jgm.1338. [DOI] [PubMed] [Google Scholar]
- 11.Morille M, Passirani C, Vonarbourg A, Clavreul A, Benoit JP. Progress in Developing Cationic Vectors for Non-Viral Systemic Gene Therapy Against Cancer. Biomaterials. 2008;29:3477–3496. doi: 10.1016/j.biomaterials.2008.04.036. [DOI] [PubMed] [Google Scholar]
- 12.Tang MX, Szoka FC. The Influence of Polymer Structure on the Interactions of Cationic Polymers with DNA and Morphology of the Resulting Complexes. Gene Ther. 1997;4:823–832. doi: 10.1038/sj.gt.3300454. [DOI] [PubMed] [Google Scholar]
- 13.Ketola TM, Hanzlikova M, Urtti A, Lemmetyinen H, Yliperttula M, Vuorimaa E. Role of Polyplex Intermediate Species on Gene Transfer Efficiency: Polyethylenimine–DNA Complexes and Time-Resolved Fluorescence Spectroscopy. J Phys Chem B. 2011;115:1895–1902. doi: 10.1021/jp109984c. [DOI] [PubMed] [Google Scholar]
- 14.Bishop C, Ketola TM, Tzeng SY, Sunshine JC, Urtti A, Lemmetyinen H, Vuorimaa-Laukkanen E, Yliperttula M, Green JJ. The Effect and Role of Carbon Atoms in Poly(β-amino ester)s for DNA Binding and Gene Delivery. J Am Chem Soc. 2013;135:6951–6957. doi: 10.1021/ja4002376. [DOI] [PMC free article] [PubMed] [Google Scholar]
- 15.Ward CM, Ward ML, Seymour LW. Systemic Circulation of Poly(L-lysine)/DNA Vectors is Influenced by Polycation Molecular Weight and Type of DNA: Differential Circulation in Mice and Rats and the Implications for Human Gene Therapy. Blood. 2001;97:2221–2229. doi: 10.1182/blood.v97.8.2221. [DOI] [PubMed] [Google Scholar]
- 16.Vuorimaa E, Urtti A, Seppänen R, Lemmetyinen H, Yliperttula M. Time-Resolved Fluorescence Spectroscopy Reveals Functional Differences of Cationic Polymer-DNA Complexes. J Am Chem Soc. 2008;130:11695–11700. doi: 10.1021/ja801503h. [DOI] [PubMed] [Google Scholar]
- 17.Vuorimaa E, Ketola TM, Green JJ, Hanzlíková M, Lemmetyinen H, Langer R, Anderson DG, Urtti A, Yliperttula M. Poly(β-amino ester)-DNA Complexes: Time-Resolved Fluorescence and Cellular Transfection Studies. J Controlled Release. 2011;154:171–176. doi: 10.1016/j.jconrel.2011.06.016. [DOI] [PMC free article] [PubMed] [Google Scholar]
- 18.Connors KA. Binding Constants: The Measurements of Molecular Complex Stability. John Wiley & Sons; New York: 1987. [Google Scholar]
- 19.Gelamo EL, Tabak M. Spectroscopic Studies on the Interaction of Bovine (BSA) and Human (HSA) Serum Albumins with Ionic Surfactants. Spectrochim Acta, Part A. 2000;56:2255–2271. doi: 10.1016/s1386-1425(00)00313-9. [DOI] [PubMed] [Google Scholar]
- 20.Gelamo EL, Silva CHTP, Imasato H, Tabak M. Ineraction of Bovine (BSA) and Human (HSA) Serum Albumins with Ionic Surfactants: Spectroscopy and Modeling. Biochim Biophys Acta. 2002;1594:84–99. doi: 10.1016/s0167-4838(01)00287-4. [DOI] [PubMed] [Google Scholar]
- 21.Nanduri V, Sorokulova IB, Samoylov AM, Simonian AL, Petrenko VA, Vodyanoy V. Phage as a Molecular Recognition Element in Biosensors Immobilized by Physical Adsorption. Biosens Bioelectron. 2007;22:986–992. doi: 10.1016/j.bios.2006.03.025. [DOI] [PubMed] [Google Scholar]
- 22.Michel D. Cooperative Equilibrium Curves Generated by Ordered Ligand Binding to Multi-Site Molecules. Biophys Chem. 2007;129:284–288. doi: 10.1016/j.bpc.2007.06.010. [DOI] [PubMed] [Google Scholar]
- 23.Wightman L, Kircheis R, Rössler V, Carotta S, Ruzicka R, Kursa M, Wagner E. Different Behavior of Branched and Linear Polyethylenimine for Gene Delivery in Vitro and in Vivo. J Gene Med. 2001;3:362–372. doi: 10.1002/jgm.187. [DOI] [PubMed] [Google Scholar]
- 24.Sharma VK, Thomas M, Klibanov AM. Mechanistic Studies on Aggregation of Polyethylenimine-DNA Complexes and Its Prevention. Biotechnol Bioeng. 2005;90:614–620. doi: 10.1002/bit.20444. [DOI] [PubMed] [Google Scholar]
- 25.Ikonen M, Murtomäki L, Kontturi K. Controlled Complexation of Plasmid DNA with Cationic Polymers: Effect of Surfactant on the Complexation and Stability of the Complexes. Colloids Surf, B. 2008;66:77–83. doi: 10.1016/j.colsurfb.2008.05.012. [DOI] [PubMed] [Google Scholar]
- 26.Pelisek J, Gaedtke L, DeRouchey J, Walker GF, Nikol S, Wagner E. Optimized Lipopolyplex Formulations for Gene Transfer to Human Colon Carcinoma Cells under in Vitro Conditions. J Gene Med. 2006;8:186–197. doi: 10.1002/jgm.836. [DOI] [PubMed] [Google Scholar]
- 27.Ogris M, Steinlein P, Kursa M, Mechtler K, Kircheis R, Wagner E. The Size of DNA/Transferrin-PEI Complexes is an Important Factor for Gene Expression in Cultured Cells. Gene Ther. 1998;5:1425–1433. doi: 10.1038/sj.gt.3300745. [DOI] [PubMed] [Google Scholar]
- 28.Zhou Y-L, Li Y-Z. The Interaction of Poly(ethylenimine) with Nucleic Acids Its Use in Determination of Nucleic Acids Based on Light Scattering. Spectrochim Acta, Part A. 2004;60:377–384. doi: 10.1016/s1386-1425(03)00243-9. [DOI] [PubMed] [Google Scholar]
- 29.Choosakoonkriang S, Lobo BA, Koe GS, Koe JG, Middaugh CR. Biophysical Characterization of PEI/DNA Complexes. J Pharm Sci. 2003;92:1710–1722. doi: 10.1002/jps.10437. [DOI] [PubMed] [Google Scholar]
- 30.Jääskeläinen I, Mönkkönen J, Urtti A. Oligonucleotide-Cationic Liposome Interactions. A Physicochemical Study. Biochim Biophys Acta. 1994;1195:115–123. doi: 10.1016/0005-2736(94)90017-5. [DOI] [PubMed] [Google Scholar]
- 31.Byrne CD, de Mello AJ. Photophysics of Ethidium Bromide Complexed to ct-DNA: a Maximum Entropy Study. Biophys Chem. 1998;70:173–184. doi: 10.1016/s0301-4622(97)00091-4. [DOI] [PubMed] [Google Scholar]
- 32.Duan X, Xiao J, Yin Q, Zhang Z, Mao S, Li Y. Amphiphilic Graft Copolymer Based on Poly(styrene-co-maleic anhydride) with Low Molecular Weight Polyethylenimine for Efficient Gene Delivery. Int J Nanomed. 2012;7:4961–4972. doi: 10.2147/IJN.S32069. [DOI] [PMC free article] [PubMed] [Google Scholar]
- 33.Wang Y, Chen P, Shen J. The Development and Characterization of a Glutathione-Sensitive Cross-Linked Polyethylenimine Gene Vector. Biomaterials. 2006;27:5292–5298. doi: 10.1016/j.biomaterials.2006.05.049. [DOI] [PubMed] [Google Scholar]
- 34.Yu JH, Quan JS, Huang J, Nah JW, Cho CS. Degradable Poly(amino ester) Based on Poly(ethylene glycol) Dimethacrylate and Polyethylenimine as a Gene Carrier: Molecular Weight of PEI Affects Transfection Efficiency. J Mater Sci: Mater Med. 2009;20:2501–2510. doi: 10.1007/s10856-009-3816-z. [DOI] [PubMed] [Google Scholar]
- 35.Rungsardthong U, Ehtezazi T, Bailey L, Armes SP, Garnett MC, Stolnik S. Effect of Polymer Ionization on the Interaction with DNA in Nonviral Gene Delivery Systems. Biomacromolecules. 2003;4:683–690. doi: 10.1021/bm025736y. [DOI] [PubMed] [Google Scholar]
- 36.Dai Z, Gjetting T, Mattebjerg MA, Wu C, Andresen TL. Elucidating the Interplay Between DNA-Condensing and Free Polycations in Gene Transfection Through a Mechanistic Study of Linear and Branched PEI. Biomaterials. 2011;32:8626–8634. doi: 10.1016/j.biomaterials.2011.07.044. [DOI] [PubMed] [Google Scholar]
- 37.Blessing T, Kursa M, Holzhauser R, Kircheis R, Wagner E. Different Strategies for Formation of PEGylated EGF-Conjugated PEI/DNA Complexes for Targeted Gene Delivery. Bioconjugate Chem. 2001;12:529–537. doi: 10.1021/bc0001488. [DOI] [PubMed] [Google Scholar]
- 38.Utsuno K, Uludag H. Thermodynamics of Polyethylenimine-DNA Binding and DNA Condensation. Biophys J. 2010;99:201–207. doi: 10.1016/j.bpj.2010.04.016. [DOI] [PMC free article] [PubMed] [Google Scholar]
- 39.Reul R, Nguyen J, Biela A, Marxer E, Bakowsky U, Klebe G, Kissel T. Biophysical and Biological Investigation of DNA Nano-Complexes with a Non-Toxic, Biodegradable Amine-Modified Hyper-branched Polyester. Int J Pharm. 2012;436:97–105. doi: 10.1016/j.ijpharm.2012.06.065. [DOI] [PubMed] [Google Scholar]
- 40.Torigoe H, Akaike T, Maruyama A. Promotion Mechanism of Triplex DNA Formation by Comb-Type Polycations: Thermodynamic Analyses of Sequence Specificity and Ionic Strength Dependence. Nucleic Acids Symp Ser. 1999;42:137–138. doi: 10.1093/nass/42.1.137. [DOI] [PubMed] [Google Scholar]
- 41.Harada A, Kawamura M, Matsuo T, Takahashi T, Kono K. Synthesis and Characterization of a Head-Tail Type Polycation Block Copolymer as a Nonviral Gene Vector. Bioconjugate Chem. 2006;17:3–5. doi: 10.1021/bc0502863. [DOI] [PubMed] [Google Scholar]
- 42.Fukushima S, Miyata K, Nishiyama N, Kanayama N, Yamasaki Y, Kataoka K. PEGylated Polyplex Micelles from Triblock Catiomers with Spatially Ordered Layering of Condensed pDNA and Buffering Units for Enhanced Intracellular Gene Delivery. J Am Chem Soc. 2005;127:2810–2811. doi: 10.1021/ja0440506. [DOI] [PubMed] [Google Scholar]
- 43.Stobiecka M, Hepel M. Double-Shell Gold Nanoparticle-Based DNA-Carriers with Poly-L-lysine Binding Surface. Biomaterials. 2011;32:3312–3321. doi: 10.1016/j.biomaterials.2010.12.064. [DOI] [PubMed] [Google Scholar]
- 44.Guo Y, Xia F, Xu L, Li J, Yang W, Jiang L. Switchable Wettability on Cooperative Dual-Responsive Poly-L-lysine Surface. Langmuir. 2010;26:1024–1028. doi: 10.1021/la9041452. [DOI] [PubMed] [Google Scholar]
- 45.Ziebarth JD, Wang Y. Understanding the Protonation Behavior of Linear Polyethylenimine in Solutions Through Monte Carlo Simulations. Biomacromolecules. 2010;11:29–38. doi: 10.1021/bm900842d. [DOI] [PMC free article] [PubMed] [Google Scholar]
- 46.Clamme JP, Azoulay J, Mély Y. Monitoring of the Formation and Dissociation of Polyethylenimine/DNA Complexes by Two Photon Fluorescence Correlation Spectroscopy. Biophys J. 2003;84:1960–1968. doi: 10.1016/S0006-3495(03)75004-8. [DOI] [PMC free article] [PubMed] [Google Scholar]
- 47.Kwan K, Lee JW, Choi JY, Shin KS. pH Effect on Surface Potential of Polyelectrolytes-Capped Gold Nanoparticles Probed by Surface-Enhanced Raman Scattering. Langmuir. 2010;26:19163–19169. doi: 10.1021/la103864n. [DOI] [PubMed] [Google Scholar]
- 48.Kichler A, Leborgne C, Coeytaux E, Danos O. Polyethylenimine-Mediated Gene Delivery: A Mechanistic Study. J Gene Med. 2001;3:135–144. doi: 10.1002/jgm.173. [DOI] [PubMed] [Google Scholar]
- 49.Midoux P, Pichon C, Yaouanc JJ, Jaffrès PA. Chemical Vectors for Gene Delivery: A Current Review on Polymers, Peptides and Lipids Containing Histidine or Imidazole as Nucleic Acids Carriers. Br J Pharmacol. 2009;157:166–178. doi: 10.1111/j.1476-5381.2009.00288.x. [DOI] [PMC free article] [PubMed] [Google Scholar]
- 50.Godbey WT, Wu KK, Mikos AG. Size Matters: Molecular Weight Affects the Efficiency of Poly(ethylenimine) as a Gene Delivery Vehicle. J Biomed Mater Res. 1999;45:268–275. doi: 10.1002/(sici)1097-4636(19990605)45:3<268::aid-jbm15>3.0.co;2-q. [DOI] [PubMed] [Google Scholar]
- 51.Hanzlíková M, Ruponen M, Galli E, Raasmaja A, Aseyev V, Tenhu H, Urtti A, Yliperttula M. Mechanisms of Polyethylenimine-Mediated DNA Delivery: Free Carrier Helps to Overcome the Barrier of Cell-Surface Glycosaminoglycans. J Gene Med. 2011;13:402–409. doi: 10.1002/jgm.1587. [DOI] [PubMed] [Google Scholar]
Associated Data
This section collects any data citations, data availability statements, or supplementary materials included in this article.