

Abstract
Objective
Brain tissue undergoes dramatic molecular and cellular remodeling at the implant-tissue interface that evolves over a period of weeks after implantation. The biomechanical impact of such remodeling on the interface remains unknown. In this study, we aim to assess the changes in mechanical properties of the brain-electrode interface after chronic implantation of a microelectrode.
Approach
Microelectrodes were implanted in the rodent cortex at a depth of 1 mm for different durations - 1 day (n=4), 10-14 days (n=4), 4 weeks (n=4), 6 - 8 weeks (n=7). After the initial duration of implantation, the microelectrodes were moved an additional 1 mm downward at a constant speed of 10 μm/sec. Forces experienced by the microelectrode were measured during movement and after termination of movement. The biomechanical properties of the interfacial brain tissue were assessed from measured force-displacement curves using two separate models — a 2-parameter Mooney-Rivlin hyperelastic model and a viscoelastic model with a 2nd order prony series.
Main results
Estimated shear moduli using a 2nd order viscoelastic model increased from 0.5 - 2.6 kPa (day 1 of implantation) to 25.7 - 59.3 kPa (4 weeks of implantation) and subsequently decreased to 0.8 - 7.9 kPa after 6-8 weeks of implantation in 6 of 7 animals. Estimated elastic moduli increased from 4.1-7.8 kPa on the day of implantation to 24 - 44.9 kPa after 4 weeks. The elastic moduli was estimated to be 6.8-33.3 kPa in 6 of 7 animals after 6-8 weeks of implantation. The above estimates suggest that the brain tissue surrounding the microelectrode evolves from a stiff matrix with maximal shear and elastic moduli after 4 weeks of implantation into a composite of two different layers with different mechanical properties – a stiff compact inner layer surrounded by softer brain tissue that is biomechanically similar to brain tissue during the first week of implantation. Tissue micromotion induced stresses on the microelectrode constituted 12-55% of the steady-state stresses on the microelectrode on the day of implantation (n=4), 2-21% of the steady-state stresses after 4 weeks of implantation (n=4), and 4 - 10% of the steady-state stresses after 6-8 weeks of implantation (n=7).
Significance
Understanding the biomechanical behavior at the brain-microelectrode interface is necessary for long-term success of implantable neuroprosthetics and microelectrode arrays. Such quantitative physical characterization of the dynamic changes in the electrode-tissue interface will (a) drive design and development of more mechanically optimal, chronic brain implants and (b) will lead to new insights into key cellular and molecular events such as neuronal adhesion, migration and function in the immediate vicinity of the brain implant.
Introduction
Chronic implantation of microelectrode arrays in vivo leads to changes in the molecular and cellular composition of tissue at the brain-electrode interface that stabilizes over a period of several weeks after implantation. While brain tissue has been extensively characterized in vivo, in situ, and in vitro using histological and immunohistochemical methods, the accompanying changes in the constitutive properties of the brain-electrode interface in vivo is not well understood. Such quantitative physical characterization of the dynamic changes in the electrode-tissue interface will (a) drive design and development of more mechanically optimal, chronic brain implants and (b) will lead to new insights into key cellular and molecular events such as neuronal adhesion, migration and function in the immediate vicinity of the brain implant. It has been hypothesized that the mechanical mismatch between the microelectrode and the brain tissue under chronic conditions leads to an aggravated tissue response including severe glial scarring [1, 2]. This response in turn is commonly hypothesized to result in deterioration in signal quality at the brain-electrode interface [3-6].
Material properties of the brain tissue have been extensively characterized in vitro and in vivo using multiple material testing methods such as uniaxial compression/tension testing, indentation, rheology, acoustic and magnetic resonance elastography (MRE) methods [7-14]. Most in vivo testing utilize either indentation or MRE methods, the former being more invasive than the latter. In general, brain tissue has been characterized having a strain-rate dependent behavior with a time-varying creep component. Models describing brain material behavior have a hyperelastic component or a nonlinear, viscoelastic component that behaves differently under different strain rates. Typical values for the elastic modulus of the brain tissue range from 1 kPa -100 kPa depending on test method, condition, and region of brain (i.e gray or white matter) [15-20]. For instance, at higher strain rates (i.e as observed in typical MRE studies with vibration frequencies of 70-120 Hz), the elastic modulus has been estimated to be ∼30-40 kPa with a shear modulus of ∼10 kPa [21]. Indentation experiments with needle probes that have micrometer dimensions typically utilize lower strain rates. Miller et al showed that the elastic modulus was 3.1 kPa [16] in a porcine specimen. Sharp et al showed that in rats at low loading rates (11 μm/sec) the estimated elastic modulus was ∼4.5 kPa, while at high loading rates (822 μm/sec) the estimated elastic modulus was ∼10.5 kPa [18]. Estimated elastic modulus was ∼8.2 kPa in human cadaver brains using an indentation method at a loading rate of 0.5 mm/sec [20, 22, 23]. These variations in material properties have different implications for high deformation and strain rate conditions such as traumatic brain injury (TBI) (with strains ∼0.9) and for slower, or smaller deformation conditions such as the penetration of surgical probes and moveable microelectrodes. Prior studies such as those cited above suggest that the tissue is significantly stiffer at higher strain rates. In addition, mechanical failure of neural tissue in tension typically occurs at finite strains of 0.1 - 0.3, while other data suggests tissue in compression fails at strain of 0.3 - 0.5 [24]. Tissue mechanical failure is also expected to be strain rate dependent, where lower strain rates have been shown to have lower failure stresses [25, 26].
The material properties are also expected to change with respect to age and disease. Gefen et al showed that brain tissue decreases in stiffness with age in rats [27]. However, Shulyakov et al reported an increase in elastic modulus, though the differences could be attributed to the absence or presence of dura mater and other meningeal layers [29] and their effects on force measurements. Sack et al showed liquefaction of human brain tissue between ages 18-88 in an MRE study [28]. Recent studies show cerebral viscoelasticity as an emerging biomarker for diseases such as multiple sclerosis, and other neurodegenerative diseases [30]. Prange and Margulies showed an increase in stiffness properties in diseased, epileptic tissue versus healthy brain tissue [31]. Walsh & Schetinni showed an increase in brain tissue elastic properties for hypertensive dogs [32].
Studies on mechanics of implanted microelectrodes have focused on the mechanics of penetration and extraction in acute experiments. However, long-term changes in the material properties of the brain tissue in the immediate vicinity of a brain implant (within approximately a couple of hundred micrometers from the implant) have not yet been carefully characterized. Such characterization will be crucial to the success of chronic brain implants both in the optimal design of implants and in understanding the functional dynamics of cells confined within this interface. In this study, we aim to characterize the dynamics of changes in the material properties of the implant-tissue interface around a microelectrode implanted in brain tissue over 8 weeks. Using a precision load cell, we measure forces experienced by the microelectrode as it moves through brain tissue after different durations of implantation. The force-displacement curves obtained from these measurements are then used for subsequent analysis to determine the material properties of the tissue-microelectrode interface. Using hyperelastic, viscoelastic models of brain, we estimate the dynamic changes in the elastic and shear moduli of the brain tissue in the interface.
2. Materials & Methods
Surgical procedures for chronic force measurements
Using a customized jig with a removable load cell for long-term studies, dynamic and equilibrium forces on a microelectrode probe were measured in vivo in adult Sprague-Dawley rats (250-300 g). A diagram of the experimental setup is shown in Fig. 1A. A total of 31 rats were used for all acute and chronic time point measurements. For chronic measurements, we implanted a microelectrode 1 mm deep in the somatosensory cortex in a total of n = 20 Sprague-Dawley rats. Each custom jig contained one stainless steel microelectrode probe that was used to evaluate forces on the microelectrode under chronic implantation conditions ranging from 1 day (n=4), 10 days (n=2), 2 weeks (n=2), 4 weeks (n=4), 6 weeks (n=4), and 8 weeks (n=4). Due to mounting issues, the implant in one rat at 8 weeks failed and measurements could not be made. All animal procedures were carried out with the approval of the Institute of Animal Care and Use Committee (IACUC) of Arizona State University, Tempe. The experiments were performed in accordance with the National Institute of Health (NIH) guide for the care and use of laboratory animals (1996). All efforts were made to minimize animal suffering and to use only the number of animals necessary to produce reliable scientific data.
Figure 1.
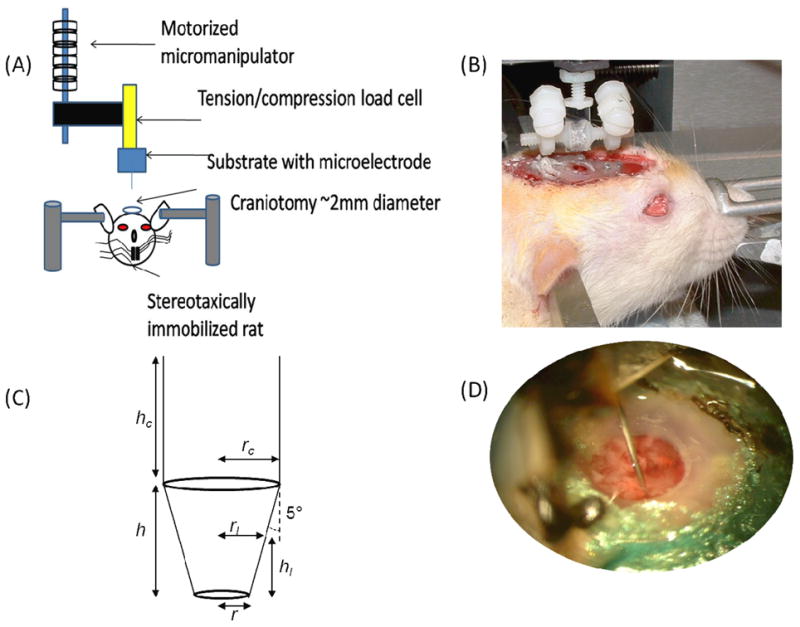
Experimental set-up for chronic force measurements. (A) The microelectrode is a 200 μm diameter stainless steel probe was mounted on a tension/compression load cell. The load cell was mounted to a motorized micromanipulator (FHC). (B) A typical setup with a microelectrode is shown on a live, anesthesized rat. The two adjustable posts on either side of the microelectrode allow for immobilization on the skull under chronic conditions. The force setup was positioned over a stereotaxically immobilized rat with exposed brain tissue (2.0-2.5 mm lateral to midline and 2.0 mm posterior to bregma). The setup is attached to the micromanipulator via a magnetic link. (C) The geometry of the conical stainless steel probe used for force measurements is shown where h is 1 mm in height, hc is also 1 mm, rc is the radius of the cylindrical portion of the probe, rl is the radius of the conical portion of the probe based on a given penetration depth, r is the radius of the tip (10 μm) and the sub-script “l” denotes the penetration depth. (D) A close-up view of a chronically implanted stainless steel microelectrode in brain tissue.
The animals were induced using a mixture of (50 mg/ml) ketamine, (5 mg/ml) xylazine, and (1 mg/ml) acepromazine administered intramuscularly with an initial dosage of 0.1 ml/100 g body weight. The anesthesia for update contained a mixture of 50 mg/ml ketamine and 5 mg/ml xylazine. Updates were given at a dose of 0.05 ml/100 g body weight based on the toe-pinch test. In chronic experiments, rats received analgesics for buprenorphine (0.05 mg/kg) and meloxicam (1 mg/kg). The rat was attached to a stereotaxic frame (Kopf Instruments, Tujunga, CA, USA). After the skull was exposed, three stainless steel bone screws (19010-10 Fine Science Inc., Foster City, CA, USA) were screwed into the skull to act as anchors. One craniotomy (∼2.0 mm diameter) was drilled for the microelectrode probe with the center point being 2.5 mm lateral to the midline and 2.5 mm posterior to the bregma. After the bone chips were carefully removed with a micro-dissection scissor, the dura was incised to allow for microelectrode insertion. The craniotomy was isolated from external flesh and skin by placement of a small washer well. The center of the well had exposed brain tissue that was hydrated and maintained free of debris during the chronic exposure to the microelectrode probe. The stainless steel microelectrode probe was pre-mounted onto the load cell and slowly inserted into the brain at a rate of 10 μm/s. The microelectrode probe was implanted to a depth of 1 mm in the rodent somatosensory cortex for all chronic experiments. Forces experienced by the microelectrode during the insertion/penetration process were monitored using a precision load cell. After implantation, dental cement (PMMA) was used to secure the load cell onto the skull. Gelfoam was placed around the microelectrode over any exposed brain tissue and a mylar cap was sealed over the craniotomy well to prevent debris from entering. For daily maintenance of the brain tissue in the craniotomy, rats under chronic implantation conditions were anesthetized using 1-4% isoflurane during which the mylar cap was removed and the exposed brain tissue was washed with 0.9% saline prevent dehydration of the tissue, infection and accumulation of any clots. Force measurements performed on brain tissue 1 mm away from the insertion site after 4 weeks and 8 weeks showed similar values as those on brain tissue during the first week of implantation demonstrating the mechanical integrity of the brain tissue in the craniotomy. Wound care and daily maintenance were crucial in obtaining accurate long-term measurements at the interface of brain-microelectrode contact.
Experimental set-up
Chronic forces were measured using a custom built jig with a removable load cell (Fig. 1B). A connecting pad with a magnetic pad was loaded onto a sensitive 10 g load cell (Futek, LSB210, Irvine, CA). Separately, a customized jig with adjustable nylon struts to hold a stainless-steel microelectrode in place at the craniotomy was constructed. The stainless-steel microelectrode (FST#26002-20) had a 200 μm shaft diameter with a 5° taper (Fig. 1C). At the tip, the probe tapered to 10 μm in diameter. Stainless steel probes were used because of their high elastic modulus (∼200 GPa) and their resistance to bending on contact with brain tissue compared to smaller probes [33, 34]. The microelectrode was mounted onto an adjustable, custom-made nylon jig. This jig was built with a magnetic top for attachment with the load cell. To ensure no additional force was placed on the microelectrode, the forces were monitored while mounting. During surgery, the jig with the microelectrode was pre-mounted on the load cell and slowly lowered on to the brain in the craniotomy using a micromanipulator (FHC#50-12-1C, Bowdoin, ME). Contact with the brain tissue was confirmed with observation by a stereomicroscope and by observation of forces using the load cell. Using the micromanipulator, the microelectrode was placed 1 mm into the brain tissue (Fig. 1D). After placement of the microelectrode at 1 mm depth inside brain tissue, the two nylon struts were lowered gently on to the skull and fixed with dental cement. After the jig was confirmed to hold its place with the microelectrode inside the brain, the load cell was gently removed by unclasping the magnetic holder. After different durations of implantation (1 day (n=4), 10 days (n=2), 2 weeks (n=2), 4 weeks (n=4), 6, weeks (n=4), or 8 weeks (n=3) after implantation), the load cell was remounted on the jig gently. The outer support struts holding the microelectrode in place were gently cut off with a hot blade. The hot blade essentially melts the nylon struts without inducing any torque on the microelectrode itself during the cutting process. The load cell and the microelectrode were also monitored under a microscope to ensure it did not move during the transfer process. After the support struts are cut, the load of the microelectrode is completely transferred to the load cell. The forces on the microelectrode were monitored for 30 min to ensure equilibrium conditions before indentation experiments.
Chronic force-displacement curves
The sequence for chronic measurements was to 1) implant microelectrodes at 1 mm depth on day one at 10 μm/sec, 2) hold microelectrode in place in for different durations (1 day-8 weeks), 3) move the microelectrode 1 mm down at 10 μm/sec and measure dynamic and static forces on probe. The protocol resembled indentation measurement with AFM tips. However, in this study the microelectrode was implanted in the tissue prior to movement, allowing measurement of forces required to move the probe through any scar tissue that formed around it. In this study we did a series of acute experiments to determine the optimal experimental parameters. We found loading rates of 100 μm/sec to have dynamic force measurements that are inconsistent (n=2 craniotomies). Moving the microelectrode at 10 μm/sec showed consistency in force-displacement measurements. The idea was to reduce potential injury induced variability that may influence the interfacial wound healing process.
Typical force-displacement curves during penetration of tissue as the microelectrode moves 1 mm down into the tissue at 10 μm/sec can be seen in Fig. 2. Force-displacement curves obtained on the day of implantation were consistent with prior studies [18, 35]. Forces were typically registered as negative values by the load cell due to compression and tissue resistance during movement of the microelectrode into the brain. Forces acting on the microelectrode represented both shear and compressive forces. Initial indentation stresses (up to 300 μm depth) (1) in Fig. 2 were expected to be mostly from compressive forces acting on the microelectrode during penetration. However, as the microelectrode moved deeper, the contribution of the shear forces was expected to increase. The end stress point (3) in Fig. 2 reflected the maximum shear force exerted by the brain tissue at that depth. After displacement of 1 mm into the tissue, the microelectrode was held at the depth for at least 500 sec while the forces on the microelectrode relaxed (4).
Figure 2.
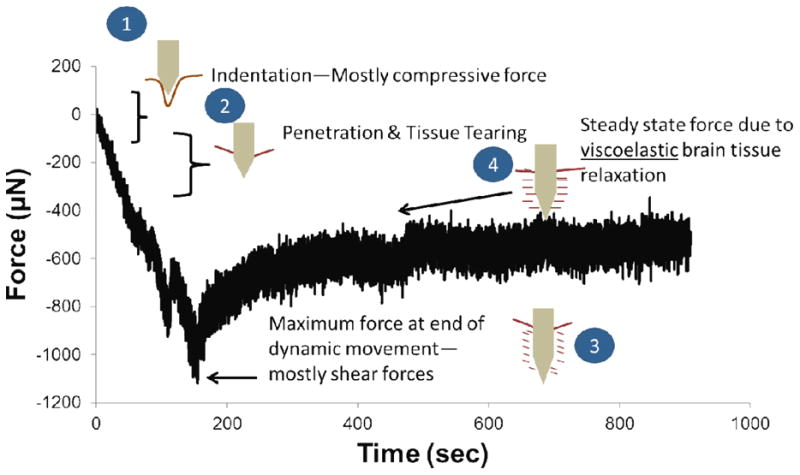
Summary of key mechanical events that are likely to happen during each phase of the force-displacement curve shown in Fig. 1. During the first 200-300 μm (labeled ‘1’), the microelectrode exerts a compressive force on the brain tissue as it deforms and indents the tissue without penetrating. Beyond this depth, puncture and penetration occurs (labeled ‘2’) and the microelectrode essentially cuts through the brain tissue. At the end of the movement of the microelectrode (labeled ‘3’), maximum force on the microelectrode is observed. This point represents mostly shear forces on the microelectrode. As the brain tissue relaxes around the microelectrode, a steady-state plateau (labeled ‘4’) is eventually observed. The relaxation from point (3) to point (4) can be characterized using a viscoelastic model due to small strain conditions.
To better characterize the range of stresses (calculation of stress is described later) exerted on the microelectrode during the insertion process, the force-displacement curves were delineated into 3 zones - initial stress zone (up to 300 μm depth) representing penetration stresses, the end stress point at 1 mm depth, and steady-state stress zone (500 secs into the relaxation phase after reaching the end stress point). The distribution of effective stress values within each of the three stress zones were analyzed using Tukey box-whisker plots (n= 31 animals; data was pooled from acute and chronic experiments on the first day of implantation). The median value of effective stresses in penetration zone was ∼5.4 kPa (Q1=-9.0 kPa, Q3=-3.4 kPa) that is comparable to elastic moduli reported earlier (where a linear elastic model was used to estimate the elastic modulus from the initial slope of a similar force-displacement curve [18] in acute experiments). Independent, flat-punch experiments suggests that stresses in the initial stress zone (5-7 kPa) reflected the elastic moduli of the brain under low strain rate conditions. The variation of stresses in the initial stress zone (Q1=-9.0 kPa, Q3=-3.4 kPa) is in part due to the heterogeneity present on the surface of brain tissue. For instance, the presence of meningeal layers impacted the stress values in this zone. The range of effective stresses in the initial zone after removal of the dura using a dural pick (without removal of the pia below) was 6.3-8.3 kPa (n=10). If the dura was removed by a collagenase treatment (similar to Paralikar et al. [36]), the range of effective stresses in the initial zone was 8.5-10.5 kPa (n=2). If small nicks were made in the dura (n=8) to accommodate the microelectrode effective stresses were 4.4 – 5.5 kPa with exception of 1 animal in which the average effective stress was 8.2 kPa. In craniotomies with visibly damaged pia (i.e broken blood vessels/fully exposed cortex), the effective stresses in the initial zone were 0.48 - 3.3 kPa (n=9). Multiple insertions in the same spot also resulted in decreased effective stresses of 1.9 - 2.4 kPa (n=2) in the initial zone. Regardless of the initial penetration stresses, the final steady-state stress settled to a median value of ∼0.44 kPa (Q1=-1.8 kPa, Q3=-0.112 kPa). Effective stresses in the initial zone are therefore dependent on 1) insertion speed 2) presence of pia and other meningeal layers 3) tissue heterogeneity and 4) microelectrode geometry [18, 33, 37, 38]. Interestingly, the initial insertion stresses have been shown by Welkenhuysen et al. [35] to not correlate with the degree of subsequent gliosis around the implant after 4 weeks.
After different durations of implantation time (4 hours to 8 weeks) when the effective stresses on the microelectrode were in the steady-state zone (median=0.44 kPa, Q1=-1.8 kPa, Q3=-0.112 kPa), the load cell was re-attached, monitored for equilibrium for 30 min and zeroed. The microelectrode was then moved for an additional 1 mm at a constant loading rate of 10 μm/sec. Force measurements were sampled at a frequency of 54 Hz.
Estimation of stress from force measurements
A typical force-displacement curve as the microelectrode penetrated the brain at a speed of 10 μm/sec is shown in Fig. 2. The initial part of the force curve (∼200 - 300 μm) is expected to reflect compression of brain tissue by the microelectrode before penetration and puncture. Other groups have also observed this as a dimpling effect before linearization of the forces [35, 39, 40]. In this study, we treat this portion as an indentation of the brain tissue. The second part of the force-displacement curve until the microelectrode reaches a depth of 1 mm in the brain is typically smaller in slope and fairly linear. Sharp et al refer to the second part of the curve as a cutting force, where the microelectrode cuts through the tissue in front [18]. After termination of movement, the forces on the microelectrode relax in a time-dependent, viscoelastic manner. The force-displacement curves up to the 1 mm point could be treated as a small, stepped strain experiment and could be characterized using conventional viscoelastic models to characterize the shear stresses on the microelectrode [41, 42].
To estimate the effective stress on the microelectrode as a force per unit contact area, the contact area of the microelectrode in brain tissue was calculated for the tapered geometry based on Fig. 1C. For the first millimeter, the surface area at any given point was calculated for a conical frustum:
| (1) |
where A is the surface area, rl is the contact radius, r is the tip radius. S is the slant height defined as
| (2) |
where hl is defined as the height of the conical frustum at a given contact radius (rl). The tip radius was 10 μm. The contact radius (rl) can be calculated using the trigonometric relationship between penetration depth and the tip taper angle (θ = 5°). The microelectrode has a cylindrical geometry 1 mm away from the tip, and the additional contact surface area contribution from the cylindrical portion was
| (3) |
where rc is the contact radius of the cylinder (100 μm), and hc is the height of the cylinder at the contact point. Since the loading rate was constant, the change in effective surface area could be calculated for each point in the force-displacement curve based on the sampling frequency of the load cell. To further calculate the effective stress on the microelectrode, the measured force was divided by the area calculated at the corresponding time point.
Estimating Elastic Moduli
Using the indentation portion of force-displacement curve (Fig. 2) and estimated strain over the first 200 μm from a Hertzian indentation model for conical probes, elastic moduli of the interface under chronic implantation conditions was calculated using a 2-parameter Mooney-Rivlin (MR) hyperelastic model. The MR model is a widely used to describe incompressible rubbers and brain tissue. The 2-parameter MR model can be described using a strain energy equation:
| (4) |
where Cij are the material parameters, i = 1 to N are incremental integers representing material constants, I1 and I2 are strain invariants, Jel is the elastic volume strain, and Di is a compressibility coefficient. Incompressibility is assumed for brain tissue, allowing for the second term in the right hand side of eqn. 4 to be zero. Stress-strain curves were generated to fit the MR model in ABAQUS 6.11 using the built-in least squares regression model fitting material evaluation feature. The elastic modulus of brain tissue in the interface under chronic conditions was calculated from the C10 and C01 parameters [16], using the following equation:
| (5) |
Analysis of Viscoelastic Parameters and Estimating Shear Moduli
A viscoelastic model was used to model the time-dependent relaxation of the measured forces beyond the maximum stress zone. Effective stresses were calculated using the terminal depth achieved by the microelectrode. The relaxation stress curves were smoothed to remove effects of tissue micromotion. Due to small strains involved in the relaxation phase, a viscoelastic model described by a relaxation modulus with a 2nd order Prony series expansion was found to be the best fit (R2 >0.90):
| (6) |
where G(t) is the relaxation modulus as a function of time, Gl is the long term shear modulus calculated 500 sec after termination of microelectrode movement, and τk is the characteristic time constant for the tissue. This model with a Maxwell type element was also extensively described by Gefen et al [27, 41]. To remain consistent with observations in prior studies, effective stresses observed for the first 90 secs after termination of microelectrode movement were fitted using the above model in this study.
Analysis of stresses due to brain micromotion
To characterize the amplitude of forces due to tissue micromotion correlated with breathing and vascular pulsatility, the average peak-to-peak force amplitudes was determined over a 20 sec interval during the steady-state zone of the relaxation phase. To determine the forces exclusively due to vascular pulsatility, peak forces whose periodicity correlated with the monitored heart rate and registered between two successive peak forces correlated to breathing were considered to be due to tissue micromotion as a result of vascular pulsatility. The corresponding stresses on the microelectrode due to tissue micromotion was correlated to the average steady-state stresses determined over a one-second interval 500 sec after termination of microelectrode movement as shown in Fig. 9b on the day of implantation.
Figure 9.
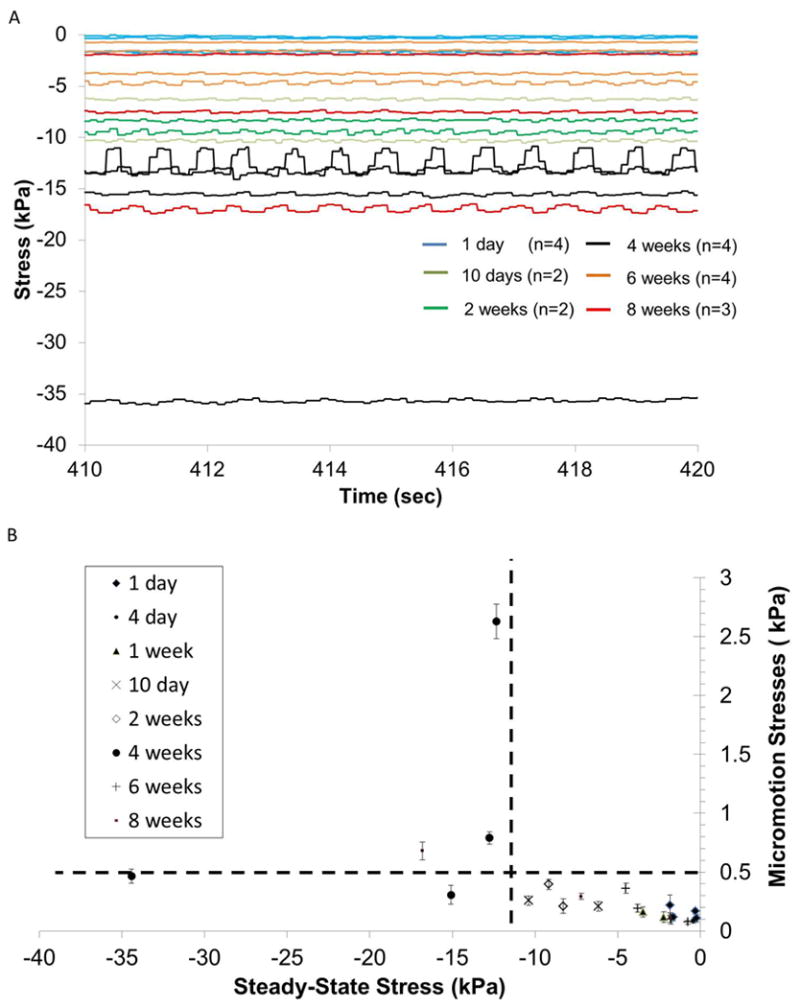
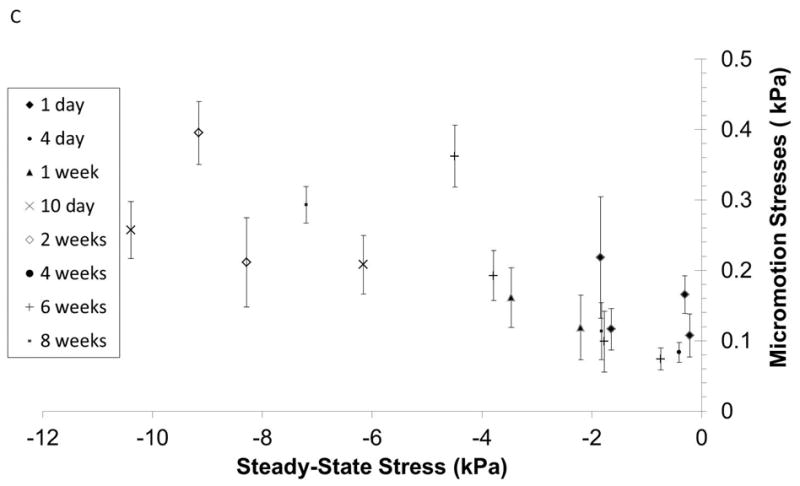
(A) Steady-state forces on the microelectrode due to tissue micromotion after different durations of implantation in the brain. (B) Effective stresses on the microelectrode due to tissue micromotion corresponding to breathing are plotted against steady-state stresses after different durations of implantation time if data from 4 week implant duration (and one 8-week implant duration) are excluded. (C) A close-up of the effective stresses bounded by the dotted lines in (B) are shown.
3. Results
3.1 Dynamics of effective stresses on the microelectrode
In n=4 animals, forces were measured as the microelectrode was moved a further distance of 1 mm at a rate of 10 μm into the brain 4 hrs after an initial implantation at 1 mm depth. The effective stresses on the electrode derived from the force-displacement curves are shown in Fig. 3. The corresponding effective stresses monotonically increased over the first 200-300 μm, before reaching a plateau stress value suggesting perhaps puncture and penetration into the tissue. The terminal effective stress ranged 0.5 kPa to 2.5 kPa at 2 mm depth. Small fluctuations in effective stresses persisted during the microelectrode movement suggesting some level of tissue heterogeneity within the somatosensory cortex. The effect of tissue micromotion registered as high frequency fluctuations in effective stresses on the microelectrode is also evident.
Figure 3.
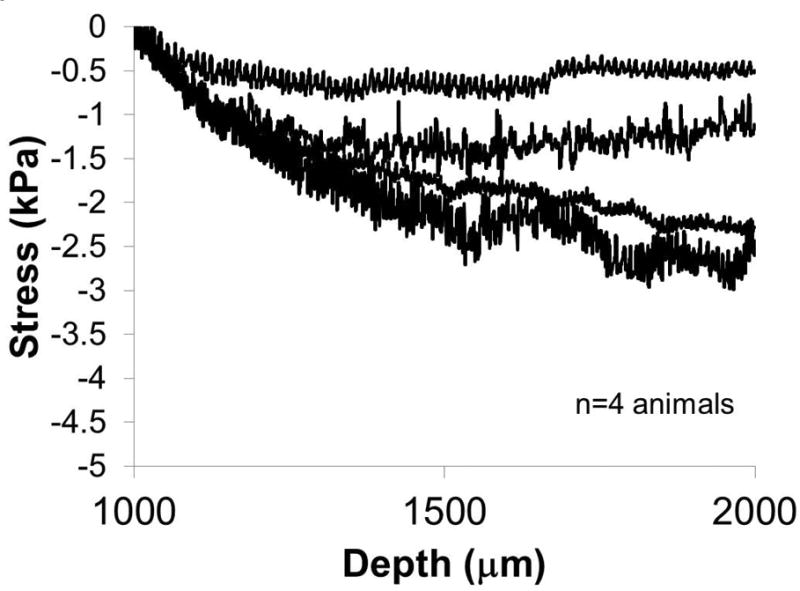
Effective stresses exerted on the microelectrode as it is moved from a depth of 1 mm to 2 mm at 10 μm/sec. The measurements were made 4 hours post-implantation at 1 mm depth. (n=4 animals).
The force-displacement curves when the microelectrode was moved after different durations of implantation are shown in Fig. 4a & b. The corresponding effective stresses on the microelectrode are shown in Figs. 4c & d. Effective stresses on the microelectrode monotonically increased during the first 4 weeks of implantation. Microelectrodes implanted for 10 days - 2 weeks (n=4) experienced increased stresses ranging from 5 - 15 kPa at a depth of 500 μm as shown in Fig. 4c, possibly reflecting the initiation of scar tissue formation at the interface. At the end of 4 weeks, the stresses at a depth of 500 μm increased to ∼15-30 kPa (n=4) and was approximately 25 - 50 kPa at a depth of 2 mm. However, after 6 weeks (n=4) and 8 weeks (n=3) of implantation in 5 of 7 animals, effective stresses on the microelectrode at 2 mm depth decreased to those observed after 2 weeks of implantation. In one of the 4 animals with 6 weeks of implantation, effective stresses at a depth of 2 mm was comparable to effective stresses on day 1. In one of three animals with 8 weeks of implantation effective stresses at a depth of 2 mm was comparable to those observed after 4 weeks of implantation, suggesting an extended inflammation and scar tissue reaction. Closer inspection of the force-displacement curves obtained after 6-8 weeks of implantation in 6 of 7 animals (with exception of one 8-week animal) showed that the forces during the initial 200-300 μm of microelectrode were higher than the corresponding forces observed during microelectrode movement after 2 and 4 weeks of implantation. However, as the microelectrode moved beyond 200-300 μm after being implanted for more than 6 weeks in 6 of 7 animals, a significant decrease in effective stresses on the microelectrode is observed in 5 out of 7 animals. In one of the animals (with implantation time over 6 weeks), a low constant effective stress was observed over the first 800 μm of microlectrode movement, after which the effective stresses abruptly decreased to approximately zero. Finally, in one of the animals with 8 weeks of implantation time, a steadily increasing stress was observed similar to the corresponding forces in 2 of the 4-week animals. Control force measurements (1 mm away from the implant site using a secondary microelectrode) in 3 different animals with microelectrode implanted for 4 weeks, 6 weeks and 8 weeks respectively showed forces of 1-2 mN at 1 mm depth similar to those from animals on the day of implantation confirming the mechanical integrity of the brain tissue in the craniotomy. An example of forces reflecting the integrity of the implantation site and the brain tissue surrounding the implantation is shown in Fig. 5 with the original force-displacement curve after 8 weeks of implantation superimposed with two additional trends at 0.75 - 1 mm away on either side of the implantation site (Fig. 5). The forces experienced by the microelectrode in the immediate vicinity of the implantation site was comparable to the corresponding forces on the day of implantation suggesting mechanical integrity of the brain tissue.
Figure 4.
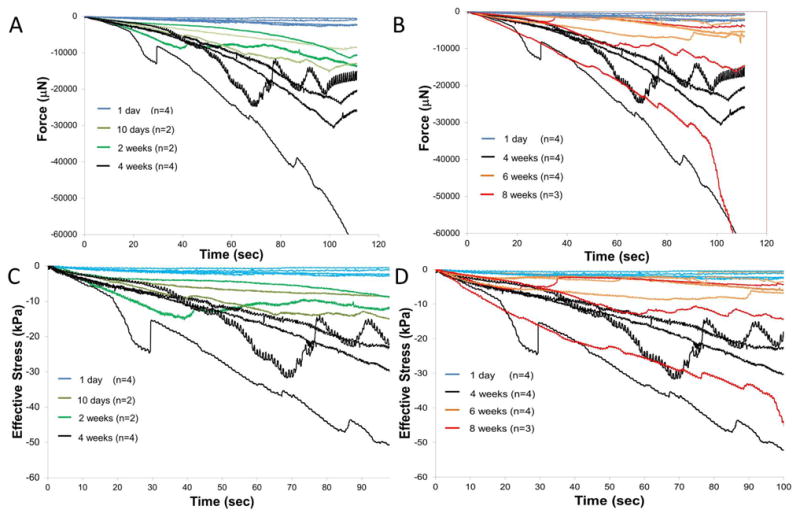
Force-displacement curves measured as the microelectrode was moved from a depth of 1 mm to 2 mm after different durations of implantation in the brain tissue. Microelectrodes were implanted at 1 mm depth for 4 hours on day 1 (n=4), 10 days (n=2), 2 weeks (n=2), 4 weeks (n=4), 6 weeks (n=4) and 8 weeks (n=3). Force-displacement curves are shown in (A) from 1 day to 4 weeks and (B) 1 day, 4 weeks, 6 weeks, and 8 weeks. (C) and (D) show corresponding effective stresses on the microelectrodes after implantation for durations ranging from (A) 1 day to 4 weeks and (B) 1 day, 4 weeks, 6 - 8 weeks. Highest stresses were observed for microelectrodes that were moved after 4 weeks of implantation.
Figure 5.
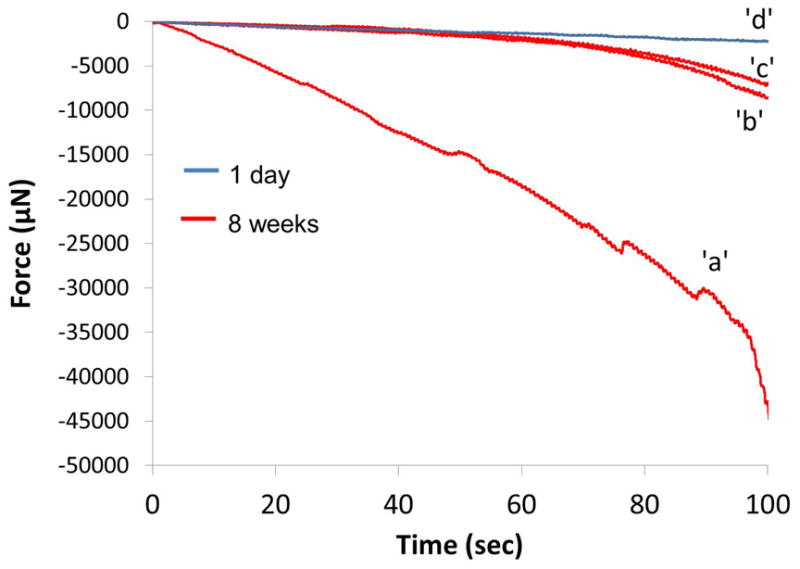
A representative example of preservation of the brain tissue integrity surrounding the implant site. A force curve (1 to 2 mm), ‘a’, derived from an 8-week animal (same as the one in Fig. 5 with the highest forces) is superimposed with two additional force curves—‘b’ and ‘c’---derived from 0.75 and 1 mm away from the implant site within the same craniotomy. Forces away from the wound site were similar to the representative force data displayed for day 1 acute animals,‘d’.
3.2 Maximum and steady-state stresses at the interfacial brain tissue
The exponential decrease in effective stresses on the microelectrode during relaxation of the brain tissue after termination of microelectrode movement at a depth of 2 mm is shown in Fig. 6 for different durations of implantation time. Minor, short-term changes in stress on the microelectrode and other variations were observed among the stress relaxation curves possibly due tissue micromotion effects (periodic) and heterogeneity in sheared brain tissue itself (non-periodic). However, majority of the curves followed an exponential relaxation pattern, characteristic of viscoelastic materials at least for the first 90 seconds. At 2 mm depth, the final effective stress values at steady-state are around -1.0 ± 0.86 kPa for day 1 (n=4), which is consistent with reported elastic modulus values for CSF [43]. It should be noted that the steady-state stresses at 1 mm (n=31, see methods) were -0.98 ± 1.0 kPa, which is similar to 2 mm depth in cortex.
Figure 6.
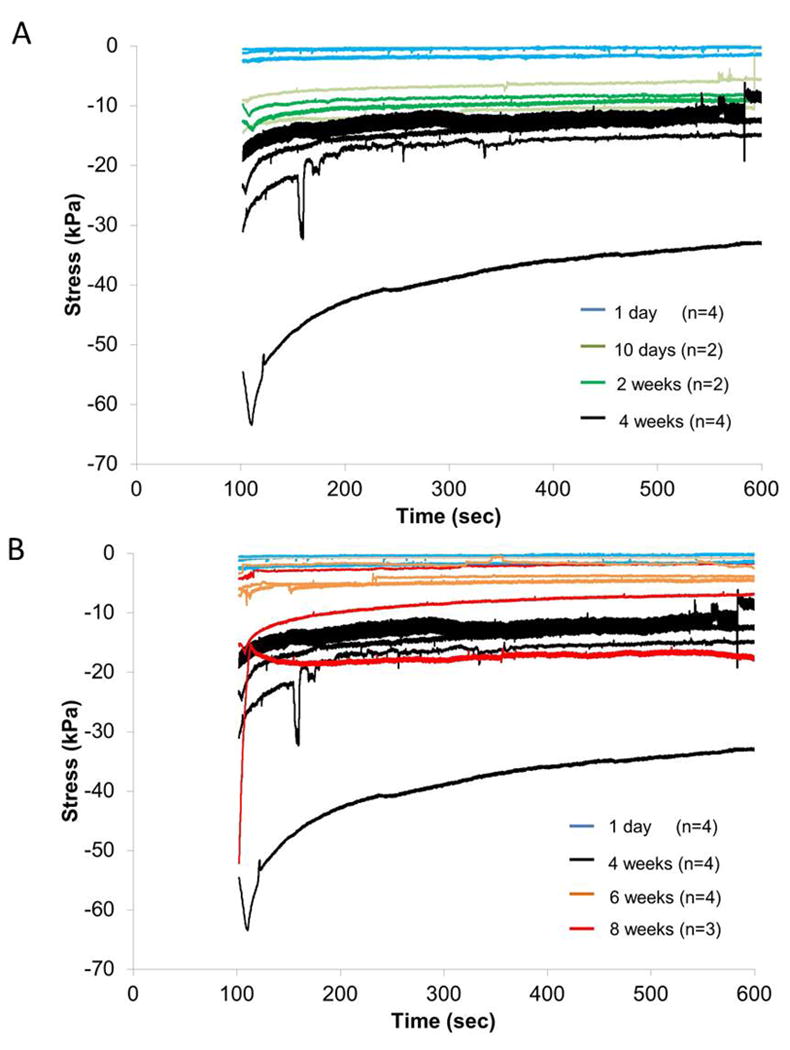
Effective stresses on the implanted microelectrode during relaxation of brain tissue subsequent to the termination of microelectrode movement at 2 mm depth after different durations of implantation in (A) (1 day - 4 weeks) and (B) (1 day, 4 weeks, 6-8 weeks).
The maximum and steady-state stresses for implantation durations of 1 day (n=4), 10 days-2 weeks (n=4), 4 weeks (n=4), 6-8 weeks (n=7) were plotted as a Tukey boxplot in Fig. 7. The median values of maximum stress for each group with 1st and 3rd quartile (Q1 & Q3 respectively) were: day 1 (median=-1.7 kPa, Q1=-2.4 kPa, Q3=-0.83 kPa), day 10 – 2 weeks (median=-10.9 kPa, Q1=-13.4 kPa, Q3=-9.2 kPa), 4 weeks (median=-26.9 kPa, Q1=-41.8 kPa, Q3=-20.7 kPa), 6 – 8 weeks with 1 outlier (red dot) (median=-5.8 kPa, Q1=-14.8 kPa, Q3=-3.3 kPa). The corresponding median values of steady-state stresses for each group with 1st and 3rd quartile (Q1 & Q3 respectively) were: day 1 (median=-0.97 kPa, Q1=-1.7 kPa, Q3=-2.6 kPa), day 10 – 2 weeks (median=-8.7 kPa, Q1=-9.8 kPa, Q3=-7.2 kPa), 4 weeks (median=-13.9 kPa, Q1=--24.8 kPa, Q3=-12.5 kPa), 6 – 8 weeks with 1 outlier (red dot) (median=-3.8 kPa, Q1=-7.2 kPa, Q3=-1.8 kPa).
Figure 7.
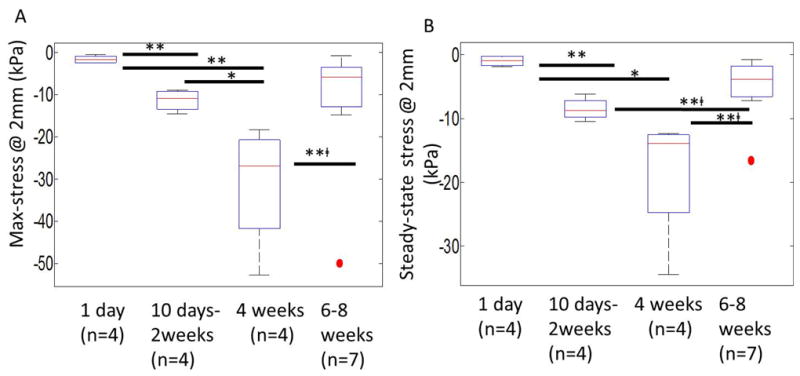
Maximum (A) and steady-state (B) stresses exerted on the implanted microelectrode after different durations of implantation (1 day (n=4), 10 days-2 weeks (n=4), 4 weeks (n=4), 6-8 weeks (n=7)). Maximum stresses were effective stresses on the microelectrode immediately after the termination of microelectrode movement. Steady-state stresses corresponded to effective stress values 500 sec after termination of microelectrode movement during the relaxation of brain tissue. The median values of maximum stress for each group with 1st and 3rd quartile (Q1 & Q3 respectively) were: day 1 (median=-1.7 kPa, Q1=-2.4 kPa, Q3=-0.83 kPa), day 10 – 2 weeks (median=-10.9 kPa, Q1=-13.4 kPa, Q3=-9.2 kPa), 4 weeks (median=-26.9 kPa, Q1=-41.8 kPa, Q3=-20.7 kPa), 6-8 weeks with 1 outlier (red dot) (median=-5.8 kPa, Q1=-14.8 kPa, Q3=-3.3 kPa). The median values of steady-state stress for each group with 1st and 3rd quartile (Q1 & Q3 respectively) were: day1 (median=-0.97 kPa, Q1=-1.7 kPa, Q3=-2.6 kPa), day 10-2 weeks (median=-8.7 kPa, Q1=-9.8 kPa, Q3=-7.2 kPa), 4 weeks (median=-13.9 kPa, Q1=--24.8 kPa, Q3=-12.5 kPa), 6-8 weeks with 1 outlier (red dot) (median=-3.8 kPa, Q1=-7.2 kPa, Q3=-1.8 kPa). Statistical significance between groups was assessed using student's t-test. * represents p<0.05, ** represents p<0.01, and **□ represents p<0.01 where t-test was conducted without the outlier.
There is a monotonic increase in the maximum effective stress and steady-state effective stresses with increasing durations of implantation time up to 4 weeks. After 6-8 weeks of implantation, the maximum (-5.8 kPa, median value) and steady-state (-3.8 kPa, median value) effective stresses were comparable to corresponding values measured on day 1. Assessment for statistical significance using student's t-test showed no significant difference between stresses on day 1 and those after 6-8 weeks of implantation, even with removal of the outlier. Statistically significant differences were observed between maximum stress values after day 1 and day 10 - 2 weeks (p < 0.01), day 1 and 4 weeks (p < 0.01), day 10 - 2 weeks and 4 weeks (p < 0.05), and 4 weeks and 6-8 weeks (after removal of the outlier, p<0.01) of implantation times. Similarly, statistically significant differences were also observed between steady-state stresses after day 1 and day 10 - 2 weeks (p<0.01), day 1 and 4 weeks (p<0.05), day 10 – 2 weeks and 6-8 weeks (p<0.01), and 4 weeks and 6-8 weeks (after removal of the outlier, p<0.01) of implantation times. Wider variation in maximum and steady-state stress values were observed after 4 weeks of implantation compared to other time-points, suggesting animal to animal variability in the levels of inflammation and scar tissue formation after 4 weeks of implantation. As a check, comparison of the ratios of steady-state stress to maximum stress after different durations of implantation suggests that similar levels of strains/deformation were induced in all the chronic animals under the movement protocol used in this study (data not shown). The increase in the maximum effective stress is indicative of the increase in interfacial mass density in the brain tissue close to the microelectrode [44].
3.3 Forces and stresses due to tissue micromotion
Close inspection of the force-displacement curves on the day of implantation revealed periodic fluctuations on the forces exerted on the microelectrode by the brain tissue as shown in Fig. 8 (from n=2 animals). The larger amplitude periodic fluctuations in forces correlated with the observed breathing rates while the smaller amplitude fluctuations at ∼5-6 Hz correlated with the observed heart rates at the time of recording. Peak-to-peak amplitudes in forces correlated to breathing were 80 - 130 μN. Peak-to-peak amplitudes in forces correlated to vascular pulsatility were 14 - 25 μN. In addition, effective peak-to-peak stresses due to tissue micromotion related to breathing were directly correlated (R2=0.77) to the average steady-state stresses on the day of implantation (n=8 animals) as shown in Fig. 8b. In the same figure, steady-state stresses varied between 0.5 to 3.0 kPa at 1 mm depth into the brain tissue and micromotion- induced effective stress on the microelectrode varied from 0.2 to 0.4 kPa.
Figure 8.
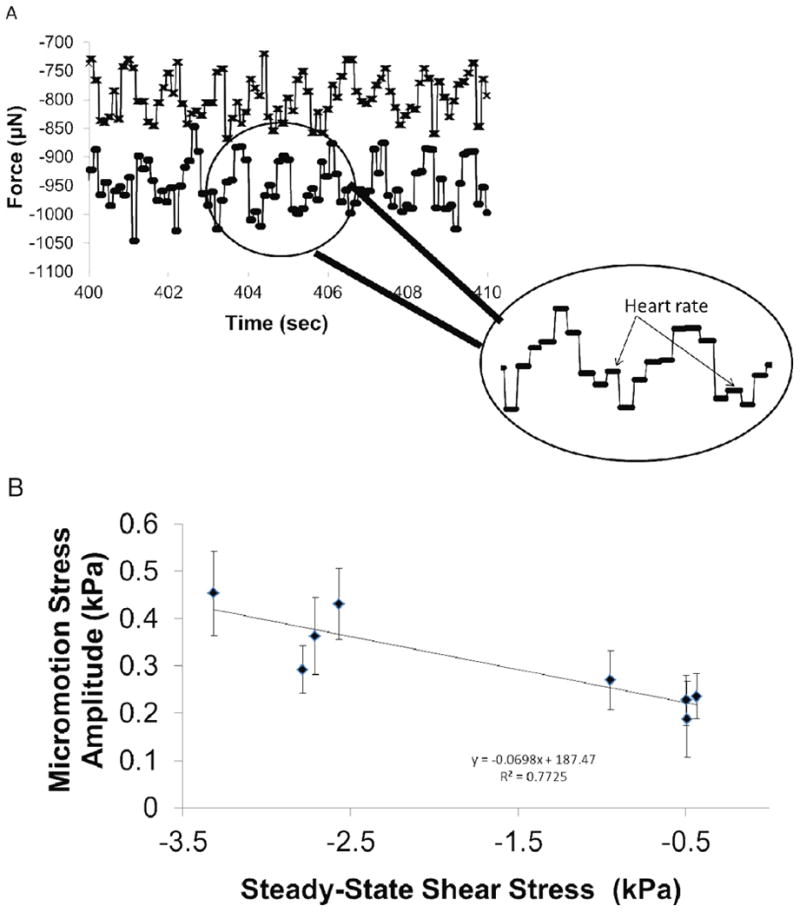
Micromotion induced forces on the microelectrode embedded at 1 mm depth. (A) Forces exerted on the microelectrode are shown from (n=2) representative animals. Large, periodic forces with amplitudes 80-130 μN correspond to breathing rate. Periodic, smaller peaks in forces (arrows in the inset) with amplitudes 14-25 μN correspond to heart rate. (B) Effective stress on the microelectrode due to tissue micromotion corresponding to breathing is correlated to the steady-state stress on the microelectrode on the day of implantation (n=8 animals).
Tissue micromotion induced forces are also observed under chronic implantation conditions. The steady-state forces exerted on the microelectrode at 2 mm penetration depth into the cortex after varying durations of implantation are shown in Fig. 9a. The amplitude of micromotion induced effective stresses was plotted with steady-state stresses as shown in Fig. 9b & c. The steady-state stresses vary from 0.5 kPa on the day of implantation to 35 kPa, 4 weeks after implantation. Corresponding micromotion induced effective stress amplitudes range 0.1 – 2.6 kPa with peak values observed 4 weeks after implantation. Beyond 6 weeks of implantation, the steady-state effective stresses on the microelectrode in 6 of 7 animals decreased to a range of 0.74 to 7.2 kPa. The corresponding tissue micromotion induced effective stresses (0.07 - 0.29 kPa) were also similar to values observed on the day of implantation (0.08-0.21 kPa). Therefore, the average tissue micromotion induced stresses on the microelectrode constituted 12-55% of the steady-state stresses on the microelectrode on the day of implantation (n=4), 2-21% of the steady-state stresses after 4 weeks of implantation (n=4), and 4 - 10% of the steady-state stresses after 6-8 weeks of implantation (n=7).
3.4 Viscoelastic Parameters of Interfacial Brain Tissue Under Chronic Conditions
The relaxation of forces in the force-displacement curves shown in Fig. 6 was modeled using an exponential viscoelastic model described in equation 6. This model has been well characterized by Gefen et al. for adult rats under acute conditions [41]. The aim here was to extend this model to estimate the long-term changes in the constitutive properties of the brain tissue at the interface. The values of G1, G2, and corresponding relaxation time constants after different durations of implantation time are shown in Fig. 10. The values of the above constants on the day of implantation (at 2 mm depth) and those determined during relaxation after the initial penetration to 1 mm depth are consistent with prior reports [41]. Over 4 weeks of implantation time, G1 and G2 increased monotonically reaching a maximum of 19.6 kPa (G1) and 6.7 kPa (G2). With the exception of one 8-week animal (with a G2 of 44 kPa), G1 and G2 values decreased beyond 4 weeks of implantation time and were similar to those after 2 weeks of implantation suggesting that as the microelectrode travels from a depth of 1 mm to 2 mm, it interacts with softer brain tissue after 6 weeks of implantation. Short-term time constants (τ1) were less than 25 sec for the majority of animals (14/19). Long-term relaxation time constants (τ2) < 300 sec in 11/19 animals.
Figure 10.
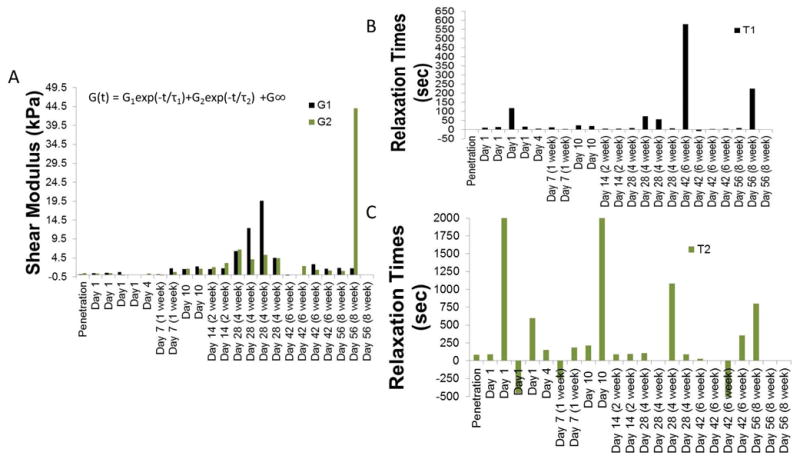
Results of fitting a viscoelastic model to the first 90 sec of stress-relaxation curves shown in Fig. 6. (A) G1 and G2 values (B) short-term relaxation time-constant and (C) long-term relaxation time constants after different durations of implantation.
The instantaneous shear modulus (G(0)) calculated using the 2nd order viscoelastic model at t=0 for 1 day (n=4), 10 days-2 weeks (n=4), 4 weeks (n=4), 6-8 weeks (n=7) is shown in Fig. 11. Values on the day of implantation (1.2 kPa) were similar to those reported by Gefen et al. [27]. The median values of G(0) for each group with 1st and 3rd quartile (Q1 & Q3 respectively) were: day 1 (median=1.8 kPa, Q1=0.90 kPa, Q3=2.5 kPa), day 10-2 weeks (median=12.9 kPa, Q1=10.6 kPa, Q3=14.1 kPa), 4 weeks (median=28.7 kPa, Q1=23.5 kPa, Q3=45.5 kPa), 6-8 weeks with 1 outlier (red dot) (median=7.2 kPa, Q1=4.2 kPa, Q3=7.9 kPa). As the chronic implantation time increased, the instantaneous shear modulus increased to a maximum of 59.3 kPa (after 4 weeks of implantation) before decreasing to < 7.9 kPa after 6 weeks of implantation in 6 of 7 animals. One 8-week animal was an outlier with a G(0) of 62.6 kPa. Statistically significant difference was observed for shear modulus values between day 1 and day 10-2 weeks (p<0.01), day 1 and 4 weeks (p <0.01), day 10-2 weeks and 4 weeks (p<0.05), day 10-2 weeks and 6-8 weeks (p<0.01, without outlier) and 4 weeks and 6 weeks (with removal of the outlier) (p<0.01). G(0) values on day 1 and 6-8 weeks (without the outlier) were not significantly different. Therefore, chronic implantation leads to a short-term increase in stiffness of brain tissue, before reverting back to more compliant, softer conditions beyond 6 weeks.
Figure 11.
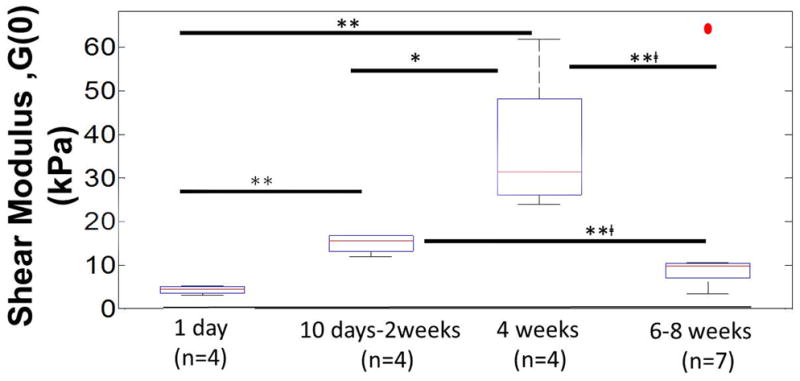
Calculated instantaneous shear moduli (G(0)) of interfacial brain tissue using viscoelastic model after different durations of implantation (1 day (n=4), 10 days-2 weeks (n=4), 4 weeks (n=4), 6-8 weeks (n=7)). G(0) represents the instantaneous shear modulus estimated from the model in Fig. 10 at t=0, where G(0)=G1(0)+G2(0)+G∞. The median values of instantaneous shear moduli in each group with 1st and 3rd quartile (Q1 & Q3 respectively) were: day1 (median=1.8 kPa, Q1=0.9 kPa, Q3=2.5 kPa), day 10-2 weeks (median=12.9 kPa, Q1=10.6 kPa, Q3=14.1 kPa), 4 weeks (median=28.7 kPa, Q1=23.5 kPa, Q3=45.5 kPa), 6-8 weeks with 1 outlier (red dot) (median=7.2 kPa, Q1=4.2 kPa, Q3=7.9 kPa). Statistical significance between groups was assessed using student's t-test. * represents p<0.05, ** represents p<0.01, and **□ represents p<0.01 where t-test was conducted without the outlier.
The MR model was used for the brain tissue and the corresponding values for Ci0 parameters are shown in Table 1. The estimated elastic moduli of the brain tissue in the interface after different durations of implantation time are shown in Fig. 12. The elastic modulus on the day of implantation (4.1-7.8 kPa) is similar to prior published values [18, 22]. After 4 weeks of implantation time, the elastic modulus of the surrounding tissue reaches a peak value of 44.9 kPa. Beyond 6 weeks of implantation, elastic modulus of the brain tissue exhibited a range of 6.8- 33.3 kPa with an outlier (one 8 week animal) at 62.5 kPa. Statistically significant differences were observed between elastic moduli estimated after 1 day and 10 days-2 weeks (p<0.01) of implantation, 1 day and 4 weeks (p<0.01) of implantation, and 1 day and 6-8 weeks (p<0.05, without outlier) of implantation. Comparison of elastic moduli between any of the other groups (i.e 10 days-2 weeks and 4 weeks, and 4 weeks and 6-8 weeks) did not yield any statistically significant difference.
Table 1. Summary of Ci0 (C10= C01) hyperelastic parameters for Mooney-Rivlin model.
| Days Implanted | C10=C01(pa) |
|---|---|
| Day 1 | 652.1 |
| Day 1 | 613.3 |
| Day 1 | 629.5 |
| Day 1 | 339.5 |
| Day 10 | 2033 |
| Day 10 | 2062 |
| Day 14 (Week 2) | 1757 |
| Day 14 (Week 2) | 3297 |
| Day 28 (Week4) | 3038 |
| Day 28 (Week4) | 2832 |
| Day 28 (Week4) | 3738 |
| Day 28 (Week 4) | 2033 |
| Day 42 (Week 6) | 566.8 |
| Day 42 (Week 6) | 1633 |
| Day 42 (Week 6) | 1478 |
| Day 42 (Week 6) | 2776 |
| Day 56 (Week 8) | 2598 |
| Day 56 (Week 8) | 5205 |
| Day 56 (Week 8) | 1459 |
Figure 12.
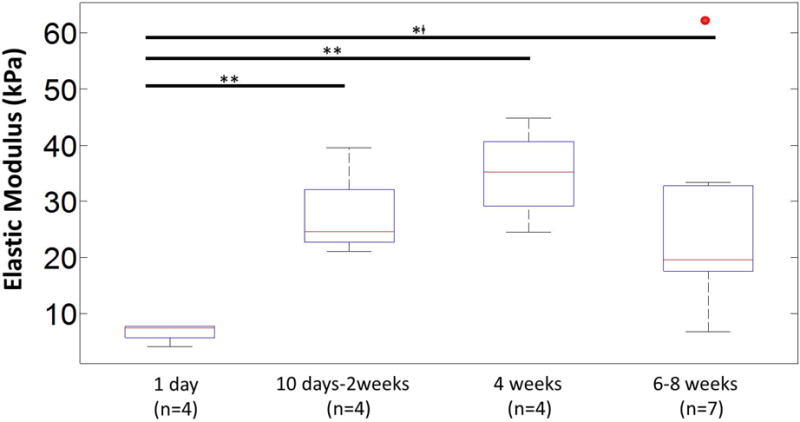
Estimated elastic moduli for interfacial brain tissue after different durations of implantation (1 day (n=4), 10 days-2 weeks (n=4), 4 weeks (n=4), 6-8 weeks (n=7)). The elastic moduli were estimated from C10 values in the Mooney-Rivlin (MR) hyperelastic model. The median values of elastic moduli in each group with 1st and 3rd quartile (Q1 & Q3 respectively) were: day 1 (median=7.5 kPa, Q1=5.7 kPa, Q3=7.7 kPa), day 10-2 weeks (median=24.6 kPa, Q1=22.7 kPa, Q3=32.2 kPa), 4 weeks (median=35.2 kPa, Q1=29.2 kPa, Q3=40.7 kPa), 6-8 weeks with 1 outlier (red dot) (median=19.6 kPa, Q1=17.5 kPa, Q3=33.2 kPa). Statistical significance between groups was assessed using student's t-test. * represents p<0.05, ** represents p<0.01, and **□ represents p<0.01 where t-test was conducted without the outlier.
4. Discussion
Axial forces on the microelectrode moving through the brain reflect the material and mechanical properties of the brain tissue at the interface. The estimated biomechanical interface comprises of ∼300-500 μm radius surrounding the microelectrode, based on finite element models [42, 45] and Hertzian indentation theory of the ratio of the contact radius to indentation depth [46]. The dimensions of the biomechanical interface are marginally larger than the interface as defined by cellular and molecular changes (approximately 200-250 μm radius) in the vicinity of the microelectrode [2]. We have quantified the dynamic changes in the material properties of the brain-electrode interface over 8 weeks of chronic implantation of the microelectrode. As cortical implantation time increased, the effective maximum stresses on the microelectrode at 2 mm depth monotonically increased over the first 4 weeks of implantation from 1-2 kPa to 52.8 kPa indicating a progressively increasing stiffness in the brain tissue in the microelectrode-tissue interface likely as a result of ongoing repair and inflammatory responses in the brain tissue.
Estimated instantaneous shear moduli increased monotonically (to 25 – 59.3 kPa) over the first 4 weeks of implantation time but subsequently decreased significantly (to 0.8 - 7.9 kPa) after 6-8 weeks of implantation time in 6 of 7 animals, suggesting replacement or compaction of the stiffer tissue in the interface (Fig. 11). In one 8 week animal the calculated shear modulus was exceptionally high (62.6 kPa), suggesting an unusually prolonged, inflammatory response yielding material values similar to the maximum observed at 4 weeks (59.3 kPa). Surgical notes did not indicate any exceptional differences during the implantation procedures compared to other chronically implanted animals. The brain-electrode interface was noted to be well maintained and force curves registered ∼1mm away from the implant site showed normal brain tissue similar to acute experiments with no signs of tissue dehydration (Fig. 5) in that animal. The instantaneous shear moduli (0.5-2.6 kPa) on the day of implantation were consistent with those reported earlier for material parameters in adult rats [27]. Age itself is not expected to be a significant factor in the observed increase in stiffness in adult rats since the changes in stiffness reported here are 1-2 orders of magnitude above changes in stiffness observed due to age.
The above data on elastic moduli coupled with the trends in shear moduli of the brain tissue after 4 weeks of implantation time suggests that the brain tissue surrounding the microelectrode after 4 weeks of implantation time evolves from a stiff matrix with maximal shear and elastic moduli into a composite of two different layers with different mechanical properties – a stiff compact inner layer surrounded by softer brain tissue that is biomechanically similar to brain tissue during the first week of implantation. The difference between the calculated shear and elastic moduli could be reflective of this phenomenon. In addition, inspection of stress-displacement curves corresponding to 6 & 8 weeks after implantation (Fig. 4d) suggests that over the first 200-300 μm of displacement, the stiffness of the brain tissue is similar to those observed after 4 weeks of implantation (with similar slopes), but for displacements beyond that the stiffness is similar to those observed over 1 week of implantation (Fig. 4).
A dominant hypothesis is that the mechanical mismatch between the microelectrode and the brain results in the eventual failure of the microelectrode. Our results indicate a progressive stiffening of the interface around the microelectrode over a 4-week period immediately after implantation that could be partly due to such mechanical mismatch. Interestingly, some studies suggest electrical recordings from neural interfaces also experience deterioration in performance over a similar time frame. Signal-to-noise ratio (SNR) decreased after ∼3 weeks of implantation in several long-term studies [4]. Electrical impedance measurements also reportedly increased after ∼ 2-3 weeks in several studies [47-49]. Williams et al observed that the fraction of active microelectrodes in multi-electrode wire arrays decreased around 3-4 weeks [50]. The determination of dynamic changes in material properties of the brain tissue that vary over an order of magnitude should aid design of future neural implants. For instance, microelectrode designs that can dynamically adapt to the changing material properties of the interface can potentially enhance the reliability of the neural interface.
Histological and immunohistochemical markers have been used to catalog changes in tissue composition during the first 4 weeks of implantation [1, 2]. During this time, the tissue response to a chronically implanted microelectrode typically leads to the formation of a scar tissue dominated by reactive astrocytes and activated microglia that surround and isolate the microelectrode from the brain. The stiffening of interfacial tissue observed in this study begins between 2-4 weeks after implantation. A recent in vitro study demonstrated that density of fibroblasts (NIH3T3) increases with substrate stiffness and saturates at stiffness of ∼20 kPa similar to peak stiffness values found this study [51]. Astrocytes are also known to exhibit substrate stiffness dependent response, where increased stiffness led to astrocytic proliferation [52]. Dynamic cellular reorganization during this early phase of the glial scar formation in vivo suggests a significant mechanical role by meningeal fibroblasts in laying down an appropriate ECM for repair [2]. In spinal cord stab injury study, meningeal fibroblasts were found to invade the wound site and play a key role in the repair process [53]. The interaction between fibroblasts and astrocytes are known to determine the type and level of scarring and whether axonal regeneration is possible. McConnell et al showed that microelectrode extraction forces from histologically fixed brains increased after 28 days of implantation compared to the forces after 7 days of implantation. Furthermore, the microelectrode extraction forces correlated to increased GFAP expression [40] in the astrocytes. In a different study, it was reported that an individual astrocyte can exert upto ∼591 Pa on an AFM tip compared to 75 Pa for a neuron [54]. Therefore, the dynamic changes in material properties observed in this study is likely due to the synergistic interactions of astrocytes and fibroblasts during the formation of the glial scar. Interestingly, the compaction of glial scar typically observed at 6-12 weeks in prior studies corroborate with the marked decrease in overall shear modulus and the composite behavior of force-displacement curves after 6 and 8 weeks of implantation observed in this study.
Increased stiffness of the tissue substrate has been shown to promote neural migration and change in neurite behavior [55], and neuronal degeneration [56]. Earlier, we had reported brain tissue micromotion of ∼30 μm due to breathing in anesthetized rodents. In this study, the effective stresses due to micromotion (due to a combination of breathing and vascular pulsatility) is measured and tracked as a function of implantation time and shown to vary with relative stiffness of the brain tissue surrounding the microelectrode. At the molecular level, persistent micromotion due to the periodic vascular pulsatility and respiration has been shown to lead to increased inflammation and apoptosis in neuronal cells [57]. Therefore, development of mechanically compliant substrates and coatings that also have the ability to absorb micromotion-induced stresses may mitigate the severity of scarring around the microelectrode. Some reports on the improvement in performance of floating and flexible microelectrodes may be due to the compliance of such systems to the micromotion induced stresses [2]. This is a growing body of work that suggests mechanically compliant coatings may result in considerable reduction of scarring [58-60]. Alternative strategies might be softening or loosening of the matrix around the tip for long-term signal fidelity. The generation of an appropriate ECM for promoting neuronal regrowth is one of the current strategies reported for improved performance [61, 62]. Bioactive strategies that prevent the initial increase in elastic modulus around 2 weeks may enable the formation of an appropriate ECM conducive to neuronal tissue that may prevent loss of neural signal. Understanding the biomechanical behavior at the brain-microelectrode interface is necessary for long-term success of implantable neuroprosthetics and microelectrode arrays. It should be noted the focus of this study was mainly in the cortical regions of the brain and the dynamics of material changes reported here may differ in other regions of the brain such as the white matter tract.
Acknowledgments
The authors want to thank NIH for supporting this research through Ruth-Kirchstein post-doctoral fellowship (NIH F32 NS073422-02) for AS, R01NS055312 and R01NS055312-S1.
References
- 1.Biran R, Martin DC, Tresco PA. The brain tissue response to implanted silicon microelectrode arrays is increased when the device is tethered to the skull. Journal of Biomedical Materials Research Part A. 2007 doi: 10.1002/jbm.a.31138. [DOI] [PubMed] [Google Scholar]
- 2.Polikov VS, Tresco PA, Reichert WM. Response of brain tissue to chronically implanted neural electrodes. Journal of Neuroscience Methods. 2005;148:1–18. doi: 10.1016/j.jneumeth.2005.08.015. [DOI] [PubMed] [Google Scholar]
- 3.Nicolelis MAL, et al. Chronic, multisite, multielectrode recordings in macaque monkeys. Proc Natl Acad Sci USA. 2003;100:11041–11046. doi: 10.1073/pnas.1934665100. [DOI] [PMC free article] [PubMed] [Google Scholar]
- 4.Jackson N, Sridharan A, Anand S, Baker M, Okandan M, Muthuswamy J. Long-term neural recordings using MEMS based movable microelectrodes in the brain. Front Neuroeng. 2010;3 doi: 10.3389/fneng.2010.00010. [DOI] [PMC free article] [PubMed] [Google Scholar]
- 5.Ward MP, Rajdev P, Ellison C, Irazoqui PP. Toward a comparison of microelectrodes for acute and chronic recordings. Brain Res. 2009;1282:183–200. doi: 10.1016/j.brainres.2009.05.052. [DOI] [PubMed] [Google Scholar]
- 6.Friere MAM, et al. Comprehensive Analysis of Tissue Preservation and Recording Quality from Chronic Multielectrode Implants. PLoS ONE. 2011;6:e27554. doi: 10.1371/journal.pone.0027554. 27510.21371/jounral.pone.0027554. [DOI] [PMC free article] [PubMed] [Google Scholar]
- 7.Prevost TP, Balkrishnan A, Suresh S, Socrate S. Biomechanics of brain tissue. Acta Biomaterialia. 2011;7:83–95. doi: 10.1016/j.actbio.2010.06.035. [DOI] [PubMed] [Google Scholar]
- 8.Prevost TP, Jin G, Moya MAd, Alam HB, Suresh S, Socrate S. Dynamic mechanical response of brain tissue in indentation in vivo, in situ, and in vitro. Acta Biomaterialia. 2011;7:4090–4101. doi: 10.1016/j.actbio.2011.06.032. [DOI] [PubMed] [Google Scholar]
- 9.Atay SM, Kroenke CD, Sabet A, Bayly PV. Measurement of the Dynamic Shear Modulus of Mouse Brain Tissue In Vivo by Magnetic Resonance Elastography. J Biomech Eng. 2008;130:021013. doi: 10.1115/1.2899575. [DOI] [PMC free article] [PubMed] [Google Scholar]
- 10.Cheng S, Clarke EC, Bilston LE. Rheological properties of the tissues of the central nervous system: A review. Medical Engineering & Physics. 2008;30:1318–1337. doi: 10.1016/j.medengphy.2008.06.003. [DOI] [PubMed] [Google Scholar]
- 11.Dommelan JAWv, Sande TPJvd, Hrapko M, Peters GWM. Mechanical properties of brain tissue by indentation: interregional variation. Journal of the Mechanical Behavior of Biomedical Materials. 2010;3:158–166. doi: 10.1016/j.jmbbm.2009.09.001. [DOI] [PubMed] [Google Scholar]
- 12.Howard MA, Abkes BA, Ollendieck MC, Noh MD, Ritter RC, Gillies GT. Measurement of the force required to move a neurosurgical probe through in vivo human brain tissue. IEEE Transactions on Biomedical Engineering. 1999;46:891–894. doi: 10.1109/10.771205. [DOI] [PubMed] [Google Scholar]
- 13.Miller K. Constitutive model of brain tissue suitable for finite element analysis of surgical procedures. J Biomechanics. 1999;32:531–537. doi: 10.1016/s0021-9290(99)00010-x. [DOI] [PubMed] [Google Scholar]
- 14.Miller K. Method of testing very soft biological tissues in compression. Journal of Biomechanics. 2005;38:153–158. doi: 10.1016/j.jbiomech.2004.03.004. [DOI] [PubMed] [Google Scholar]
- 15.Schiavone P, Chassat F, Boudou T, Promayon E, Valdivia F, Payan Y. In vivo measurement of human brain elasticity using a light aspiration device. Medical Image Analysis. 2009;13:673–678. doi: 10.1016/j.media.2009.04.001. [DOI] [PubMed] [Google Scholar]
- 16.Taylor Z, Miller K. Reassessment of brain elasticity for analysis of biomechanism of hydrocephalus. J Biomechanics. 2004;37:1263–1269. doi: 10.1016/j.jbiomech.2003.11.027. [DOI] [PubMed] [Google Scholar]
- 17.Walsh EK, Furniss WW, Schettini A. On measurement of brain elastic response in vivo. Am J Physiol. 1977;232:R27–R30. doi: 10.1152/ajpregu.1977.232.1.R27. [DOI] [PubMed] [Google Scholar]
- 18.Sharp AA, Ortega AM, Restrepo D, Curran-Everett D, Gall K. In Vivo Penetration Mechanics and Mechanical Properties of Mouse Brain Tissue at Micrometer Scales. IEEE Transactions on Biomedical Engineering. 2009;56:45–53. doi: 10.1109/TBME.2008.2003261. [DOI] [PMC free article] [PubMed] [Google Scholar]
- 19.Guillaume A, Osmont D, Gaffie D, Sarron JC, Quandieu P. Effects of Perfusion on the Mechanical Behavior of the Brain Exposed to Hypergravity. J Biomechanics. 1997;30:383–389. doi: 10.1016/s0021-9290(96)00153-4. [DOI] [PubMed] [Google Scholar]
- 20.Estes MS, McElhaney JH. Response of brain tissue of compressive loading. ASME Paper no: 70-BNF-13 1970 [Google Scholar]
- 21.Chatelin S. Fifty years of brain tissue mechanical testing: from in vitro to in vivo investigations. Biorheology. 2010;47:255–276. doi: 10.3233/BIR-2010-0576. [DOI] [PubMed] [Google Scholar]
- 22.Mendis KK, Stalnaker RL, Advani SH. A Consitutive Relationship for Large Deformation Finite Element Modeling of Brain Tissue. Journal of Biomechanical Engineering. 1970;117:279–285. doi: 10.1115/1.2794182. [DOI] [PubMed] [Google Scholar]
- 23.Miller K, Chinzei K. Constitutive Modelling of Brain Tissue: Experiment and Theory. J Biomechanics. 1997;30:1115–1121. doi: 10.1016/s0021-9290(97)00092-4. [DOI] [PubMed] [Google Scholar]
- 24.Bilston LE. Neural Tissue Biomechanics. In: Gefen A, editor. Studies in Mechanobiology, Tissue Engineering, and Biomaterials. Vol. 3. Springer-Verlag; New York: 2011. [Google Scholar]
- 25.Shafieian M, Darvish KK, Stone JR. Changes to the viscoelastic properties of brain tissue after traumatic axonal injury. J Biomechanics. 2009;42:2136–2142. doi: 10.1016/j.jbiomech.2009.05.041. [DOI] [PubMed] [Google Scholar]
- 26.Pervin F, Chen WW. Effect of inter-species, gender, and breeding on the mechanical behavior of brain tissue. NeuroImage. 2011;54:S98–S102. doi: 10.1016/j.neuroimage.2010.03.077. [DOI] [PubMed] [Google Scholar]
- 27.Gefen AGN, Zhu Q, Raghupathi R, Margulies SS. Age-dependent Changes in Material Properties of the Brain and Braincase of the Rat. Journal of Neurotrauma. 2003;20:1163–1177. doi: 10.1089/089771503770802853. [DOI] [PubMed] [Google Scholar]
- 28.Sack I, et al. The impact of aging and gender on brain viscoelasticity. NeuroImage. 2009;46:652–657. doi: 10.1016/j.neuroimage.2009.02.040. [DOI] [PubMed] [Google Scholar]
- 29.Shulyakov AV, Cenkowski SS, Buist RJ, Bigio MRd. Age-dependence of intracranial viscoelastic properties in living rats. Journal of the Mechanical Behavior of Biomedical Materials. 2011;4:484–497. doi: 10.1016/j.jmbbm.2010.12.012. [DOI] [PubMed] [Google Scholar]
- 30.Stretberger KJ, et al. In vivo viscoelastic properties of the brain in normal pressure hydrocephalus. NMR Biomed. 2010 doi: 10.1002/nbm.1602. [DOI] [PubMed] [Google Scholar]
- 31.Prange M, Margulies S. Regional, directional, and age-dependent properties of brain undergoing large deformation. J Biomech Eng. 2002;124:244–252. doi: 10.1115/1.1449907. [DOI] [PubMed] [Google Scholar]
- 32.Walsh EK, Schetinni A. Elastic behavior of brain tissue in vivo. Am J Physiol. 1976;230:1058–1062. doi: 10.1152/ajplegacy.1976.230.4.1058. [DOI] [PubMed] [Google Scholar]
- 33.Najafi K, Hetke JF. Strength Characterization of Silicon Microprobes in Neurophysiological Tissues. IEEE Transactions on Biomedical Engineering. 1990;37:474–481. doi: 10.1109/10.55638. [DOI] [PubMed] [Google Scholar]
- 34.Hosseini NH, Hoffmann R, Kisban S, Stieglitz T, Paul O, Ruther P. Comparative Study on the Insertion Behavior of Cerebral Microprobes. Proceedings of the 29th Annual International Conference of the IEEE EMBS : August 23-26,2007; Lyon, France. 2007. pp. 4711–4714. [DOI] [PubMed] [Google Scholar]
- 35.Welkenhuysen M, Andrei A, Ameye L, Eberel W, Nuttin B. Effect of Insertion Speed on Tissue Response and Insertion Mechanics of a Chronically Implanted Silicon-Based Neural Probe. IEEE Transactions on Biomedical Engineering. 2011;58:3250–3259. doi: 10.1109/TBME.2011.2166963. [DOI] [PubMed] [Google Scholar]
- 36.Paralikar KJ, Clement RS. Collagenase-Aided Intracortical Microelectrode Array Insertion: Effects on Insertion Force and Recording Performance. IEEE TRANS Biomed Eng. 2008;55:2258–2267. doi: 10.1109/TBME.2008.923150. [DOI] [PubMed] [Google Scholar]
- 37.Bjornsson CS, et al. Effects of insertion conditions on tissue strain and vascular damage during neuroprosthetic device insertion. J Neural Eng. 2006;3:196–207. doi: 10.1088/1741-2560/3/3/002. [DOI] [PubMed] [Google Scholar]
- 38.Jensen W, Yoshida K, Hofmann UG. In-vivo Implant Mechanics of Flexible, Silicon-Based ACREO Microelectrode Arrays in Rat Cerebral Cortex. IEEE Transactions on Biomedical Engineering. 2006;53:934–940. doi: 10.1109/TBME.2006.872824. [DOI] [PubMed] [Google Scholar]
- 39.Wittek A, et al. Subject-specific non-linear biomechanical model of needle insertion into brain. Computer Methodds in Biomechanics and Biomedical Engineering. 2008;11:135–146. doi: 10.1080/10255840802296665. [DOI] [PubMed] [Google Scholar]
- 40.McConnell GC, Schneider TM, Owens DJ, Bellamkonda RV. Extraction Force and Cortical Tissue Reaction of Silicon Microelectrode Arrays Implanted in the Rat Brain. IEEE Transactions on Biomedical Engineering. 2007;54:1097–1107. doi: 10.1109/TBME.2007.895373. [DOI] [PubMed] [Google Scholar]
- 41.Gefen A, Margulies SS. Are in vivo and in situ brain tissues mechanically similar? J Biomechanics. 2004;37:1339–1352. doi: 10.1016/j.jbiomech.2003.12.032. [DOI] [PubMed] [Google Scholar]
- 42.Subbaroyan J, Martin DC, Kipke DR. A finite-element model of the mechanical effects of implantable microelectrodes in the cerebral cortex. J Neural Eng. 2005;2:103–113. doi: 10.1088/1741-2560/2/4/006. [DOI] [PubMed] [Google Scholar]
- 43.Miller K. Biomechanics of the Brain. Springer; New York: 2011. [Google Scholar]
- 44.Prevost JH. A simple plasticity theory for frictional cohesionless soils. International Journal of Soil Dynamics and Earthquake Engineering. 1985;4:9–17. [Google Scholar]
- 45.Lee H, Bellamkonda RV, Sun W, Levenston ME. Biomechanical analysis of silicon microelectrode-induced strain in the brain. J Neural Eng. 2005;2:81–89. doi: 10.1088/1741-2560/2/4/003. [DOI] [PubMed] [Google Scholar]
- 46.Briscoe BJ, Sebastian KS, Adams MJ. The effect of indenter geometry on the elastic response to indentation. J Phys D: Appl Phys. 1994;27:1156–1162. [Google Scholar]
- 47.Stice P, Muthuswamy J. Assessment of gliosis around moveable implants in the brain. J Neural Eng. 2009;6:046004. doi: 10.1088/1741-2560/6/4/046004. [DOI] [PMC free article] [PubMed] [Google Scholar]
- 48.Williams JC, Hippensteel JA, Dilgen J, Shain W, Kipke DR. Complex impedance spectrpscopy for monitoring tissue responses to inserted neural implants. J Neural Eng. 2007;4:410–423. doi: 10.1088/1741-2560/4/4/007. [DOI] [PubMed] [Google Scholar]
- 49.McConnell GC, Butera RJ, Bellamkonda RV. Bioimpedance modeling to monitor astrocytic response to chronically implanted electrodes. J Neural Eng. 2009;6:055005. doi: 10.1088/1741-2560/6/5/055005. [DOI] [PubMed] [Google Scholar]
- 50.Williams JC, Rennaker RL, Kipke DR. Long-term neural recording characteristics of wire microelectrode arrays implanted in cerebral cortex. Brain Research Protocols. 1999;4:303–313. doi: 10.1016/s1385-299x(99)00034-3. [DOI] [PubMed] [Google Scholar]
- 51.Solon J, Leventhal L, Sengupta K, Georges PC, Janmey PA. Fibroblast Adaptation and Stiffness Matching to Soft Elastic Substrates. Biophysical Journal. 2007;93:4453–4461. doi: 10.1529/biophysj.106.101386. [DOI] [PMC free article] [PubMed] [Google Scholar]
- 52.Moshayedi P, et al. Mechanosensitivity f astrocytes on optimized polyacrylamide gels analyzed by quantitative morphometry. J Phys: Condens Matter. 2010;22:194114. doi: 10.1088/0953-8984/22/19/194114. [DOI] [PubMed] [Google Scholar]
- 53.Bundesen LQ, Scheel TA, Bregman BS, Kroner IF. Eprin-B2 and EphB2 Regulation of Astrocyte-Meningeal Fibroblast Interactions in Response to Spinal Cord Lesions in Adult Rats. J Neuroscience. 2003;23:7789–7800. doi: 10.1523/JNEUROSCI.23-21-07789.2003. [DOI] [PMC free article] [PubMed] [Google Scholar]
- 54.Bernick KB, Prevost TP, Suresh S, Socrate S. Biomechanics of single cortical neurons. Acta Biomaterialia. 2011;7:1210–1219. doi: 10.1016/j.actbio.2010.10.018. [DOI] [PMC free article] [PubMed] [Google Scholar]
- 55.Georges PC, Miller WJ, Meaney DF, Sawyer ES, Janmey PA. Matrices with Compliance Comparable to that of Brain Tissue Select Neuronal over Glial Growth in Mixed Cortical Cultures. Biophysical Journal. 2006;90:3012–1018. doi: 10.1529/biophysj.105.073114. [DOI] [PMC free article] [PubMed] [Google Scholar]
- 56.McConnell GC, Rees HD, Levey AI, Gutekunst CA, Gross RE, Bellamkonda RV. Implanted neural electrodes cause chronic, local inflammation that is correlated with local neurodegeneration. J Neural Eng. 2009;6:056003. doi: 10.1088/1741-2560/6/5/056003. [DOI] [PubMed] [Google Scholar]
- 57.Karumbaiah L, et al. The upregulation of specific interleukin (IL) receptor antagonists and paradoxical enhancement of neuronal apoptosis due to electrode induced strain and brain micromotion. Biomaterials. 2012;33:5983–5996. doi: 10.1016/j.biomaterials.2012.05.021. [DOI] [PubMed] [Google Scholar]
- 58.Harris JP, et al. In vivo deployment of mechanically adaptive nanocomposites for intracortical microelectrodes. J Neural Eng. 2011;8:046010. doi: 10.1088/1741-2560/8/4/046010. [DOI] [PMC free article] [PubMed] [Google Scholar]
- 59.Capadona JR, Shanmuganathan K, Tyler DJ, Rowan SJ, Weder C. Stimuli-Responsive Polymer Nanocomposites Inspired by Sea Cucumber Dermis. Science. 2008;319:1370–1374. doi: 10.1126/science.1153307. [DOI] [PubMed] [Google Scholar]
- 60.Capadona JR, Tyler DJ, Zorman CA, Rowan SJ, Weder C. Mechanically adaptive nanocomposites for neural interfacing. MRS Bulletin. 2012;37:581–589. doi: 10.1088/1741-2560/8/4/046010. [DOI] [PMC free article] [PubMed] [Google Scholar]
- 61.Meng F, Hlady V, Tresco PA. Inducing alignment in astrocyte tissue constructs by surface ligands patterned on biomaterials. Biomaterials. 2012;33:1323–1335. doi: 10.1016/j.biomaterials.2011.10.034. [DOI] [PMC free article] [PubMed] [Google Scholar]
- 62.Wolchok JC, Tresco PA. The isolation of cell derived extracellular matrix constructs using sacrificial open-cell foams. Biomaterials. 2010;31:9595–9603. doi: 10.1016/j.biomaterials.2010.08.072. [DOI] [PubMed] [Google Scholar]