

Abstract
The present study was designed to examine the regulation of crystallin genes and protein in the mouse retina using the BXD recombinant inbred (RI) strains. Illumina Sentrix BeadChip Arrays (MouseWG-6v2) were used to analyze mRNA levels in 75 BXD RI strains along with the parental strains (C57Bl/6J and DBA/2J), and the reciprocal crosses in the Hamilton Eye Institute (HEI) Retina Dataset (www.genenetwork.org). Protein levels were investigated using immunoblots to quantify levels of proteins and indirect immunohistochemistry to define the distribution of protein. Algorithms in the Genomatix program were used to identify transcription factor binding sites common to the regulatory sequences in the 5′ regions of co-regulated set of crystallin and other genes as compared to a set of control genes. As subset of genes, including many encoding lens crystallins is part of a tightly co-regulated network that is active in the retina. Expression of this crystallin network appears to be binary in nature, being expressed either at relatively low levels or being highly upregulated. Relative to a control set of genes, the 5′ regulatory sequences of the crystallin network genes show an increased frequency of a set of common transcription factor-binding sites, the most common being those of the Maf family. Chromatin immunoprecipitation of human lens epithelial cells (HLEC) and rat retinal ganglion cells (RGC) confirmed the functionality of these sites, showing that MafA binds the predicted sites of CRYGA and CRYGD in HLE and CRYAB, CRYGA, CRYBA1, and CRYBB3 in RGC cells. In the retina there is a highly correlated group of genes containing many members of the α- β- and γ-crystallin families. These genes can be dramatically upregulated in the retina. One transcription factor that appears to be involved in this coordinated expression is the MAF family transcription of factors associated with both lens and extralenticular expression of crystallin genes.
Keywords: Crystallin, BXD Strains, promoter analysis, quantitative trait loci, transcription factor
1. Introduction
The crystallins are the major structural proteins of the eye’s lens, making up 90% of the soluble proteins. They consist of the ubiquitous crystallins, which comprise three major classes: α, β, and γ, in addition to a group of taxon-specific crystallins, also called enzyme-crystallins since they were largely recruited from genes encoding housekeeping enzymes (Wistow and Piatigorsky, 1988). Time has blurred the distinction between the ubiquitous and enzyme-crystallins. Initially, the ubiquitous crystallins were recognized as the primary component of the vertebrate lens, lending the lens its optical properties of transparency and refractive focusing of light. Although initially they were thought of as being solely lens proteins, it is now known that the crystallins are expressed in other tissues such as the brain, heart, kidney, lungs, and retina (Clayton et al., 1986; Head et al., 1991; Smolich et al., 1994). The α-crystallin proteins are the most studied, and have a high degree of homology with small heat shock proteins (HSP). Like the HSPs, the α-crystallin proteins can act as molecular chaperones (Horwitz, 1992). Members of the α-crystallin family were first discovered outside the lens being upregulated after damage to heart muscle (Bhat et al., 1991) and it is now believed that the α-crystallins can be cytoprotective (Kannan et al., 2012). Less is understood about the extralenticular function and expression of the β- and γ-crystallins. These two classes of proteins appear to be structurally similar and form a βγ-crystallin superfamily related to microbial spore coat proteins. Like αB-crystallin, they can be induced by physiological stress (Jaenicke and Slings by, 2001). Members of the crystallin families of proteins are upregulated as a cellular response mechanism against stressors, such as osmotic stress, various types of injury, as well as bacterial infections in a number of different tissue types (Graw, 2009; Santana and Waiswo, 2011). The current data suggest that overexpression of crystallins, especially the α-crystallin family members, provides a protective mechanism for blocking apoptosis in neurons (Rao et al., 2008). In the retina the expression of crystallin proteins is altered following trauma and may play a protective role (Ahmed et al., 2004; Templeton et al., 2009; Vazquez-Chona et al., 2004).
Recently, our group has found what appeared to be a dramatic difference in expression of some crystallins in the retinas of different strains of mice, (Templeton et al., 2009) consisting of high levels of crystallins in the C57BL/6 mouse and relatively low levels in the DBA/2J mouse. Further, following optic nerve crush these members of the crystallin family appear to respond in a coordinated manner, showing decreased expression in the C57BL/6 mouse retina and increased expression in the DBA/2J mouse retina. We hypothesized that these crystallin proteins might be regulated by a common molecular mechanism within the retina following injury. We use the BXD recombinant inbred (RI) strain set to examine the genetic regulation of the crystallins in the retina. This strain set is uniquely suited for this analysis since the two parental strains – C57BL/6 and DBA/2J – display a difference in crystallin expression (Templeton et al., 2009). In the present paper, we demonstrate the presence of a genetic network regulating the coordinated expression of a group of crystallin family members. This network contains a surprising combination of crystallin and non-crystallin genes, many of which are selectively or highly expressed in the lens, and may play a prominent role in the response of the retina and CNS to injury. We carry out a bioinformatic comparison of the promoter and 5′ regions of the co-regulated and control genes to identify functional and regulatory modulators and their gene interactions.(Bloemendal and de Jong, 1991; Hejtmancik et al., 2001) The correlation in crystallin network expression across the BXD RI strains allows statistical analysis that identifies the Maf family and probably MafA as a putative transcription factor that potentially co-regulate this crystallin genes expression. The bioinformatic analysis was validated by chromatin immunoprecipitation (CHIP) in human lens epithelial cells (HLE) and rat ganglion cells (RGC).
2. Materials and Methods
2.1 Animals
All animals used were in compliance with institutional guidelines and with the ARVO statement for the Use of Animals in Ophthalmic and Vision Research. The Institutional Animal Care and Use Committee (IACUC) at the University of Tennessee Health Science Center approved all protocols involving the use of mice. In the present study 35 mice were used to quantify protein and 9 were used for immunohistochemistry.
2.2 GeneNetwork Databases
In the present study we defined the crystallin network and examined the levels of crystallin mRNA using three databases within the GeneNetwork website (genenetwork.org) and the Hamilton Eye Institute (HEI) Retina Database. Descriptions of the dataset can be found in the Information File attached to database on GeneNetwork.org.
2.3 Antibodies Used
The antibodies directed against members of the crystallin family are: rabbit anti-γ-Crystallin, rabbit anti-β-crystallin, rabbit anti-βA3/A1-crystallin, and rabbit anti-α-crystallin. All of these anti-crystallin antibodies were a gift from Dr. Sam Zigler. An additional rabbit anti-αB-crystallin was purchased from Abcam (ab13497, Abcam, Cambridge MA). Mouse anti-NeuN was purchased from Chemicon (Temecula, CA). The secondary antibodies were goat anti-rabbit antibody labeled with Alexa Fluor 488 (A11034, Invitrogen, Eugene OR), goat anti-mouse labeled with Alexa Fluor 568 (A11031, Invitrogen). TO-PRO-3 iodide was purchased from Invitogen (T3605, Invitrogen, Eugene OR). The antibody used for immunoblots was goat anti-rabbit IgG peroxidase conjugated (Promega, Madison, WI).
2.4 Immunoblot Analysis
For our immunoblot analysis mice were selected from a number of different BXD RI strains. The mice were deeply anesthetized with a mixture of 13 mg/kg of Rompum and 87 mg/kg of Ketalar and then killed by cervical dislocation. The retinas were removed and stored in sample buffer at −20°C. Unless it is specifically stated, two retinas from each animal were pooled and placed in sample buffer (100mM Tris-HCl (pH 7.5), 150mM NaCl, 0.5% SDS, 0.5% Triton X-100, 0.5% Sodium Deoxycholate, 0.1% 2-Mercaptoethanol, and 10% glycerol) containing protease inhibitors (Roche) and immediately frozen. Samples were lysed by sonication on ice. The protein concentration of each sample was determined using the Bradford protein assay kit (Bio-Rad). Six standard BSA (0.25, 0.5, 0.75, 1, 1.5, and 2 mg/ml) were used to make a standard curve (R2=0.9). The total protein concentrations of each sample were then measured. The concentration of each sample was then adjusted to 50 ug of protein to 100 ul of sample. The proteins (15 ug/lane) were separated on a 4–12% SDS-polyacrylamide gel and transferred to PVDF membrane (Immobilon-P; Millipore, Billerica, MA). After incubation with primary antibodies, the membranes were treated with anti-rabbit peroxidase-conjugated secondary (Promega, Nashville TN) for 2 hours. Immunoreactive bands were detected by chemiluminescence (ECL western blotting reagents; Pierce, Rockford, IL). As loading control samples were also stained an antibody against β-actin (SC-47778, Santa Cruz Biotechnology, Santa Cruz, CA). Bands were quantified using a Kodak image analyzer and band intensities were analyzed by densitometry.
2.5 Immunohistochemistry
For immunohistochemical experiments mice were deeply anesthetized with a mixture of 13 mg/kg of Rompum and 87 mg/kg of Ketalar and perfused through the heart with saline followed by 4% paraformaldehyde in phosphate buffer (pH 7.3). The retinas were placed in 4% paraformaldehyde overnight. The next day they were rinsed in phosphate buffer and then embedded in 4% agarose gel. The retinas were sectioned with a Vibratome at 100um thick. The sections were extensively rinsed in PBS, and then placed in blocking buffer containing 2% bovine serum albumin (BSA), 0.05% DMSO and 0.05% Tween-20 for 30 min. For immunohistochemistry, sections were incubated in primary antibodies (1:500) against γS-crystallin and αB-crystallin and incubated overnight at 4°C. After rinsing the sections were incubated with secondary antibody conjugated to AlexaFluor-488 (A21206, Invitrogen Molecular Probes) (1:1000) for 2 hours at room temperature. The sections were then rinsed 3 times, flooded with Fluoromount-G, and covered with a coverslip. All images were photographed using on Nikon Eclipse TE2000-E confocal microscope at 40x and acquired by Nikon’s EZ-C1 Software (Bronze Version, 3.91).
2.6 Analyzing transcription factor (TF) binding sites
Fourteen test crystallin genes co-regulated with Crygs were selected for bioinformatic analysis, including Cryaa, Cryab, Cryba1, Cryba2, Cryba4, Crybb2, Cryga, Crygb, Crygc, Crygd, Crygd, Cryge, Crygn, and Crygs, which are highly expressed in normal retina and are highly regulated after optic nerve crush. In addition, 14 control genes: Abcd3, Acin1, Calb2, Calm2, Calu, Clk2, Clns1a, Dguok, Dlgap4, Nos3, Nphp1, Nr1i3, Usp7, Vav2, that are highly expressed in the retina but not co-regulated with crystallin genes were selected as a control group for comparison with the crystallin genes. The Genomatix program (Genomatix, Munich, Germany) was used to identify all known transcription factor binding sites in the promoter regions for both control and test genes. Then the average number of binding sites and the distribution of binding sites for each group were calculated, and Student’s t-test was used to compare occurrence of binding sites for each transcription factor family in the two groups to identify any significant differences. A value of P < 0.05 was considered statistically significant.
2.7 Cell Culture
Human lens epithelial cells (HLE cells, FHL124) were grown and cultured at 37°C in the presence of 5% CO2 in DMEM-Dulbecco’s Modified Eagle Medium (Gibco, California) with low glucose while rat retinal ganglion cells (RGC5) cells were cultured at 37°C in the presence of 5% CO2 to 70% confluency in DMED-Dulbecco’s Modified Eagle Medium with high glucose. Culture media for both cell lines were supplemented with 10% fetal bovine serum (FBS, GIBCO), gentamicin (50 U/mL), penicillin-streptomycin antibiotic mix (50 U/mL), and amphotericin B(5 μl/ml, Fungizone; all from Invitrogen, Gaithersburg, MD). The cells were checked and the medium was changed daily.
2.8 Chromatin Immunoprecipitation (CHIP)
Human lens epithelial cells and retinal ganglion cells were plated in 10-cm plates. CHIP was performed using CHIP-IT Express Enzymatic Magnetic Chromatin immunoprecipitation kit (Active Motif, California). Chromatin in cultured cells was cross-linked with 1% formaldehyde for 10 min and subsequently quenched with 125mM glycine for 5 min. Cells were washed with cold PBS, nuclei were extracted with cell lysis buffer. Cross-linked chromatin was sheared enzymatically by incubation with a working stock of Enzymatic Shearing Cocktail (200u/ml) at 37°C for 5 minutes yielding c hromatin fragments of 200–1000 base-pair DNA in length. The reaction was stopped by adding EDTA, followed by centrifuging. The sheared chromatin in the supernatant is used as the “input DNA” for the ChIP assay.
Immunoprecipitation reactions were set up by mixing ChIP buffer, protein G magnetic beads, protease inhibitor cocktail, sheared chromatin and anti-MAFA antibody (Santa Cruz Biotechnology) and incubating overnight with rotation at 4°C. Immune-complexes were then captured with prote in G beads. Complexes were washed and eluted with elution buffer. Both eluates and input DNA were treated by proteinase K (215 mg/ml) and incubated at 37°C for 1 hour. Finally, the tubes were returned to room temperature and 2ul proteinase K stop solution was added. The DNA was then analyzed by PCR to determine which promoter DNA fragments were complexed with the protein of interest. ChiP assays were repeated 4 times. Unfortunately, a commercially available Maf antibody appropriate for ChIP analysis could not be identified.
2.9 PCR analysis of ChIP
Primers for the test and control genes were designed using Primer3 software so that predicted PCR products were around 200bp (Table 1). PCR reactions were carried out in 10 μl reactions containing 1 μl of 10×PCR buffer, 1 μl of MgCl2 (50 mM), 0.5 μl of dNTP (10 mM), 0.25 μl of forward primer (10μM), 0.25 μl of reverse primer (10 μM), 1 μl of Taq polymerase, and 2 μl of template DNA. PCR of both human and rat genes was performed using a touchdown program beginning at 94°C for 4 min., followed by eighteen touchdown cycles decreasing by 0.5°C each cycle with annealing temperatures decreasing from 63°C to 54°C for 30 sec, each with a denaturing stage at 94°C for 30 sec, then annealing and an elongation stage at 72°C for 45 sec, and then 20 cycles of 94°C for 30 sec, 54°C for 30 sec and 72°C for 45 sec, followed by a final elongation cycle at 72°C for 10 min, and cooling at 4°C until analysis by electrophoresis on a 2% agarose gel.
Table 1.
Primer Sequences for identifying crystallin message.
| Primer Name | Forward Sequence | Reverse Sequence | |
|---|---|---|---|
| HCry | -αA | GCCTCCTTGGGTTGTCTG | ATTTCTCTGGAAAGGCGTGA |
| -βA1 | CTCTGGGGATCATGAGGAAC | TTACTCACCCAGCTCCTGCT | |
| -βA2 | GCCTCAGCACTTTCTGTTGTC | GCTTTATACCTGGGCCTTGTC | |
| -βA4 | GTCCTTTCCCTCCCTGCTAA | GAGATAGGCCCAGGGAACAT | |
| -βB3 | GACCCGCTATTGGAGTGAAG | CCCAGAATGAACCTGTTGCT | |
| -γA | ACTGCCCCATGATCTCAAAT | TGGTTGTTGACAGAGGGTGA | |
| -γB | GCAAATCCCCTTACTCACCA | CATCCGGTACCCAGGACTTA | |
| -γC | TGCATAAAATCCCCTTACCG | ATGCGAGTTCAGTGTGATGG | |
| -γD | AGAACACGAAAATGCCCTTG | CAGGCTGGGCTCACCTTC | |
| -γN | ACGCCCGACAGCACTAAC | GAGGGACGCACTCACCTTC | |
|
| |||
| RCry | -αA1 | TTCTTGGCGACCTCTGTTCT | TAGCACTCTGGCCCTCCTTA |
| -αA2 | TAATGCACCAACCACATGCT | GTCAGAAAGCCCCTCCTCTC | |
| -αB | TACTGAGCGACTGTGCCAAC | AGTCCCAGGCTCTGACTTTG | |
| -βA1 | CTGGGGATCAGGAGAAACAA | GTCTCCATCTGGTGCAGCTT | |
| -βA4 | AGGTCACCTCGACACCAGAG | GGAATTGGTCTGTGGAGGAA | |
| -βB1 | CAACCCGAACCTACCAGAAA | GGCCCATTCCAGTGAGTAAG | |
| -βB3 | GTCAGGTACACTGGGGCATC | TCCTGGACATCGGTGTGAG | |
| -γA | CACCCTCCACTCAGCAGTTT | GGTAGGGGGCTCTCATTCTC | |
| -γA2 | CTACCCCATGATCCCAAATG | CTCACCTTTCCCATCGTTGT | |
| -γB | TCTACAGTCACCGCCACTGA | AGTTTGCGTTCTGCTCACCT | |
| -γC | ATCCCGTGGTCTATGACAGC | CGGATGGGAGGTTTCAGTT | |
| -γD | CACCTCCCCCACAGTCATTA | GATGGTGCTGTTGGTTGTGT | |
| -γE | ATACCCCTGTCCCCAAAGAG | CCACCTCTGGACCTCAACAT | |
Immunoblot and Real-Time qRT-PCR on individual retinas
The retinas from 3 C58BL/6 and 3 DBA/2J mice were removed and dissected in half. One half was prepared for immunoblot analysis and the other half was prepared for real-time qRT-PCR. Protein levels were measured as described above. The levels of message for Cryaa, Cryab and Actb as a control, were validated using real-time qRT-PCR, which was done on the Roche LightCycler 480 system (F. Hoffmann-La Roche, Switzerland). To normalize the data, Actb was run as a housekeeping gene. Each gene was run in triplicate along with negative control, neg-RT, as well as water for controls. Assays were designed on the Roche web site. The primers were synthesized by Integrated DNA Technologies (Iowa City, Iowa).
3. Results
3.1 Expression analysis
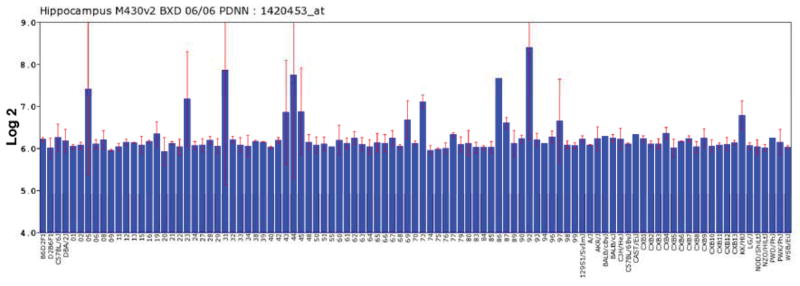
The BXD RI strain set provides a unique opportunity to examine the expression of crystallins in the retina of the mouse and using the HEI Retina dataset on GeneNetwork.org allows us to examine the regulatory network in the retina. The HEI Retina datasets consists of data from 80 different strains of mice sampled by a total of 346 microarrays. Using this massive dataset we are able to examine the expression of crystallins in the retina in ways not previously feasible. In general, crystallins have very high levels of expression in the normal retina, with 13 crystallins in a tightly regulated genetic network in the retina (see Table 2). These crystallin genes have a mean expression level of 12.4, 16-fold higher than the mean expression level of all retinal transcripts, Furthermore, when we examine the expression level of a single transcript across all of the BXD RI strains (Fig. 1), it is immediately apparent that there is a tremendous amount of variability across the strains. For example, mean expression of Crygs is very high in some strains (18.2, or over 1,000 fold over the mean expression level of 8), while in others it is relatively low (7.5, below mean expression across the retina). The variability of expression from strain to strain is consistent across all of the different members of the crystallin network. Figure 1 illustrates the expression levels for Crygs and Cryab. Notice that the strains with high levels of expression for one Cryab also have high levels of expression for Crygs. If we compare the expression of Crygs and Cryab using a Spearman Correlation Analysis (Figure 2), then we see that the expression of the two crystallins are highly correlated with an r = 0.934. The highly correlated expression of the two crystallin family members suggests strongly that they might be regulated by a common genetic mechanism across all of the BXD strains.
Table 2.
Genes of the Crystallin Network in Normal Retina and After ONC
| Description | Retina Expression | Retina Correlation | Record | ONC Expression | ONC Correlation |
|---|---|---|---|---|---|
| crystallin, gamma S | 13.93 | 1.000 | ILMN_2702266 | 15.62 | 1.000 |
| crystallin, beta A2 | 14.05 | 0.998 | ILMN_2629519 | 15.80 | 0.998 |
| crystallin, beta B2 | 14.19 | 0.998 | ILMN_2670240 | 15.99 | 0.997 |
| crystallin, beta A1 | 14.06 | 0.998 | ILMN_2842725 | 15.66 | 0.998 |
| crystallin, alpha A | 13.02 | 0.988 | ILMN_2634888 | 13.94 | 0.954 |
| crystallin, beta A4 | 13.16 | 0.987 | ILMN_1258732 | 14.79 | 0.985 |
| crystallin, beta B3 | 11.22 | 0.956 | ILMN_2720107 | 12.68 | 0.946 |
| major intrinsic protein of eye lens fiber | 11.77 | 0.953 | ILMN_1254280 | 13.22 | 0.952 |
| crystallin, beta B1 | 10.78 | 0.951 | ILMN_2702122 | 12.16 | 0.936 |
| crystallin, alpha B | 13.42 | 0.940 | ILMN_2840213 | 14.25 | 0.946 |
| galectin-related inter-fiber protein | 10.38 | 0.938 | ILMN_2676543 | 11.85 | 0.928 |
| lens intrinsic membrane protein 2 | 9.11 | 0.884 | ILMN_1247117 | 9.95 | 0.852 |
| crystallin, gamma C | 10.70 | 0.877 | ILMN_1221737 | 11.18 | 0.795 |
| crystallin, gamma N | 9.16 | 0.870 | ILMN_2774572 | 10.06 | 0.866 |
| crystallin, gamma B | 11.02 | 0.869 | ILMN_2757133 | 11.29 | 0.743 |
| beaded filament structural protein 2, phakinin | 8.90 | 0.864 | ILMN_2731774 | 9.51 | 0.859 |
| wingless-related MMTV integration site 7B | 8.40 | 0.856 | ILMN_2789692 | 9.53 | 0.880 |
| GlcNAc:betaGal beta-1,3-N-acetyl 5 | 8.23 | 0.844 | ILMN_1216368 | 8.90 | 0.849 |
| crystallin, gamma D | 10.84 | 0.842 | ILMN_2884655 | 11.30 | 0.706 |
| nidogen 1 | 8.23 | 0.833 | ILMN_2814005 | 8.89 | 0.838 |
Figure 1.

Variation in the expression of Crygs (A) and Cryab (B) across all of the BXD strains is illustrated in this figure. The bars represent mean expression level of the probe along with the standard error of the mean. The y-axis indicates expression on a log2 scale with the mean expression of all transcripts on the array being set to 8. A illustrates the variation in the expression of the Crygs (probe ILMN_2702266) and B shows the expression for Cryab (probe ILMN_2840213). Notice that the strains with high levels of expression of Crygs also have high levels of expression of Cryab and the same is true for low levels of expression.
Figure 2.

Correlations and scatter plot for transcripts of two crystallin genes, Cryab (probe ILMN_2840213) Crygs and (probe ILMN_2702266). Notice that the expression of the two genes is highly correlated across the BXD strain set. The Spearman correlation is very high (r = 0.934, along with a p value of E−16).
The high degree of correlation of Crygs and Cryab extends to a small group of genes that form a tightly regulated network. When we searched the HEI Retina Database for correlates of Crygs, a highly correlated group of genes with a similar expression pattern across the BXD RI strain set was retrieved (See Table 2). This group includes: Cryaa, Cryab Cryba1, Cryba2, Cryba4, Crybb1, Crybb2, Crybb3, Crygb, Crygc, Crygd, Crygn, and Crygs. Other Crystallin genes, such as Cryga, Cryge, and Crygf, have a low correlation with the genes in this network (r > 0.5). The list of correlates also includes several genes that one might not immediately consider to be related to crystallins: Mip, Grifin, Lim2, Nid1, Wnt7b, B3gnt5 and Bfsp2. This correlated group of genes forms a network, the crystallin network, with the average correlation of these members of the crystallin network being very high (above 0.9). The expression of all of these genes across the BXD RI strain set varies dramatically from strain to strain (Fig 1). Some strains have rather low expression of all members of the network. For example, BXD55 has a relatively low crystallin expression in the retina with an average expression of 7.5, below the mean expression level of 8.0 on the microarray data set. In other strains, such as BXD28, the expression is high, at 18.0 (or 1024 fold above mean expression). All of the genes in the crystallin network have a similar relative expression across the BXD RI strain set as that illustrated for Cryab and Crygs in Figure 1.
One possible explanation is that our retinal samples were contaminated with lens tissue. To examine this network in another tissue with minimal concerns of lens contamination, we looked at the expression of crystallins in another CNS region, the hippocampus (BXD Hippocampus dataset, Genenetwork.org). The expression of Crygs in the hippocampus is illustrated in figure 3. As in the retinal dataset, expression of a similar group of genes is highly correlated with Crygs across the BXD RI strain set. In the Hippocampus Consortium dataset the list of correlates even includes Sag (s-antigen). The same network is also apparent in a different RI strain set, the LXS strain set (Figure 4). In the hippocampus database for the LXS RI strain set the group of genes highly correlated with Crygs includes all of the genes within the network defined in the retina, including the crystallins, Mip (major intrinsic protein of the lens), Grifin (galectin-related inner-fiber protein) and Sag (retinal S-antigen). Taken together these data reveal that the crystallin network is present in several different CNS structures and is not retina specific. Furthermore, the presence of the crystallin network in the hippocampus eliminates the possibility of the correlated expression detected in the retina being a result of contamination by the lens. These data demonstrate the presence of a crystallin network within the CNS and suggest that there might be common regulatory elements that control the expression of this network.
Figure 3.
Variation in the expression of Crygs (across all of the BXD strains in the Hippocampal Consortium dataset is illustrated in this figure. The bars represent mean expression level of the probe along with the standard error of the mean. The y-axis indicates expression on a log2 scale with the mean expression of all transcripts on the array being set to 8. Notice that the strains with high levels of expression of Crygs also have relatively high standard errors of the mean. The data presented represents expression data from the hippocampus of different strains of mice – from right to left they are: B6D2F1, D2B6F1, C57BL/6J, DBA/2J, BXD, BXD2, BXD5, BXD6, BXD8, BXD9, BXD11, BXD12, BXD13, BXD15, BXD16, BXD19, BXD20, BXD21, BXD22, BXD23, BXD24, BXD27, BXD28, BXD29, BXD31, BXD32, BXD33, BXD34, BXD38, BXD39, BXD40, BXD42, BXD43, BXD44, BXD45, BXD48, BXD50, BXD51, BXD55, BXD56, BXD60, BXD61, BXD62, BXD63, BXD64, BXD65, BXD66, BXD67, BXD68, BXD69, BXD70, BXD73, BXD75, BXD77, BXD80, BXD83, BXD84, BXD85 BXD86, BXD87, BXD89, BXD90, BXD92, BXD93, BXD94, BXD96, BXD97, BXD98, BXD99, 129S1/SvImJ, A/J, AKR/J, BALB/cByJ, BALB/cJ, C3H/HeJ, C57BL/6ByJ, CAST/EiJ, CXB1, CXB10, CXB11, CXB12, CXB13, CXB2, CXB3, CXB4, CXB5, CXB6, CXB7, CXB8, CXB9, KK/HlJ, LG/J, NOD/ShiLtJ, NZO/HlLtJ, PWD/PhJ, PWK/PhJ, WSB/EiJ, SJL/J, and WSB/EiJ.
Figure 4.
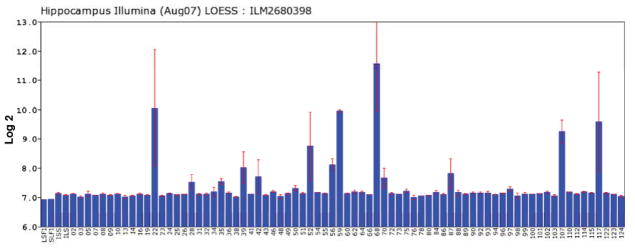
Variation in the expression of Crygs across all of the LXS strains for the Hippocampus. The bars represent mean expression level of the probe along with the standard error of the mean. The y-axis indicates expression on a log2 scale with the mean expression of all transcripts on the array being set to 8. Notice that in general the level of Crygs is relatively low around 7; however in specific strains very high levels of Crygs are observed.
The expression profile of the crystallins across the BXD RI strains, led us to take a closer look at the data from individual animals. Figure 1 shows that the strains with retinas expressing the lowest levels of crystallins and the strains expression the highest levels of crystallins have very small standard errors. When we examine the individual animals within these strains they are consistently all low or all high. Strains showing intermediate levels of expression have large standard errors. For example, BXD102 had a standard error of 3.5, representing a large variation in range of expression. When we examined the expression of individual animals within the intermediate expressing strains, it became apparent that expression of the pathway was high in some animals and low in others, thus accounting for the large standard errors. A clear pattern emerged after looking at the expression of crystallins in individual animals across all of the BXD strains. The individual animals tended to express either very high levels or relatively low levels of crystallin messages, with an intermediate level of expression occurring in only a few. Since the microarray dataset was composed of pooled biological samples (both eyes from each mouse), it is possible that the three states we were seeing represented both eyes low, both eyes high, or one eye low and the second eye in the pooled sample high. Thus, the analysis of expression profiles from individual animals was informative in two specific ways. The first was that the variability of gene expression from strain to strain was very high, approximately a 1,000 fold. The second was the high correlation of expression across all of the genes within the crystallin network, consistent across various tissues and at different levels of expression.
3.2 Immunoblot Analysis
Our initial analysis of protein expression in the eye used samples pooled from the two eyes of each mouse. We examined crystallin proteins expression in 15 BXD RI strains using a total of 28 mice. Samples were separated by SDS PAGE and transferred to PVD membranes. The protein blots were reacted with antibodies directed against α- and γ-crystallin. The relative expression of αA-crystallin, αB-crystallin, and γS-crystallin was determined for each sample. The same amount of total protein was added to each lane and the balance of the loading was checked using antibodies directed against beta actin. The results for all three members of the crystallin family were similar and we are only presenting our findings for γS-crystallin. When we compared levels of γS-crystallin protein in a strain to the message level in GeneNetwork, it was immediately obvious that there was not a good correlation between protein expression level and message expression level. BXD strains with high levels of message could have low levels of the corresponding proteins and conversely, strains with low levels of message could have high levels of protein. When we plotted the level of protein for each of the strains against the expression of message for the same strains (Fig. 5), the two sets of data showed no direct association. In fact the spearman rank correlation was very low, r = − 0.173. Thus, there appeared to be a complete disconnect between measured protein and message expression within a strain. When examining the data from individual animals, some animals within a strain would have high crystallin protein levels, while others would have low crystallin protein levels. However, it remained true that if a sample contained high levels of γS-crystallin protein, then that the same sample also contain high levels of αA- and αB-crystallin proteins. The disconnect between protein level and message level, led us to hypothesize that the genes in the crystallin network had two states of expression, either high expression or low expression and that this transition between the two states was not strictly strain dependent. However, discrepancies between protein and mRNA levels suggested the possibility of an additional level of control, perhaps at the level of translation. Furthermore, the fact our pooled samples from two eyes displayed three states (low, high and intermediate) led us to speculate that the crystallin network in one eye functioned independently from the other eye in the same mouse.
Figure 5.

Correlations and scatter plot for relative levels of γ-crystallin protein and Crygs gene expression (probe ILMN_2702266). Notice that the expression of the gene and protein are not highly correlated across the BXD strains. The Spearman correlation is low (r = − 0.173).
To examine the possibility that the crystallin network could be activated within a single eye in the normal mouse, we examine the expression of crystallins in individual eyes of several BXD RI strains. Protein samples were examined from 16 individual retinas taken from three different BXD RI strains (BXD48, BXD 60 and BXD 102). All of the samples were probed for γS-crystallin, αA-crystallin, and αB-crystallin. The results for all three proteins were similar for each of the eyes. In figure 6 we present data from three different mice, mouse 396 (BXD 48) Mouse 398 (BXD60) and mouse 402 (BXD102). In some mice the levels of crystallin γS were similar (Fig 5, Mouse 398), while in other mice one eye was high and one eye was low (Fig 6, Mouse 396 and mouse 402). To confirm these data and to demonstrate that the message levels were similar to the dramatic differences in protein expression, 8 retinas from 2 C57BL/6 and 2 DBA/2J mice were analyzed for both mRNA and protein. Three of these retinas had elevated levels of crystallin protein and the same retinas demonstrated elevated levels of crystallin mRNA. The retinas that had low levels of crystallin proteins also has low levels of mRNAs for the crystallins (data not shown). These data demonstrate that there is a dramatic variation in crystallin expression that is independent of genetic background. We see individual eyes express high levels of crystallins and the other eyes from the same mouse, or mice of the same strain express low levels of crystallins. The fact that the right eye can have significantly different crystallin expression from the left eye, suggests that gross environmental factors that would affect both eyes equally cannot solely explain the activation of the crystallin network. In essence we are seeing 1,000 fold changes in a tightly correlated group of genes and proteins, and the trigger for the change from low expression to high expression is not immediately obvious.
Figure 6.

Immunoblots of protein samples from the right (R) and left (L) eyes of 3 different mice of different BXD RI strains. The protein samples were all loaded at the same concentration and stained for α-crystallin, β-crystallin and γ-crystallin. Notice that there is considerable variation from eye to eye. In the eyes from mouse 395 and mouse 402 the right eye had higher levels of all crystallins than that observed in the left eye. For mouse 398 the levels were approximately equal between the two eyes. These data revealed the surprising variability of crystallin expression in the individual eyes and different strains.
3.3 Immunohistochemistry Analysis
To examine the distribution of crystallin proteins in the normal retina we examined several different BXD strains: BXD31, BXD44, BXD45, BXD27, BXD50 and BXD62. We processed the retinas for indirect immunohistochemistry and stained them with antibodies recognizing α-crystallins, β-crystallins, and γ-crystallins (Fig 7). Controls included sections stained with secondary antibody only. In the control sections no labeling was observed, either background or specific to a retinal cell type (Fig. 7E). In all of these sections two very different patterns were observed for each of the antibodies. The sections were either lightly stained or there was an intense immunoreactivity. The intense immunolabeling observed for α-crystallin (BXD31, Fig. 7A) in the BXD retina contrasted with other sections such as the BXD62 strain, which were lightly labeled (Fig. 7B). In both cases the α-crystallin antibody labeled retinal cell layers including the photoreceptors, inner nuclear, and ganglion cell layers. In the intensely labeled section immunolabeling was also observed throughout the retina, and cells within the bipolar cell layer and the outer nuclear layer were heavily labeled. In addition there was labeling in the inner plexiform layer and intense punctate labeling (photoreceptor terminals) in the outer plexiform layer. The staining pattern for γ-crystallin is slightly different from that observed for α-crystallin. There is labeling of the ganglion cells in both sections stained for γ-crystallin (Fig 7C and D). In sections expressing high levels of γ-crystallin (BXD 62), there is also labeling in the inner nuclear layer and outer plexiform layer. There also appears to be increased labeling at the external limiting membrane and along the region of the inner segments where the Muller Cell microvilli are located (Fig 7C, BXD44). This staining pattern suggests that the Muller cells are also expressing members of the γ-crystallin family. When the section in figure 6D (BXD 62) is examined there is prominent labeling of the photoreceptors and ganglion cells. The immunohistochemistry data are similar to those observed with the immunoblot analysis in that some retinas have high expression and others low expression. The differences in immunolabeling persist even among mice with similar genetic backgrounds. These data provide further evidence supporting the notion that the expression of crystallins in the retina is highly variable with some retinas displaying relatively, high levels of crystallins, while other show relatively low expression.
Figure 7.
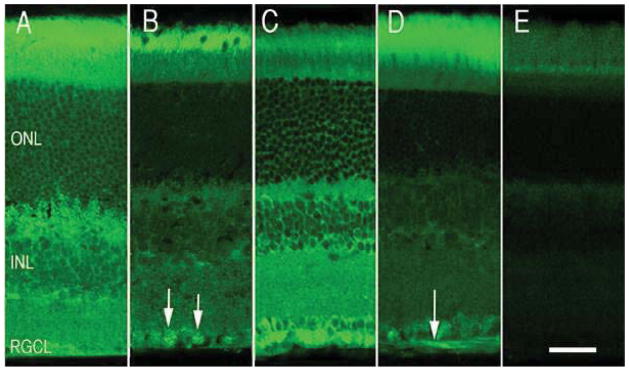
This figure shows the expression of αB-crystallin and γ-crystallin for two BXD RI strains. BXD 44 was one of the high expressing strains and BXD 62 was one of the low expressing strains. Retinas from these strains were immunostained to demonstrate the distribution of the proteins in the retina. Panels A and B are stained for α-crystallin and panels C and D are stained by γ-crystallin. A and C are from the high crystallin expressing retinas and D and F are from low expressing strain retinas. Labeling of retinal ganglion cells is indicated by arrows in B. The arrow in panel D indicates labeled retinal ganglion cell axons. The layers of the retina are labeled in A: outer nuclear layer (ONL), inner nuclear layer (INL) and retinal ganglion cell layer (RGCL). D is a photograph of a control sections stained with secondary antibody only. All photographs are taken at the same magnification and the scale bar in E represents 25 μm.
3.4 Transcription Factor Binding Site Analysis of Crystallin Network Genes
As an initial step to understand the co-regulation of crystallin network genes, the crystallin network genes (Table 2) and a selected group of control genes that were not coordinately regulated (Table 3) were analyzed for transcription factor (TF) binding site in their 5′ UTRs. None of the control gene set encode lens crystallins, and none of the genes had a Spearman correlation with Crygs above r = 0.5. This subset of genes was used in the subsequent analyses. The occurrence of TF binding sites between the 14 co-regulated (test) and 14 control genes were compared using statistical algorithms included in the Genomatix program (Genomatix Software GmbH, Munich). Table 4 shows a list of the analyzed TF binding sites either present in all members of the crystallin group or significantly associated with the crystallin group (p < 0.05). Overall, an average of 158 and 182 potential TF binding sites for 186 transcription factor matrix families were identified for each test and control gene, respectively, with V$AP1R and V$KLFS being the most common sites identified in each group. Of these, 8 transcription factor matrix families have a P< 0.05 when their occurrence is compared in test and control genes (Table 4). The NR2F family is included in table 4 because it is present in each member of the crystallin correlated group, even though the number of occurrences in correlated and non-correlated groups is not statistically significant because it was also common in the control group.
Table 3.
Control Genes for Comparison to the Crystallin Network
| Symbol | Description | Retina Expression | Record | ONC Expression |
|---|---|---|---|---|
| Abcd3 | ATP-binding cassette, family D, member 3 | 11.58 | ILMN_2925281 | 11.71 |
| Acin1 | apoptotic chromatin condensation inducer 1 | 9.37 | ILMN_2724347 | 9.05 |
| Calb2 | calbindin 2, (29kD, calretinin) | 15.72 | ILMN_2827729 | 15.24 |
| Calm2 | calmodulin 2 | 13.67 | ILMN_2856697 | 12.67 |
| Calu | calumenin | 11.21 | ILMN_2771956 | 11.28 |
| Clk2 | CDC-like kinase 2 | 10.70 | ILMN_1238520 | 10.77 |
| Clns1a | chloride channel, nucleotide-sensitive, 1A | 11.76 | ILMN_2691798 | 11.93 |
| Dguok | deoxyguanosine kinase | 10.89 | ILMN_1252649 | 11.02 |
| Dlgap4 | discs, large homolog-associated protein 4 | 10.88 | ILMN_3105499 | 10.71 |
| Nos3 | nitric oxide synthase 3, endothelial cell | 10.91 | ILMN_2713835 | 11.01 |
| Nphp1 | nephronophthisis 1 | 9.44 | ILMN_1245093 | 9.72 |
| Nr1i3 | nuclear receptor subfamily 1, group I, member 3 | 12.42 | ILMN_1232024 | 12.64 |
| Usp7 | ubiquitin specific peptidase 7 | 11.64 | ILMN_1235439 | 11.73 |
| Vav2 | vav 2 oncogene | 9.35 | ILMN_1225994 | 9.35 |
Table 4.
Transcription factor binding sites analysis-matrix family for the transcription factor binding sites are listed in the left column. Transcription factor binding sites included in each matrix are in the second column, titled Matrices. The average number of binding sites for the test genes is in the next column, while the average number of binding sites for control genes is seen in the following column. Results of a Student’s T test comparison of test and control genes are seen in the final column, with those matrices.
| Family name | Matrices name | Transcription factors in Human | Transcription factors in Mouse | Test average | Control average | T test P Value |
|---|---|---|---|---|---|---|
| O$PTBP | O$PTATA.01, O$PTATA.02 | N/A | N/A | 1.21428 | 0 | 0.00709 |
| O$VTBP | O$ATATA.01, O$LTATA.01, O$MTATA.01, O$VTATA.01, O$VTATA.02 | TBP, TBPL1, TBPL2 | Tbp, Tbpl1, Tbpl2 | 3 | 1.07143 | 0.01112 |
| V$AP1F | V$AP1.01, V$AP1.02, V$AP1.03, V$JUNDM2.02 | BATF, BATF3, FOS, FOSB, FOSL1, FOSL2, JDP2, JUN, JUNB, JUND | Batf, Batf3, Fos, Fosb, Fosl1, Fosl2, Jdp2, Jun, Junb, Jund | 1.5 | 0.21429 | 0.02114 |
| V$AP1R | V$BACH1.01, V$BACH2.01, V$MAFA.01, V$MAFB.01, V$MAFK.01, V$MARE.01, V$MARE.02, V$MARE.03, V$MARE_ARE. 01, V$NFE2.01, V$NRL.01, V$TCF11MAFG.01, V$VMAF.01 | BACH1, BACH2, MAF, MAFA, MAFB, MAFF, MAFG, MAFK, NFE2, NFE2L1, NFE2L2, NFE2L3, NRL | Bach1, Bach2, Maf, Mafa, Mafb, Maff, Mafg, Mafk, Nfe2, Nfe2l1, Nfe2l2, Nfe2l3, Nrl | 4.42857 | 1.85714 | 0.00036 |
| V$NF1F | V$NF1.01, V$NF1.02, V$NF1.03, V$NF1.04 | NFIA, NFIB, NFIC, NFIX | Nfia, Nfib, Nfic, Nfix | 1 | 0.21429 | 0.01584 |
| V$PAX2 | V$PAX2.01 | PAX2 | Pax2 | 0.57143 | 0.07143 | 0.00427 |
| V$ZF05 | V$ZFP410.01 | ZNF410 | Znf410 | 0.64286 | 0.14286 | 0.03605 |
| V$KLFS | V$BKLF.01, V$BTEB3.01, V$EKLF.01, V$EKLF.02, V$GKLF.01, V$GKLF.02, V$GKLF.03, V$KKLF.01, V$KLF6.01, V$KLF7.01, V$KLF7.02 | KLF1, KLF12, KLF13, KLF15, K LF2, KLF3, KLF4, KLF6, KLF7, KLF8, KLF9 | Klf1, Klf12, Klf13, Klf15, Klf2, Klf3, Klf4, Klf6, Klf7, Klf8, Klf9 | 3.57143 | 5.35714 | 0.04791 |
| V$NR2F | V$ARP1.01, V$COUP.01, V$COUP.02, V$HNF4.01, V$HNF4.02, V$HNF4.03, V$HNF4A.01, V$HPF1.01, V$PNR.01, V$TR2.01, V$TR2_TR4.01, V$TR4.01, V$TR4.02 | HNF4A, HNF4G, NR2C1, NR2C2, NR2E3, NR2F1, NR2F2, NR2F6, ZNF83 | Hnf4a, Hnf4g, Nr2c1, Nr2c2, Nr2e3, Nr2f1, Nr2f2, Nr2f6 | 2.42857 | 1.92857 | 0.42878 |
Of the 9 matrix families shown in Table 4, 3 are present in every test crystallin gene: V$AP1R, V$KLFS, and V$NR2F. Among these 3 matrix families, V$KLFS is slightly favored in the control gene set, and V$NR2F, is not significantly enriched in either set. However, the TF binding site family AP1R is the site most significantly increased in the test gene set seen in the analysis, with p < 0.00036. The AP1R matrix binds MAF and AP1 related factors, including MAFA, MAFB, MAFG and others as shown in Table 4. Out of these binding sites, MAFA is the most abundant in the test genes (occurring in 12 out of 14 of the Crystallin genes). However, while MAFA is associated with the crystallin correlated group, the presence of a MAF or MAFA site does not necessarily imply high expression in the retina overall. For example, genes including a MAF site are expressed at a level of 8.2 (just above the mean mRNA expression level of 8), but overall expression of the set of genes containing MAFA sites is just 7, (2 fold below the mean expression level). Maf also appears to be a more likely candidate for modulating the network given that its correlated expression across the BXD RI strains is 0.78 with Cryab and 0.72 with Crygs: while, the best correlation for MafA is 1.6 Cryab for and 0.16 for Crygs. The correlation data point to MAF as a candidate TF; however, analysis of the binding sites suggests that MAFA, as a known transcription factor, is also an appropriate transcription factor.
3.5 Validation of Shared TF Binding Sites by Chromatin Immunoprecipitation
While bioinformatic analysis of TF binding sites in promoter regions provides support for the role of the MAF family of TFs in co-regulation of the test gene set, the mere presence of a binding site does not guarantee that the site is functional. The identified TF binding sites were confirmed to be occupied, and hence probably functional, using a chromosome immunoprecipitation assay for the MAFA protein. The CHIP results of chromatin from human lens cells (HLEC) are shown in Figure 8A, while those obtained with chromatin from rat ganglion cells are shown in Figure 8B. In each figure, the PCR products of untreated input DNA are shown as a positive control, while negative control precipitations performed without MAFA antibody are shown in the bottom panel. Amplified promoter sequences precipitated by specific antibody to MAFA are shown in the middle panel. All PCR products were designed to be between 100 and 200 base pairs. Genes for which the CHIP DNA shows the same PCR product as input DNA have bound MAFA transcription factor, suggesting that MAFA has a regulatory role in expression of the gene. In HLE cells, antibody to MAFA co-precipitates CRYGA and CRYGD (Figure 8A), while In RGC cells, antibody to MAFA co-precipitates CRYAB, CRYBA1, CRYBB3, and CRYGA (Figure 8B).
Figure 8.

ChIP analysis of MAFA binding to co-regulated promoters. Lanes were loaded with non-immunoprecipitated (In-put), MAFA primary antibody immunoprecipitated (Ab+), or non-immune IgG antibody immuno-precipitated (Ab−) samples. In the human lens cell line FHL124 CRYAA, CRYBA1, CRYBA2, CRYBA4, CRYBB3, CRYGA, CRYGB, CRYGC,CRYGD and CRYGN promoter are shown, (panel A). In the rat retinal ganglion cell line RGC5 Cryaa_1, Cryaa_2, Cryab, Cryba1, Crybb2, Crybb3, Cryga_1, Cryga_2, Crygb, Crygc, Crygd, Cryge and Crygn are shown. Specific bands were detected in CRYGA, CRYGD, Cryab, Cryba1, Crybb3 and Cryga, (panel B).
4. Discussion
In the retina, one of the largest variations in gene expression across the BXD RI strain set is a group of tightly co-regulated genes that contain members of the crystallin families along with a small group of additional genes. This group of tightly co-regulated genes forms a network, here termed the crystallin network. However, across the BXD RI strains expression of crystallin network transcripts display over a 1000 fold difference in expression between individual animals. We have also shown that these large changes are also observed in the protein expression from animal to animal and from eye to eye. There remains a lingering possibility that these massive changes in retinal crystallin expression are due in part to contamination of lens into the retinal samples. This is highly unlikely, for we have taken extreme care in dissecting the retina and we can see similar dramatic changes in two different hippocampal datasets within the GeneNetwork datasets (neither hippocampal datasets were produced by our retina group). The highly correlated expression of genes in the crystallin network, suggests that there might be a common regulatory element controlling the expression of these genes in the retina and in the hippocampus. Given the variability within individual BXD RI strain in the HEI Retina Dataset, it is not possible at the present time to determine the genetic contribution to the modulation of the crystallin network. It is clear that this is a very tightly regulated network and as such it must be under the control of a specific set of regulatory elements.
In the present study, rather than showing a unimodal variation of expression, members of the crystallin network appear to show bimodal expression, being in one of two states, low expression or highly upregulated (up to 1,000 fold). At the present time we do not know the exact trigger that is involved in the upregulation of the crystallin network. We do know that it can be affected by optic nerve crush in the BXD RI Strains (personal observation), for Crygs in the normal retina the mean expression is 14.0 (standard error of 0.31) and in the ONC dataset the mean expression if 15.6 (standard error 0.40). This difference is statistically different (p < 0.001) using a Student t test. Although the difference is significant, it is not absolute. In many of the strains 2 days after nerve crush, there were some animals with high crystallin expression and some with low expression. Therefore even though ONC caused a statistically significant increase in gene expression across 176 samples not all of the mice within the dataset have upregulated crystallins. Thus, ONC increases the likelihood that the crystallins will be upregulated but it is not an absolute trigger for the event in all eyes.
In previous studies in the mouse (Templeton et al., 2009) and the rat (Vazquez-Chona et al., 2004) we have observed changes in the expression of crystallins following insults to the retina, and others also have reported (Ahmed et al., 2004; Piri et al., 2007; Sakaguchi et al., 2003), dramatic changes in crystallin expression in response to retinal injury, both upregulated and down regulated. In the Sprague-Dawley rat crystallins were upregulated after photocoagulation (Sakaguchi et al., 2003). In the Wistar (Piri et al., 2007) and the Brown Norway rat (Ahmed et al., 2004), crystallin expression goes down after IOP is elevated. In the naturally occurring DBA/2J mouse model of glaucoma, Steele et al. (Steele et al., 2006) found that crystallins are down-regulated in the retina. In the C57BL/6 mouse, crystallins are upregulated after laser burns in the retina (Wilson et al., 2003). In all of these studies, the average responses of crystallins were examined rather than the response of individual eyes. A recent study from our laboratory revealed the response of the crystallins could differ dramatically depending upon the strain of mouse (Templeton et al., 2009). Following optic nerve crush, we found that a group of α, β, and γ-crystallins were upregulated following injury in the DBA/2J mouse and down-regulated in the C57BL/6 mouse. If we just look at the individual control animals, one of the 3 C57BL/6 mice has very high levels of crystallins while 2 have relatively low levels. This varying level of crystallin expression in the control mice pushed the mean of this strain high (Templeton et al., 2009). However, the strain means do not really reflect dramatic changes occurring in individual eyes.
Expression of members of the crystallin network varied profoundly. Each member of the network was present in one of two states either relatively low expression or approximately 1000 fold upregulated. This group of transcripts forms a tightly co-regulated genetic network. The level of expression of members of the crystallin network is dramatically different between strains, between animals within a single strain and even between eyes from a single animal. This variability makes it difficult to postulate a rational molecular trigger that regulates the upregulation of the crystallin network. This variability in crystallin expression observed in the present study is not unique to the present study. Xi et al.9 (Xi et al., 2003) also observed dramatic differences in the levels of crystallin expression between samples. They observed differences in the level of RNA and crystallin protein and postulated that the levels of crystallins may reflect differences in metabolic status or the level of cellular stress. They (Xi et al., 2003) suggested that differences in crystallin expression be interpreted cautiously. The presence study confirms that the levels of crystallins do indeed vary considerably from animal to animal and eye to eye. It is still tempting to suggest that the differences in the level of crystallin expression is related to a stress inducing stimulus; however, at the present time there is no definitive proof for a molecular mechanism to support this hypothesis.
Several previous studies have shown that crystallin proteins provide a neuroprotective role in the central nervous system. αB-Crystallin has been shown to bind to Bax and Bcl-Xs (Mao et al., 2004) and αA-crystallin has been shown to bind to cytochrome C and caspase 3 (Yaung et al., 2007) (McGreal et al., 2012). A model has been proposed showing that by sequestering these pro-apoptotic proteins crystallins prevent apoptotic cell death. The crystallins can protect cells in the outer retina from apoptosis (Sreekumar et al., 2010). Even with the variability in crystallin expression we have observed from animal to animal and eye to eye, there is a statistically significant (p < 0.01, student t test) increase in crystallin expression in the BXD RI strains 2 days following optic nerve crush (see ONC Retina Database, GeneNetwork.org). Our data are consistent with the hypothesis that injury induces upregulation of crystallin genes in an attempt to protect retinal ganglion from cell death. Testing this hypothesis will require additional experimental data.
Both the extralenticular functions of lens crystallins and the regulation of their expression are being delineated. While expression of crystallins is constitutive in the eye lens, they have been shown to be stress proteins in some extralenticular tissues, and are expressed at various levels in others (Andley, 2009). A subset of lens crystallins, along with some additional lens and non-lens proteins, are coordinately regulated in a variety of tissues and under a variety of different stimuli (Andley, 2007). In this project, fourteen Crystallin genes that had a high co-expression coefficient in the retina after the optic nerve crush were analyzed for common binding sites in and around their promoter regions. While many transcription factors contribute to lens development and crystallin expression, binding sites for only a subset of these are enriched in members of the co-regulated genes identified in our study. By comparing the TF binding sites of the crystallin genes with those of fourteen control genes, we were able to identify binding sites for the MAF transcription factor family, especially MAFA, as a candidate to effect this co-regulation. To verify that these sites actually bind MAFA as a further test of the hypothesis that MAFA has a regulatory role in co-expression of the crystallins, chromatin immunoprecipitation with antibodies to MafA was carried out. The result showed that MafA was bound to the 5′ regulatory regions of CRYGA and CRYGD in human lens epithelial cells (HLE), and of Cryab, Cryba1, Crybb3, and two binding sites in Cryga in rat retinal ganglion cells (RGC).
Maf proteins, basic-leucine zipper transcription factors belonging to the AP1 superfamily, are known to play important roles in a variety of development and differentiation processes in many tissues. Developmental studies of the MAF family members have been performed in a variety of species, and the cross species nomenclature of the MAF family is complicated. The historic names and similarities of the main members in the Maf family are shown in Table 5, although it should be noted that similarities between chicken MAFA and all human members of the MAF family are 45–50%. Previous studies have shown that MafA is a critical regulator of crystallin gene expression in the chick lens as well as other tissues (Cvekl and Duncan, 2007; Kondoh et al., 2004). In the pancreas, MAF family members are critical for islet beta cell development (Yang et al., 2004) and MAFA has been implicated in diabetes (Butler et al., 2012).
Table 5.
Comparison of nomenclature of MAF family members in various species and their homologies.
| Human | Mouse(Percent Identity to Human) | Rat (Percent Identity to Human) | Chicken (Percent Identity to Human) | |
|---|---|---|---|---|
| MAF | MAF, c-MAF, CCA4 | Maf, v-maf, c-maf (89.5) | Maf, C-Maf, Maf2 (90.4) | maf, c-maf (45) |
| MAFA | MAFA, hMafA, RIPE3b1 | Mafa, RIPE3b1 (92) | Mafa, RGD1562627 (90.9) | L-MAF (45.6) |
| MAFB | MAFB, KRML, MCTO | Mafb, Kreisler, Krml, Krml1, kr (83.5) | Mafb, Krml, b-maf (89.3) | maf-B (63.4) |
The MAF family of transcription factors are known to regulate at least some members of the crystallin network in the lens and other tissues. In the chick lens MafA/L-Maf has been shown to bind to the αA-crystallin promoter (Cvekl et al., 1994; Ogino and Yasuda, 1998) and to regulate developmental expression of other crystallins including βB1- and δ-crystallin as well as having a central role in lens development (Cui et al., 2004; Reza and Yasuda, 2004; Shimada et al., 2003). MafA is also expressed in mouse lens epithelia and fiber cells (Takeuchi et al., 2009), where it has been shown to increase mouse αB-crystallin transcription 10 fold, with even greater activity when acting in concert with Pax6, RARβ/RXR/β, c-Maf, and NRL (Yang et al., 2004). MafA/L-Maf is expressed in cone cells of the outer nuclear layer the developing chick retina (Ochi et al., 2004), and in the quail neuroretina (Benkhelifa et al., 1998), where it can transactivate the QR1 promoter. Similarly, c-Maf, one of the other excellent candidates for regulation of the crystallin gene group, is critical in both lens and retinal development and crystallin expression (Yang and Cvekl, 2007). Mutations in c-MAF have been shown to cause cataracts in the human and mouse (Jamieson et al., 2002). All of these findings are consistent with a role of both Maf and MafA in crystallin and other gene expression in the lens and retina. Since they are co-regulated with the rest of the crystallin network, one plausible mechanism is that they are part of the transcriptional control process that carries out coordinated expression of this group. As suggested by their presence in the same binding site matrix, the binding sites for these factors are quite similar, differing by a few bases. It is possible that there is cross-stimulation by these two factors, although this has not been well studied. In contrast, some results, such as the differential stimulation of promoter activity by Maf and MafA(Yang et al., 2004) the requirement for Maf but not MafA in mouse lens development (Takeuchi et al., 2009), and the occurrence of cataracts in humans and mice with mutations in Maf (Jamieson et al., 2002) would indicate at least some degree of specificity.
Differences in MAFA occupancy of promoters seen here and MAFA action in these previous studies might relate to the requirement for additional transcription factors for binding and activity (Cvekl et al., 1994), to differences between the RGC and HLE cells used here and the intact lens, or perhaps to different experimental approaches. It has been shown that MafA protein stability is regulated by phosphorylation at multiple serine and threonine residues (Kataoka, 2007), and that the transcriptional activity of MafA is regulated by SUMOylation (Kanai et al., 2010). The results presented here strongly suggest that the high expression and co-regulation of crystallins is might be under the control of the Maf family, and perhaps MafA among other transcription factors. These studies represent the initial step in identifying transcription regulation of the gene in the crystallin network in the retina. These interactions may be the beginning of studies to further delineate crystallin activation pathways further. In addition, we hope to demonstrate that overexpression of MafA in cultured cells induces expression of various members of the test gene set. In addition to furthering our understanding of regulation of extralenticular expression of lens crystallins, these studies might also suggest ways to interfere the process of nerve injury in a variety of circumstances.
Acknowledgments
This work is supported by NEI grant RO1017841 and an Unrestricted Grant from Research to Prevent Blindness (UTHSC).
Footnotes
Publisher's Disclaimer: This is a PDF file of an unedited manuscript that has been accepted for publication. As a service to our customers we are providing this early version of the manuscript. The manuscript will undergo copyediting, typesetting, and review of the resulting proof before it is published in its final citable form. Please note that during the production process errors may be discovered which could affect the content, and all legal disclaimers that apply to the journal pertain.
References
- Ahmed F, Brown KM, Stephan DA, Morrison JC, Johnson EC, Tomarev SI. Microarray analysis of changes in mRNA levels in the rat retina after experimental elevation of intraocular pressure. Invest Ophthalmol Vis Sci. 2004;45:1247–1258. doi: 10.1167/iovs.03-1123. [DOI] [PubMed] [Google Scholar]
- Andley UP. Crystallins in the eye: Function and pathology. Prog Retin Eye Res. 2007;26:78–98. doi: 10.1016/j.preteyeres.2006.10.003. [DOI] [PubMed] [Google Scholar]
- Andley UP. Effects of alpha-crystallin on lens cell function and cataract pathology. Curr Mol Med. 2009;9:887–892. doi: 10.2174/156652409789105598. [DOI] [PubMed] [Google Scholar]
- Benkhelifa S, Provot S, Lecoq O, Pouponnot C, Calothy G, Felder-Schmittbuhl MP. mafA, a novel member of the maf proto-oncogene family, displays developmental regulation and mitogenic capacity in avian neuroretina cells. Oncogene. 1998;17:247–254. doi: 10.1038/sj.onc.1201898. [DOI] [PubMed] [Google Scholar]
- Bhat SP, Horwitz J, Srinivasan A, Ding L. AlphaB-crystallin exists as an independent protein in the heart and in the lens. European Journal of Biochemistry. 1991;202:775–781. doi: 10.1111/j.1432-1033.1991.tb16432.x. [DOI] [PubMed] [Google Scholar]
- Bloemendal H, de Jong WW. Lens proteins and their genes. Prog Nucleic Acid Res Mol Biol. 1991;41:259–281. doi: 10.1016/s0079-6603(08)60012-4. [DOI] [PubMed] [Google Scholar]
- Butler AE, Robertson RP, Hernandez R, Matveyenko AV, Gurlo T, Butler PC. Beta cell nuclear musculoaponeurotic fibrosarcoma oncogene family A (MafA) is deficient in type 2 diabetes. Diabetologia. 2012;55:2985–2988. doi: 10.1007/s00125-012-2666-2. [DOI] [PMC free article] [PubMed] [Google Scholar]
- Clayton RM, Jeanny JC, Bower DJ, Errington LH. The presence of extralenticular crystallins and its relationship with transdifferentiation to lens. Current Topics in Developmental Biology. 1986;20:137–151. doi: 10.1016/s0070-2153(08)60660-2. [DOI] [PubMed] [Google Scholar]
- Cui W, Tomarev SI, Piatigorsky J, Chepelinsky AB, Duncan MK. Mafs, Prox1, and Pax6 can regulate chicken betaB1-crystallin gene expression. Journal of Biological Chemistry. 2004;279:11088–11095. doi: 10.1074/jbc.M312414200. [DOI] [PubMed] [Google Scholar]
- Cvekl A, Duncan MK. Genetic and epigenetic mechanisms of gene regulation during lens development. Prog Retin Eye Res. 2007;26:555–597. doi: 10.1016/j.preteyeres.2007.07.002. [DOI] [PMC free article] [PubMed] [Google Scholar]
- Cvekl A, Sax CM, Bresnick EH, Piatigorsky J. Complex array of positive and negative elements regulates the chicken alphaA-crystallin gene: involvement of Pax-6, USF, CREB and/or CREM, and AP-1 proteins. Molecular and Cellular Biology. 1994;14:7363–7367. doi: 10.1128/mcb.14.11.7363. [DOI] [PMC free article] [PubMed] [Google Scholar]
- Graw J. Genetics of crystallins: cataract and beyond. Exp Eye Res. 2009;88:173–189. doi: 10.1016/j.exer.2008.10.011. [DOI] [PubMed] [Google Scholar]
- Head MW, Peter A, Clayton RM. Evidence for the extralenticular expression of members of the beta-crystallin gene family in the chick and a comparison with delta-crystallin during differentiation and transdifferentiation. Differentiation. 1991;48:147–156. doi: 10.1111/j.1432-0436.1991.tb00253.x. [DOI] [PubMed] [Google Scholar]
- Hejtmancik JF, Kaiser-Kupfer MI, Piatigorsky J. Molecular biology and inherited disorders of the eye lens. In: Scriver CRBA, Valle D, et al., editors. The Metabolic and Molecular Basis of Inherited Disease. McGraw Hill; New York, NY: 2001. pp. 6033–6062. [Google Scholar]
- Horwitz J. Alpha-crystallin can function as a molecular chaperone. Proc Natl Acad Sci U S A. 1992;89:10449–10453. doi: 10.1073/pnas.89.21.10449. [DOI] [PMC free article] [PubMed] [Google Scholar]
- Jaenicke R, Slingsby C. Lens crystallins and their microbial homologs: structure, stability, and function. Crit Rev Biochem Mol Biol. 2001;36:435–499. doi: 10.1080/20014091074237. [DOI] [PubMed] [Google Scholar]
- Jamieson RV, Perveen R, Kerr B, Carette M, Yardley J, Heon E, Wirth MG, van HV, Donnai D, Munier F, Black GC. Domain disruption and mutation of the bZIP transcription factor, MAF, associated with cataract, ocular anterior segment dysgenesis and coloboma. Hum Mol Genet. 2002;11:33–42. doi: 10.1093/hmg/11.1.33. [DOI] [PubMed] [Google Scholar]
- Kanai K, Reza HM, Kamitani A, Hamazaki Y, Han SI, Yasuda K, Kataoka K. SUMOylation negatively regulates transcriptional and oncogenic activities of MafA. Genes Cells. 2010;15:971–982. doi: 10.1111/j.1365-2443.2010.01431.x. [DOI] [PubMed] [Google Scholar]
- Kannan R, Sreekumar PG, Hinton DR. Novel roles for alpha-crystallins in retinal function and disease. Prog Retin Eye Res. 2012 doi: 10.1016/j.preteyeres.2012.06.001. [DOI] [PMC free article] [PubMed] [Google Scholar]
- Kataoka K. Multiple mechanisms and functions of maf transcription factors in the regulation of tissue-specific genes. J Biochem. 2007;141:775–781. doi: 10.1093/jb/mvm105. [DOI] [PubMed] [Google Scholar]
- Kondoh H, Uchikawa M, Kamachi Y. Interplay of Pax6 and SOX2 in lens development as a paradigm of genetic switch mechanisms for cell differentiation. Int J Dev Biol. 2004;48:819–827. doi: 10.1387/ijdb.041868hk. [DOI] [PubMed] [Google Scholar]
- Mao YW, Liu JP, Xiang H, Li DW. Human alphaA- and alphaB-crystallins bind to Bax and Bcl-X(S) to sequester their translocation during staurosporine-induced apoptosis. Cell Death Differ. 2004;11:512–526. doi: 10.1038/sj.cdd.4401384. [DOI] [PubMed] [Google Scholar]
- McGreal RS, Lee Kantorow W, Chauss DC, Wei J, Brennan LA, Kantorow M. alphaB-crystallin/sHSP protects cytochrome c and mitochondrial function against oxidative stress in lens and retinal cells. Biochim Biophys Acta. 2012;1820:921–930. doi: 10.1016/j.bbagen.2012.04.004. [DOI] [PMC free article] [PubMed] [Google Scholar]
- Ochi H, Sakagami K, Ishii A, Morita N, Nishiuchi M, Ogino H, Yasuda K. Temporal expression of L-Maf and RaxL in developing chicken retina are arranged into mosaic pattern. Gene Expr Patterns. 2004;4:489–494. doi: 10.1016/j.modgep.2004.03.005. [DOI] [PubMed] [Google Scholar]
- Ogino H, Yasuda K. Induction of lens differentiation by activation of a bZIP transcription factor, L-Maf. Science. 1998;280:115–118. doi: 10.1126/science.280.5360.115. [DOI] [PubMed] [Google Scholar]
- Piri N, Song M, Kwong JM, Caprioli J. Modulation of alpha and beta crystallin expression in rat retinas with ocular hypertension-induced ganglion cell degeneration. Brain Res. 2007;1141:1–9. doi: 10.1016/j.brainres.2006.11.095. [DOI] [PubMed] [Google Scholar]
- Rao NA, Saraswathy S, Wu GS, Katselis GS, Wawrousek EF, Bhat S. Elevated retina-specific expression of the small heat shock protein, alphaA-crystallin, is associated with photoreceptor protection in experimental uveitis. Invest Ophthalmol Vis Sci. 2008;49:1161–1171. doi: 10.1167/iovs.07-1259. [DOI] [PubMed] [Google Scholar]
- Reza HM, Yasuda K. Roles of Maf family proteins in lens development. Dev Dyn. 2004;229:440–448. doi: 10.1002/dvdy.10467. [DOI] [PubMed] [Google Scholar]
- Sakaguchi H, Miyagi M, Darrow RM, Crabb JS, Hollyfield JG, Organisciak DT, Crabb JW. Intense light exposure changes the crystallin content in retina. Exp Eye Res. 2003;76:131–133. doi: 10.1016/s0014-4835(02)00249-x. [DOI] [PubMed] [Google Scholar]
- Santana A, Waiswo M. The genetic and molecular basis of congenital cataract. Arq Bras Oftalmol. 2011;74:136–142. doi: 10.1590/s0004-27492011000200016. [DOI] [PubMed] [Google Scholar]
- Shimada N, Aya-Murata T, Reza HM, Yasuda K. Cooperative action between L-Maf and Sox2 on delta-crystallin gene expression during chick lens development. Mech Dev. 2003;120:455–465. doi: 10.1016/s0925-4773(03)00002-9. [DOI] [PubMed] [Google Scholar]
- Smolich BD, Tarkington SK, Saha MS, Grainger RM. Xenopus gamma-crystallin gene expression: evidence that the gamma-crystallin gene family is transcribed in lens and nonlens tissues. Molecular and Cellular Biology. 1994;14:1355–1363. doi: 10.1128/mcb.14.2.1355. [DOI] [PMC free article] [PubMed] [Google Scholar]
- Sreekumar PG, Kannan R, Kitamura M, Spee C, Barron E, Ryan SJ, Hinton DR. alphaB crystallin is apically secreted within exosomes by polarized human retinal pigment epithelium and provides neuroprotection to adjacent cells. PLoS One. 2010;5:e12578. doi: 10.1371/journal.pone.0012578. [DOI] [PMC free article] [PubMed] [Google Scholar]
- Steele MR, Inman DM, Calkins DJ, Horner PJ, Vetter ML. Microarray analysis of retinal gene expression in the DBA/2J model of glaucoma. Invest Ophthalmol Vis Sci. 2006;47:977–985. doi: 10.1167/iovs.05-0865. [DOI] [PubMed] [Google Scholar]
- Takeuchi T, Kudo T, Ogata K, Hamada M, Nakamura M, Kito K, Abe Y, Ueda N, Yamamoto M, Engel JD, Takahashi S. Neither MafA/L-Maf nor MafB is essential for lens development in mice. Genes Cells. 2009;14:941–947. doi: 10.1111/j.1365-2443.2009.01321.x. [DOI] [PubMed] [Google Scholar]
- Templeton JP, Nassr M, Vazquez-Chona F, Freeman-Anderson NE, Orr WE, Williams RW, Geisert EE. Differential response of C57BL/6J mouse and DBA/2J mouse to optic nerve crush. BMC Neurosci. 2009;10:90. doi: 10.1186/1471-2202-10-90. [DOI] [PMC free article] [PubMed] [Google Scholar]
- Vazquez-Chona F, Song BK, Geisert EE., Jr Temporal changes in gene expression after injury in the rat retina. Invest Ophthalmol Vis Sci. 2004;45:2737–2746. doi: 10.1167/iovs.03-1047. [DOI] [PMC free article] [PubMed] [Google Scholar]
- Wilson AS, Hobbs BG, Shen WY, Speed TP, Schmidt U, Begley CG, Rakoczy PE. Argon laser photocoagulation-induced modification of gene expression in the retina. Invest Ophthalmol Vis Sci. 2003;44:1426–1434. doi: 10.1167/iovs.02-0622. [DOI] [PubMed] [Google Scholar]
- Wistow GJ, Piatigorsky J. Lens crystallins: the evolution and expression of proteins for a highly specialized tissue. Annu Rev Biochem. 1988;57:479–504. doi: 10.1146/annurev.bi.57.070188.002403. [DOI] [PubMed] [Google Scholar]
- Xi J, Farjo R, Yoshida S, Kern TS, Swaroop A, Andley UP. A comprehensive analysis of the expression of crystallins in mouse retina. Mol Vis. 2003;9:410–419. [PubMed] [Google Scholar]
- Yang Y, Chauhan BK, Cveklova K, Cvekl A. Transcriptional regulation of mouse alphaB- and gammaF-crystallin genes in lens: opposite promoter-specific interactions between Pax6 and large Maf transcription factors. Journal of molecular biology. 2004;344:351–368. doi: 10.1016/j.jmb.2004.07.102. [DOI] [PubMed] [Google Scholar]
- Yang Y, Cvekl A. Large Maf Transcription Factors: Cousins of AP-1 Proteins and Important Regulators of Cellular Differentiation. Einstein J Biol Med. 2007;23:2–11. doi: 10.23861/ejbm20072347. [DOI] [PMC free article] [PubMed] [Google Scholar]
- Yaung J, Jin M, Barron E, Spee C, Wawrousek EF, Kannan R, Hinton DR. alpha-Crystallin distribution in retinal pigment epithelium and effect of gene knockouts on sensitivity to oxidative stress. Mol Vis. 2007;13:566–577. [PMC free article] [PubMed] [Google Scholar]