

Abstract
Object
Because convection-enhanced delivery relies on bulk flow of fluid in the interstitial spaces, MR imaging techniques that detect extracellular fluid and fluid movement may be useful for tracking convective drug distribution. To determine the tracking accuracy of T2-weighted and diffusion-weighted MR imaging sequences, the authors followed convective distribution of radiolabeled compounds using these imaging sequences in nonhuman primates.
Methods
Three nonhuman primates underwent thalamic convective infusions (5 infusions) with 14C-sucrose (MW 342 D) or 14C-dextran (MW 70,000 D) during serial MR imaging (T2- and diffusion-weighted imaging). Imaging, histological, and autoradiographic findings were analyzed.
Results
Real-time T2- and diffusion-weighted imaging clearly demonstrated the region of infusion, and serial images revealed progressive filling of the bilateral thalami during infusion. Imaging analysis for T2- and diffusion-weighted sequences revealed that the tissue volume of distribution (Vd) increased linearly with volume of infusion (Vi; R2 = 0.94, R2 = 0.91). Magnetic resonance imaging analysis demonstrated that the mean ± SD Vd/Vi ratios for T2-weighted (3.6 ± 0.5) and diffusion-weighted (3.3 ± 0.4) imaging were similar (p = 0.5). While 14C-sucrose and 14C-dextran were homogeneously distributed over the infused region, autoradiographic analysis revealed that T2-weighted and diffusion-weighted imaging significantly underestimated the Vd of both 14C-sucrose (mean differences 51.3% and 52.3%, respectively; p = 0.02) and 14C-dextran (mean differences 49.3% and 59.6%; respectively, p = 0.001).
Conclusions
Real-time T2- and diffusion-weighted MR imaging significantly underestimate tissue Vd during convection-enhanced delivery over a wide range of molecular sizes. Application of these imaging modalities may lead to inaccurate estimation of convective drug distribution.
Keywords: accuracy, convection-enhanced delivery, drug distribution, imaging, magnetic resonance imaging, volume of distribution, oncology
Convection-enhanced delivery (CED) utilizes a small hydrostatic pressure gradient to distribute infusate through the interstitial spaces of CNS parenchyma by bulk flow.2,5,6 Recently, to more accurately track the distribution of drug infusate from the point of infusion, preclinical and clinical studies have incorporated real-time MR imaging to monitor drug delivery using either therapeutic agents labeled with imaging compounds or coinfused surrogate imaging tracers.4,7,8,12 Alternatively, because CED relies on bulk flow of interstitial fluid, MR imaging techniques that can detect increased extracellular space fluid or fluid flow have been proposed as potential methods to track convective drug distribution.
While prior studies have established that accurate monitoring of convective drug delivery can be achieved using labeled drugs or coinfused surrogate imaging tracers,4,7,11 MR pulse sequences that detect interstitial fluid or flow have been advanced as an alternative way to track interstitial convective drug distribution. Subsequently, T2-weighted and diffusion-weighted MR imaging sequences to visualize drug distribution with CED have been used,9,13 but the tracking accuracy of these techniques has not been established. To determine the tracking accuracy of these imaging sequences, we infused nonhuman primate brains with variable-sized radiolabeled compounds.
Methods
Three adult nonhuman primates (Macaca mulatta) were used in this study. The study was approved by the National Institute for Neurological Disorders and Stroke Animal Care and Use Committee at the National Institutes of Health.
Preparation of 14C-Sucrose and 14C-Dextran Infusate
Either 14C-sucrose or 14C-dextran (American Radio-labeled Compounds, Inc.) was used in infusions as defined in the text. Both compounds were diluted to 2.7–3.0 μCi/ml in phosphate-buffered saline before infusion.
Convective Infusion of 14C-Sucrose and 14C-Dextran
Animals underwent thalamic convective infusion (volume of infusion [Vi] 65.0–90.0 μl) of 14C-sucrose or 14C-dextran, as previously described.4 Briefly, after the animals were placed under general anesthesia and the scalps were incised, 1-cm bur holes were placed in the skull over the left and right target sites exposing the underlying dura. Multiported targeting array pedestals (Bankiewicz Laboratory, University of California, San Francisco) were secured to the skull with nylon screws and Triad Gel adhesive (DENTSPLY International, Inc.). A single step-infusion cannula (Bankiewicz Lab) was passed through the selected alignment hole in the left and right targeting array pedestals to the target site. Bilateral thalamic infusions (infusion rate of 0.1–3 μl/minute) were performed using a gastight noncompliant convective infusion system, as previously described.4 Animals were killed on completion of the infusions, and the brains were immediately harvested and snap frozen.
Imaging of 14C-Sucrose and 14C-Dextran Distribution
After confirmation of accurate cannulae placement on coronal T1-weighted MR imaging, the infusions were started. Upon initiation of infusion, T2-weighted (0.5-mm slice thickness) and diffusion-weighted (2.5-mm slice thickness) images in the coronal, axial, and sagittal planes were obtained using a 3-T MR imaging unit (Philips). Images were obtained at approximately 10- to 20-minute intervals until the infusions were completed.
Effectiveness of MR Pulse Sequences for CED Monitoring
Quantitative Autoradiography (QAR)
Twenty-micrometer-thick serial sections (every fifth section) through the infused brain regions were prepared for QAR, as previously described.4,5,11 Briefly, after development of autoradiographic images from tissue sections and 14C standards, the area of infusate distribution from each tissue section was obtained using a segmentation threshold (10% of maximal optical density from infused region),4 and the volume of distribution (Vd) from each perfused area was calculated, as previously described.4,5,11
Magnetic Resonance Imaging Analysis
Analysis of MR images of the bilateral thalamic infusions was performed using an imaging workstation (PACS, DICOM Solutions) based on 2 methods, including direct visualization (T2-weighted and diffusion-weighted) and automated processing (T2-weighted). Direct visual analysis was performed using the regions of interest that were identified as increased signal regions on T2- and diffusion-weighted images. The increased signal areas on each image were outlined, and their cross-sectional area was measured using the free-hand cursor tool. The Vd for each infusion was calculated by multiplying the sum of the areas of distribution on either side by the slice thickness. Automated analysis of T2-weighted images was also performed using a completely automated tool developed at the National Institutes of Health and implemented in Matlab (MathWorks). Automated processing was based on the premise that the location of maximum intensity (from infusate) found in a slice varies slowly over time in corresponding slices. Based on these observations, an initial mask was automatically derived through morphological operations (erosion and dilation) over the central half of a slice from the final series. This results in a mask with areas slightly greater than the area of infusate distribution. The centroid for each of the 2 bilateral areas of distribution was then used as the seed for an iterative region-growing algorithm that terminated when a fixed threshold was reached. Centroids for corresponding slices from the series immediately before a subsequent series were then adjusted by searching for a local maximum in a 5 × 5 neighborhood of the previous centroids. The new locations are then used as seeds for region growing for the slice. Finally, voxels obtained from region growing were summed over all slices for a particular time series and multiplied by voxel size to obtain total Vd for the time series.
Homogeneity Analysis
Specific activity (concentration) was determined from optical density measurements along a line across the infused region on 14C-sucrose and 14C-dextran autoradiograms. These values were plotted on a graph to derive a concentration-distance profile. Differences in specific activity were analyzed across the plateau region of infusion.
Statistical Analysis
Statistical analysis was performed using Prism software (Mozilla Labs) as defined in text. For all statistical tests, a p value < 0.05 was considered significant.
Results
T2-Weighted and Diffusion-Weighted Imaging of Convective Infusion
Feasibility
To determine the feasibility and properties of T2- and diffusion-weighted imaging tracking of convective delivery over a wide molecular size range, we infused the thalami of nonhuman primates (Vi 65–90 μl) with either 14C-sucrose or 14C-dextran (Table 1). During convective infusion, T2- and diffusion-weighted MR imaging sequences demonstrated increased intensity in the region of perfusion, consistent with interstitial fluid delivery. Over the course of infusate delivery, the region of infusion was clearly demarcated from the immediately surrounding noninfused parenchyma on T2-weighted and diffusion-weighted imaging (Figs. 1 and 2). Both sequences showed that the regions of increased MR signal expanded around the tips of the cannulae as the infusions progressed (Figs. 1 and 2).
Table 1. Tracking accuracy of T2-weighted and diffusion-weighted MR imaging for 14C-sucrose and 14C-dextran distribution*.
| Animal No. | Thalamus | Infused Compound | Vi (μl) | QAR Vd (mm3) | QAR Vd/Vi | T2-Weighted MRI | Diffusion-Weighted MRI | ||||
|---|---|---|---|---|---|---|---|---|---|---|---|
|
|
|
||||||||||
| Vd (mm3) | Vd/Vi | % Difference w/QAR | Vd (mm3) | Vd/Vi | % Difference w/QAR | ||||||
| 1 | rt | 14C-sucrose | 65 | 405.9 | 6.3 | 191.7 | 3.0 | −57.7 | 241.1 | 3.7 | −40.6 |
| lt | 14C-sucrose | 65 | 466.7 | 7.2 | 257.7 | 4.0 | −44.8 | 168.1 | 2.6 | −64.0 | |
| 2 | rt | 14C-dextran | 89 | 608.6 | 6.9 | 280.0 | 3.2 | −54.0 | 195.4 | 3.3 | −67.9 |
| lt | 14C-dextran | 89 | 586.4 | 6.6 | 324.8 | 3.7 | −44.6 | 219.8 | 3.7 | −51.2 | |
| 3 | lt | 14C-sucrose | 65 | NA | NA | 293.8 | 4.1 | NA | 200.1 | 3.3 | NA |
| mean | 6.8 | 3.6 | −50.3 | 3.3 | −55.9 | ||||||
NA = not available.
Fig. 1.
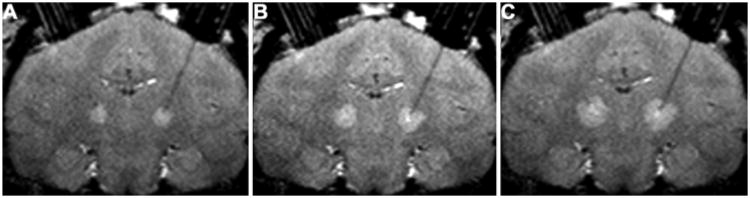
Coronal T2-weighted MR images obtained in a primate brain after infusion of 15 μl (A), 30 μl (B), and 60 μl (C) of 14C-dextran. Infusion of 14C-dextran solution provides a distinct region of T2-weighted hyperintensity in each thalamus compared with surrounding noninfused parenchyma.
Fig. 2.

Coronal diffusion-weighted MR images obtained in a primate brain after infusion of 15 μl (A), 30 μl (B), and 60 μl (C) of 14C-dextran. Infusion of 14C-dextran solution provides a distinct region of diffusion-weighted hyperintensity in each thalamus compared with surrounding noninfused parenchyma.
Imaging Vd/Vi Ratio
Real-time MR imaging volumetric analysis was performed to establish serial Vd/Vi ratios during the infusion as detected by T2- and diffusion-weighted imaging sequences. The distinct T2- and diffusion-weighted imaging appearance of the infused 14C-sucrose or 14C-dextran in the bilateral thalami allowed for precise volumetric MR imaging analysis of the visible infusate. During the infusions, the Vd seen on T2-weighted imaging increased linearly (R2 = 0.94) with the Vi in animals infused with solutions of 14C-sucrose and 14C-dextran (Fig. 3). Similarly, volumetric analysis of the infused region as assessed by diffusion-weighted imaging revealed that the Vd of the region of increased signal increased linearly with increasing Vi (R2 = 0.91) (Fig. 4). Overall, the mean (± SD) Vd/Vi ratios over the volumes infused using T2-weighted imaging (3.6 ± 0.5) were similar to those using diffusion-weighted imaging (3. 3 ± 0.4) (p = 0.5, ANCOVA test) when measured by direct visualization.
Fig. 3.

Graph demonstrating a linear relationship (R2 = 0.94) between Vd with T2-weighted MR imaging and Vi in primates infused with 14C-sucrose and 14C-dextran. The mean Vd/Vi ratio was 3.6 ± 0.5 (mean ± SD).
Fig. 4.

Graph demonstrating a linear relationship (R2 = 0.91) between Vd with diffusion-weighted MR imaging and Vi in primates infused with 14C-sucrose and 14C-dextran. The mean Vd/Vi ratio was 3.3 ± 0.4 (mean ± SD).
To determine the accuracy of the direct visualization analysis in determining T2-weighted Vd, we performed automated analysis of T2-weighted images in Animal 2 (Table 1). The accuracy of both techniques was underscored by the similar Vd/Vi ratios obtained by both techniques. Specifically, the Vd/Vi ratios obtained using direct visual analysis for T2-weighted imaging (mean 3.6 ± 0.5) was the same as the Vd/Vi ratios obtained using automated imaging processing (mean 3.4 ± 0.2) (p = 0.95, ANCOVA test).
Tracking Accuracy of T2-Weighted and Diffusion-Weighted Imaging
To establish the tracking accuracy of T2- and diffusion-weighted MR imaging sequences for convective infusate monitoring, we compared the anatomical and volumetric distribution of the increased signal regions seen on these T2- and diffusion-weighted imaging studies with the anatomical and volumetric distribution of 14C-sucrose and 14C-dextran as demonstrated and measured by QAR (Fig. 5). Whereas QAR and MR images demonstrated similar anatomical epicenters of infusion, the Vd as demonstrated by T2- and diffusion-weighted imaging sequences was significantly less (Table 1) than the actual distribution of 14C-sucrose and 14C-dextran as determined by QAR analysis.
Fig. 5.

Coronal T2-weighted (A) and diffusion-weighted (B) MR images obtained after CED of 88 μl of radiolabeled 14C-dextran into the right thalamus. The insets show the corresponding autoradiograms of 14C-dextran distribution and demonstrates the spatial inaccuracy and underestimation of T2-weighted and diffusion-weighted MR imaging volumes of distribution compared with drug distribution determined by autoradiography.
The mean Vd/Vi ratios for 14C-sucrose and 14C-dextran from QAR analysis were 6.8 ± 0.6 and 6.8 ± 0.2, respectively (p = 1.0, 2-tailed t-test). The Vd as defined by the increased signal areas on T2- and diffusion-weighted imaging sequences (by hand and by automated analysis) consistently and similarly underestimated the infusate distribution of 14C-sucrose (small molecule) and 14C-dextran (large molecule) (Table 1). The mean underestimation of actual infusate delivery by T2-weighted imaging was 50.3% ± 6.6% (p = 0.0002, 2-tailed t-test). The mean underestimation of actual infusate delivery by diffusion-weighted imaging was 55.9% ± 12.5% (p = 0.005, 2-tailed t-test).
Homogeneity of Infusion
To assess the infusate homogeneity over the perfused thalamic regions, autoradiographic analysis of the concentration based on specific activity of 14C-sucrose and 14C-dextran was performed. The QAR analysis revealed that the concentration of 14C-sucrose and 14C-dextran in the perfused brain regions was homogeneous, as demonstrated by square-shaped concentration profiles associated with steep decreases in concentration at the infused region limits (Fig. 6).
Fig. 6.

Autoradiographic analysis of 14C-dextran concentration across the infused region. The concentration profile, based on specific activity, was square-shaped with a steep drop-off at the margins indicative of a relatively uniform concentration over the infused region.
Discussion
Imaging of Convective Delivery
Previous clinical studies have demonstrated that infusion of solute introduced into the brain by CED can be visualized using T2- and diffusion-weighted MR imaging. The inherent properties of T2-weighted imaging are such that the relaxation rate is inversely proportional to the water content of tissue. Thus, T2-weighted imaging detects increased fluid in the interstitial space and could be suited to track the distribution of a convective infusion within the interstitium of the brain.3,14 Furthermore, attenuation of signal resulting from diffusion allows for identification of fluid flow within the interstitium with diffusion-weighted imaging. Hence, diffusion-weighted imaging may also be useful for detecting convective flow of the infusate. The ability of these modalities to detect increased fluid and fluid flow in the interstitial spaces of the CNS suggests that T2- and diffusion-weighted sequences could have utility in tracking CED.
Previous Studies
Recently, Sampson and colleagues13 described the use of T2-weighted imaging to monitor convective delivery of interleukin-13 Pseudomonas exotoxin (IL13-PE) in patients with recurrent malignant gliomas. They compared features of T2-weighted imaging with those of SPECT imaging of a coinfused radiotracer (123I-human serum albumin) during CED of IL13-PE. They found that T2-weighted hyperintensity surrounding the infusion cannula tip was consistent with surrounding tissue perfusion as demonstrated by 123I-human serum albumin SPECT imaging. Alternatively, the lack of T2-weighted hyperintensity surrounding the infusion cannula tip was consistent with subarachnoid leakage of infusate. Furthermore, T2-weighted imaging (performed 24 hours after infusion initiation) was associated with a mean Vd (5.5 ± 1.5 cm3) that was 45% larger than that of the coinfused 123I-human serum albumin (3.8 ± 1.3 cm3).
While the study by Sampson and colleagues13 provided critical early information regarding the feasibility of T2-weighted imaging during CED, several limitations precluded the assessment of convective tracking accuracy of T2-weighted imaging. First, while a close correlation was demonstrated between T2-weighted and SPECT imaging at delayed time points (48 hours after infusion initiation), there was a significant difference in Vd at earlier time points (24 hours after infusion initiation). Second, the quantitative accuracy of 123I-human serum albumin as an SPECT surrogate tracer for convective drug distribution has not been established, and the low spatial resolution of SPECT may preclude precise determination of the Vd of a drug or tracer by CED. This is particularly relevant for tracking CED to small nuclear and subnuclear brain structures that may be targeted in the future for treatment of a variety of common neurological disorders. Third, infusions were performed primarily in the white matter of the patients, and information regarding gray matter infusions was not available. Finally, preexisting increased T2 signal within intrinsic brain tumors and other brain lesions significantly limit the practicality of tracking CED using T2-weighted imaging.
Current Study
Visual Detection of Convective Infusion Using T2- and Diffusion-Weighted Imaging
T2-weighted and diffusion-weighted MR imaging sequences permitted visualization of convection-associated increased fluid volume or fluid flow within the interstitial spaces of the CNS for small (14C-sucrose, MW 342 D) and large (14C-dextran, MW 70,000 D) molecular weight compounds. Both T2-weighted and diffusion-weighted imaging demonstrated hyperintense increased fluid or fluid flow into the region surrounding the tip of the infusion cannula for both compounds. Furthermore, the approximate region of infusion surrounding the infusion cannula could be seen filling steadily with an increasing Vi. The infused regions on both T2-weighted and diffusion-weighted imaging were clearly demarcated from surrounding noninfused brain parenchyma during the course of the infusion (Figs. 1 and 2).
Tracking Accuracy
We found significant tracking inaccuracies for T2-weighted or diffusion-weighted imaging compared with infusate distribution over a range of molecular weights (sucrose, MW 342 D; dextran, MW 70,000 D). The mean Vd/Vi ratios for the 14C-sucrose solution using T2-weighted and diffusion-weighted imaging sequences were 3.7 and 3.2, respectively (Figs. 3 and 4). The mean Vd/Vi ratios for 14C-dextran solution using T2- and diffusion-weighted sequences were both 3.5 (Figs. 3 and 4). The Vd/Vi ratios derived from T2- and diffusion-weighted imaging sequences were significantly less than the mean Vd/Vi ratio of 6.8 for 14C-sucrose and 14C-dextran by QAR analysis (Fig. 5; Table 1). Alternatively, the QAR-derived Vd/Vi ratios were similar to distribution predicted by Gd-diethylenetriamine pentaacetic acid (Gd-DTPA) surrogate tracer imaging during convective delivery (mean 7.4 ± 0.9),1 further confirming the accuracy of this tracking modality over a wide molecular size range. Overall, T2-weighted imaging underestimated delivery of sucrose and dextran by 50% and diffusion-weighted imaging underestimated delivery of sucrose and dextran by 56%.
There are several potential reasons that T2- and diffusion-weighted imaging did not accurately track convective delivery in this study. For instance, T2-weighted and diffusion-weighted imaging may not have been sensitive enough to detect interstitial infusate at the leading edge of the infusion. Specifically, the degree of interstitial fluid expansion or fluid flow at points distant from the infusion cannula might have been below the level of detection of these MR imaging techniques and indistinguishable from the background signal intensity of noninfused brain parenchyma. Additionally, nonnegligible cellular activity-induced displacement of water due to processes such as axonal transport and dynamic intracellular changes in water motion, may contribute to overall reductions in signal obtained from these MR imaging techniques.10
Recently, Valles and colleagues16 qualitatively studied the accuracy of T2-weighted imaging to predict aromatic L-amino acid decarboxylase (AADC) expression 5 weeks after infusion of adeno-associated virus serotype 2 (AAV2) encoding for AADC in nonhuman primates. Consistent with the current results, they demonstrated that the mean Vd/Vi ratio associated with T2-weighted imaging was 4.1 ± 0.9. Although Vd of AADC expression was not quantified, the T2-weighted imaging distribution of convective infusion correlated with immunohistochemical AADC expression. Findings from the study by Valles and colleagues were also consistent with the QAR-determined Vd/Vi ratio of 4.1 ± 0.2 reported by Szer lip and colleagues15 for convective infusion of 35S-AAV capsids. Taken together, these data indicate that certain very large nano-particles including viral capsids with well-described, significantly lower Vd/Vi ratios might be accurately tracked, or the volume of expression of AAV genecoding vectors might be predicted using T2-weighted or diffusion-weighted imaging techniques.
Homogeneity of Infusion
The distribution of each compound was homogeneous in the targeted gray matter infusion site. Analysis of 14C-sucrose and 14C-dextran density using QAR revealed uniformity and a steep dropoff at the margins of the infused area (Fig. 6). The finding of a square-shaped concentration profile and similar Vd/Vi ratios between different size molecules is consistent with the bulk flow properties that underlie CED and have been described in previous CNS CED investigations.4–6 The current study demonstrates that T2-weighted and diffusion-weighted MR images significantly underestimate volumes of infused compounds. The inaccuracy of these techniques in tracking compounds delivered by convection limits their clinical application, as accurate visualization of distribution volumes is highly desirable for real-time imaging of CED. Furthermore, as homogeneous concentration profiles are calculated based on QAR, delivered concentrations of compounds might be underestimated if T2-weighted or diffusion-weighted imaging were used to estimate volumes of drug distribution with CED.1
Conclusions
Real-time T2- and diffusion-weighted MR imaging significantly underestimate tissue Vd during CED over a wide range of molecular sizes. Therefore, application of these imaging modalities may lead to inaccurate estimation of convective drug distribution.
Acknowledgments
Disclosure: This work was supported by the intramural research program at the National Institute of Neurological Disorders and Stroke at the National Institutes of Health.
Abbreviations used in this paper
- AADC
aromatic l-amino acid decarboxylase
- AAV2
adeno-associated virus serotype 2
- CED
convection-enhanced delivery
- IL13-PE
interleukin-13 Pseudomonas exotoxin
- QAR
quantitative autoradiography
- Vd
volume of distribution
- Vi
volume of infusion
Footnotes
Author contributions to the study and manuscript preparation include the following. Conception and design: Lonser, Walbridge, Iyer. Acquisition of data: Lonser, Iyer, Butman, Walbridge. Analysis and in terpretation of data: all authors. Drafting the article: Lonser, Iyer. Critically revising the article: all authors. Statistical analysis: Lonser, Iyer, Butman, Gai. Administrative/technical/material support: Lonser, Butman, Walbridge, Heiss. Study supervision: Lonser, Iyer, Butman, Walbridge.
References
- 1.Asthagiri AR, Walbridge S, Heiss JD, Lonser RR. Effect of concentration on the accuracy of convective imaging distribution of a gadolinium-based surrogate tracer Laboratory investigation. J Neurosurg. 2011 May 27; doi: 10.3171/2011.3.JNS101381. epub ahead of print. [DOI] [PMC free article] [PubMed] [Google Scholar]
- 2.Bobo RH, Laske DW, Akbasak A, Morrison PF, Dedrick RL, Oldfield EH. Convection-enhanced delivery of macromolecules in the brain. Proc Natl Acad Sci U S A. 1994;91:2076–2080. doi: 10.1073/pnas.91.6.2076. [DOI] [PMC free article] [PubMed] [Google Scholar]
- 3.Gwan K, Edzes HT. Water in brain edema. Observations by the pulsed nuclear magnetic resonance technique. Arch Neurol. 1975;32:462–465. doi: 10.1001/archneur.1975.00490490066006. [DOI] [PubMed] [Google Scholar]
- 4.Heiss JD, Walbridge S, Asthagiri AR, Lonser RR. Image-guided convection-enhanced delivery of muscimol to the primate brain. Laboratory investigation. J Neurosurg. 2010;112:790–795. doi: 10.3171/2009.7.JNS09652. [DOI] [PMC free article] [PubMed] [Google Scholar]
- 5.Lieberman DM, Laske DW, Morrison PF, Bankiewicz KS, Oldfield EH. Convection-enhanced distribution of large molecules in gray matter during interstitial drug infusion. J Neurosurg. 1995;82:1021–1029. doi: 10.3171/jns.1995.82.6.1021. [DOI] [PubMed] [Google Scholar]
- 6.Lonser RR, Gogate N, Morrison PF, Wood JD, Oldfield EH. Direct convective delivery of macromolecules to the spinal cord. J Neurosurg. 1998;89:616–622. doi: 10.3171/jns.1998.89.4.0616. [DOI] [PubMed] [Google Scholar]
- 7.Lonser RR, Walbridge S, Garmestani K, Butman JA, Walters HA, Vortmeyer AO, et al. Successful and safe perfusion of the primate brainstem: in vivo magnetic resonance imaging of macromolecular distribution during infusion. J Neurosurg. 2002;97:905–913. doi: 10.3171/jns.2002.97.4.0905. [DOI] [PubMed] [Google Scholar]
- 8.Mamot C, Nguyen JB, Pourdehnad M, Hadaczek P, Satio R, Bringas JR, et al. Extensive distribution of liposomes in rodent brains and brain tumors following convection-enhanced delivery. J Neurooncol. 2004;68:1–9. doi: 10.1023/b:neon.0000024743.56415.4b. [DOI] [PubMed] [Google Scholar]
- 9.Mardor Y, Roth Y, Lidar Z, Jonas T, Pfeffer R, Maier SE, et al. Monitoring response to convection-enhanced taxol delivery in brain tumor patients using diffusion-weighted magnetic resonance imaging. Cancer Res. 2001;61:4971–4973. [PubMed] [Google Scholar]
- 10.Nevo U, Ozarslan E, Komlosh ME, Koay CG, Sarlls JE, Basser PJ. A system and mathematical framework to model shear flow effects in biomedical DW-imaging and spectroscopy. NMR Biomed. 2010;23:734–744. doi: 10.1002/nbm.1591. [DOI] [PMC free article] [PubMed] [Google Scholar]
- 11.Nguyen TT, Pannu YS, Sung C, Dedrick RL, Walbridge S, Brechbiel MW, et al. Convective distribution of macromolecules in the primate brain demonstrated using computerized tomography and magnetic resonance imaging. J Neurosurg. 2003;98:584–590. doi: 10.3171/jns.2003.98.3.0584. [DOI] [PubMed] [Google Scholar]
- 12.Saito R, Bringas JR, McKnight TR, Wendland MF, Mamot C, Drummond DC, et al. Distribution of liposomes into brain and rat brain tumor models by convection-enhanced delivery monitored with magnetic resonance imaging. Cancer Res. 2004;64:2572–2579. doi: 10.1158/0008-5472.can-03-3631. [DOI] [PubMed] [Google Scholar]
- 13.Sampson JH, Raghavan R, Provenzale JM, Croteau D, Reardon DA, Coleman RE, et al. Induction of hyperintense signal on T2-weighted MR images correlates with infusion distribution from intracerebral convection-enhanced delivery of a tumor-targeted cytotoxin. AJR Am J Roentgenol. 2007;188:703–709. doi: 10.2214/AJR.06.0428. [DOI] [PubMed] [Google Scholar]
- 14.Steen RG. Edema and tumor perfusion: characterization by quantitative 1H MR imaging. AJR Am J Roentgenol. 1992;158:259–264. doi: 10.2214/ajr.158.2.1729777. [DOI] [PubMed] [Google Scholar]
- 15.Szerlip NJ, Walbridge S, Yang L, Morrison PF, Degen JW, Jarrell ST, et al. Real-time imaging of convection-enhanced delivery of viruses and virus-sized particles. J Neurosurg. 2007;107:560–567. doi: 10.3171/JNS-07/09/0560. [DOI] [PubMed] [Google Scholar]
- 16.Valles F, Fiandaca MS, Eberling JL, Starr PA, Larson PS, Christine CW, et al. Qualitative imaging of adeno-associated virus serotype 2-human aromatic L-amino acid decarboxylase gene therapy in a phase I study for the treatment of Parkinson disease. Neurosurgery. 2010;67:1377–1385. doi: 10.1227/NEU.0b013e3181f53a5c. [DOI] [PubMed] [Google Scholar]