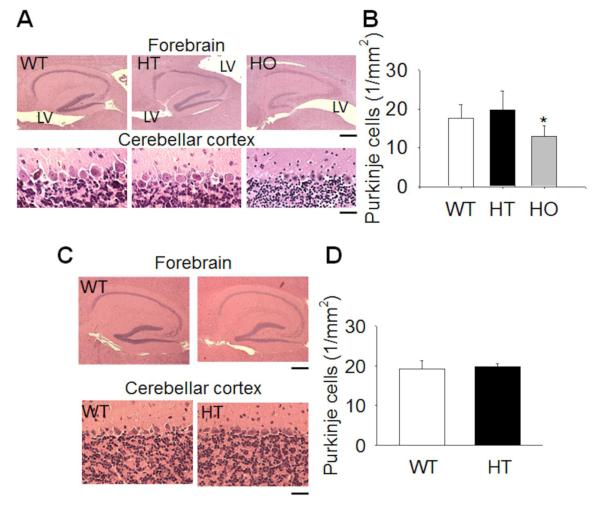
Figure 3. Neuronal phenotype in B6 mice.
(A) Histological examination (hematoxylin/eosin staining) showing neuronal loss in the hippocampal regions (upper panels, Bar = 400 μm) and in the cerebellar cortex (lower panels, Bar = 60 μm) of 1 month old mice. LV: lateral ventricle. (B) Quantification of cerebellar Purkinje cells. Data are the mean±s.d. of 3 mice per group; *p<0.02. (C) Hematoxylin/eosin staining of the hippocampal regions (upper panels, Bar = 400 μm) and cerebellar cortex (lower panels, Bar = 60 μm) of 12 months old mice. WT: wild-type. HT: heterozygous. (D) Quantification of cerebellar Purkinje cells. Data are the mean±s.d. of 3 mice per group. Differences are statistically not significant (p=0.72).

