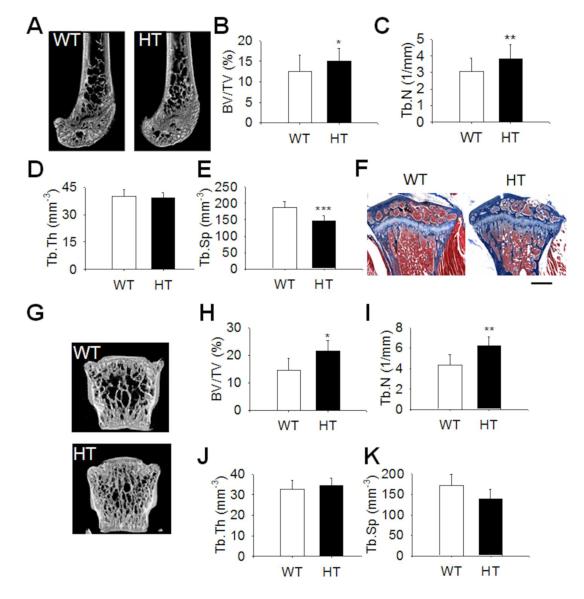
Figure 4. Bone structural parameters of 3 months old wild-type (WT) and heterozygous (HT) p.G213R-Clcn7 knock-in B6 ADO2 mice.
(A) μCT images of distal femurs. (B) Trabecular bone volume (BV/TV), (C) number (Tb.N), (D) thickness (Tb.Th) and (E) separation (Tb.Sp). (F) Masson’s trichromic staining of proximal tibia. Bar=500 μm. (G) μCT images of L2 vertebra. (H) Vertebral trabecular bone volume (BV/TV), (I) number (Tb.N), (J) thickness (Tb.Th) and (K) separation (Tb.Sp). Data are representative (A,F,G) or the mean±s.d. (B-E, H-K) of 4-16 mice/group. In (B-E) *p=0.046; **p=0.014; ***p=0.0000005. In (H-I) *p=0.021; **p=0.014. In (D,J,K) data are statistically not significant (p>0.3).

