Abstract
In a recent article (Gudlur et al., (2012) PLOS ONE, 7 (9) e45374) we described the special properties of a mixed branched peptide assembly in which equimolar bis(FLIVI)-K-KKKK and bis(FLIVIGSII)-K-KKKK self-associate to form bilayer delimited capsules capable of trapping solutes. These poly-cationic vesicle-like capsules are readily taken up by epithelial cells in culture, escape or evade the endocytic pathway, and accumulate in the peri-nuclear region where they persist without any apparent degradation. In this report we examine the lipid-like properties of this system including initial assembly; solute encapsulation and washing; fusion and resizing by membrane extrusion through polycarbonate filters with defined pore sizes. The resized peptide capsules have uniform diameters in nm size ranges. Once resized, the capsules can be maintained at the new size by storing them at 4° C. Having the ability to prepare stable uniform nano-scale capsules of desired sizes makes them potentially attractive as biocompatible delivery vehicles for various solutes/drugs.
Keywords: nano capsules, peptide capsules, branched amphiphilic peptides, self-assembling peptides, peptide vesicles
Introduction
There is a need for new safe drug delivery vehicles that can better target specific tissues or organs and minimize off-target accumulation1. In Gudlur et al.2, we described, for the first time, a drug delivery system in which two peptides of different lengths; and designed to mimic diacyl glycerols (Fig. 1) form water filled vesicles. In that paper we referred to these constructs as vesicles. Owing to the heuristic association of lipids with vesicles; we have introduced the term ‘capsule’ in an effort to negate the confusion between our peptidic nano-spheres and traditional lipid vesicles.
Figure 1.
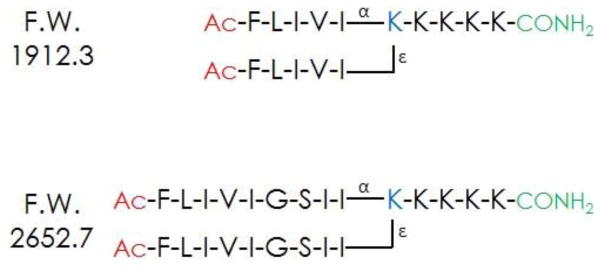
Branched Bilayer Forming Sequences
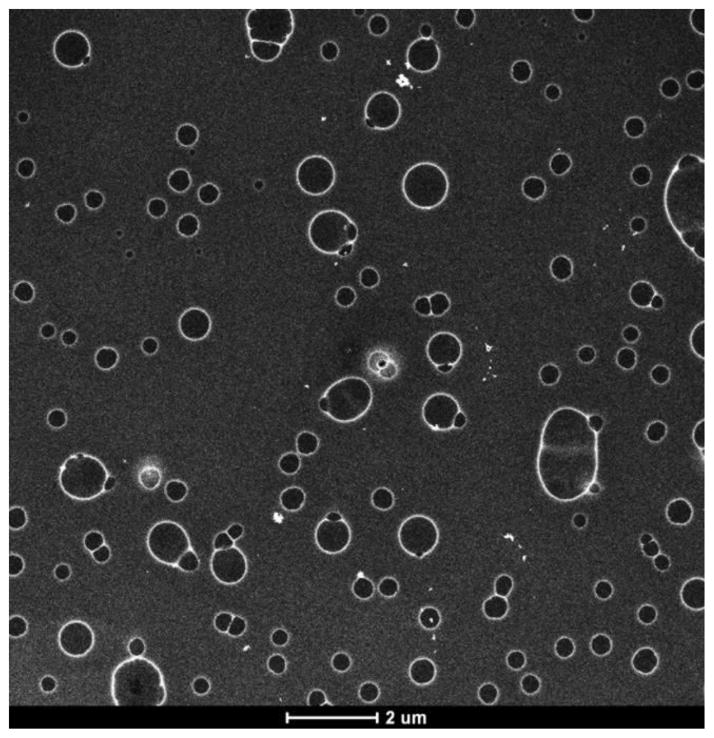
The branch point lysine orients the two peptide segments at a 90° angle, similar to the geometry of diacyl phospholipids. The bis(FLIVI)-K-KKKK and bis(FLIVIGSII)-K-KKKK peptides together self-assemble with beta-like secondary structure to form a new class of capsules that are readily taken up by cells in culture while retaining trapped solutes. Since neither peptide alone forms stable capsules, we hypothesized that two sizes are required to accommodate the curvature of assembled capsules. The fact that they undergo self-assembly gives us the ability to modify individual peptides with various ligands or markers that can then be incorporated into the aggregate. In the first paper we adducted the C-terminal lysine with fluorescent dyes and in another case included a cysteine residue at the C-terminus that was used to attach methyl mercury2. The labeled peptides are usually incorporated at 30 mole percent with unlabeled peptides, without affecting assembly or cellular uptake. The peptide capsules were also tested for thermal stability using Differential Scanning Calorimetry up to 95°C and were found to maintain their structural and functional integrity at all studied temperatures. In this study we report on the phospholipid vesicle-like characteristics of our assemblies. The peptides are mixed and dried as monomers. Within minutes of adding water to the dried peptides, fibrils form, which soon coalesce into 20 nm capsules. It is during this phase that solutes become entrapped. Thereafter, the capsules begin fusing, and by 24 h appear as much larger structures (up to 1 μm, with most having diameters of 50–200 nm) (see Fig. 2). We were able to follow the fusion process by observing the dilution of a self-quenching fluorescent dye. Since cell and tissue uptake is size dependent, we also examined the effects of extruding the larger capsules through membranes with various pore sizes. Dropping the temperature to 4° C suspends the fusion process allowing for storage of the uniform sized material. These studies together provide further evidence supporting the hypothesis that these branched sequences self-assemble into bilayers and form capsules in an aqueous environment.
Figure 2. Scanning Transmission Electron Micrograph (STEM) Hg-Labeled Peptides 24 hr after mixing.
Capsules were prepared with 30% Me-Hg label in both peptides at 0.1 mM. The images were captured using annular dark field mode and then inverted to produce the final image.
Materials and Methods
Peptide Synthesis
Peptides were synthesized by solid phase peptide chemistry on 4-(2,4-Dimethoxyphenyl-Fmocaminomethyl) phenoxyacetyl-norleucyl-cross-Linked Ethoxylate Acrylate Resin3 (Peptides International Inc; Louisville, Kentucky) on a 0.1 mmol scale using Fmoc (N-(9-fluorenyl) methoxycarbonyl)/tert-butyl chemistry on an ABI Model 431 peptide synthesizer (Applied Biosystems; Foster City, CA). The Fmoc amino acids were obtained from Anaspec, Inc (Fremont, CA). The branch point was introduced by incorporating Nα,ε di-Fmoc-L-Lysine in the fifth position from the C-terminus. De-protection of this moiety leads to the generation of two reactive amino sites that subsequently and simultaneous generate the bifurcated peptide branch point. This enables the addition of the hydrophobic tail segments FLIVI and FLIVIGSII to the common hydrophilic oligo-Lysine segment by the stepwise addition of Fmoc amino acids4. The N-terminal ends of the peptide were acetylated on the resin using Acetic Anhydride/N, N-Diisopropylethylamine/1-Hydroxybenzotriazole prior to cleavage. The peptide was cleaved from the resin using TFA/water (98:2, v/v) for 90 min at RT to generate C-terminal carboxamide. The peptide product was washed 3× with diethyl ether and re-dissolved in water prior to lyophilization. The water used throughout this study is deionized, reverse osmosis treated and then distilled. The RP-HPLC purified peptides were dried in vacuo and characterized on a Bruker Ultraflex III matrix-assisted laser desorption ionization time of flight mass spectrometer (MALDI TOF/TOF) (Bruker Daltonics, Billerica, MA) using 2,5-dihydroxybenzoic acid matrix (Sigma-Aldrich Corp., St. Louis, MO). The dried peptides were stored at room temperature.
Peptide Modifications (Me-Hg-Cys)
The synthesis of the cysteine modified peptides were effected on a 0.1mmol scale with standard Fmoc(N-(9-fluorenyl)methoxycarbonyl)/tert-butyl chemistry on CLEAR-Amide Resin (Peptides International Inc; Louisville, Kentucky) by means of N-α-Fmoc-S-p-methoxytrityl-L–cysteine (Anaspec, Inc; Fremont, CA) coupled to the resin at C-terminus. The remainder of the synthesis, cleavage, post cleavage processing and characterization was performed as previously described, to generate bis(FLIVI)-K-KKKK-C-CONH2 and bis(FLIVIGSII)-K-KKKK-C-CONH2 respectively2. Both cysteine adducted peptides were solubilized in water and reacted with 1 equivalent of Methylmercury(II) iodide (Sigma-Aldrich Corp., St. Louis, MO) at pH 9.8 for 6 h at RT5, 6. The resulting solution was reduced in vacuo and subsequently lyophilized to generate the desired product. The percent methyl mercury incorporated was determined by measuring the concentration of free cysteine remaining after the coupling reaction. Unlabeled peptides of equal concentration served as the control. Samples were treated with 4 mg/mL 5, 5′-Dithiobis-(2-nitrobenzoic acid) (Sigma-Aldrich Corp., St. Louis, MO) in pH 8.2, 0.1 M phosphate buffer. The fully reacted sample absorbance values were measured at 412 nm on a CARY 50 Bio UV/Vis spectrophotometer (Varian Inc., Palo Alto, CA) using a 0.3 cm path length quartz cuvette (Starna Cells Inc., Atascadero, CA)7. The concentrations of the peptides were calculated using the molar extinction coefficient (ε) of phenylalanine residues (two per sequence) at 257.5 nm (195 cm−1 M−1)8, 9.
Capsule Formation and Encapsulation
The bis(FLIVI)-K-KKKK and bis(FLIVIGSII)-K-KKKK peptides were dissolved individually in neat 2,2,2-Trifluoroethanol. In this solvent the peptides are helical and monomeric thereby ensuring complete mixing when combined. Concentrations were determined as diluted samples in water using the absorbance of phenylalanine as previously described. The bis(FLIVI)-K-KKKK and bis(FLIVIGSII)-K-KKKK peptide samples were mixed in equimolar ratios to generate a final concentration of 0.1 mM, then dried in vacuo. The dried peptide samples were then hydrated to form capsules of desired concentration by the drop-wise addition of water.
S/TEM Sample Preparation
The 30% Me-Hg capsules were prepared in a manner similar to that previously detailed, by co-dissolving 0.7 mole equivalents of bis(FLIVI)-K-KKKK and bis(FLIVIGSII)-K-KKKK with 0.3 mole equivalents of their respective cysteine containing Me-Hg labeled variants in water, to a final concentration containing 0.1 mM each of bis(FLIVI)-K-KKKK and bis(FLIVIGSII)-K-KKKK. The dried peptide mixture was hydrated and allowed to stand for the indicted time intervals. Carbon Type A (15–25 nm) on 300 mesh support film grids with removable Formvar (Ted Pella Inc., Redding, CA) were immersed in chloroform to strip off the Formvar. These were subsequently negatively (hydrophilic) glow discharged10 at 5 mA for 20 s using a EMS 150 ES Turbo-Pumped Sputter Coater/Carbon Coater (Electron Microscopy Sciences, Hatfield, PA) - the carbon end of the grids being exposed to the plasma discharge making the carbon film hydrophilic and negatively charged, thus allowing easy spreading of aqueous suspensions. Capsule sample solutions (6 μL) were spotted on to grids and allowed to stand for 5 min, after which, excess solution was wicked off the grid with a Kimwipe™ tissue (Kimberly-Clark Worldwide Inc., Roswell, GA) and allowed to air dry before loading it into the FEI Tecnai F20XT Field Emission Transmission Electron Microscope (FEI North America, Hillsboro, Oregon) with a 0.18 nm STEM HAADF resolution and a 150X – 2306 × 106 X range of magnification11. Scanning transmission electron microscopy was carried out in the annular dark field mode with a single tilt of 17°.
Capsule Assembly Time Course Experiment
For the purposes of the time course experiment, 30% Me-Hg labeled 0.1mM, bis(FLIVIGSII)-K-KKKK:bis(FLIVI)-K-KKKK peptide capsules were prepared as before and spotted on negative glow discharged TEM grids at 0, 5, 25, 55 and 115 min post hydration to account for different time points (5,10, 30, 60 and 120 min respectively) during the process of assembly and fusion. For the purposes of the ‘0’ min time point; separate 2.5 μL 0.1mM bis(FLIVIGSII)-K-KKKK and 2.5 μL 0.1 mM bis(FLIVI)-K-KKKK peptide samples were co-spotted on to the grid immediately upon hydration. After letting the sample stand on the grid for 5 min, the excess solution was wicked off, and the sample stained with 5 μL of an aqueous solution of 2% multi-isotope Uranyl Acetate (Uranium bis(acetato-o)dioxo-dihydrate). This was then allowed to stand for 5 min, after which the excess stain was wicked off and the sample allowed to air dry before studying it under a FEI Tecnai F20XT Field Emission Transmission Electron Microscope in the previously specified manner.
Coarse-grained Modeling
A modified MARTINI force field2, 12–14 was used to describe the peptide and water molecules. The peptide backbone was represented by particle types for β secondary structure in the hydrophobic segments, and coil particle types for the poly-lysine C-termini. The thickness of the bilayer membrane and the average area of each peptide were calculated by performing 100 ns molecular dynamics (MD) simulations of pure model bilayers2. In order for the bilayer to maintain the capsule curvature restriction, the outside leaflet requires a greater amount of the longer peptide (2:1= bis(FLIVIGSII)-K-KKKK:bis(FLIVI) -K-KKKK) than the inside leaflet (1:2 = bis(FLIVIGSII)-K-KKKK:bis(FLIVI)-K-KKKK ). This ratio was based on preliminary results obtained using a titration assay that measured the solvent exposed thiols of added C-terminal cysteines in the assembled capsules (data not shown). To avoid overlap of peptides, the initial diameter (~28 nm) of the capsule is built larger than the experimentally observed 20nm. After 200 steps of energy minimization, a total of ~2 ns equilibrium simulations were carried out at 298K by incorporating several steps, in which harmonic potentials with gradually increasing strength was imposed on the peptides. All simulations were performed in CHARMM14, 15 on the Beocat Research Cluster at Kansas State University. VMD16 was used for preparation of the snapshots presented in this work.
Eosin Self-Quenching Curve
The fluorescence self-quenching of eosin was recorded by exciting 0, 10, 20, 40, 80, 90, 100, 125, 150, 175, 200, 400, 600, 800, 1000, 1500 and 2126 μM aqueous concentrations of eosin Y (Sigma-Aldrich Corp., St. Louis, MO) at 490 nm and scanning for observed emissions from 495–800 nm with a CARY Eclipse Fluorescence spectrophotometer (Varian Inc., Palo Alto, CA) (Scan rate: 600 nm/min; PMT detector voltage: 600 V; Excitation slit: 5 nm; Emission slit: 5 nm) using a 0.3 cm path length quartz cuvette. The resulting data was plotted as change in fluorescence intensity as well as change in λmax as a function of increasing eosin concentration. Fluorescence intensity was seen to increase with eosin Y concentration until about 100 μM after which the trend was reversed, and the intensity of fluorescence proceeded to decrease such that the fluorescence intensity of 1.13 mM eosin Y solution was lower than that of a 10 μM solution of the same. A consistent red shift of λmax towards higher wavelengths was witnessed as a function of increasing concentrations of eosin Y – all consistent with the phenomenon of fluorescence self-quenching17.
Salt Wash Study
The bis(FLIVIGSII)-K-KKKK:bis(FLIVI)-K-KKKK peptide capsules (1.0 mM) were prepared using the protocol described earlier. One hour post hydration, the capsule containing solution was centrifuged at 14,000 × g in Amicon ultra- 0.5 mL, 30K molecular weight cut-off (MWCO) centrifugal units with regenerated cellulose filters (Millipore, Billerica, MA) using a Thermo Electron Legend 14 personal micro-centrifuge (Thermo Fisher Scientific Inc., Waltham, MA). At the conclusion of the spin, the removable-filter unit was inverted and placed in a fresh tube and spun at 2000 × g for 5 min to recover the remaining volume containing the capsules. The filtered preformed capsules were then incubated a 2.13 mM aqueous eosin Y solution for 30 min to coat the exterior surface. The capsule-eosin solution was filtered as describe above to remove the excess eosin. This solution was used as a control and its fluorescence measured by excitation at 490 nm and scanning for observed emissions from 495–800 nm with a CARY Eclipse Fluorescence spectrophotometer as previously described. The samples were split into two aliquots – the first aliquot was washed with water prior to centrifugal MWCO filtration and the other with an equal volume of 200 mM Sodium Trifluoroacetate (Na-TFA, Sigma-Aldrich Corp., St. Louis, MO) - and simultaneously subjected to the MWCO centrifugation process along with isolation and re-solvation of the capsule containing solution. The samples were rescanned with the spectrometer. Subsequently both sample were washed and centrifuged with just water multiple times samples and measured for eosin fluorescence after each centrifugal cycle. A cycle by cycle comparison between water washed capsules versus Na-TFA salt-water washed capsules demonstrated a significant decrease in the eosin fluorescence signal.
Capsule Fusion Study
1.0 mM and 20.0 mM dried samples of bis(FLIVIGSII)-K-KKKK:bis(FLIVI)-K-KKKK peptide capsules were made in a manner analogous to the one previously described. Both these samples were simultaneously solvated; the 1 mM sample with aqueous 2.13 mM eosin Y and the 20.0 mM sample with water, and then allowed to stand for 30 min. All samples were subjected to three 30 kDa MWCO centrifugation process cycles starting with a 5 min incubation with 200 mM Na-TFA salt, and then spin filtered. For the second and third centrifugation cycles, the eosin encapsulating capsules were washed with water prior to centrifugation. At the end, both the 1.0 mM and 20.0 mM capsules were suspended in water; then immediately mixed in equal volumes; an aliquot of which was stored at 4°C and the other placed in a 0.3 cm quartz cuvette and scanned for observed emission from 495–800 nm for 4 h with a scan every 5 min, upon excitation at 490 nm, with a CARY Eclipse Fluorescence spectrophotometer (Scan rate: 600 nm/min; PMT detector voltage: 800 V; Excitation slitμ 5 nm; Emission slitμ 5 nm). The 4°C aliquot was scanned for change in fluorescence intensity at 6 h and 24 h intervals post mixing. The resulting data was plotted as change in intensity and change in λmax as a function of capsule fusion over time.
Resizing the Capsules
A 0.1 mM solution of bis(FLIVIGSII)-K-KKKK:bis(FLIVI)-K-KKKK peptide capsules with 30% Me-Hg label was prepared in a manner as described previously and allowed to stand for 24 h. A 6 μL aliquot was then loaded on a negatively glow discharged TEM grid, allowed to dry for 5 min, with the excess solution wicked off and then air dried as previously described. The 24 h capsule solution was divided into two parts and then individually loaded in gas-tight syringes and extruded respectively through 0.1 μm and 0.03 μm 19 mm Whatman® Nuclepore™ Track-Etched Polycarbonate Membranes using the Avanti® Mini-Extruder (Avanti Polar Lipids, Inc., Alabaster, AL); with at least 40 passes through the membrane per sample. The extruded samples were immediately spotted on negatively glow discharged TEM grids as with the 24 h sample and observed using a FEI Tecnai F20XT Field Emission Transmission Electron Microscope as before.
Beta Amyloid Test
Due to the speed at which these peptides adopt beta-structure in water we tested the sequences to see if they were amyloids using the Thioflavin T assay13. In the presence of amyloid proteins the fluorescence excitation and emission spectra of the dye are right shifted and enhanced emission at the new wavelength.
Results and Discussion
For this system to find utility as a drug delivery vehicle, there are numerous parameters requiring definition and control. These issues include — understanding capsule formation, controlling their size and tuning their stability. The work presented here addresses the first two of these properties. As shown in Fig. 2, at 24 h post hydration of the peptide mixture, we always observe a heterogeneous population of capsules. Preparing a defined and uniform size for these nano-capsules can be highly useful since size is known to play a key role in where these materials segregate when used in vivo19–22. Studies were performed to track capsule formation by following the time course for the appearance of the smallest observable capsules. Knowing this size provides guidance regarding the size of molecules capable of being entrapped. Even though larger capsules ultimately form due to fusion, this initial size likely limits the size of the trapped solutes added during the initial hydration step.
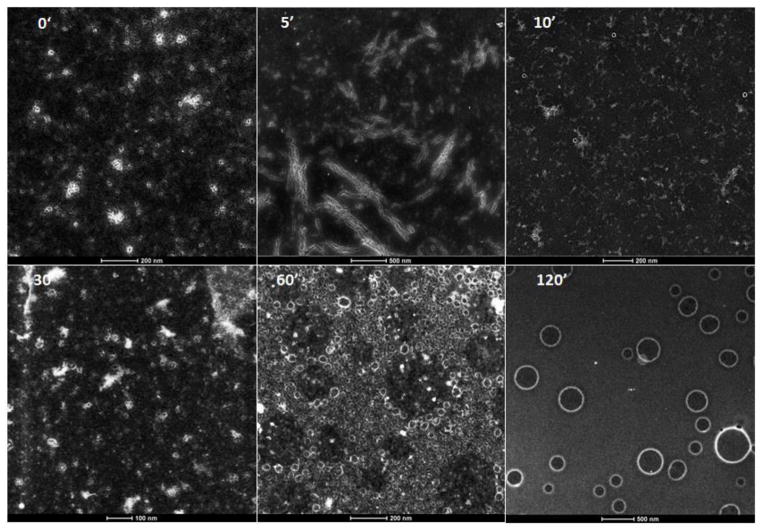
To begin, the four peptides— bis(FLIVI)-K-KKKK, bis(FLIVIGSII)-K-KKKK, bis(FLIVI)-K-KKKK- C-Hg-Me and bis(FLIVIGSII)-K-KKKK-C-Hg-Me are dissolved in 100% trifluoroethanol (TFE). A ratio of 1:1 is set for all of the FLIVI and FLIVIGSII peptides. The methyl mercury peptides are present at a 30 mole percent and provide an electron dense heavy metal for visualizing the structures in S/TEM. In the electron beam, the irradiated Hg emits an X-ray at a specific energy that can be detected and is visualized as a white glow in the S/TEM images. In TFE, the peptides adopt a helical conformation, indicating a monomeric state where they can mix completely. When the solvent is removed in vacuo, the helical conformation is preserved as judged by the FTIR wave number for the Amide I band at 1650 cm−1 (data not shown). Water is added to the dry material and mixed. In water, the peptides begin to adopt a beta (extended) conformation and start assembling. Aliquots were removed at the indicated times and dried on copper grids for imaging. Representative images at various time points are shown in Fig 3. At t = 0, the peptides (glowing elements) appear as amorphous structures. However by 5 min, the peptides appear as long micron length nano fibrils that occur in clusters. Incubation of the nano fibrils with Thioflavin T did not result in any spectral shift, suggesting that an absence of amyloid structure in these fibrils23. The fibril structures appear to be transient and quickly break down by 10 min, when the first capsules also start to appear. Small and relatively uniform capsules of ~20 nm in diameter begin to accumulate by 30 min. By 60 min, the small capsules begin to associate and form what appears to be, ‘spheres of spheres’. The associations lead to spheres with different diameters as judged by the dark centers associated with the alignment of the 20 nm capsules. By 120 min the small capsules are no longer visible and appear to have all fused to make well-defined capsules of the sizes ranging from 100 nm to greater than 500 nm. These results illustrate the dynamic nature of the self-assembly process of the capsules.
Figure 3. Time course of capsule formation. S/TEM images of Hg-Labeled peptides taken at the indicated times.
Capsules contain 30% Me-Hg label in both the bis(FLIVI) and bis(FLIVIGSII) peptides at 0.1 mM. The images were captured using annular dark field mode and then inverted to produce the final image. The scale bars at the bottom of the micrographs, in nm, are 200, 500, 200, 100, 200, and 500, for the 0, 5, 10, 30, 60 and 120 min time points, respectively.
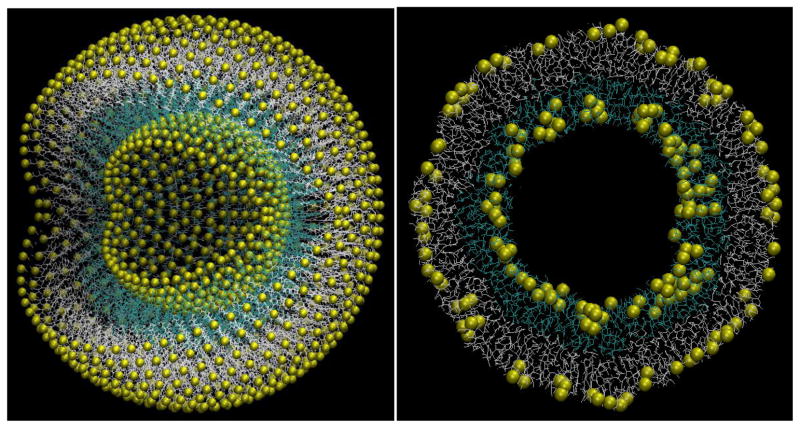
Based on the observation that 20 nm-sized capsules are the first to appear, we built a similarly sized capsule in silico using coarse-grained modeling to assess whether the peptide could be assembled into a bilayer that formed a stable capsule structure, and to illustrate a plausible three dimensional structure of the same. The system was modeled using a modified version of the MARTINI coarse-grained (CG) force field2, 12, 13, 24 that was implemented in CHARMM14, 15. The model capsule, shown in Fig. 4 left panel, contains a total of 1680 peptides, of which 1080 and 600 peptides are on the outside and the inside leaflet, respectively. To overcome strain due to curvature, the outer leaflet contains 66.7% of the larger peptide while the inner leaflet contains only 33.3%. After energy minimization and equilibration simulation, the capsule slightly contracted but well retained the overall structure. The thickness of the outside leaflet is somewhat longer than that of the inside leaflet, due to higher ratio of the longer peptide. The inside volume of the capsule is about 760 nm3. The cross section of capsule (Fig. 4, right panel) shows that the two peptide leaflets have minimal inter-digitation, which is consistent with earlier IR results showing parallel beta-sheets2. Inter-digitated strands would result in anti-parallel IR signatures.
Figure 4. Snapshots of initial and equilibrated structures of capsule coarse-grained model.
The C-terminus group is represented by a yellow sphere; outside peptides are shown as light grey lines, with inside shown as cyan lines. The outside diameter of capsule is ~22nm
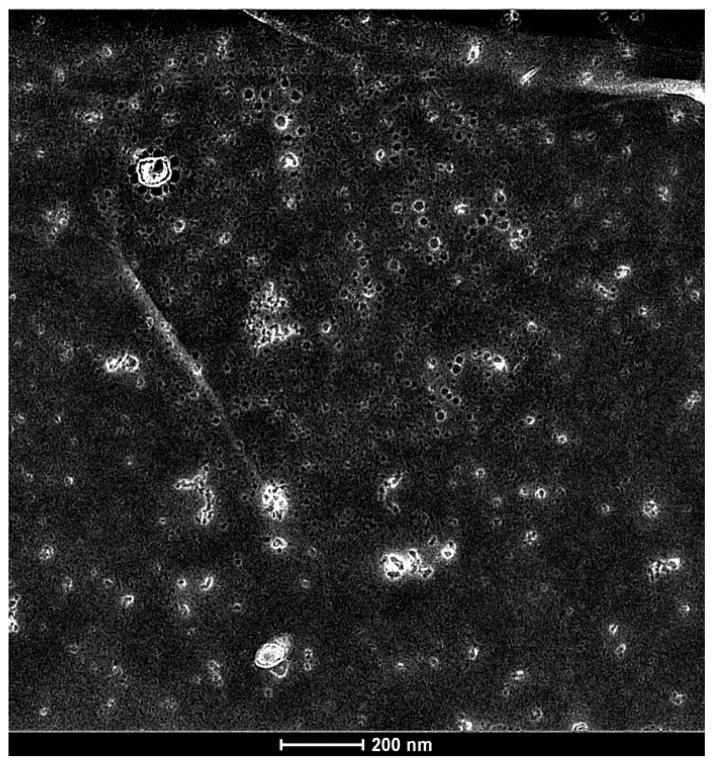
As shown in Fig. 2 the capsules continually grow in size at room temperature and reach sizes in excess of a micron by 24 h. To further establish that the growth is through direct fusion of small capsules, we measured the dilution of the self-quenching fluorescent dye eosin Y (2 mM) as a function of the loaded capsules fusing with a large excess of capsules containing just water. The surface of the capsules is highly cationic due to the presence of all the lysine residues and it adsorbs anionic compounds such as 5,6-Carboxyfluorescien in a saturable manner2. Eosin Y is also anionic at neutral pH and can interact strongly with the outer surface of the capsules. The following protocol was developed to displace any surface-bound anionic molecules without compromising the integrity of the capsules or releasing their contents. This protocol involves first washing the eosin Y loaded capsules with 200 mM Na-TFA at neutral pH, followed by two water washes. The TFA− salt is a strong counter ion and easily displaces most of the dye in the first wash. Water alone was also effective but required 5 washes to reach the 1% residual bound level. Each wash takes additional time that, in turn, affects the size of the capsules as shown in the next set of experiments. Use of the strong counter ion will also allow us to wash capsules free of negatively charged endotoxin (LPS), which can elicit innate immune responses in vivo. Eosin bound to the outer surface of preformed capsules shows an emission maximum at 535 nm, which corresponds to free eosin, indicating that its bound concentration is sufficiently low to prevent self-quenching. After filtering the capsules containing 30% Me-Hg with the 0.22 μ polycarbonate filter and the previously described washing steps, a sample was removed for imaging by TEM, with a representative image shown in Fig. 5. Most of the capsules are in the 20–30 nm in size with several beginning to associate to form larger structures.
Figure 5.
TEM image of Me-Hg labeled washed capsules just prior to fusion experiment.
Being able to wash the surface clean of the anionic eosin Y allows us to assess the behavior of encapsulated material. At 2.0 mM the self-quenching dye has a λmax of 522 nm with an intensity just 22% of its maximum unquenched concentration, which has a red shifted λmax of 550 nm. By mixing a small percentage of the salt/water washed eosin filled capsules with an excess of water filled capsules (1:20), the initial fusions lead to a rapid dilution of the dye. As shown in Fig. 6A fluorescence intensity increases with a concomitant red shift at the earliest times. The fluorescence intensity increases as a consequence of the decreased self-quenching associated with each fusion event. The reaction was allowed to proceed for 235 min. At the end of the reaction the sample was salt washed and passed through a 30 kDa filter to measure any released dye. No significant fluorescence was observed, indicating that the capsules remained intact throughout the experiment. Another control with all eosin-loaded capsules and no water capsules showed no increase in fluorescence over the same time frame. Fig. 6B is a derivative plot that shows the percent fluorescence increase at a given time point relative to the maximal fluorescence intensity observed. Because of the red shift that occurs during this process, the plotted intensity values were taken at the individual λmax values for each time point. An apparent equilibrium is reached around 3 h. This endpoint represents the time where all the capsules have attained equivalent entrapped concentrations. Further fusions will continue as judged by EM studies; however there is no discernible change in the entrapped concentration of the larger structures.
Figure 6. Capsule Fusion Study.

Salt washed eosin Y trapped capsules were mixed with water filled capsules in the ratio of 1:20 at RT. A) Five min fluorescence scans of eosin encapsulated vesicles spectra were taken at 5 min intervals for 235 min. The inset shows spectrum of sample stored at 4° C for 6.5 h. The units shown are identical to those in panel A. B) Measured maximum eosin fluorescence intensity as a function of time during the fusion reaction. The t = 0 represents quenched value of salt washed eosin encapsulate in the capsules (2.0 mM). The data was fitted to a second order exponential with the error bars representing the SEM with n = 3.
The insert to Fig. 6A shows the fluorescence for an aliquot of the fusion sample stored for 6.5 h at 4° C. Note that the fluorescence spectrum is similar to that of the earliest time point in Fig. 6A. The 6.5 h time window is well beyond the duration needed for the capsules to reach a maximum fluorescent intensity at room temperature. This result suggests that lowering the temperature to 4° C is sufficient to prevent the capsules from changing size through fusion; thus providing for a convenient means to control the capsule size. The cessation of fusion at the lower temperature is most likely a kinetic effect, with the process slowed down enough to afford better size control. The fusion experiment also provides further evidence that the capsules are hollow and water filled. Given the amphiphilic nature of the peptides, the most reasonable explanation of how a water-filled capsule could form is that they behave like diacyl phospholipids and assemble into bilayers thereby creating a hydrophilic lined hollow space (see Fig. 4). The capsule’s propensity to fuse at room temperature tends to result in a heterogeneous population with a significant range of sizes on the order of microns. This property is undesirable for potential applications as drug delivery vehicles due to strict size dependent cellular uptake in vivo. Liposomes made from diacyl phospholipids are easily resized to uniform diameters using membrane extrusion filters. Given the behavioral similarities of the peptide capsules to lipid vesicles, applying membrane extrusion to resize the peptide capsules seems appropriate. In the resizing experiment the Me-Hg labeled peptides were mixed and allowed to fuse for 24 h at RT. The size distribution observed is typical for a 24 h sample. At that point an aliquot of the peptide capsule solution was extruded back and forth numerous times through a 100 nm membrane filter followed by a final extrusion using a 30 nm membrane filter. Immediately after repeated extrusions through each membrane, a small volume was spread on a TEM grid and dried. The 24 hr sample (Fig. 7A) shows the larger peptide capsules normally seen at this time point. The 100 nm, extruded sample (Fig. 7B) shows a mixed population of heterogeneous capsules that range in size from 20 to 60 nm in diameter. Few if any 100 nm capsules have ever been observed using this technique suggesting that this size is disfavored over smaller ones. The 30 nm filter extruded capsules (Fig. 7C) are observed as a relatively homogeneous population with most capsules ranging in diameter from 20–30 nm. The 30 nm pore size is the smallest available through our vendor and attempting to go even smaller may not be feasible since our capsules assemble as 20 nm structures. After extruding, if the capsules are allowed to sit for any appreciable time at RT they rapidly begin re-fusing (data not shown). In the absence of refrigeration, we envision using the samples immediately after the extrusion process to ensure size uniformity. Upon dilution in the blood stream or tissues, the likelihood of fusion is remote. This study clearly shows that regulating the size of the capsules is straightforward.
Figure 7. Filter Resizing Study.
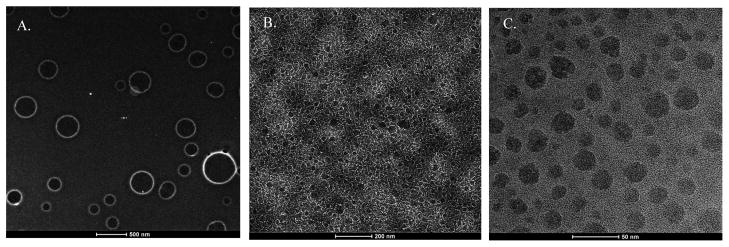
TEM images are shown for the A) 24 h control. B) 100 nm membrane extruded material and C) 30 nm membrane extruded material. All figures are displayed as inverse images.
Conclusion
In this report we characterized several properties of peptide capsules that form through the self-assembly of two branched peptides, bis(FLIVI)-K-KKKK and bis(FLIVIGSII)-K-KKKK (Fig. 1). The assembly process is initiated with the formation of nano-fibrils that condense into 20 nm water filled spheres. It is during this phase that solutes can be encapsulated. Washes with strong counter-ions followed by water washes remove any surface bound materials without disrupting the loaded capsules. Subsequently the nano capsules begin to associate to form spheres of spheres that ultimately fuse to form larger capsules. The larger capsules continue to fuse and grow to more than micron diameter structures. Fusion kinetics were followed by observing the dilution of the encapsulated self-quenching eosin Y dye, as dye labeled capsules combined with an excess of water containing capsules. The capsules are easily resized to form homogeneous populations in the 20–30 nm range by extruding them through polycarbonate filters with controlled pore sizes. In addition, dropping the temperature to 4° C suspends the fusion process allowing the production of uniform and stable peptide capsules that could be used in vivo.
Acknowledgments
This is publication 14-071-J from the Kansas Agricultural Experiment Station. Partial support for this project was provided by PHS-NIH grant # RO1 074096 (to J.M.T) and the Terry Johnson Cancer Center for summer support (for P.S. and S.G.)
Funding Sources
Partial support for this project was provided by PHS-NIH grant # RO1 074096 (to J.M.T) and the Terry Johnson Cancer Center for summer support (for P.S. and S.G.)
Abbreviations
- TFA
Trifluoroacetic acid
- Na-TFA
Sodium Trifluoroacetate
- TFE
2,2,2 – Trifluoroethanol
- S/TEM
Scanning Transmission Electron Microscopy
- FTIR
Fourier Transform Infrared Spectroscopy
- MWCO
Molecular Weight Cut Off
- MD
Molecular Dynamics
- SEM
Standard Error of Mean
Footnotes
Author Contributions
The manuscript was written through contributions of all authors. All authors have given approval to the final version of the manuscript.
References
- 1.Couvreur P. Nanoparticles in drug delivery: Past, present and future. Advanced Drug Delivery Reviews. 2013;65(1):21–23. doi: 10.1016/j.addr.2012.04.010. [DOI] [PubMed] [Google Scholar]
- 2.Gudlur S, Sukthankar P, Gao J, Avila LA, Hiromasa Y, Chen J, Iwamoto T, Tomich JM. Peptide Nanovesicles Formed by the Self-Assembly of Branched Amphiphilic Peptides. PLOS ONE. 2012;7 (9):e45374. doi: 10.1371/journal.pone.0045374. [DOI] [PMC free article] [PubMed] [Google Scholar]
- 3.Kempe M, Barany G. CLEAR: A Novel Family of Highly Cross-Linked Polymeric Supports for Solid Phase Synthesis. J Am Chem Soc. 1996;118:7083–7093. [Google Scholar]
- 4.Iwamoto T, Grove A, Montal MO, Montal M, Tomich JM. Chemical synthesis and characterization of peptides and oligomeric proteins designed to form transmembrane ion channels. Int J Pept Protein Res. 1994;43:597–607. doi: 10.1111/j.1399-3011.1994.tb00562.x. [DOI] [PubMed] [Google Scholar]
- 5.Gruen LC. Stoichiometry of the reaction between methyl mercury (II) iodide and soluble sulphides. Anal Chim Acta. 1970;50:299–303. [Google Scholar]
- 6.Forbes WF, Hamlin CR. Determination of –SS and –SH groups in proteins. I. A reassessment of the use of methylmercuric iodide. Canadian Journal of Chemistry. 1968;46:3033–3040. [Google Scholar]
- 7.Anderson WL, Wetlaufer DB. A new method for the disulfide analysis of peptides. Analyt Biochem. 1975;67:493–502. doi: 10.1016/0003-2697(75)90323-1. [DOI] [PubMed] [Google Scholar]
- 8.Chen RF. Measurements of absolute values in biochemical fluorescence spectroscopy. J Research National Bureau Standards. 1972;76A (6):593–606. doi: 10.6028/jres.076A.052. [DOI] [PMC free article] [PubMed] [Google Scholar]
- 9.Sponer H. Remarks on the Absorption Spectra of Phenylalanine and Tyrosine in Connection with the Absorption in Toluene and Paracresol. J Chem Phys. 1942;10:672. [Google Scholar]
- 10.Aebi U, Pollard TD. A glow discharge unit to render electron microscope grids and other surfaces hydrophilic. J Electron Microsc Tech. 1987;7:29–33. doi: 10.1002/jemt.1060070104. [DOI] [PubMed] [Google Scholar]
- 11.Utsunomiya S, Ewing RC. Application of High-Angle Annular Dark Field Scanning Transmission Electron Microscopy, Scanning Transmission Electron Microscopy-Energy Dispersive X-ray Spectrometry, and Energy-Filtered Transmission Electron Microscopy to the Characterization of Nanoparticles in the Environment. Environ Sci Technol. 2003;37:786–791. doi: 10.1021/es026053t. [DOI] [PubMed] [Google Scholar]
- 12.Monticelli L, Kandasamy SK, Periole X, Larson RG, Tieleman DP, Marrink SJ. The MARTINI coarse-grained force field: Extension to proteins. J Chem Theory and Comput. 2008;4 (5):819–834. doi: 10.1021/ct700324x. [DOI] [PubMed] [Google Scholar]
- 13.LeVine H., 3rd Thioflavine T interaction with synthetic Alzheimer’s disease β - amyloidpeptides: Detection of amyloid aggregation in solution. Protein Science. 1993;2:404–410. doi: 10.1002/pro.5560020312. [DOI] [PMC free article] [PubMed] [Google Scholar]
- 14.Brooks BR, Bruccoleri RE, Olafson BD, States DJ, Swaminathan S, Karplus M. CHARMM - A program for macromolecular energy, minimization, and dynamics calculations. J Comput Chem. 1983;4 (2):187–217. [Google Scholar]
- 15.Brooks BR, Brooks CL, Mackerell AD, Nilsson L, Petrella RJ, Roux B, Won Y, Archontis G, Bartels C, Boresch S, Caflisch A, Caves L, Cui Q, Dinner AR, Feig M, Fischer S, Gao J, Hodoscek M, Im W, Kuczera K, Lazaridis T, Ma J, Ovchinnikov V, Paci E, Pastor RW, Post CB, Pu JZ, Schaefer M, Tidor B, Venable RM, Woodcock HL, Wu X, Yang W, York DM, Karplus M. CHARMM: The biomolecular simulation program. J Comput Chem. 2009;30 (10):1545–1614. doi: 10.1002/jcc.21287. [DOI] [PMC free article] [PubMed] [Google Scholar]
- 16.Humphrey W, Dalke A, Schulten K. VMD: Visual molecular dynamics. J Mol Graph. 1996;14 (1):33–38. doi: 10.1016/0263-7855(96)00018-5. [DOI] [PubMed] [Google Scholar]
- 17.Bellin JS, Oster G. Photoreduction of Eosin in the Bound State. J Am Chem Soc. 1957;79:2461–2464. [Google Scholar]
- 18.LeVine H., 3rd Thioflavine T interaction with synthetic Alzheimer’s disease β - amyloidpeptides: Detection of amyloid aggregation in solution. Protein Science. 1993;2:404–410. doi: 10.1002/pro.5560020312. [DOI] [PMC free article] [PubMed] [Google Scholar]
- 19.Sun X, Rossin R, Turner JL, Becker ML, Joralemon MJ, Welch MJ, Wooley KL. An Assessment of the Effects of Shell Cross-linked Nanoparticle Size, Core Composition, and Surface PEGylation on in Vivo Biodistribution. Biomacromolecules. 2005;6(5):2541–2554. doi: 10.1021/bm050260e. [DOI] [PMC free article] [PubMed] [Google Scholar]
- 20.Stolnik S, Illum L, Davis SS. Long circulating microparticulate drug carriers. Adv Drug Deliv Rev. 1995;16 (2–3):195–214. [Google Scholar]
- 21.Huang S-D. Stealth nanoparticles: high density but sheddable PEG is a key for tumor targeting. J Control Release. 2010;145(3):178–181. doi: 10.1016/j.jconrel.2010.03.016. [DOI] [PMC free article] [PubMed] [Google Scholar]
- 22.Decuzzi P, Godin B, Tanaka T, Lee SY, Chiappini C, Liu X, Ferrari M. Size and shape effects in the biodistribution of intravascularly injected particles. J Control Release. 2010;141(3):320–327. doi: 10.1016/j.jconrel.2009.10.014. [DOI] [PubMed] [Google Scholar]
- 23.Groenning M. Binding mode of Thioflavin T and other molecular probes in the context of amyloid fibrils—current status. J Chem Biol. 2010;3(1):1–18. doi: 10.1007/s12154-009-0027-5. [DOI] [PMC free article] [PubMed] [Google Scholar]
- 24.Marrink SJ, Risselada HJ, Yefimov S, Tieleman DP, de Vries AH. The MARTINI force field: Coarse grained model for biomolecular simulations. J Phys Chem B. 2007;111 (27):7812–7824. doi: 10.1021/jp071097f. [DOI] [PubMed] [Google Scholar]


