

Abstract
Adenosine is a potent endogenous anti-inflammatory and immunosuppressive metabolite that is a potent modulator of tissue repair. However, the adenosine A2A receptor (A2AR)-mediated promotion of collagen synthesis is detrimental in settings such as scarring and scleroderma. The signaling cascade from A2AR stimulation to increased collagen production is complex and obscure, not least because cAMP and its downstream molecules PKA and Epac1 have been reported to inhibit collagen production. We therefore examined A2AR-stimulated signaling for collagen production by normal human dermal fibroblasts (NHDF). Collagen1 (Col1) and collagen3 (Col3) content after A2AR activation by CGS21680 was studied by western blotting. Contribution of PKA and Epac was analyzed by the PKA inhibitor PKI and by knockdowns of the PKA-Cα, -Cβ, -Cγ, Epac1, and Epac2. CGS21680 stimulates Col1 expression at significantly lower concentrations than those required to stimulate Col3 expression. A2AR stimulates Col1 expression by a PKA-dependent mechanism since PKA inhibition or PKA-Cα and -Cβ knockdown prevents A2AR-mediated Col1 increase. In contrast, A2AR represses Col3 via PKA but stimulates both Col1 and Col3 via an Epac2-dependent mechanism. A2AR stimulation with CGS21680 at 0.1 μM increased Col3 expression only upon PKA blockade. A2AR activation downstream signaling for Col1 and Col3 expression proceeds via two distinct pathways with varying sensitivity to cAMP activation; more highly cAMP-sensitive PKA activation stimulates Col1 expression, and less cAMP-sensitive Epac activation promotes both Col1 and Col3 expression. These observations may explain the dramatic change in Col1:Col3 ratio in hypertrophic and immature scars, where adenosine is present in higher concentrations than in normal skin.
Electronic supplementary material
The online version of this article (doi:10.1007/s11302-013-9368-1) contains supplementary material, which is available to authorized users.
Keywords: Adenosine, Adenosine receptor A2, Collagen type I, Collagen type III, PKA, Epac
Introduction
Adenosine, a product of ATP catabolism [1], is present in most biological fluids and is elevated during tissue or organ stress when it acts as a potent endogenous modulator of inflammation and tissue repair [2, 3]. Under basal conditions, the extracellular adenosine concentration is constant (30–300 nM). In contrast, its concentration increases dramatically to micromolar ranges when there is increased ATP catabolism, as in tissue or cellular necrosis and hypoxia [4]. It has been previously reported that adenosine, acting via adenosine 2A receptor (A2AR), promotes wound healing [5] and excisional wound closure in both normal and diabetic mice, and the enhancement in dermal wound healing is accompanied by an increase in matrix (collagen) in the wounds [6, 7]. In addition, the A2AR plays an important role in the pathogenesis of fibrotic malignancies of the skin such as dermal fibrosis and scleroderma [8–10] and liver [11]. Thus, blockade or deletion of adenosine A2AR prevents dermal fibrosis in mice treated with bleomycin [12], and A2AR blockade prevents scarring by reducing collagen content and misalignment [10]. Similarly, deletion or blockade of adenosine A2AR prevents liver fibrosis in mice treated with CCl4 or thioacetamide [11]. Adenosine A2AR ligation directly stimulates collagen production by stimulated dermal fibroblasts [13, 14] and stellate cells [15].
The A2AR belongs to the G-protein-coupled receptor (GPCR) superfamily [16, 17] and signals via Gs signal transduction proteins which activate adenylate cyclase, increasing cytosolic cAMP [18]. Elevated intracellular cAMP activates both protein kinase A (PKA) and Epac [19–21]. Because the A2AR is the only Gs-coupled adenosine receptor subtype which has not been reported to also couple to the Gq protein [22, 23], it is likely that A2AR-mediated increases in collagen expression are related to either PKA or Epac activation by cAMP. However, a prior study suggests that both PKA and Epac activation diminish collagen1 (Col1) and collagen3 (Col3) expression [24]. In support of the hypothesis that cAMP diminishes collagen production, the profibrogenic agonist transforming growth factor β (TGFβ) decreased Epac1, but not Epac2, expression in fibroblasts from multiple tissues and stimulated Col1 and Col3 expression; activation of both Epac1 and PKA inhibited Col1 and Col3 expression [25]. Moreover, targeting an increase in cAMP has been proposed as an antifibrotic strategy [24]. Since the adenosine A2AR is a Gs-coupled receptor that stimulates an increase in cAMP in nearly every cell tested, the mechanism by which A2AR regulates collagen production remains a paradox.
There is a marked decrease in the ratio of Col1 to Col3 in the matrix of scars or in the fibrous matrix of cirrhotic liver as compared to normal tissues, and blockade of adenosine A2AR appears to affect Col3 more than Col1 expression in scars [10]. In scars, matrix composition dictates both the strength and the appearance of the resulting scar so it is important to understand how agents that may alter the wound healing or scarring process regulate the composition of the wound matrix. Interestingly, the intracellular signaling pathways by which adenosine A2ARs signal for expression of Col1 and Col3 differ in hepatic stellate cells; A2AR stimulation promotes an increase in Col1 expression via the PKA/ERK pathway but increases Col3 expression via a pathway involving activation of p38MAPK in the LX-2 hepatic stellate cell line [15]. We therefore asked how activation of A2AR promotes an increase of both Col1 and Col3 favoring dermal fibrosis and scarring. Here we report that A2ARs differentially regulate Col1 and Col3 expression via a complex mechanism dependent on cAMP but proceeding via either PKA- or Epac-dependent signaling pathways.
Results
The dose–response relationship for A2AR-stimulated increases in Col1 and Col3 differ
To better define the effects of A2AR-mediated stimulation on synthesis of wound matrix by dermal fibroblasts, we examined the dose–response relationship for the selective A2AR agonist CGS21680-mediated stimulation of collagen1 (Col1) and collagen3 (Col3) by normal human dermal fibroblasts (NHDF). Since the well-known profibrotic peptide TGF-β1 increased both Col1 and Col3 after 24 h (Supplemental Figure 1), NHDF were also incubated with CGS21680 for 24 h. We were surprised to find that the concentrations of CGS21680 required to stimulate increased production of Col1 (both components: 1α1 and 1α2) and Col3 differed markedly, even though stimulation was mediated by the A2A receptor since SCH58261, a highly selective A2AR antagonist, reverses the effect of CGS21680 on both collagens (Fig. 1). Moreover, when we analyzed the ratio of Col1:Col3 expression in NHDF stimulated with CGS21680, we found that the ratio of Col1:Col3 production decreased significantly from 4.2 ± 0.5 to 2.9 ± 0.3 as the concentration of CGS21680 increased from 0.1 to 10 μM. The change in Col1:Col3 ratio at differing A2AR agonist concentrations is likely to be physiologically and pharmacologically important since, in normal skin, where adenosine concentration varies from 30 to 300 nM, there is a Col1 to Col3 ratio of 4:1, but in hypertrophic and immature scars, where adenosine concentration is at micromolar ranges, the ratio decreases to 2:1 [4]. That A2AR activation increases Col1 and Col3 expression was further corroborated by quantitation of mRNA for these proteins (Fig. 1c); these results were in agreement with previously published results obtained in studies of hepatic stellate cells and the human hepatic stellate cell line LX-2 [15].
Fig. 1.
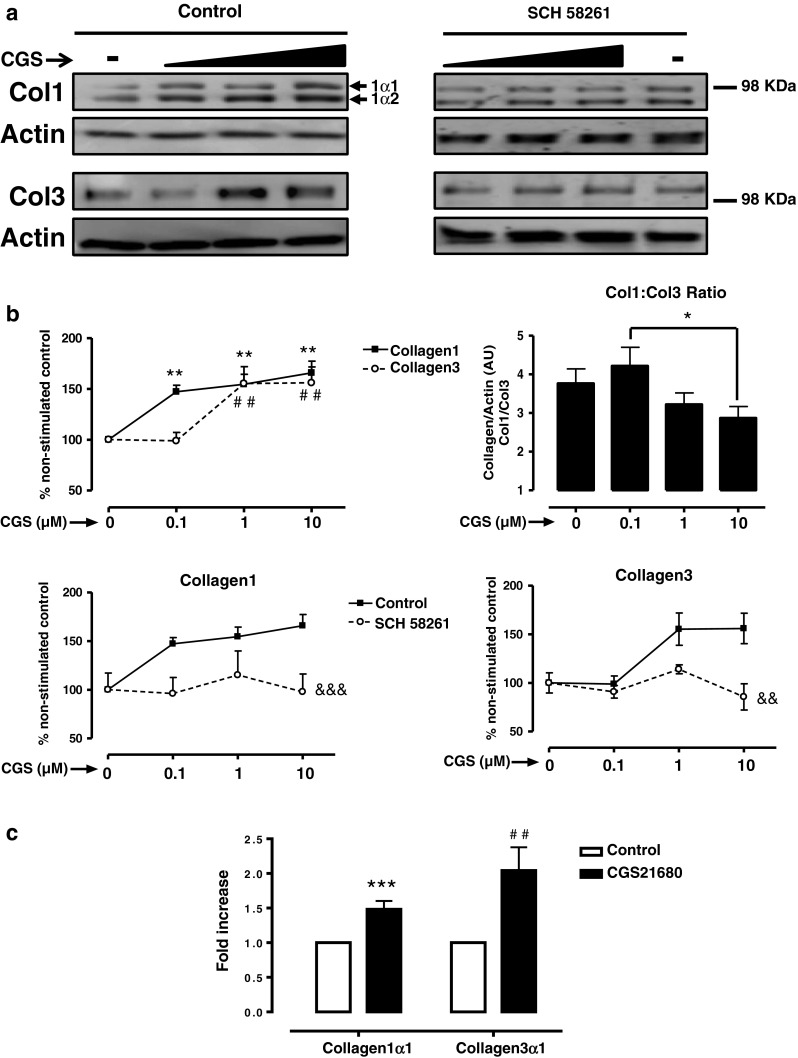
A2AR activation increase collagen I and III with different potency. a NHDF cells were incubated with increasing concentrations of the A2AR agonist CGS21680 during 24 h, with or without pre-incubation with the A2AR selective antagonist SCH58261 0.1 μM. Black triangle represents the increasing concentrations of CGS21680 0.1–1–10 μM. b Densitometry of bands showing percent change and Col1:Col3 ratio. Data represent means ± SEM of more than ten independent experiments, and statistics was performed by ANOVA followed by Newman–Keuls post-test, Col1 **P < 0.01 and Col3 ## P < 0.01 vs. non-stimulated control; *P < 0.05 CGS21680 0.1 vs. 10 μM; or by two-way ANOVA, &&& P < 0.001 and && P < 0.01 SCH58261 vs. control. c mRNA for collagen1α1 and collagen3α1 was measured by real-time RT-PCR after a 24-h stimulation with CGS21680 1 μM. Data represent means ± SEM of four independent experiments, and statistical analysis was performed by Student's t test, collagen1α1 ***P < 0.001 and collagen3α1 ## P < 0.01 vs. non-stimulated control
PKA activates Col1, but inhibits Col3 production after A2AR activation
Adenosine receptors are all members of the large family of G-protein-coupled receptors, and the A2AR signals almost exclusively via GαS signal transduction proteins, which activate adenylate cyclase and mediate downstream signaling via cAMP, which leads to activation of two divergent pathways activated by protein kinase A (PKA) and the guanine nucleotide exchange factor Epac1/2. As expected, A2AR activation by the specific agonist CGS21680 increased the intracellular levels of cAMP in a dose-dependent fashion (Fig. 2a). To follow, we studied the impact of PKA inhibition on the CGS21680 activation of Col1 and Col3. The PKA inhibitor, PKI, dramatically decreased PKA activity (95.83 ± 4.16 % inhibition, P < 0.01 Student's t test; Fig. 2b) and completely blocked the effect of adenosine A2AR stimulation by CGS21680 on Col1 expression (Fig. 2c). In contrast, PKI alone enhanced the effect of CGS21680 0.1 μM on Col3 expression (170.2 ± 18.1 % of control, P < 0.001 Student's t test).
Fig. 2.
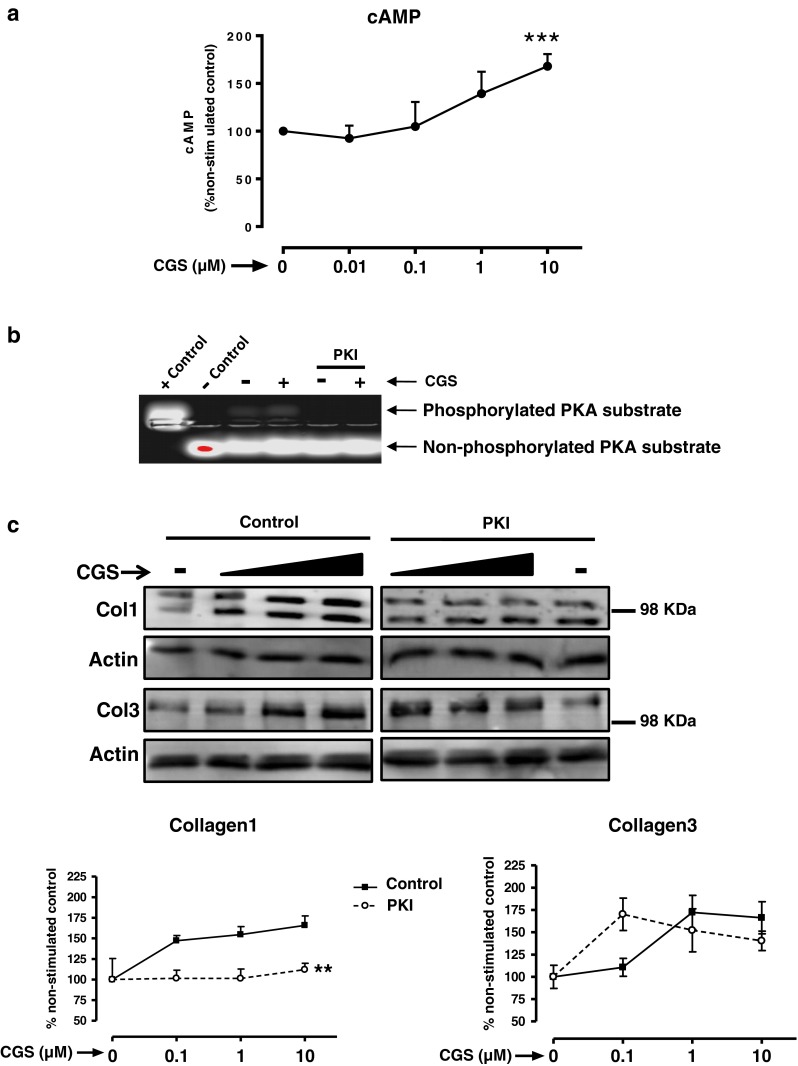
PKA activates collagen I but inhibits collagen III. a Intracellular cAMP levels were measured as described in “Methods” section. Statistical analysis was performed by Student's t test, ***P < 0.001 vs. non-stimulated. b PKA activity measurement; when indicated, 1 h prior to CGS21680 stimulation, NHDF were pre-incubated with the PKA inhibitor PKI (10 μg/ml), and PKA activity was analyzed as described in “Methods” section. c Cells were pre-incubated with the PKA inhibitor PKI (10 μg/ml) before CGS21680 addition and Col1 and Col3 expression analysis. Black triangle represents the increasing concentrations of CGS21680 0.1–1–10 μM. Statistical analysis was performed by two-way ANOVA, **P < 0.01 PKI vs. control. Data represent means ± SEM of three or more independent experiments
Since three different PKA catalytic subunits have been discovered [26], we next silenced PKA-Cα, PKA-Cβ, and PKA-Cγ (Fig. 3a) which, interestingly, increased basal Col1 and Col3 expression. Col1 expression was unaffected by CGS21680 treatment in PKA-Cα and PKA-Cβ knockdown cells, but it was markedly increased by CGS21680 in PKA-Cγ-depleted cells. Col3 expression after A2AR activation was increased when compared to basal expression in all three knockdowns, although the difference was not significant in PKA-Cβ-depleted cells (Fig. 3b).
Fig. 3.
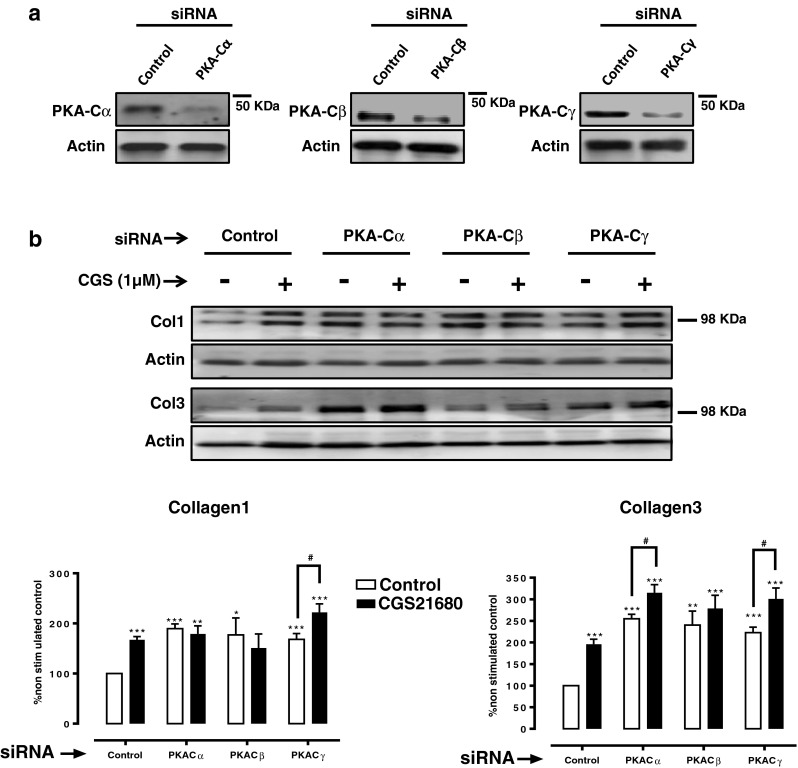
Impact of knockdown of the PKA catalytic subunits on Col1 and Col3 expression. a siRNAs for PKA-Cα, PKA-Cβ, and PKA-Cγ selectively reduce the protein expression when compared to control siRNA. b Impact of PKA-Cα, PKA-Cβ, and PKA-Cγ silencing on basal and CGS21680 1-μM-increased Col1 and Col3 expression. Statistics was performed by Student's t test, *P < 0.05, **P < 0.01, and ***P < 0.001 vs. non-stimulated control siRNA and # P < 0.01 CGS216280 vs. non-stimulated of the same siRNA. Data represent means ± SEM of three or more independent experiments
Epac2 is required for Col1 and Col3 production following A2AR activation
Prior studies indicate that Epac plays a significant role in regulating collagen synthesis and fibroblast migration, suggesting that Epac1 is a negative regulator of both Col1 and Col3 [25]. Therefore, we also investigated the impact of Epac on Col1 and Col3 production after A2AR activation by CGS21680, which robustly increased Epac activity (Fig. 4a). Next, we silenced Epac1 or Epac2 (Fig. 4b). Interestingly, Epac1 silencing increased basal expression of both Col1 and Col3 (Col1 142.2 ± 19 %, P < 0.05 vs. negative control; Col3 150.4 ± 10 %, P < 0.001 vs. negative control), and levels were also elevated upon increasing concentrations of CGS21680. However, Epac2 depletion prevented the CGS21680-induced increase in both Col1 and Col3 (two-way ANOVA, P < 0.001), and double knockdown of Epac1/2 prevented Col3 but not Col1 increase after A2AR activation (Fig. 4c). These results confirm previous reports in which Epac1 was found to negatively regulate Col1 and Col3 [25] and suggest that Epac2 is required for the expression of Col1 and Col3 following adenosine A2AR stimulation.
Fig. 4.

Impact of Epac1/2 knockdown on Col1 and Col3 expression. a Epac activity was analyzed after incubation with CGS21680 1 μM for 15 min. Immunoprecipitation with Ral GSD-RBD was performed followed by immunoblot with anti-Rap1, and Coomassie stain identified Ral GSD-RBD at the predicted molecular weight of 37 kDa. b siRNAs for Epac1, Epac2, and double knockdown Epac1 + 2 selectively reduce the protein expression when compared to control siRNA. c Impact of Epac1, Epac2 silencing, or double knockdown Epac1 + 2 on basal and CGS21680-increased Col1 and Col3 expression. Statistics was performed by the two-way ANOVA: Epac2 siRNA ***P < 0.001 and Epac1 + 2 siRNA ## P < 0.01 vs. control siRNA. Black triangle represents the increasing concentrations of CGS21680 0.1–1–10 μM, and data represent means ± SEM of three or more independent experiments
Discussion
Collagen is the principal building block of connective tissue, and its upregulation in malignancies such as scleroderma is a critical event in the development of tissue fibrosis [27]. In normal skin, types I and III collagen exist in a ratio approximately 4:1, whereas in hypertrophic and immature scars, the percentage of type III collagen may be as high as 33 %, altering the ratio of Col1 to Col3 to as low as 2:1 [4]. Adenosine is present in most biological fluids and is elevated during tissue stress when it acts as a potent endogenous modulator of inflammation and tissue repair [2, 3] so that physiological interstitial levels of adenosine of 30 to 300 nM are found in normal tissues, while adenosine concentrations can reach micromolar levels during hypoxia, ischemia, inflammation, and other types of injury [28]. We therefore sought to analyze the impact of the A2AR agonist CGS21680 ranging from nanomolar to micromolar concentrations. It has previously been reported that adenosine, acting via the A2AR, promotes an increase in collagen in wounds [6, 7] and in vitro [12, 14]. In fact, we have previously shown that A2AR stimulation promotes dermal fibrosis, as both A2AR antagonism and knockdown protect mice from developing bleomycin-induced dermal fibrosis and A2AR antagonism prevents excessive scarring by hampering Col3 overproduction compared to Col1 [10] and protects from dermal fibrosis in a model of elevated tissue adenosine [29]. We therefore hypothesized that Col1 production is more sensitive to A2AR activation than Col3 so that increasing concentrations of CGS21680 would decrease the Col1:Col3 ratio. Interestingly, hypoxia increases adenosine extracellular levels by suppressing both adenosine uptake and metabolism [30–33] and, at the same time, conditions of hypoxia promote fibrogenesis [34]. Moreover, HIF-1α induces A2BR expression [35] indicating that the A2BR exerts a tissue protective function [36, 37], but the A2AR may also contribute to the functions of adenosine in ischemic settings [35, 36]. Therefore, further studies will be needed to fully understand the interplay between hypoxia, HIF-1α, and adenosine in skin fibrosis. In this regard, and highlighting the hypoxia–inflammation relationship [30], it has been recently shown that hypoxia elicits a potent anti-inflammatory mechanism to limit tissue damage in conditions of reduced oxygen availability [38].
Among the most well-known effects of adenosine A2AR receptor stimulation is increasing intracellular cAMP [28, 39, 40], and A2AR stimulation activates both PKA [20] and Epac [19]. Moreover, the A2AR has been shown not to couple to the Gq/PLC/PKC pathway [22, 28]. In fact, direct activation of PKC with phorphol 12-myristate 13-acetate (PMA) dramatically inhibits both Col1 and Col3 (Supplemental Figure 2), strongly indicating that A2AR promotion of collagen signals via cAMP. Paradoxically, both Epac and PKA have been reported to decrease Col1 and Col3 synthesis in human fibroblasts [25], and others have suggested that stimulating increased cAMP levels or activating Epac could be used to inhibit fibrosis [24]. Thus, Yokoyama et al. showed that mRNA expression of both Col1 and Col3 is decreased by activation of both enzymes PKA and Epac using cAMP analogs that specifically activate PKA or Epac at 50 μM [25]. The work reported here clearly confirms the role of cAMP/PKA/Epac activation in adenosine A2AR-mediated stimulation of collagen production, which is in agreement with the finding that collagen is increased by activation of other adenyl cyclase-coupled receptors such as the angiotensin AT-1R [41].
Previous reports suggest that differences in cAMP affinities between PKA isoforms contribute to specificity in the cAMP pathway [42, 43], and our results are consistent with this hypothesis. Moreover, inhibition of PKA by PKI dramatically reduced PKA activity (Fig. 2b) and prevented A2AR-mediated stimulation of Col1 expression but potentiated Col3 expression. In agreement with previous findings, knockdown of the PKA catalytic subunits increased basal Col1 and Col3 expression (Fig. 3b) [25]. To our knowledge, the present work is the first description of a differential regulation of Col1 and Col3 by PKA following A2AR activation: we found that the increase in Col1 following CGS21680 incubation was prevented in PKA-Cα and -Cβ-depleted cells and that, similar to the impact of the PKI inhibitor, Col3 was further increased by A2AR by knockdown of the catalytic subunits of PKA. These results are most consistent with the hypothesis that activation of PKA after A2AR activation stimulates Col1 expression but inhibits Col3 expression.
Although PKA was initially thought to be the exclusive mediator of cAMP action [44], it was subsequently recognized that Epac mediates many of the effects of cAMP on cellular function [45]. To determine whether Epac signaling mediates collagen expression in response to adenosine A2A stimulation, we knocked down both Epac1 and 2 (Fig. 4b) and found that Epac1, but not Epac2, silencing increased basal Col1 and Col3 expression (Fig. 4c), which is consistent with the observation that TGF-β1 promotes collagen synthesis by repressing Epac1 but not Epac2 in fibroblasts from different tissues [25]. Interestingly, the effect of A2AR stimulation on both Col1 and Col3 expression was lost in Epac2-silenced cells. These findings suggest that after A2AR activation, Epac2 is necessary for Col1 and Col3 expression, and its regulation by Gs linked receptors.
The results of the studies presented here further highlight the dependence of A2AR signaling on activation of adenylate cyclase and the role of cAMP in A2AR signaling for fibroblast collagen production, suggesting that submaximal activation of the A2AR selectively activates PKA, favoring Col1 production but repression of Col3. However, stronger activation of A2AR activates Epac2 to stimulate both Col1 and Col3 expression. In accord with this hypothesis, it has previously been described that although cAMP affinities for Epac and PKA are similar, cAMP binds cooperatively to PKA but not to Epac, and thereby increases the responsiveness of PKA to a slight change of cAMP in the intact cell [46]. Similarly, it has been previously described that a slight intracellular cAMP increase activates cardiac fibroblast migration, which is, nonetheless, inhibited upon micromolar cAMP [25]. By highlighting the importance of intracellular cAMP levels on collagen production, our results shed some light into how a GαS-coupled receptor, the A2AR, increases both Col1 and Col3.
In summary, our work indicates that in NHDFs, adenosine mediates complex regulation of the Col1:Col3 balance, a determinant of the collagen quality in wounded versus normal skin, by fine-tuning intracellular cAMP levels. In Table 1, we have summarized our results showing that at nanomolar concentrations of the A2AR agonist (CGSlow), PKA activates Col1 but represses Col3, since the latter is only increased by CGSlow in the presence of PKI. In agreement, upon PKA C-α/C-β knockdown, basal Col1 and Col3 are increased, and CGS21680 further increases Col3 but not Col1. Similarly, Epac1 depletion increases Col1 and Col3, but Epac2 is needed at nanomolar and micromolar (CGShigh) concentrations for Col1 expression and at micromolar for Col3 expression. Taken together, our results suggests that at nanomolar concentrations of the A2AR agonist, the PKA-mediated induction of collagen I and repression of collagen III expression increases the Col1:Col3 ratio but at higher concentrations of the A2AR agonist, and subsequent higher intracellular cAMP concentrations, the PKA inhibition of Col3 is overcome by Epac2 activation. Moreover, the observation that there is differential regulation of Col1 and Col3 by A2AR provides an attractive explanation for the observation that in normal skin, where adenosine concentration varies from 30 to 300 nM, there is a Col1 to Col3 ratio of 4:1, but in hypertrophic and immature scars, where adenosine concentration is likely to be present at higher concentrations, the ratio decreases to 2:1 [4], a decrease prevented by A2AR blockade [10].
Table 1.
Summary of the results: roles of PKA and Epac on Col1 and Col3 regulation after A2AR activation
| Treatment | Col1 | Col3 | Pathway |
|---|---|---|---|
| CGSlow | ↑ | ≈ | A2AR |
| CGShigh | ↑ | ↑ | |
| PKI + CGSlow | ≈ | ↑ | PKA |
| PKI + CGShigh | ≈ | ↑ | |
| PKA C-α/-β siRNA + CGS | ≈ | ↑ | |
| Epac1/2 siRNA + CGSlow | ≈ | ≈ | Epac |
| Epac1/2 siRNA + CGShigh | ≈ | ≈ |
The A2AR agonist CGS21680 was tested at 0.1 μM (CGSlow) and 1–10 μM (CGShigh) concentrations, which promoted an increase (↑), a decrease (↓), or did not affect (≈) collagen production
Methods
Antibodies, reagents, and cell line
CGS21680 and SCH58261 were purchased from Tocris Bioscience (Ellisville, MO, USA). The PKA inhibitor (TTYADFIASGRTGRRNAIHD; PKI) was purchased from Promega (Madison, WI, USA). Purified collagen1 and collagen3 and antibodies to collagen1 and collagen3 were purchased from SouthernBiotech (Birmingham, AL, USA). The RIPA buffer, protease inhibitor cocktail, the phosphatase inhibitor cocktail, phorbol 12-myristate 13-acetate (PMA), and the antibody to actin (H-196) were purchased from Sigma-Aldrich (St. Louis, MO, USA). Secondary antibodies and Epac1 (sc-25632), PKA-Cβ, and PKA-Cγ antibodies were purchased from Santa Cruz Biotechnology (Santa Cruz, CA, USA). Epac2 and PKA-Cα antibodies were from Cell Signaling Technology (Boston, MA, USA). TGF-β1 was from R&D systems (Minneapolis, MN, USA). NHDFs was purchased from Lonza (Walkersville, MD, USA).
Stimulation and preparation of cellular extracts and Western blot
Passage 1 to 5 of 75 % confluent NHDF cells was stimulated during 24 h with the A2AR agonist CGS21680 at 0.1, 1, or 10 μM. When indicated, the A2AR antagonist SCH58261 (0.1 μM) was added 15 min or the inhibitor of PKA (PKI; 10 μg/ml) 1 h before CGS21680. For all the experiments with inhibitors/antagonists, a dose–response from 0.1 to 10 μM of CGS21680 was run in parallel. After stimulation, cells were washed with cold PBS and lysed RIPA buffer containing protease inhibitor cocktail and phosphatase inhibitor cocktail. The protein content was measured by the BCA protein assay (Thermo Fisher Scientific, Pittsburgh, PA, USA). Three micrograms of protein extract for Col1, PKA-Cα, PKA-Cβ, and PKA-Cγ and 10 μg for Col3, Epac1, and Epac2 were separated on SDS-polyacrylamide gels. Then, proteins were transferred to PVDF membranes for immunoblotting. Prior to antibody incubation, membranes were blocked in Tris-buffered saline with 0.1 % Tween 20 (TBST) plus 3 % BSA (albumin from bovine serum, Sigma-Aldrich). Primary antibodies were incubated overnight at 4 °C at 1/500 dilution for Col1, Col3, Epac1, PKA-Cβ, and PKA-Cγ while at 1/1,000 for Epac2, PKA-Cα, and actin. Membranes were then washed with TBST, incubated with an anti-goat IgG alkaline phosphatase-conjugated secondary antibody at 1/3,000, anti-Mouse IgG alkaline phosphatase-conjugated 1/3,000, or anti-rabbit IgG alkaline phosphatase-conjugated 1/2,000 for 1 h at room temperature, and detection was performed using the ECF substrate for Western Blotting (GE Healthcare, London). Images were captured by the Typhoon Trio (GE Healthcare). Data was analyzed and quantified with Scion Image software (Scion Corporation, Frederick, MD, USA). Band quantification was first normalized to actin and then percentage was calculated to the non-stimulated control blotted in the same membrane. For collagen1, the upper band corresponding to collagen1α1 [47, 48] is represented, and calculations for collagen1α2 provided nearly identical results. Prior to Col1:Col3 ratio calculation, standard curves with purified collagen1 and collagen3 and a loading curve with cellular extracts for both types of collagen were analyzed showing that Col1 is more abundant than Col3 in NHDF (Supplemental Figure 3).
Quantitative RT-PCR
NHDF were serum starved for 24 h and stimulated with CGS21680 1 μM for 24 h. Total RNA was extracted and purified using the RNeasy Mini Kit (QIAGEN, 74704, Valencia, CA, USA) according to the manufacturer's protocol. Relative quantification of gene expression was performed using real-time RT-PCR on Mx3005P Real-Time PCR System (Strategene, Agilent Technologies, Santa Clara, CA, USA) with SYBR Green (Agilent Technologies, 600548, Santa Clara, CA, USA) according to the manufacturer's protocol. The following primers were used in real-time PCR amplification: ACTIN forward: 5-TCACCCACACTGTGCCCATCTACGA-3, reverse: 5-CAGCGGAACCGCTCATTGCCAATGG-3; Collagen1α1 forward: 5′-TGTTCAGCTTTGTGGACCTCCG-3′, reverse: 5′-CCGTTCTGTACGCAGGTGATTG-3′; Collagen3α1 forward: 5′-GAAGATGTCCTTGATGTGC-3′, reverse: 5′-AGCCTTGCGTGTTCGATAT-3′. mRNA abundance was determined relative to that of ACTIN.
cAMP measurement
Intracellular cAMP was measured with the Amersham (Arlington Heights, IL, USA) cAMP Biotrak Enzyme immunoassay system. Briefly, 75 % confluent NHDF were starved for 24 h and incubated at the indicating concentrations of CGS21680 for 20 min. cAMP levels were analyzed by using the non-acetylation EIA procedure according to the manufacturer's protocol.
Protein kinase A assay
The non-radioactive PepTag PKA assay (Promega, Madison, WI, USA) was used to measure PKA activity from cell lysates. The PepTag PKA assay is based on the phosphorylation of the fluorescent PKA substrate peptide, Leu-Arg-Arg-Ala-Ser-Leu-Gly (Kemptide) (PepTag A1 peptide) which, upon phosphorylation by PKA, acquires a negative charge and can be separated from the non-phosphorylated peptide by agarose gel electrophoresis. Ninety percent confluent NHDF in 100-mm culture wells were serum starved for 24 h and stimulated for 15 min with CGS21680 (1 μM). When indicated, the PKA inhibitor PKI (10 μg/ml) was added 1 h before CGS21680. Positive and negative controls and spectrophotometric quantification of kinase activity following agarose solubilization were performed according to the manufacturer's protocol.
Rap1 activation assay
Ninety percent confluent NHDF in 100-mm culture wells were serum starved for 24 h and stimulated for 15 min with CGS21680 (1 μM). Rap1 activation assays using a GST-tagged fusion protein corresponding to amino acids 788–884 of the human Ral-GDS-Rap binding domain bound to glutathione agarose (Ral GDS-RBD agarose) were performed using a Rap1 activation assay kit according to the manufacturer's directions (Millipore, Billerica, MA, USA).
RNA interference (siRNA)
Double-stranded siRNAs to Epac1 (s20360), Epac2 (s21816), the catalytic subunits PKA-Cα (s11065), PKA-Cβ (s11068), and PKA-Cγ (s11071) and negative siRNA (4390844) used as a control were purchased from Ambion (Life Technologies, Grand Island, NY, USA). Cells were transfected with siRNA (5 pmol for Epac1; 50 pmol for Epac2, PKAα, PKAβ, and PKAγ; and 25 pmol of each for the double knockdown, with the negative control at the respective concentrations), using Lipofectamine RNAiMAX (Invitrogen, Life Technologies, Grand Island, NY, USA). After 24 h, CGS21680 was added for 24 h, and cellular extracts were prepared as described above.
Statistical analysis
Statistical differences were determined using two-way ANOVA, repeated measures ANOVA followed by Newman–Keuls post-test, or Student's t test carried out using GraphPad software on a PC. The alpha nominal level was set at 0.05 in all cases. A P value of <0.05 was considered significant.
Electronic supplementary material
TGF-β1 promotes collagen type I and collagen type III increase after 24 h. NHDF cells were incubated with TGF-β1 at 0.01 ng/ml during 24 h (PDF 21 kb)
PMA reduces Col1 and Col3 at nanomolar and micromolar concentrations. a NHDF cells were incubated with increasing concentrations of PMA during 24 h. Statistics was performed by ANOVA followed by Newman–Keuls post-test: Col1 **P < 0.01 and *P < 0.05 or Col3 ### P < 0.001, ## P < 0.01, and # P < 0.05 vs. non-stimulated control. Data represent means ± SEM of three independent experiments (PDF 74 kb)
Validation of collagen1 and 3 antibodies. a Specificity of collagen antibodies; 1 μg of purified collagen1 and 3 were incubated with anti-Col1 and anti-Col3 antibodies. b Standard curves of purified collagen1 and collagen3 show a higher affinity for the anti-Col3 antibody than for the anti-Col1. Data represent means ± SEM. c Increasing loading of two different sets of protein extracts from NHDF were incubated with collagen1 and collagen3 antibodies (PPTX 410 kb)
Acknowledgements
This work was supported by grants from the National Institutes of Health (AR56672 and AR54897), NYU-HHC (Health and Hospitals Corporation) Clinical and Translational Science Institute (UL1RR029893), NYU Cancer Institute Center Support Grant, and NIH/National Cancer Institute (5 P30CA16087-31).
Conflicts of interest
AM and BNC have filed a patent on use of adenosine A2AR agonists to prevent prosthesis loosening (pending). MP-A does not have any disclosures. BNC holds patents numbers 5,932,558; 6,020,321; 6,555,545; 7,795,427; adenosine A1R and A2BR antagonists to treat fatty liver (pending); and adenosine A2AR agonists to prevent prosthesis loosening (pending). BNC is a consultant for Bristol-Myers Squibb, Novartis, CanFite Biopharmaceuticals, Cypress Laboratories, Regeneron (Westat, DSMB), Endocyte, Protalex, Allos, Inc., Savient, Gismo Therapeutics, Antares Pharmaceutical, Medivector, King Pharmaceutical, Celizome, Tap Pharmaceuticals, Prometheus Laboratories, Sepracor, Amgen, Combinatorx, Kyowa Hakka, Hoffman-LaRoche, and Avidimer Therapeutics. BNC has stock in CanFite Biopharmaceuticals.
Abbreviations
- Col1
Collagen type I
- Col3
Collagen type III
- A2AR
Adenosine A2 receptor
- NHDF
Normal human dermal fibroblasts
References
- 1.Williams JC. Adenine nucleotide degradation by the obligate intracellular bacterium Rickettsia typhi. Infect Immun. 1980;28(1):74–81. doi: 10.1128/iai.28.1.74-81.1980. [DOI] [PMC free article] [PubMed] [Google Scholar]
- 2.Hasko G, Cronstein BN. Adenosine: an endogenous regulator of innate immunity. Trends Immunol. 2004;25(1):33–39. doi: 10.1016/j.it.2003.11.003. [DOI] [PubMed] [Google Scholar]
- 3.Ohta A, Sitkovsky M. Role of G-protein-coupled adenosine receptors in downregulation of inflammation and protection from tissue damage. Nature. 2001;414(6866):916–920. doi: 10.1038/414916a. [DOI] [PubMed] [Google Scholar]
- 4.Stadelmann WK, Digenis AG, Tobin GR. Physiology and healing dynamics of chronic cutaneous wounds. Am J Surg. 1998;176(2A Suppl):26S–38S. doi: 10.1016/S0002-9610(98)00183-4. [DOI] [PubMed] [Google Scholar]
- 5.Victor-Vega C, Desai A, Montesinos MC, Cronstein BN. Adenosine A2A receptor agonists promote more rapid wound healing than recombinant human platelet-derived growth factor (Becaplermin gel) Inflammation. 2002;26(1):19–24. doi: 10.1023/A:1014417728325. [DOI] [PubMed] [Google Scholar]
- 6.Montesinos MC, Desai A, Chen JF, Yee H, Schwarzschild MA, Fink JS, Cronstein BN. Adenosine promotes wound healing and mediates angiogenesis in response to tissue injury via occupancy of A(2A) receptors. Am J Pathol. 2002;160(6):2009–2018. doi: 10.1016/S0002-9440(10)61151-0. [DOI] [PMC free article] [PubMed] [Google Scholar]
- 7.Montesinos MC, Gadangi P, Longaker M, Sung J, Levine J, Nilsen D, Reibman J, Li M, Jiang CK, Hirschhorn R, Recht PA, Ostad E, Levin RI, Cronstein BN. Wound healing is accelerated by agonists of adenosine A2 (G alpha s-linked) receptors. J Exp Med. 1997;186(9):1615–1620. doi: 10.1084/jem.186.9.1615. [DOI] [PMC free article] [PubMed] [Google Scholar]
- 8.Katebi M, Fernandez P, Chan ES, Cronstein BN. Adenosine A2A receptor blockade or deletion diminishes fibrocyte accumulation in the skin in a murine model of scleroderma, bleomycin-induced fibrosis. Inflammation. 2008;31(5):299–303. doi: 10.1007/s10753-008-9078-y. [DOI] [PMC free article] [PubMed] [Google Scholar]
- 9.Lazzerini PE, Natale M, Gianchecchi E, Capecchi PL, Montilli C, Zimbone S, Castrichini M, Balistreri E, Ricci G, Selvi E, Garcia-Gonzalez E, Galeazzi M, Laghi-Pasini F. Adenosine A2A receptor activation stimulates collagen production in sclerodermic dermal fibroblasts either directly and through a cross-talk with the cannabinoid system. J Mol Med (Berl) 2012;90(3):331–342. doi: 10.1007/s00109-011-0824-5. [DOI] [PubMed] [Google Scholar]
- 10.Perez-Aso M, Chiriboga L, Cronstein BN. Pharmacological blockade of adenosine A2A receptors diminishes scarring. FASEB Journal: Official Publication of the Federation of American Societies for Experimental Biology. 2012;26(10):4254–4263. doi: 10.1096/fj.12-209627. [DOI] [PMC free article] [PubMed] [Google Scholar]
- 11.Chan ES, Montesinos MC, Fernandez P, Desai A, Delano DL, Yee H, Reiss AB, Pillinger MH, Chen JF, Schwarzschild MA, Friedman SL, Cronstein BN. Adenosine A(2A) receptors play a role in the pathogenesis of hepatic cirrhosis. Br J Pharmacol. 2006;148(8):1144–1155. doi: 10.1038/sj.bjp.0706812. [DOI] [PMC free article] [PubMed] [Google Scholar]
- 12.Chan ES, Fernandez P, Merchant AA, Montesinos MC, Trzaska S, Desai A, Tung CF, Khoa DN, Pillinger MH, Reiss AB, Tomic-Canic M, Chen JF, Schwarzschild MA, Cronstein BN. Adenosine A2A receptors in diffuse dermal fibrosis: pathogenic role in human dermal fibroblasts and in a murine model of scleroderma. Arthritis and Rheumatism. 2006;54(8):2632–2642. doi: 10.1002/art.21974. [DOI] [PubMed] [Google Scholar]
- 13.Kaul A, Chandra M, Misra MK. Adenosine deaminase in ischemia reperfusion injury in patients with myocardial infarction. Journal of Enzyme Inhibition and Medicinal Chemistry. 2006;21(5):543–546. doi: 10.1080/14756360600774520. [DOI] [PubMed] [Google Scholar]
- 14.Chan ES, Liu H, Fernandez P, Luna A, Perez-Aso M, Bujor AM, Trojanowska M, Cronstein BN. Adenosine A2A receptors promote collagen production by a Fli1- and CTGF-mediated mechanism. Arthritis Res Ther. 2013;15(3):R58. doi: 10.1186/ar4229. [DOI] [PMC free article] [PubMed] [Google Scholar]
- 15.Che J, Chan ES, Cronstein BN. Adenosine A2A receptor occupancy stimulates collagen expression by hepatic stellate cells via pathways involving protein kinase A, Src, and extracellular signal-regulated kinases 1/2 signaling cascade or p38 mitogen-activated protein kinase signaling pathway. Mol Pharmacol. 2007;72(6):1626–1636. doi: 10.1124/mol.107.038760. [DOI] [PubMed] [Google Scholar]
- 16.Lazarova T, Brewin KA, Stoeber K, Robinson CR. Characterization of peptides corresponding to the seven transmembrane domains of human adenosine A2a receptor. Biochemistry. 2004;43(40):12945–12954. doi: 10.1021/bi0492051. [DOI] [PubMed] [Google Scholar]
- 17.Thevenin D, Roberts MF, Lazarova T, Robinson CR. Identifying interactions between transmembrane helices from the adenosine A2A receptor. Biochemistry. 2005;44(49):16239–16245. doi: 10.1021/bi051422u. [DOI] [PubMed] [Google Scholar]
- 18.Ohta A, Gorelik E, Prasad SJ, Ronchese F, Lukashev D, Wong MK, Huang X, Caldwell S, Liu K, Smith P, Chen JF, Jackson EK, Apasov S, Abrams S, Sitkovsky M. A2A adenosine receptor protects tumors from antitumor T cells. Proc Natl Acad Sci USA. 2006;103(35):13132–13137. doi: 10.1073/pnas.0605251103. [DOI] [PMC free article] [PubMed] [Google Scholar]
- 19.Bingham TC, Fisher EA, Parathath S, Reiss AB, Chan ES, Cronstein BN. A2A adenosine receptor stimulation decreases foam cell formation by enhancing ABCA1-dependent cholesterol efflux. J Leukoc Biol. 2010;87(4):683–690. doi: 10.1189/jlb.0709513. [DOI] [PMC free article] [PubMed] [Google Scholar]
- 20.Kreckler LM, Gizewski E, Wan TC, Auchampach JA. Adenosine suppresses lipopolysaccharide-induced tumor necrosis factor-alpha production by murine macrophages through a protein kinase A- and exchange protein activated by cAMP-independent signaling pathway. J Pharmacol Exp Ther. 2009;331(3):1051–1061. doi: 10.1124/jpet.109.157651. [DOI] [PMC free article] [PubMed] [Google Scholar]
- 21.Seidel MG, Klinger M, Freissmuth M, Holler C. Activation of mitogen-activated protein kinase by the A(2A)-adenosine receptor via a rap1-dependent and via a p21(ras)-dependent pathway. J Biol Chem. 1999;274(36):25833–25841. doi: 10.1074/jbc.274.36.25833. [DOI] [PubMed] [Google Scholar]
- 22.Fredholm BB, Arslan G, Halldner L, Kull B, Schulte G, Wasserman W. Structure and function of adenosine receptors and their genes. Naunyn Schmiedebergs Arch Pharmacol. 2000;362(4–5):364–374. doi: 10.1007/s002100000313. [DOI] [PubMed] [Google Scholar]
- 23.Schulte G, Fredholm BB. Signalling from adenosine receptors to mitogen-activated protein kinases. Cell Signal. 2003;15(9):813–827. doi: 10.1016/S0898-6568(03)00058-5. [DOI] [PubMed] [Google Scholar]
- 24.Insel PA, Murray F, Yokoyama U, Romano S, Yun H, Brown L, Snead A, Lu D, Aroonsakool N. cAMP and Epac in the regulation of tissue fibrosis. Br J Pharmacol. 2012;166(2):447–456. doi: 10.1111/j.1476-5381.2012.01847.x. [DOI] [PMC free article] [PubMed] [Google Scholar]
- 25.Yokoyama U, Patel HH, Lai NC, Aroonsakool N, Roth DM, Insel PA. The cyclic AMP effector Epac integrates pro- and anti-fibrotic signals. Proc Natl Acad Sci USA. 2008;105(17):6386–6391. doi: 10.1073/pnas.0801490105. [DOI] [PMC free article] [PubMed] [Google Scholar]
- 26.Ji Z, Mei FC, Miller AL, Thompson EB, Cheng X. Protein kinase A (PKA) isoform RIIbeta mediates the synergistic killing effect of cAMP and glucocorticoid in acute lymphoblastic leukemia cells. J Biol Chem. 2008;283(32):21920–21925. doi: 10.1074/jbc.M803193200. [DOI] [PMC free article] [PubMed] [Google Scholar]
- 27.Jimenez SA, Hitraya E, Varga J. Pathogenesis of scleroderma. Collagen. Rheum Dis Clin North Am. 1996;22(4):647–674. doi: 10.1016/S0889-857X(05)70294-5. [DOI] [PubMed] [Google Scholar]
- 28.Fredholm BB, Ijzerman AP, Jacobson KA, Klotz KN, Linden J. International Union of Pharmacology. XXV. Nomenclature and classification of adenosine receptors. Pharmacol Rev. 2001;53(4):527–552. [PMC free article] [PubMed] [Google Scholar]
- 29.Fernandez P, Trzaska S, Wilder T, Chiriboga L, Blackburn MR, Cronstein BN, Chan ES. Pharmacological blockade of A2A receptors prevents dermal fibrosis in a model of elevated tissue adenosine. Am J Pathol. 2008;172(6):1675–1682. doi: 10.2353/ajpath.2008.070952. [DOI] [PMC free article] [PubMed] [Google Scholar]
- 30.Eltzschig HK, Carmeliet P. Hypoxia and inflammation. N Engl J Med. 2011;364(7):656–665. doi: 10.1056/NEJMra0910283. [DOI] [PMC free article] [PubMed] [Google Scholar]
- 31.Eckle T, Kohler D, Lehmann R, El Kasmi K, Eltzschig HK. Hypoxia-inducible factor-1 is central to cardioprotection: a new paradigm for ischemic preconditioning. Circulation. 2008;118(2):166–175. doi: 10.1161/CIRCULATIONAHA.107.758516. [DOI] [PubMed] [Google Scholar]
- 32.Eckle T, Krahn T, Grenz A, Kohler D, Mittelbronn M, Ledent C, Jacobson MA, Osswald H, Thompson LF, Unertl K, Eltzschig HK. Cardioprotection by ecto-5'-nucleotidase (CD73) and A2B adenosine receptors. Circulation. 2007;115(12):1581–1590. doi: 10.1161/CIRCULATIONAHA.106.669697. [DOI] [PubMed] [Google Scholar]
- 33.Synnestvedt K, Furuta GT, Comerford KM, Louis N, Karhausen J, Eltzschig HK, Hansen KR, Thompson LF, Colgan SP. Ecto-5'-nucleotidase (CD73) regulation by hypoxia-inducible factor-1 mediates permeability changes in intestinal epithelia. J Clin Invest. 2002;110(7):993–1002. doi: 10.1172/JCI15337. [DOI] [PMC free article] [PubMed] [Google Scholar]
- 34.Higgins DF, Kimura K, Bernhardt WM, Shrimanker N, Akai Y, Hohenstein B, Saito Y, Johnson RS, Kretzler M, Cohen CD, Eckardt KU, Iwano M, Haase VH. Hypoxia promotes fibrogenesis in vivo via HIF-1 stimulation of epithelial-to-mesenchymal transition. J Clin Invest. 2007;117(12):3810–3820. doi: 10.1172/JCI30487. [DOI] [PMC free article] [PubMed] [Google Scholar]
- 35.Kong T, Westerman KA, Faigle M, Eltzschig HK, Colgan SP. HIF-dependent induction of adenosine A2B receptor in hypoxia. FASEB Journal: Official Publication of the Federation of American Societies for Experimental Biology. 2006;20(13):2242–2250. doi: 10.1096/fj.06-6419com. [DOI] [PubMed] [Google Scholar]
- 36.Grenz A, Bauerle JD, Dalton JH, Ridyard D, Badulak A, Tak E, McNamee EN, Clambey E, Moldovan R, Reyes G, Klawitter J, Ambler K, Magee K, Christians U, Brodsky KS, Ravid K, Choi DS, Wen J, Lukashev D, Blackburn MR, Osswald H, Coe IR, Nurnberg B, Haase VH, Xia Y, Sitkovsky M, Eltzschig HK. Equilibrative nucleoside transporter 1 (ENT1) regulates postischemic blood flow during acute kidney injury in mice. J Clin Invest. 2012;122(2):693–710. doi: 10.1172/JCI60214. [DOI] [PMC free article] [PubMed] [Google Scholar] [Retracted]
- 37.Koeppen M, Eckle T, Eltzschig HK. Interplay of hypoxia and A2B adenosine receptors in tissue protection. Adv Pharmacol. 2011;61:145–186. doi: 10.1016/B978-0-12-385526-8.00006-0. [DOI] [PubMed] [Google Scholar]
- 38.Clambey ET, McNamee EN, Westrich JA, Glover LE, Campbell EL, Jedlicka P, de Zoeten EF, Cambier JC, Stenmark KR, Colgan SP, Eltzschig HK. Hypoxia-inducible factor-1 alpha-dependent induction of FoxP3 drives regulatory T-cell abundance and function during inflammatory hypoxia of the mucosa. Proc Natl Acad Sci U S A. 2012;109(41):E2784–E2793. doi: 10.1073/pnas.1202366109. [DOI] [PMC free article] [PubMed] [Google Scholar]
- 39.Milne GR, Palmer TM. Anti-inflammatory and immunosuppressive effects of the A2A adenosine receptor. ScientificWorldJournal. 2011;11:320–339. doi: 10.1100/tsw.2011.22. [DOI] [PMC free article] [PubMed] [Google Scholar]
- 40.Ohta A, Madasu M, Kini R, Subramanian M, Goel N, Sitkovsky M. A2A adenosine receptor may allow expansion of T cells lacking effector functions in extracellular adenosine-rich microenvironments. J Immunol. 2009;183(9):5487–5493. doi: 10.4049/jimmunol.0901247. [DOI] [PubMed] [Google Scholar]
- 41.Yano N, Suzuki D, Endoh M, Zhao TC, Padbury JF, Tseng YT. A novel phosphoinositide 3-kinase-dependent pathway for angiotensin II/AT-1 receptor-mediated induction of collagen synthesis in MES-13 mesangial cells. J Biol Chem. 2007;282(26):18819–18830. doi: 10.1074/jbc.M610537200. [DOI] [PubMed] [Google Scholar]
- 42.Pidoux G, Tasken K. Specificity and spatial dynamics of protein kinase A signaling organized by A-kinase-anchoring proteins. J Mol Endocrinol. 2010;44(5):271–284. doi: 10.1677/JME-10-0010. [DOI] [PubMed] [Google Scholar]
- 43.Skalhegg BS, Tasken K. Specificity in the cAMP/PKA signaling pathway. Differential expression, regulation, and subcellular localization of subunits of PKA. Front Biosci. 2000;5(5):D678–D693. doi: 10.2741/Skalhegg. [DOI] [PubMed] [Google Scholar]
- 44.Insel PA, Bourne HR, Coffino P, Tomkins GM. Cyclic AMP-dependent protein kinase: pivotal role in regulation of enzyme induction and growth. Science. 1975;190(4217):896–898. doi: 10.1126/science.171770. [DOI] [PubMed] [Google Scholar]
- 45.Breckler M, Berthouze M, Laurent AC, Crozatier B, Morel E, Lezoualc'h F. Rap-linked cAMP signaling Epac proteins: compartmentation, functioning and disease implications. Cell Signal. 2011;23(8):1257–1266. doi: 10.1016/j.cellsig.2011.03.007. [DOI] [PubMed] [Google Scholar]
- 46.Dao KK, Teigen K, Kopperud R, Hodneland E, Schwede F, Christensen AE, Martinez A, Doskeland SO. Epac1 and cAMP-dependent protein kinase holoenzyme have similar cAMP affinity, but their cAMP domains have distinct structural features and cyclic nucleotide recognition. J Biol Chem. 2006;281(30):21500–21511. doi: 10.1074/jbc.M603116200. [DOI] [PubMed] [Google Scholar]
- 47.Butkowski RJ. Estimation of the size of collagenous proteins by electrophoresis and gel chromatography. In: Cunningham LW, Frederickson DW, editors. Methods in enzymology. New York: Academic Press; 1982. pp. 410–423. [Google Scholar]
- 48.Rentz TJ, Poobalarahi F, Bornstein P, Sage EH, Bradshaw AD. SPARC regulates processing of procollagen I and collagen fibrillogenesis in dermal fibroblasts. J Biol Chem. 2007;282(30):22062–22071. doi: 10.1074/jbc.M700167200. [DOI] [PubMed] [Google Scholar]
Associated Data
This section collects any data citations, data availability statements, or supplementary materials included in this article.
Supplementary Materials
TGF-β1 promotes collagen type I and collagen type III increase after 24 h. NHDF cells were incubated with TGF-β1 at 0.01 ng/ml during 24 h (PDF 21 kb)
PMA reduces Col1 and Col3 at nanomolar and micromolar concentrations. a NHDF cells were incubated with increasing concentrations of PMA during 24 h. Statistics was performed by ANOVA followed by Newman–Keuls post-test: Col1 **P < 0.01 and *P < 0.05 or Col3 ### P < 0.001, ## P < 0.01, and # P < 0.05 vs. non-stimulated control. Data represent means ± SEM of three independent experiments (PDF 74 kb)
Validation of collagen1 and 3 antibodies. a Specificity of collagen antibodies; 1 μg of purified collagen1 and 3 were incubated with anti-Col1 and anti-Col3 antibodies. b Standard curves of purified collagen1 and collagen3 show a higher affinity for the anti-Col3 antibody than for the anti-Col1. Data represent means ± SEM. c Increasing loading of two different sets of protein extracts from NHDF were incubated with collagen1 and collagen3 antibodies (PPTX 410 kb)