

Abstract
Genes encoding protein kinases tend to evolve slowly over evolutionary time, and only rarely do they appear as recent duplications in sequenced vertebrate genomes. Consequently, it was a surprise to find two families of kinase genes that have greatly and recently expanded in the zebra finch (Taeniopygia guttata) lineage. In contrast to other amniotic genomes (including chicken) that harbor only single copies of p21-activated serine/threonine kinase 3 (PAK3) and proviral integration site 1 (PIM1) genes, the zebra finch genome appeared at first to additionally contain 67 PAK3-like (PAK3L) and 51 PIM1-like (PIM1L) protein kinase genes. An exhaustive analysis of these gene models, however, revealed most to be incomplete, owing to the absence of terminal exons. After reprediction, 31 PAK3L genes and 10 PIM1L genes remain, and all but three are predicted, from the retention of functional sites and open reading frames, to be enzymatically active. PAK3L, but not PIM1L, gene sequences show evidence of recurrent episodes of positive selection, concentrated within structures spatially adjacent to N- and C-terminal protein regions that have been discarded from zebra finch PAK3L genes. At least seven zebra finch PAK3L genes were observed to be expressed in testis, whereas two sequences were found transcribed in the brain, one broadly including the song nuclei and the other in the ventricular zone and in cells resembling Bergmann's glia in the cerebellar Purkinje cell layer. Two PIM1L sequences were also observed to be expressed with broad distributions in the zebra finch brain, one in both the ventricular zone and the cerebellum and apparently associated with glial cells and the other showing neuronal cell expression and marked enrichment in midbrain/thalamic nuclei. These expression patterns do not correlate with zebra finch-specific features such as vocal learning. Nevertheless, our results show how ancient and conserved intracellular signaling molecules can be co-opted, following duplication, thereby resulting in lineage-specific functions, presumably affecting the zebra finch testis and brain.
Keywords: gene family expansion, serine/threonine kinases, PIM1-like, PAK3-like, positive selection, zebra finch
Introduction
Detailed inspection of sequenced vertebrate genomes has often revealed gene families to have expanded rapidly in one or more lineages. Expansion may occur because gene duplications are positively selected owing to their benefit. Such genes are expected to contribute greatly to species- and lineage-specific biology. However, duplications may also arise as a result of mutational biases (such as repeat-sponsored nonallelic homologous recombination) and may become fixed in the population despite conferring little or no advantage. Distinguishing these two evolutionary scenarios is far from straightforward (Nguyen et al. 2008). However, it appears likely that positive selection on duplications will be more frequent when positive selection on amino acid substitutions among paralogs has been demonstrated.
Not all gene families are equally prone to expansion. Analyses of newly sequenced vertebrate genomes have revealed that five functional classes of genes are most likely to be duplicated, namely chemosensation, immunity, reproduction, toxin degradation, and zinc finger transcription factor activity genes (Emes et al. 2003; Kosiol et al. 2008; Ponting 2008). By contrast, genes associated with certain functions, such as translation, metabolism, and cytoplasmic signaling, are rarely documented as being duplicated and appear less prone to evolution by positive selection.
We sought to identify expanded gene families in the zebra finch (Taeniopygia guttata), a vocal learning bird of the order Passeriformes which, after chicken, is only the second avian species to have its genome sequenced (Warren et al. 2010). The zebra finch and chicken genomes last shared a common ancestor approximately 100 Mya (Brown et al. 2008). Their lineages thus have had approximately the same extent of time as the basal placental mammal lineages to accumulate gene duplications and amino acid substitutions. Our study first considered the general question of whether duplicated genes in the zebra finch lineage differ from those frequently duplicated in mammals. We reasoned that genes that duplicated recently following the songbird radiation, approximately 65 Mya, would be excellent candidates for genes whose duplicates contributed to the unique neurobiology of songbirds (Clayton et al. 2009).
Our computational genomics approaches revealed unexpected and large expansions within two families that are homologous to p21-activated serine/threonine kinase 3 (PAK3) and proviral integration site 1 (PIM1) proto-oncogene serine/threonine kinase. In this study, these two families are named after PAK3-like (PAK3L) and PIM1-like (PIM1L) kinases, respectively. PAK kinases contribute many cellular processes, including cell survival, motility, mitosis, transcription, and translation (Bokoch 2003; Molli et al. 2009). In mammals, PAKs have been classified into two groups: Group I (PAK1, PAK2, and PAK3) and Group II (PAK4, PAK5/7, and PAK6) (Kreis and Barnier 2009; Molli et al. 2009). Typical Group I PAK proteins contain a C-terminal kinase domain and an N-terminal regulatory domain that, by binding the kinase domain, maintains the autoinhibited state (Lei et al. 2000; Kreis and Barnier 2009). Upon binding to small Guanosine TriPhosphate hydrolases (e.g., Cdc42 or Rac), PAKs of Group I are activated and can regulate a range of biological activities such as cytoskeletal dynamics and cell growth, death, and survival signaling (Bokoch 2003). PAK genes are also evolutionarily conserved, are expressed in diverse tissues, and are often overexpressed or hyperactivated in various cancer cells (Kumar et al. 2006; Molli et al. 2009). The PAK3 gene is primarily expressed in brain, and disruptive mutations within it are associated with X-linked, nonsyndromic mental retardation (Allen et al. 1998; Meng et al. 2005). PIM kinases are known to play important roles in cell survival, proliferation, differentiation, and tumorigenesis (Kumar et al. 2005). These kinases are distributed among three families (PIM1, PIM2, and PIM3) and each of which is highly conserved throughout animal evolution (Mikkers et al. 2004). The PIM1 gene was originally discovered as a preferential site for proviral insertion of the Moloney murine leukemia virus (MoMuLV), which may induce T-cell lymphomas in mice (Cuypers et al. 1984; Selten et al. 1985). PIM1 kinase is believed to be involved in a number of cytokine signaling pathways, is widely expressed in a variety of tissues, and is often expressed highly in tumors (Selten et al. 1985). PIM1 overexpression is associated with the development and progression of lymphomagenesis and prostate cancer (van Lohuizen et al. 1989; Dhanasekaran et al. 2001).
These two large gene family expansions in zebra finch were unexpected because their orthologs contribute to phosphorylation-dependent intracellular signaling pathways and thus are not among the five functional classes of commonly duplicated genes. Our analyses in particular establish the rapid diversification of the PAK3L kinase gene family across approximately the last 80 My. These duplications have occurred concurrently with the truncation of the genes, the retention of functional amino acids, and the positive selection on sites that owing to gene truncations are newly available for binding interactions.
Materials and Methods
Ortholog and Paralog Assignment
Orthology and paralogy assignment was performed using the Orthologous and Paralogous Transcripts In Clades (OPTIC) pipeline (Heger and Ponting 2007, 2008) on all zebra finch gene models predicted by Ensembl (Vilella et al. 2009) and our own Gpipe (Heger and Ponting 2007) pipelines, together with all Ensembl gene models for seven vertebrate species: human (Homo sapiens), mouse (Mus musculus), dog (Canis familiaris), opossum (Monodelphis domestica), platypus (Ornithorhynchus anatinus), chicken (Gallus gallus), and pufferfish (Tetraodon nigroviridis). Briefly, the OPTIC pipeline (Heger and Ponting 2008) predicted orthologs between all species pairs using PhyOP (Goodstadt and Ponting 2006) and then grouped these into clusters across all species. Within a cluster, sequences were multiply aligned with MUSCLE (Edgar 2004) after alternative exons within genes were merged while maintaining exon order and open reading frame. For each multiple alignment, phylogenetic tree topologies were estimated using TreeBeST (Vilella et al. 2009). TreeBeST employed several distance metrics including both dS (the estimated number of synonymous substitutions per synonymous site) and dN (the estimated number of nonsynonymous substitutions per nonsynonymous site). Finally, clusters were split into orthologous groups by rooting with an outgroup species (the pufferfish Tetraodon).
Gene Predictions
For each PAK3L or PIM1L Ensembl gene model, the corresponding chromosomal region (extended 20 kb in both directions) was searched exhaustively by exonerate (Slater and Birney 2005) using several known protein sequences (e.g., zebra finch PAK3 [Ensembl ID: ENSTGUG00000004384], zebra finch PAK3L-1 [ENSTGUG00000000383], and Anolis lizard PIM1 [ENSACAG00000016764]) as queries. Revised gene models (fig. 1) were examined to ensure the conservation of exon boundaries and splicing phases. To avoid artificial duplications resulting from assembly imperfections, one (preferentially the gene from unplaced sequence) of each pair of gene models with sequence identities of at least 97% was removed. Application of this threshold is expected to discard most allelic genes in the assembly, at the cost of removing some recent paralogous gene duplicates.
FIG. 1.

Phylogenetic tree of PAK-related genes constructed using MrBayes 3.1.2 (Ronquist and Huelsenbeck 2003). Sequences are derived from budding yeast (Saccharomyces cerevisiae): Ste20 (Ensembl ID: YHL007C); human (Homo sapiens): PAK1 (ENSG00000149269), PAK2 (ENSG00000180370), PAK3 (ENSG00000077264), PAK4 (ENSG00000130669), PAK6 (ENSG00000137843), and PAK7 (ENSG00000101349); chicken (Gallus gallus): PAK1 (ENSGALG00000000681), PAK2 (ENSGALG00000006426), PAK3 (ENSGALG00000008058), PAK4 (ENSGALG00000014303), PAK6 (ENSGALG00000004827), and PAK7 (ENSGALG00000008947); zebra finch (Taeniopygia guttata): PAK1 (ENSTGUG00000013034), PAK2 (ENSTGUG00000005832), PAK3 (ENSTGUG00000004384), PAK6 (ENSTGUG00000007255), PAK7 (ENSTGUG00000006182), PAK3L-1 (ENSTGUG00000000383), PAK3L-2 (ENSTGUG00000001058), PAK3L-3 (ENSTGUG00000001397), PAK3L-4 (ENSTGUG00000006253), PAK3L-5 (ENSTGUG00000006415), PAK3L-6 (ENSTGUG00000013873), PAK3L-7 (ENSTGUG00000014676), PAK3L-8 (ENSTGUG00000014731), PAK3L-9 (ENSTGUG00000015007), PAK3L-10 (ENSTGUG00000015265), PAK3L-11 (ENSTGUG00000016297), PAK3L-12 (ENSTGUG00000016405), PAK3L-13 (ENSTGUG00000016760), PAK3L-14 (ENSTGUG00000016946), PAK3L-15 (ENSTGUG00000017512), PAK3L-16 (ENSTGUG00000017514), PAK3L-17 (ENSTGUG00000017522), PAK3L-18 (ENSTGUG00000017537), PAK3L-19 (ENSTGUG00000003740), PAK3L-20 (ENSTGUG00000017535), PAK3L-21 (ENSTGUG00000014645), PAK3L-22 (ENSTGUG00000014689), PAK3L-23 (ENSTGUG00000014769), PAK3L-24 (ENSTGUG00000015498), PAK3L-25 (ENSTGUG00000016398), PAK3L-26 (ENSTGUG00000017061), PAK3L-27 (ENSTGUG00000017214), PAK3L-28 (ENSTGUG00000013955), PAK3L-29 (ENSTGUG00000014357), PAK3L-30, and PAK3L-31. Nucleotide sequences were used to estimate the tree under the following parameters: GTR+I+G, 5 million generations, 4 × 4 nucleotide substitution, sampled every 100 generations, with the consensus tree drawn using the last 25 000 trees. PAK4, PAK6, and PAK7 genes and the yeast Ste20 gene were used as outgroup sequences and are not shown in this figure. The shaded rectangle with solid lines delineates the clade of all zebra finch PAK3L genes. Similarly, the dashed rectangle delineates Clade 1 and the dotted rectangle Clade 2. The estimated  (nonsynonymous/synonymous substitution rates ratio) and divergence times (in Mya) for the clade including all PAK3L genes, Clades 1 and 2 are shown.
Survey of Expression Profiles and In Situ Hybridization
Transcript data considered in this study were collected from three sources: 1) zebra finch brain expressed sequence tag (EST) data from the ESTIMA database, sequenced as part of the Songbird Neurogenomics Initiative (Replogle et al. 2008); 2) 454 transcript sequences from six zebra finch nonbrain tissues (viz. muscle, skin, embryo, liver, testis, and spleen) (Warren et al. 2010); and 3) 454 transcript sequences from the brain of the American crow (courtesy of Garth Spellman, Christopher Balakrishnan, and Wes Warren). These transcript sequences were assigned to zebra finch gene models using a three-step procedure. First, all PAK- or PIM-related transcripts were identified using BlastN with default parameters (Altschul et al. 1990). Next, these transcripts were mapped to the zebra finch genome assembly using BlastN and only retained if they fell within 2 kb of a PAK-/PIM-related gene model. Finally, an EST was assigned to a specific PAK- or PIM-related gene model only when it showed close affinity in a Unweighted Pair Group Method with Arithmetic mean tree based on normalized pairwise sequence identities.
All the methods used in preparation of animals, cryostat section of brain tissue, probe synthesis, and nonradioactive in situ hybridization were as described in (Lovell and Mello 2010). All animal use protocols were approved by Oregon Health & Science University's Institutional Animal Care and Use Committee and are in accordance with National Institiutes of Health guidelines. We used unstimulated (i.e., acoustically isolated) adult male zebra finches (T. guttata) that were obtained from our own breeding colony or purchased from local breeders. After decapitation, brains were removed and individual hemispheres frozen in Tissue-Tek OCT (Sakura Finetek, Torrance, CA) in a dry ice/isopropanol bath, stored at −80 °C, sectioned at 10 μm, and melted onto microscrope slides.
Digoxygenin (DIG)-labeled sense and antisense riboprobes were prepared from ESTIMA clones using T7 or T3 RNA polymerases and hybridized as described in Lovell et al. (2008). Briefly, each brain section was postfixed in paraformaldehyde and acetylated, rinsed with 2× saline sodium phosphate-EDTA buffer (SSPE) (SSPE in mM: 300 NaCl, 20 NaH2PO4-H2O, and 2.5 ethylenediaminetetraacetic acid; pH 7.4), and hybridized with a solution (16 μl) containing 50% deionized formamide, 2× SSPE, 2 μg/μl transfer RNA, 1 μg/μl bovine serum albumin (BSA), 1 μg/μl poly-A in diethylpyrocarbonate-treated water, and 1 μl of DIG-labeled riboprobe. Slides were coverslipped, sealed by oil immersion, incubated overnight at 65 °C, and after decoverslipping washed by serial incubations for 1 h at room temperature (RT) in 2× SSPE, 1 h at 65 °C in 2× SSPE-containing 50% formamide, and twice in 0.1× SSPE for 30 min at 65 °C. Sections were then blocked for 30 min at RT in Tris-NaCl Blocking solution (TNB) buffer (100 mM Tris–HCl, pH 7.4; 150 mM NaCl; 20 μg/μl BSA; and 0.3% Triton X-100), washed three times in Tris-NaCl with Triton solution (TNT) (100 mM Tris–HCl, pH 7.4; 150 mM NaCl; and 0.3% Triton X-100), and incubated for 2 h in TNB with anti-DIG–alkaline phosphatase (1:300; Roche Applied Science, Manheim, Germany). Finally, after TNT washes, slides were incubated for 1–3 days in a solution of alkaline-phosphate substrates nitroblue tetrazolium (NBT) chloride and 5-bromo-4-chloro-3′-indolyphosphate p-toluidine salt (BCIP/NBT substrate solution NEL937; PerkinElmer, Waltham, MA), washed, and coverslipped with aquamount (Lerner Laboratories, Pittsburg, PA).
In situ hybridization images (e.g., fig. 2) were acquired at 5× magnification using a high-resolution digital imaging system (3i Marianas System; Intelligent Imaging Innovations; details in Lovell and Mello 2010). Additional higher power photomicrographs were acquired using brightfield and darkfield optics and a Digital camera (DVC, Austin, TX) coupled to a Nikon E600 microscope. Figures were prepared in Photoshop-CS2 (Adobe Systems Inc., San Jose, CA) and Illustrator-10 (Adobe Systems, Inc.).
FIG. 2.

Brain expression of PAK3 and PAK3L genes in adult male zebra finches revealed by in situ hybridization. (A and B) PAK3 has a broad distribution, without major regional specializations; expression in all major song control nuclei is similar to that in the surrounding regions. Shown are parasagittal sections at ∼0.8 (A) and 2.0 (B) mm from the midline. (C–I) Expression of clone DV950892 is restricted to the ventricular zone and cerebellum. (C) Diagram of parasagittal section at ∼1.4 mm indicating position of the photomicrographs in (D–I). (D) High expression in the caudal-most portion of the lateral ventricular zone. (E) Expression is high in the Purkinje cell layer (pcl) and lower in the granule cell layer (gcl) and molecular layer (ml) of the cerebellum. (F) High expression in the rostral-most portion of the lateral ventricular zone (black arrowheads) but not in the intermediate portion (white arrowheads). (G) Detailed view of the ventricular zone shows high expression in the ependymal lining. (H) Detailed view of the same region as in G, taken from an adjacent Nissl-stained section shows the high cell density in the ventricular zone. (I) Detailed view of the cerebellum shows expression in the small glial-like cells but not in the large Purkinje cells (indicated by asterisks) of the pcl; expression is much lower in the gcl and absent in the ml. Scale bars = 100 μm in (D–F) and 10 μm in (G–I). A, arcopallium; Cb, cerebellum; CMM, caudomedial mesopallium; DM, dorsomedial nucleus of the intercollicular complex; gcl, granule cell layer of the cerebellum; H, hyperpallium; Hp, hippocampus; HVC, vocal control nucleus HVC (nucleus hyperstriatalis ventralis, pars caudalis); Hypo, hypothalamus; LMAN, lateral part of the magnocellular nucleus of the anterior nidopallium; M, mesopallium; ml, molecular layer of the cerebellum; N, nidopallium; NCM, caudomedial nidopallium; pcl, Purkinje cell layer of the cerebellum; RA, robust nucleus of the arcopallium; St, striatum; Tel, telencephalon; TeO, optic tectum; Thal, thalamus; X, area X of the striatum.
Multiple Sequence Alignment and Phylogenetic Analysis
Multiple alignment of amino acid sequences was performed with MAFFT v6 (Katoh and Toh 2008) followed by manual inspection and adjustment. Alignment of nucleotide sequences was facilitated by PAL2NAL (Suyama et al. 2006), based on their aligned amino acid sequences. For phylogenetic analyses, maximum likelihood (ML) and Bayesian inference analyses were carried out using PHYML v3.0.1 (Guindon and Gascuel 2003) and MrBayes 3.1.2 (Huelsenbeck and Ronquist 2001; Ronquist and Huelsenbeck 2003), respectively. For the ML analysis, a general time-reversible (GTR+I+G) model was used. Nonparametric bootstrap analysis was performed for 1,000 replicates to examine the degree of sampling error and local tree stability. Bayesian inference was carried out using MrBayes 3.1.2 with the GTR+I+G model, 5 million generations, 4 × 4 nucleotide substitutions, sampled every 100 generations, with the consensus tree drawn using the last 25,000 trees. The phylogenies were displayed using TreeView (Page 1996).
Analyses of Selective Pressure and Timescale Estimation of Gene Family Expansions
CODEML from the PAML 4b package (Yang 1997, 2007) was used to determine the selective pressures acting on PAK3L or PIM1L gene families. To consider whether sites within these gene families have evolved by positive selection, six different site models (M0, M1a, M2a, M3, M7, and M8) were used (Yang et al. 2000) and three likelihood ratio tests (LRTs) on nested models were applied: M0 versus M3, M1a versus M2a, and M7 versus M8.
Model M0 (One ratio) assumes a constant value of ω for all sites (ω is the ratio of nonsynonymous to synonymous substitution rates). Model M1a (NearlyNeutral) assumes two classes of sites: conserved sites for which 0 < ω < 1 and others for which ω = 1 (neutral evolution). In addition to these two classes, the M2a model (PositiveSelection) considers a third class of sites whose value of ω is estimated from the data. Model M3 (Discrete) uses a general discrete distribution with three site classes, with proportions (p0, p1, and p2) and ω values (ω0, ω1, and ω2) estimated from the data. Model M7 (β) assumes a beta distribution (parameters p and q) of ω (between 0 and 1) values over sites. Finally, Model M8 (β&ω) adds an extra class of sites to the M7 (β) model, thereby allowing ω values to exceed 1. Among these models, only M2a, M3, and M8 may be used to detect sites under positive selection. LRTs were performed between a simpler null hypothesis (M0, M1a, and M7) and a more complex alternative hypothesis (M3, M2a, and M8). Convergence was ensured by performing the analysis with different starting ω values (0.3, 1.0, and 1.7). When parameter estimation was completed, both naive empirical Bayes (Nielsen and Yang 1998) and Bayes empirical Bayes (Yang et al. 2005) approaches were used to calculate the posterior probabilities among site classes.
Accelerated evolution after the expansion of PAK3L/PIM1L gene families was assessed using branch models that estimate differential ω values among branches (Yang 1998; Yang and Nielsen 1998). For PAK-related genes, three branches were considered: 1) Clade 1, 2) Clade 2, and 3) all other PAK3L genes (figs. 1 and 3). For the PIM-related gene analysis, the clade of all zebra finch PIM1L genes was compared against other PIM1 genes (fig. 4).
FIG. 3.

Schematic representation of PAK domain structures and positively selected amino acid sites in zebra finch PAK3L genes mapped on to human PAK1 structure. (A) Schematic representation of PAK1/2/3, PAK3L Clade 1 and Clade 2. The autoregulatory segment is shown in yellow, which consists of the p21-binding domain (PBD) and the autoinhibitory domain (AI). For the kinase domain, the N lobe is in light blue and C lobe is in dark blue. The putative Gβγ-binding motif (corresponding to exon 8 of PAK3L genes) is in red. The α-helix in the N-terminal region is in white (this region is absent in PAK3L genes). (B) and (C) show different sets of positively selected amino acid sites in stick form and labeled: (B) site analysis for all PAK3L genes (positively selected sites are colored in pink); (C) Clade-wise site analysis (positively selected sites from Clade 1 are in purple and sites from Clade 2 in green). Figures were produced using the UCSF Chimera package (Pettersen et al. 2004).
FIG. 4.

Phylogenetic tree of PIM-related genes constructed using PHYML v3.0.1 (Guindon and Gascuel 2003). Nucleotide sequences are derived from nematode (Caenorhabditis elegans): PIM (NCBI GenPept ID: NP_497696.2); human (Homo sapiens): PIM1 (Ensembl ID: ENSG00000137193), PIM2 (ENSG00000102096), and PIM3 (ENSG00000198355); chicken (Gallus gallus): PIM1 (ENSGALG00000000742) and PIM3 (ENSGALG00000023576); zebra finch (Taeniopygia guttata): PIM1 (ENSTGUG00000000954), PIM3 (ENSTGUG00000003897), PIM1L-1 (ENSTGUG00000016485), PIM1L-2 (ENSTGUG00000015552), PIM1L-3 (ENSTGUG00000016751), PIM1L-4 (ENSTGUG00000015140), PIM1L-5 (ENSTGUG00000013726), PIM1L-6 (ENSTGUG00000014083), PIM1L-7 (ENSTGUG00000014454), PIM1L-8 (ENSTGUG00000015232), PIM1L-9 (ENSTGUG00000015242), and PIM1L-10 (ENSTGUG00000016198). The tree was bootstrapped for 1,000 replicates, and bootstrap values are shown on nodes. PIM_nematode was used as an outgroup. The shaded rectangle delineates the zebra finch clade of PIM1L genes. The estimated for PIM1L genes and other PIM1 genes are provided. The estimated timescales for the duplications of PIM1L genes are shown (in Mya).
Timescales for the radiation of genes in PAK3L or PIM1L families were estimated using CodonRates 1.0 (Seo et al. 2004). These estimations used two calibration points: 1) 310 Mya, the proposed split between mammals and birds (Hedges 2002; Reisz and Muller 2004) and 2) 100 Mya, the proposed divergence of Galliformes and Passeriformes (Brown et al. 2008). Besides the timescale estimation directly from CodonRates, we also calculated the timescales based on dS values estimated by CodonRates.
Results
We started by reconstructing the phylogenies of all zebra finch gene models, predicted by Ensembl (Vilella et al. 2009) and our own Gpipe (Heger and Ponting 2007) pipelines, together with all Ensembl gene models for seven vertebrate species: human (H. sapiens), mouse (M. musculus), dog (C. familiaris), opossum (M. domestica), platypus (O. anatinus), chicken (G. gallus), and pufferfish (T. nigroviridis), with the latter used as an outgroup. Our phylogeny prediction exploits all available transcript models and employs both dS and dN as distance metrics. Each phylogeny that contained at least one gene from both a bird and a mammal was inferred to represent a single gene that was present in the genome of their last common ancestor approximately 310 Mya (Hedges 2002; Reisz and Muller 2004). Phylogenies specific to either avian or mammalian lineages (but not both) may represent genes that emerged de novo in a lineage, have been deleted in one of the lineages, or might reflect incomplete genome assemblies in either chicken or zebra finch.
We automatically inspected each of these gene phylogenies to identify those with gene duplications on the zebra finch lineage, after the split with mammals. This resulted in a list of phylogenies ranked by the numbers of such duplications (Warren et al. 2010). As we have discussed elsewhere (Warren et al. 2010), the phylogeny displaying the most prolific expansion was of olfactory receptor (type OR5U1) genes. This suggests that, as for many mammals and birds, the repertoire of odorant reception by zebra finch has evolved markedly during approximately the last 100 My (Steiger et al. 2009).
The next most prolific gene family expansions in the zebra finch lineage, however, involved the PAK3L and PIM1L serine/threonine protein kinase gene families. This was a surprise given that signaling enzymes, such as kinases or phosphatases, had not been described previously as having been frequently duplicated in amniotic genomes. Sixty-seven PAK3L and 51 PIM1L gene models were initially predicted to be present in the current zebra finch genome assembly by Ensembl pipelines (Hubbard et al. 2009). However, further inspection of these gene models revealed that most were truncated with respect to their orthologs from diverse metazoan species. Consequently, we subsequently performed exhaustive searches of the zebra finch genome assembly to provide improved sets of plausible genes, starting first with the PAK3L set, followed by PIM1L genes.
PAK3L Genes
Mammalian PAK3 genes share a conserved gene structure with conserved exon–intron boundaries and splicing phases. Sixty-seven Ensembl PAK3L genes were predicted from the zebra finch genome assembly. However, none of these contained 5′ exons encoding the N-terminal regulatory domain. Furthermore, many of these gene models were incomplete for the eight exons that encode the kinase domain. To address this issue, we exhaustively repredicted each of these PAK3L gene loci using exonerate (Slater and Birney 2005) and multiple protein sequences as templates. As many pairs of predicted PAK3L genes contained virtually identical sequences that may result from assembly imperfections, we removed one of each pair whose nucleotide identity was at least 97%.
Following reprediction of these genes and the removal of near-identical or partial models, 31 PAK3L genes on multiple chromosomes (viz. one each on chromosome 3 [chr3], chr4A, chr13, 11 from chrZ, and 17 genes not placed on chromosomes) remained. These models contained at least exons 3–7 of the eight exons that together encode the protein kinase domain. Upon close inspection of these PAK3L proteins, catalytic sites of human PAK1 kinase (Lys299, Glu315, Asp389, and Asp407), and the phosphorylation site (Thr423), are conserved, with three exceptions (supplementary fig. 1, Supplementary Material online). This level of conservation is consistent with at least some of these models representing enzymatically active genes.
The inferred phylogeny of these PAK3L genes (fig. 1) indicates that they are monophyletic with all duplications having occurred within the zebra finch terminal lineage after the split with the chicken lineage. We identified two separate clades of zebra finch PAK3L genes (fig. 1) differing by the presence or absence of exon 8 (fig. 3A). The corresponding region of exon 8 encodes a G-protein β subunit–binding motif in the yeast Ste20p ortholog, which is important for the activation of the mitogen-activated protein kinase cascade (Leeuw et al. 1998). The Gβγ-binding motif “SSLXPL” (Leeuw et al. 1998) is fully conserved among Clade 1 PAK3L proteins. By contrast, exon 8 and its encoded binding motif are absent from Clade 2 proteins. We note that Li et al. (2003) demonstrated that this region is not involved in Gβγ-binding interaction in mammals. This inconsistency may reflect distinct effects of Gβγ binding: its stimulation of kinase activity in yeast Ste20 (Leeuw et al. 1998), whereas it inhibits kinase activity in mammalian PAK1 (Wang et al. 1999). Whether this region of PAK3L proteins binds to Gβγ remains unknown. Nevertheless, for convenience, we shall refer to this region as a “putative Gβγ-binding motif.”
By comparing PAK3L sequences with available zebra finch EST data, we found seven PAK3L genes to have evidence for expression in the testis and two in the brain (supplementary table 1, Supplementary Material online). In addition, we conducted an in situ hybridization analysis of brain expression in adult male zebra finches using probes derived from the ESTIMA songbird brain cDNA collection for PAK3 (CK307206), PAK3L-4 (CK311654), and a third PAK3L clone (DV950892) that shows high sequence similarity to several PAK3L models yet cannot be assigned unambiguously to a single locus in the genome assembly. PAK3 (CK307206) was found to have a broad brain distribution, with somewhat lower expression in the striatum but otherwise no major regional differences in its expression pattern (fig. 2A and B). Of particular note, PAK3 is expressed in the major telencephalic song nuclei (HVC, RA, LMAN, and area X), although expression in these nuclei is comparable with the surrounding regions (fig. 2B). Similarly, PAK3L-4 (CK311654) exhibited a broad distribution without substantial regional differentiation, although at a somewhat lower expression level than PAK3 (not shown). In sharp contrast, probes derived from ESTIMA clone DV950892 showed a very restricted brain distribution (fig. 2C–I), with detectable expression only in the ventricular region (fig. 2F–H) and in the Purkinje cell layer of the cerebellum (fig. 2I). Interestingly, expression was not uniform along the ventricular zone, giving an indication of regional specializations in the lining of the lateral ventricle. Specifically, expression was high in the caudal- and rostral-most portions of the lateral ventricle (fig. 2D and F, respectively, black arrowheads), where most cells that make up the ependymal epithelium appeared labeled (fig. 2G and H), but expression was absent in the intermediate region (fig. 2F, white arrowheads). In the cerebellum, labeling was observed over small cells in the Purkinje cell layer and absent over large gaps that correspond to the Purkinje cells (fig. 2I*), in a pattern consistent with expression in glial cells, particularly Bergmann's glia.
Further analysis revealed the expression of a PAK3L gene (most similar to zebra finch PAK3L-4, supplementary file 1, Supplementary Material online) in the brain of the American crow (Corvus brachyrhynchos), which like the zebra finch is also a vocal learning bird of the Order Passeriformes. Consequently, it appears that PAK3L genes are not specific to zebra finch but arose, by duplication, after the divergence of Galliformes and Passeriformes, in the passeriform terminal lineage.
PAML site analysis provided strong evidence for positive selection in PAK3L genes with nine amino acid sites predicted to have evolved by positive selection (supplementary file 1 and supplementary tables 2–7, Supplementary Material online). In protein structure models (fig. 3B and C), these sites cluster within structures spatially adjacent to regions that have been lost from PAK3L genes compared with ancestral PAK genes (e.g., PAK1 or PAK3) (fig. 3A). For example, site Asn302 that was predicted from the analysis of all PAK3L genes to be under positive selection (fig. 3) lies adjacent to the N-terminal α-helix, which is absent from PAK3L proteins. Similarly, site Leu397 (predicted to be under positive selection in the analysis of Clade 2) lies close to the putative Gβγ-binding motif, which is missing in proteins from Clade 2. It is also noteworthy that six positively selected sites cluster near to PAK regions interacting with the autoregulatory segment (shown in yellow in fig. 3), which is absent from all PAK3L proteins. Based on these observations, it appears that the positively selected amino acid sites are concentrated in regions spatially adjacent to secondary structures that have been lost from PAK3L proteins. One possible explanation for this phenomenon is that when a region (i.e., autoregulatory segment, N-terminal α-helix, or putative Gβγ-binding motif) was lost from PAK3L proteins, the surrounding regions were subject to positive selection to compensate for the functional effects of such a loss. Another explanation is that these newly exposed sites accumulate changes that permit innovative binding interactions.
PAML analysis using branch model showed that the clade of PAK3L genes has evolved very rapidly ( = 0.588), relative to PAK3 genes ( = 0.017). This indicates that PAK3L genes have been subject to accelerated evolution after the innovation and expansion of PAK3L genes. Interestingly, within PAK3L genes, different clades possess distinctive values. The ratio for Clade 1 is 0.371, whereas for Clade 2 it is 1.293. This indicates that selective pressures vary greatly between different clades of PAK3L genes and that PAK3L genes in Clade 2 have evolved more rapidly subsequent to their loss of the eighth exon. Using dS, estimated by CodonRates 1.0 (Seo et al. 2004), as a distance metric, we estimated that all PAK3L genes have arisen in the past 79.2–84.6 My, with many gene duplications occurring more recently within the past 5 Mya (fig. 1). Therefore, the estimated timescale for the emergence of PAK3L genes (79.2–84.6 Mya) predates the radiation of songbirds (∼65 Mya). However, the expansions of Clade 1 and Clade 2 genes appear to have been considerably more recent than the proposed divergence between zebra finch and American crow (Passeroidea–Corvoidea split, ∼46.7 Mya [Pereira and Baker 2006]) and hence are likely to be specific to the zebra finch terminal lineage.
PIM1L Genes
PIM1, PIM2, and PIM3 genes from mammals and birds all share a gene structure of six coding exons with conserved splicing phases and exon boundaries. In zebra finch, besides a single PIM1 gene (represented by an incomplete gene model due to an assembly gap) on chromosome 26 that lies in conserved synteny with mammalian PIM1 genes, there are 51 PIM1L genes predicted by Ensembl to be present on five different chromosomes (one each from chr5, chr8, chr24 and chr26, and 47 from unplaced sequences). Strikingly, none of these gene models contained six exons, and thus, all were incomplete with respect to the ancestral gene. After exhaustive reprediction of these PIM1L genes, all these newly predicted gene models remained incomplete. After removing near-identical gene models, we further discarded all gene models without the 3′ terminal four exons (exons 3–6) because these exons encode much of the protein kinase catalytic domain. From a multiple sequence alignment of the remaining ten sequences (chromosomal coordinates provided in supplementary table 8, Supplementary Material online), we observed that all amino acids important for kinase activity have been retained (supplementary fig. 2, Supplementary Material online). More specifically, ATP-binding residues (Lys67, Glu89, Lys169, Asn172, and Asp186; human PIM1 numbering), the catalytic residue Asp167 (Qian et al. 2005), and the PIM-specific residue Pro123 (Kumar et al. 2005) are fully conserved among all ten PIM1L proteins. By constructing a phylogenetic tree containing these PIM1L genes, as well as PIM family genes from nematode, chicken, zebra finch, and human, we observed that the ten zebra finch PIM1L genes are monophyletic: They exhibit closer affinity to each other than to zebra finch or chicken PIM1 genes (fig. 4). These genes thus appear to have arisen via duplication events that occurred after the split separating zebra finch from chicken lineages, 100 Mya (Brown et al. 2008).
Although no EST similar to PIM1L genes was identified among sequence transcripts from American crow brain, we identified clear evidence for the expression of PIM1L genes in zebra finch brain and testis (supplementary file 1, Supplementary Material online). For example, a brain-derived cDNA clone DV954383 from the ESTIMA database is clearly associated with a PIM1L gene. This clone is most similar (with 95% sequence identity) to PIM1L-10 (Ensembl ID: ENSTGUG00000016198), but it mapped to several genomic locations with similar sequence identities and thus cannot be assigned to a specific PIM1L gene unambiguously.
We also obtained in situ hybridization evidence of brain expression for two groups of PIM1L-related clones. Clones DV954383 and DV951279 likely represent transcript variants of the same PIM1L locus and show essentially identical expression patterns; we present here the data obtained for DV954383. Despite local differences in the density of neuronal cells that are known to exist in regions such as the telencephalon and brainstem, this clone is expressed in a sparse cell population that is uniformly distributed throughout the whole brain (fig. 5A′). We note that a conspicuous feature of DV954383 expression observed at the cellular level is that the labeling is typically present in the nucleus in a characteristic punctate fashion (fig. 5A′ insets, and fig. 5F and G); the majority of the labeled cells throughout the parenchyma of the brain exhibited this pattern. Expression is also clearly present and uniform in regions that lack neuronal cells, such as fiber tracts (fig. 5D′), commissures, and laminae, strongly suggesting that expression is in glial cells, occurring largely in oligodendrocytes. We also observed some enrichment of expression in the cerebellum and in the ventricular zone (fig. 5A′). In the cerebellum (fig. 5E′), there was strong expression in sparse cell populations in the molecular (see detail in fig. 5A′ left inset) and granule cell layers and very strong expression in the Purkinje cell layer. A closer look revealed some Purkinje cells to be strongly labeled (fig. 5F, black arrowheads), whereas others were completely devoid of signal (fig. 5F, empty arrowheads). In the ventricular zone, there was a strong signal in just a subset of cells within the epithelial lining of the ventricle (fig. 5G). We also observed some enrichment of DV954383 expression in a couple of pretectal nuclei, namely spiriformis lateralis and pretectalis medialis (fig. 5I and I′).
FIG. 5.
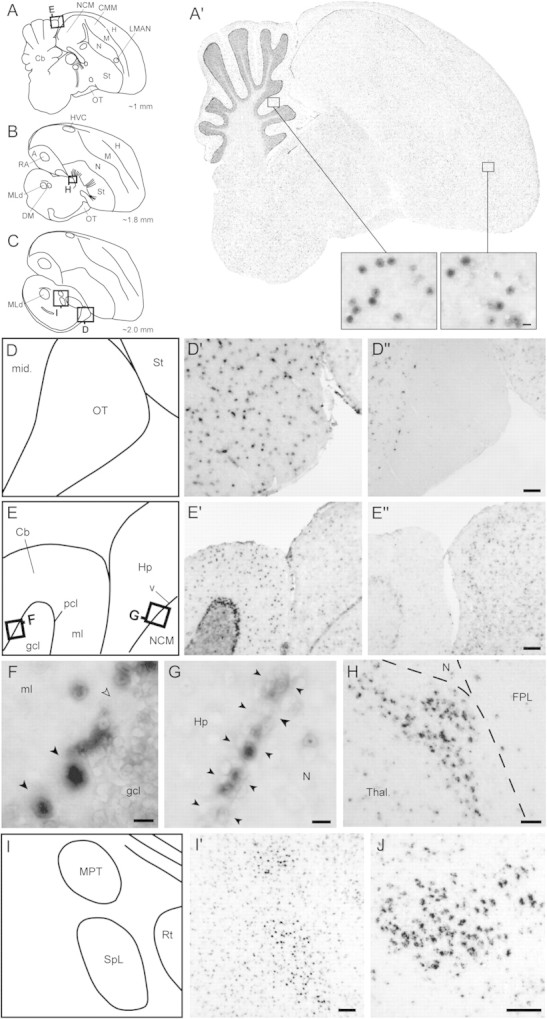
Brain expression of PIM1L genes in adult male zebra finches revealed by in situ hybridization. (A–C) Diagrams of parasagittal sections depicting the brain levels analyzed for expression of PIM1L genes; squares indicate the position of the photomicrographs in (D–J). (A′) DV954383 exhibits a broad and largely uniform brain distribution, with some enrichment in the ventricular zone and cerebellum; insets show detailed views of labeling at the cellular level for the cerebellar molecular layer and the hyperpallium, with a punctate distribution that appears to be largely nuclear. (D) Schematic diagram depicting portions of the midbrain and optic tract (location indicated in C) shown in (D′) and (D′′). (D′) DV954383 is uniformly expressed in a discrete cell population in the optic tract and in adjacent parts of the midbrain. (D′′) DV959014 is expressed in the midbrain but is clearly absent in the optic tract. (E) Schematic diagram depicting portions of the cerebellum and hippocampus (location indicated in A) shown in (E′) and (E′′). (E′) DV954383 is strongly expressed in the Purkinje cell layer and in sparse cell populations in the molecular and granular cell layers of the cerebellum. (E′′) DV959014 has uniform and moderate expression in the hippocampus and NCM but lacks enrichment in different layers of the cerebellum or in the lateral ventricle. (F) Detailed view of the cerebellum (location shown in E) demonstrates strong expression of DV954383 over some Purkinje cells (black arrowheads), whereas others are clearly negative (empty arrowhead), and over discrete cells in the molecular layer. (G) Detailed view of the lateral ventricle (location shown in E) demonstrates strong expression of DV954383 over discrete cells in the ventricular zone (indicated by black arrowheads) between the hippocampus and the nidopallium. (H) Detailed view of the dorsal thalamus (location shown in B) demonstrates strong expression of DV959014 in a discrete nucleus of unknown identity. (I) Schematic diagram depicting portions of the thalamus and pretectal area (location indicated in C) shown in (I′). (I′) DV954383 shows enriched expression in the medial pretectal nucleus and in nucleus spiriformis lateralis. (J) DV959014 is highly enriched in the nucleus spiriformis medialis. Scale bars: 100 μm for (D), (E), (H), (I), and (J); 10 μm for (F) and (G), and for insets in (A′). Abbreviations: A, arcopallium; Cb, cerebellum; CMM, caudomedial mesopallium; DM, dorsomedial nucleus of the intercollicular complex; FPL, fasciculus prosencephali lateralis; gcl, granule cell layer of the cerebellum; H, hyperpallium; Hp, hippocampus; HVC, vocal control nucleus HVC (nucleus hyperstriatalis ventralis, pars caudalis); LMAN, lateral part of the magnocellular nucleus of the anterior nidopallium; M, mesopallium; mid, midbrain; ml, molecular layer of the cerebellum; MLd, dorsal part of the lateral mesencephalic nucleus; MPT, medial pretectal nucleus; N, nidopallium; NCM, caudomedial nidopallium; OT, optic tract; pcl, Purkinje cell layer of the cerebellum; RA, robust nucleus of the arcopallium; Rt, nucleus rotundus; Sp, nucleus spiriformis; St, striatum; Tel, telencephalon; TeO, optic tectum; Thal, thalamus; v, ventricle; X, area X of the striatum.
The other two PIM1L-related clones analyzed (DV959014 and FE733390) are also closely related and appear to represent transcript variants of another PIM1L gene. However, an unambiguous identification is presently not possible because these clones have multiple close matches to the genome. The two clones yielded essentially identical expression patterns; we report here on the results obtained for DV959014. This clone exhibited a broad brain distribution (not shown), but in sharp contrast to DV954383, its expression respected the boundaries with commissures, fiber tracts (fig. 5D′′), laminae, and the ventricular zone. Furthermore, in contrast to the hippocampus and other pallial fields, expression was very low in fiber-rich regions such as the cerebellar molecular layer (fig. 5E′′), suggesting that expression occurs preferentially in neuronal cells. We observed a significant enrichment of expression in a few specific nuclei, including a nucleus in the dorsal thalamus (fig. 5H) of unknown identity and the pretectal nucleus spiriformis medialis (fig. 5J).
Finally, we sought evidence for positive selection on amino acid substitutions within the alignment of ten zebra finch PIM1L genes. Using PAML, we observed that the patterns of evolution for these genes were more compatible with models of negative selection and neutral evolution on codons than models with, in addition, sites under positive selection (supplementary tables 9 and 10, Supplementary Material online). PIM1L genes hence exhibit no evidence for positive selection on their sequences. Nevertheless, results of branch model analysis show that the rate ratio for PIM1L genes is 0.258, which is substantially larger than the ratio for PIM1 genes (0.055). This indicates that zebra finch PIM1L amino acid sequences have evolved faster following the gene expansion than have the ancestral single copy genes. The timescale for the initial duplication of PIM1L genes was estimated from dS values to be 61.1–63.9 Mya.
Discussion
Our analysis of zebra finch gene phylogenies has revealed highly unusual expansions of PAK3L and PIM1L gene families. Four lines of evidence suggest that these genes encode functional kinases. First, the values of these genes often are substantially smaller than 1, indicating that the predominant action of purifying selection is upon amino acid replacements. Second, for positively selected sites in PAK3L genes, most notably those that are spatially adjacent to segments in PAK3 that are absent from zebra finch PAK3L molecules, values significantly exceed 1 (supplementary tables 2, 4, 6, and 9, Supplementary Material online), thereby predicting the action of positive selection, another indicator of functionality. Third, functional (e.g., catalytic) sites appear to have been preferentially retained, and lastly, there is evidence for several of these zebra finch kinase genes being expressed in the testis and/or brain.
Some PAK3L genes appear to be only expressed in the testis (e.g., PAK3L-1, PAK3L-3, and PAK3L-24), whereas PAK3L-4 is expressed in both brain and testis, and PAK3L-9 has expression evidence in spleen, skin, and testis. This is in contrast to the restricted expression of mammalian PAK3 in the central nervous system (CNS) (Manser et al. 1995; Kreis et al. 2008), which is regulated by the Dlx homeobox genes (Cobos et al. 2007) and neurogenin (Souopgui et al. 2002). It appears that the expression of PAK3L genes is not limited to the CNS and thus may not remain under the control of Dlx homeobox genes or neurogenin. These observations suggest that the expansion of PAK3L genes may be largely related to testis function, although a few genes continue to be related to brain function.
The expression of PAK3L or PIM1L genes in the brain of zebra finch is of particular interest because much zebra finch research centres on vocal learning, brain, and neurological disease. Furthermore, in mammals, PAK3 is expressed primarily in the brain, and its disruption is associated with nonsyndromic mental retardation (Allen et al. 1998; Meng et al. 2005). We thus considered whether the species-specific expansion of the family of PAK3L genes is related to the vocal learning ability of zebra finch.
Although expression patterns failed to reveal evidence for differential regulation of PAK3 or PAK3L genes in any of the song control areas, this does not necessarily mean that PAK3 and PAK3L genes do not play roles in vocal learning or singing. Rather, these genes appear to affect a broad array of potential brain targets, including several that are known to be involved in vocal learning in songbirds.
We note that this is not the first documented example of an intracellular signaling molecule whose gene has been duplicated and then diverged. For example, the family of mouse sperm–associated glutamate (E)-rich (Speer) genes is believed to have originated from a partial duplication of Dlg5 in early murid rodent evolution (Spiess et al. 2003). Numerous recent duplications have made this the largest gene family expansion of the mouse lineage (Church et al. 2009). The similarities between PAK3L and Speer genes extend also to their predominant expression in the testis and brain (Tu et al. 2007), although Speer genes do not encode active enzymes.
Surprisingly, PAK3L genes do not encode the N-terminal regulatory domain, which is present in all other PAK proteins. Perhaps following the loss of their N-terminal regulatory domains, PAK3L proteins acquired novel functions distinct from those of the ancestral form. It is notable that a truncated PAK1 construct can serve as a dominant-negative inhibitor and blocks Nerve Growth Factor-induced neurite outgrowth (Daniels et al. 1998). PAK3L genes, which are truncated with respect to PAK3, thus may also convey dominant-negative functions.
From the absence of their N-terminal regulatory domains, it is likely that PAK3L proteins do not require activation by Cdc42 or Rac and thus possess constitutive kinase activity. This scenario is analogous to some splicing variants of mammalian PAK3 (e.g., PAK3b, PAK3c, and PAK3cb) that exhibit constitutive kinase activity in the brain, owing to the interruption of N-terminal regulatory domain by the insertion of additional exons b and/or c (Rousseau et al. 2003; Kreis et al. 2008). Constitutive activities of PAK3L proteins would be consistent with their roles in proliferative processes in the brain. This is supported by the expression of zebra finch clone DV950892 in the telencephalic lateral ventricle and in cerebellar cells that resemble Bergmann's glia. The lateral ventricle of songbirds is an area of continued cell proliferation, giving rise to new neurons that become incorporated into the adult song control system (Wilbrecht and Kirn 2004), and Bergmann's glial cells have been suggested in rodents to constitute cerebellar adult stem cells due to their continued expression of stem cell markers in adulthood (Sottile et al. 2006). Clearly, while the molecular functions of the expanded kinase families described here remain to be defined, their rapid sequence evolution implicates them in biological roles in the brain and/or testis that contribute to songbird-specific biology.
Supplementary Material
Supplementary files 1 and 2, tables 1–10, and figs. 1 and 2 are available at Molecular Biology and Evolution online (http://www.mbe.oxfordjournals.org/).
Acknowledgments
We are very grateful to Garth Spellman (Black Hills State University) and Christopher Balakrishnan (University of Illinois at Urbana–Champaign) for collecting and preparing the American crow RNA sample and to Wes Warren (Genome Sequencing Center, Washington University) for the corresponding sequencing data. L.K. would like to thank the Biotechnology and Biological Sciences Research Council, UK, for funding a Career Development Fellowship.
References
- Allen KM, Gleeson JG, Bagrodia S, Partington MW, MacMillan JC, Cerione RA, Mulley JC, Walsh CA. PAK3 mutation in nonsyndromic X-linked mental retardation. Nat Genet. 1998;20:25–30. doi: 10.1038/1675. [DOI] [PubMed] [Google Scholar]
- Altschul SF, Gish W, Miller W, Myers EW, Lipman DJ. Basic local alignment search tool. J Mol Biol. 1990;215:403–410. doi: 10.1016/S0022-2836(05)80360-2. [DOI] [PubMed] [Google Scholar]
- Bokoch GM. Biology of the p21-activated kinases. Annu Rev Biochem. 2003;72:743–781. doi: 10.1146/annurev.biochem.72.121801.161742. [DOI] [PubMed] [Google Scholar]
- Brown JW, Rest JS, Garcia-Moreno J, Sorenson MD, Mindell DP. Strong mitochondrial DNA support for a Cretaceous origin of modern avian lineages. BMC Biol. 2008;6:6. doi: 10.1186/1741-7007-6-6. [DOI] [PMC free article] [PubMed] [Google Scholar]
- Church DM, Goodstadt L, Hillier LW, et al. Lineage-specific biology revealed by a finished genome assembly of the mouse. PLoS Biol. 2009;7:e1000112. doi: 10.1371/journal.pbio.1000112. [DOI] [PMC free article] [PubMed] [Google Scholar]
- Clayton DF, Balakrishnan CN, London SE. Integrating genomes, brain and behavior in the study of songbirds. Curr Biol. 2009;19:R865–R873. doi: 10.1016/j.cub.2009.07.006. [DOI] [PMC free article] [PubMed] [Google Scholar]
- Cobos I, Borello U, Rubenstein JL. Dlx transcription factors promote migration through repression of axon and dendrite growth. Neuron. 2007;54:873–888. doi: 10.1016/j.neuron.2007.05.024. [DOI] [PMC free article] [PubMed] [Google Scholar]
- Cuypers HT, Selten G, Quint W, Zijlstra M, Maandag ER, Boelens W, van Wezenbeek P, Melief C, Berns A. Murine leukemia virus-induced T-cell lymphomagenesis: integration of proviruses in a distinct chromosomal region. Cell. 1984;37:141–150. doi: 10.1016/0092-8674(84)90309-x. [DOI] [PubMed] [Google Scholar]
- Daniels RH, Hall PS, Bokoch GM. Membrane targeting of p21-activated kinase 1 (PAK1) induces neurite outgrowth from PC12 cells. EMBO J. 1998;17:754–764. doi: 10.1093/emboj/17.3.754. [DOI] [PMC free article] [PubMed] [Google Scholar]
- Dhanasekaran SM, Barrette TR, Ghosh D, Shah R, Varambally S, Kurachi K, Pienta KJ, Rubin MA, Chinnaiyan AM. Delineation of prognostic biomarkers in prostate cancer. Nature. 2001;412:822–826. doi: 10.1038/35090585. [DOI] [PubMed] [Google Scholar]
- Edgar RC. MUSCLE: multiple sequence alignment with high accuracy and high throughput. Nucleic Acids Res. 2004;32:1792–1797. doi: 10.1093/nar/gkh340. [DOI] [PMC free article] [PubMed] [Google Scholar]
- Emes RD, Goodstadt L, Winter EE, Ponting CP. Comparison of the genomes of human and mouse lays the foundation of genome zoology. Hum Mol Genet. 2003;12:701–709. doi: 10.1093/hmg/ddg078. [DOI] [PubMed] [Google Scholar]
- Goodstadt L, Ponting CP. Phylogenetic reconstruction of orthology, paralogy, and conserved synteny for dog and human. PLoS Comput Biol. 2006;2:e133. doi: 10.1371/journal.pcbi.0020133. [DOI] [PMC free article] [PubMed] [Google Scholar]
- Guindon S, Gascuel O. A simple, fast, and accurate algorithm to estimate large phylogenies by maximum likelihood. Syst Biol. 2003;52:696–704. doi: 10.1080/10635150390235520. [DOI] [PubMed] [Google Scholar]
- Hedges SB. The origin and evolution of model organisms. Nat Rev Genet. 2002;3:838–849. doi: 10.1038/nrg929. [DOI] [PubMed] [Google Scholar]
- Heger A, Ponting CP. Evolutionary rate analyses of orthologs and paralogs from 12 Drosophila genomes. Genome Res. 2007;17:1837–1849. doi: 10.1101/gr.6249707. [DOI] [PMC free article] [PubMed] [Google Scholar]
- Heger A, Ponting CP. OPTIC: orthologous and paralogous transcripts in clades. Nucleic Acids Res. 2008;36:D267–D270. doi: 10.1093/nar/gkm852. [DOI] [PMC free article] [PubMed] [Google Scholar]
- Hubbard TJ, Aken BL, Ayling S, et al. Ensembl 2009. Nucleic Acids Res. 2009;37:D690–D697. doi: 10.1093/nar/gkn828. [DOI] [PMC free article] [PubMed] [Google Scholar]
- Huelsenbeck JP, Ronquist F. MRBAYES: Bayesian inference of phylogenetic trees. Bioinformatics. 2001;17:754–755. doi: 10.1093/bioinformatics/17.8.754. [DOI] [PubMed] [Google Scholar]
- Katoh K, Toh H. Recent developments in the MAFFT multiple sequence alignment program. Brief Bioinform. 2008;9:286–298. doi: 10.1093/bib/bbn013. [DOI] [PubMed] [Google Scholar]
- Kosiol C, Vinar T, da Fonseca RR, Hubisz MJ, Bustamante CD, Nielsen R, Siepel A. Patterns of positive selection in six Mammalian genomes. PLoS Genet. 2008;4:e1000144. doi: 10.1371/journal.pgen.1000144. [DOI] [PMC free article] [PubMed] [Google Scholar]
- Kreis P, Barnier JV. PAK signalling in neuronal physiology. Cell Signal. 2009;21:384–393. doi: 10.1016/j.cellsig.2008.11.001. [DOI] [PubMed] [Google Scholar]
- Kreis P, Rousseau V, Thevenot E, Combeau G, Barnier JV. The four mammalian splice variants encoded by the p21-activated kinase 3 gene have different biological properties. J Neurochem. 2008;106:1184–1197. doi: 10.1111/j.1471-4159.2008.05474.x. [DOI] [PubMed] [Google Scholar]
- Kumar A, Mandiyan V, Suzuki Y, Zhang C, Rice J, Tsai J, Artis DR, Ibrahim P, Bremer R. Crystal structures of proto-oncogene kinase Pim1: a target of aberrant somatic hypermutations in diffuse large cell lymphoma. J Mol Biol. 2005;348:183–193. doi: 10.1016/j.jmb.2005.02.039. [DOI] [PubMed] [Google Scholar]
- Kumar R, Gururaj AE, Barnes CJ. p21-activated kinases in cancer. Nat Rev Cancer. 2006;6:459–471. doi: 10.1038/nrc1892. [DOI] [PubMed] [Google Scholar]
- Leeuw T, Wu C, Schrag JD, Whiteway M, Thomas DY, Leberer E. Interaction of a G-protein beta-subunit with a conserved sequence in Ste20/PAK family protein kinases. Nature. 1998;391:191–195. doi: 10.1038/34448. [DOI] [PubMed] [Google Scholar]
- Lei M, Lu W, Meng W, Parrini MC, Eck MJ, Mayer BJ, Harrison SC. Structure of PAK1 in an autoinhibited conformation reveals a multistage activation switch. Cell. 2000;102:387–397. doi: 10.1016/s0092-8674(00)00043-x. [DOI] [PubMed] [Google Scholar]
- Li Z, Hannigan M, Mo Z, et al. Directional sensing requires G beta gamma-mediated PAK1 and PIX alpha-dependent activation of Cdc42. Cell. 2003;114:215–227. doi: 10.1016/s0092-8674(03)00559-2. [DOI] [PubMed] [Google Scholar]
- Lovell PV, Clayton DF, Replogle KL, Mello CV. Birdsong “transcriptomics”: neurochemical specializations of the oscine song system. PLoS One. 2008;3:e3440. doi: 10.1371/journal.pone.0003440. [DOI] [PMC free article] [PubMed] [Google Scholar]
- Lovell PV, Mello CV. Forthcoming 2010. Brain expression and song regulation of the zebra finch (Taeniopygia guttata) cholecystokinin gene. J Comp Neurol. doi: 10.1002/cne.22513. [DOI] [PMC free article] [PubMed] [Google Scholar]
- Manser E, Chong C, Zhao ZS, Leung T, Michael G, Hall C, Lim L. Molecular cloning of a new member of the p21-Cdc42/Rac-activated kinase (PAK) family. J Biol Chem. 1995;270:25070–25078. doi: 10.1074/jbc.270.42.25070. [DOI] [PubMed] [Google Scholar]
- Meng J, Meng Y, Hanna A, Janus C, Jia Z. Abnormal long-lasting synaptic plasticity and cognition in mice lacking the mental retardation gene Pak3. J Neurosci. 2005;25:6641–6650. doi: 10.1523/JNEUROSCI.0028-05.2005. [DOI] [PMC free article] [PubMed] [Google Scholar]
- Mikkers H, Nawijn M, Allen J, Brouwers C, Verhoeven E, Jonkers J, Berns A. Mice deficient for all PIM kinases display reduced body size and impaired responses to hematopoietic growth factors. Mol Cell Biol. 2004;24:6104–6115. doi: 10.1128/MCB.24.13.6104-6115.2004. [DOI] [PMC free article] [PubMed] [Google Scholar]
- Molli PR, Li DQ, Murray BW, Rayala SK, Kumar R. PAK signaling in oncogenesis. Oncogene. 2009;28:2545–2555. doi: 10.1038/onc.2009.119. [DOI] [PMC free article] [PubMed] [Google Scholar]
- Nguyen DQ, Webber C, Hehir-Kwa J, Pfundt R, Veltman J, Ponting CP. Reduced purifying selection prevails over positive selection in human copy number variant evolution. Genome Res. 2008;18:1711–1723. doi: 10.1101/gr.077289.108. [DOI] [PMC free article] [PubMed] [Google Scholar]
- Nielsen R, Yang Z. Likelihood models for detecting positively selected amino acid sites and applications to the HIV-1 envelope gene. Genetics. 1998;148:929–936. doi: 10.1093/genetics/148.3.929. [DOI] [PMC free article] [PubMed] [Google Scholar]
- Page RD. TreeView: an application to display phylogenetic trees on personal computers. Comput Appl Biosci. 1996;12:357–358. doi: 10.1093/bioinformatics/12.4.357. [DOI] [PubMed] [Google Scholar]
- Pereira SL, Baker AJ. A mitogenomic timescale for birds detects variable phylogenetic rates of molecular evolution and refutes the standard molecular clock. Mol Biol Evol. 2006;23:1731–1740. doi: 10.1093/molbev/msl038. [DOI] [PubMed] [Google Scholar]
- Pettersen EF, Goddard TD, Huang CC, Couch GS, Greenblatt DM, Meng EC, Ferrin TE. UCSF Chimera—a visualization system for exploratory research and analysis. J Comput Chem. 2004;25:1605–1612. doi: 10.1002/jcc.20084. [DOI] [PubMed] [Google Scholar]
- Ponting CP. The functional repertoires of metazoan genomes. Nat Rev Genet. 2008;9:689–698. doi: 10.1038/nrg2413. [DOI] [PubMed] [Google Scholar]
- Qian KC, Wang L, Hickey ER, et al. Structural basis of constitutive activity and a unique nucleotide binding mode of human Pim-1 kinase. J Biol Chem. 2005;280:6130–6137. doi: 10.1074/jbc.M409123200. [DOI] [PubMed] [Google Scholar]
- Reisz RR, Muller J. Molecular timescales and the fossil record: a paleontological perspective. Trends Genet. 2004;20:237–241. doi: 10.1016/j.tig.2004.03.007. [DOI] [PubMed] [Google Scholar]
- Replogle K, Arnold AP, Ball GF, et al. The Songbird Neurogenomics (SoNG) Initiative: community-based tools and strategies for study of brain gene function and evolution. BMC Genomics. 2008;9:131. doi: 10.1186/1471-2164-9-131. [DOI] [PMC free article] [PubMed] [Google Scholar]
- Ronquist F, Huelsenbeck JP. MrBayes 3: Bayesian phylogenetic inference under mixed models. Bioinformatics. 2003;19:1572–1574. doi: 10.1093/bioinformatics/btg180. [DOI] [PubMed] [Google Scholar]
- Rousseau V, Goupille O, Morin N, Barnier JV. A new constitutively active brain PAK3 isoform displays modified specificities toward Rac and Cdc42 GTPases. J Biol Chem. 2003;278:3912–3920. doi: 10.1074/jbc.M207251200. [DOI] [PubMed] [Google Scholar]
- Selten G, Cuypers HT, Berns A. Proviral activation of the putative oncogene Pim-1 in MuLV induced T-cell lymphomas. EMBO J. 1985;4:1793–1798. doi: 10.1002/j.1460-2075.1985.tb03852.x. [DOI] [PMC free article] [PubMed] [Google Scholar]
- Seo TK, Kishino H, Thorne JL. Estimating absolute rates of synonymous and nonsynonymous nucleotide substitution in order to characterize natural selection and date species divergences. Mol Biol Evol. 2004;21:1201–1213. doi: 10.1093/molbev/msh088. [DOI] [PubMed] [Google Scholar]
- Slater GS, Birney E. Automated generation of heuristics for biological sequence comparison. BMC Bioinformatics. 2005;6:31. doi: 10.1186/1471-2105-6-31. [DOI] [PMC free article] [PubMed] [Google Scholar]
- Sottile V, Li M, Scotting PJ. Stem cell marker expression in the Bergmann glia population of the adult mouse brain. Brain Res. 2006;1099:8–17. doi: 10.1016/j.brainres.2006.04.127. [DOI] [PubMed] [Google Scholar]
- Souopgui J, Solter M, Pieler T. XPak3 promotes cell cycle withdrawal during primary neurogenesis in Xenopus laevis. EMBO J. 2002;21:6429–6439. doi: 10.1093/emboj/cdf644. [DOI] [PMC free article] [PubMed] [Google Scholar]
- Spiess AN, Walther N, Muller N, Balvers M, Hansis C, Ivell R. SPEER—a new family of testis-specific genes from the mouse. Biol Reprod. 2003;68:2044–2054. doi: 10.1095/biolreprod.102.011593. [DOI] [PubMed] [Google Scholar]
- Steiger SS, Kuryshev VY, Stensmyr MC, Kempenaers B, Mueller JC. A comparison of reptilian and avian olfactory receptor gene repertoires: species-specific expansion of group gamma genes in birds. BMC Genomics. 2009;10:446. doi: 10.1186/1471-2164-10-446. [DOI] [PMC free article] [PubMed] [Google Scholar]
- Suyama M, Torrents D, Bork P. PAL2NAL: robust conversion of protein sequence alignments into the corresponding codon alignments. Nucleic Acids Res. 2006;34:W609–W612. doi: 10.1093/nar/gkl315. [DOI] [PMC free article] [PubMed] [Google Scholar]
- Tu S, Shin Y, Zago WM, States BA, Eroshkin A, Lipton SA, Tong GG, Nakanishi N. Takusan: a large gene family that regulates synaptic activity. Neuron. 2007;55:69–85. doi: 10.1016/j.neuron.2007.06.021. [DOI] [PMC free article] [PubMed] [Google Scholar]
- van Lohuizen M, Verbeek S, Krimpenfort P, Domen J, Saris C, Radaszkiewicz T, Berns A. Predisposition to lymphomagenesis in pim-1 transgenic mice: cooperation with c-myc and N-myc in murine leukemia virus-induced tumors. Cell. 1989;56:673–682. doi: 10.1016/0092-8674(89)90589-8. [DOI] [PubMed] [Google Scholar]
- Vilella AJ, Severin J, Ureta-Vidal A, Heng L, Durbin R, Birney E. EnsemblCompara GeneTrees: complete, duplication-aware phylogenetic trees in vertebrates. Genome Res. 2009;19:327–335. doi: 10.1101/gr.073585.107. [DOI] [PMC free article] [PubMed] [Google Scholar]
- Wang J, Frost JA, Cobb MH, Ross EM. Reciprocal signaling between heterotrimeric G proteins and the p21-stimulated protein kinase. J Biol Chem. 1999;274:31641–31647. doi: 10.1074/jbc.274.44.31641. [DOI] [PubMed] [Google Scholar]
- Warren WC, Clayton DF, Ellegren H, et al. (81 co-authors) The genome of a songbird. Nature. 2010;464:757–762. doi: 10.1038/nature08819. [DOI] [PMC free article] [PubMed] [Google Scholar]
- Wilbrecht L, Kirn JR. Neuron addition and loss in the song system: regulation and function. Ann N Y Acad Sci. 2004;1016:659–683. doi: 10.1196/annals.1298.024. [DOI] [PubMed] [Google Scholar]
- Yang Z. PAML: a program package for phylogenetic analysis by maximum likelihood. Comput Appl Biosci. 1997;13:555–556. doi: 10.1093/bioinformatics/13.5.555. [DOI] [PubMed] [Google Scholar]
- Yang Z. Likelihood ratio tests for detecting positive selection and application to primate lysozyme evolution. Mol Biol Evol. 1998;15:568–573. doi: 10.1093/oxfordjournals.molbev.a025957. [DOI] [PubMed] [Google Scholar]
- Yang Z. PAML 4: phylogenetic analysis by maximum likelihood. Mol Biol Evol. 2007;24:1586–1591. doi: 10.1093/molbev/msm088. [DOI] [PubMed] [Google Scholar]
- Yang Z, Nielsen R. Synonymous and nonsynonymous rate variation in nuclear genes of mammals. J Mol Evol. 1998;46:409–418. doi: 10.1007/pl00006320. [DOI] [PubMed] [Google Scholar]
- Yang Z, Swanson WJ, Vacquier VD. Maximum-likelihood analysis of molecular adaptation in abalone sperm lysin reveals variable selective pressures among lineages and sites. Mol Biol Evol. 2000;17:1446–1455. doi: 10.1093/oxfordjournals.molbev.a026245. [DOI] [PubMed] [Google Scholar]
- Yang Z, Wong WS, Nielsen R. Bayes empirical bayes inference of amino acid sites under positive selection. Mol Biol Evol. 2005;22:1107–1118. doi: 10.1093/molbev/msi097. [DOI] [PubMed] [Google Scholar]
Associated Data
This section collects any data citations, data availability statements, or supplementary materials included in this article.