

Abstract
Peripheral and integral membrane proteins can be located in several different subcellular compartments, and it is often necessary to determine the location of such proteins or to track their movement in living cells. Image-based colocalization of labeled membrane proteins and compartment markers is frequently used for this purpose, but this method is limited in terms of throughput and resolution. Here we show that bioluminescence resonance energy transfer (BRET) between membrane proteins of interest and compartment-targeted BRET partners can report subcellular location and movement of membrane proteins in live cells. The sensitivity of the method is sufficent to localize a few hundred protein copies per cell. The spatial resolution can be sufficient to determine membrane topology, and the temporal resolution is sufficient to track changes that occur in less than one second. BRET requires little user intervention, and is thus amenable to large-scale experimental designs with standard instruments.
Keywords: bioluminescence, adrenergic, colocalization, topology, GTPase, trafficking
Many cellular functions require membrane proteins to be localized in specific subcellular compartments or to move between compartments. Therefore, it is frequently necessary to determine the subcellular location(s) of a membrane protein, or to follow the translocation or trafficking of a protein between organelles. Colocalization of fluorescently labeled membrane proteins and organelle markers is widely used for this purpose, and the use of genetically encoded fluorescent tags has greatly simplified localization and tracking of membrane proteins in living cells. However, conventional imaging methods require a skilled user for image acquisition and analysis, and spatial resolution is usually limited by diffraction. These limitations can be mitigated with automated microscopy (1) and superresolution imaging (2), but these capabilities are not yet widely available, and are more difficult to implement with living cells.
Resonance energy transfer (RET) occurs when energy donors and acceptors are in close proximity (within ~100 Å), and methods based on RET are often used to detect protein-protein interactions in cells. However, donors and acceptors can also be in close proximity by chance, particularly when both are attached to membrane proteins that are located in the same compartment. This results in a nonspecific background signal that can be difficult to distinguish from RET produced by specific interactions. With a few exceptions (3, 4), the potential of nonspecific RET to provide useful information has been largely overlooked.
Here we show how bioluminescence resonance energy transfer (BRET) can be used to report the subcellular location of membrane proteins in living cells. We demonstrate the use of BRET to indicate the steady-state distribution of membrane proteins in multiple subcellular compartments, as well as to track changes in subcellular location that occur across a range of time scales.
Results
BRET reports membrane protein localization, translocation and trafficking
BRET requires physical proximity, and thus can only occur between donor- and acceptor-labeled membrane proteins if both are located on the same membrane surface. Thus if BRET occurs between a protein of interest and a reference protein known to be located on a particular membrane compartment, then the protein of interest must also be localized to that compartment. In this way, if a membrane protein of interest is coexpressed with a range of targeted BRET partners the subcellular location(s) of the protein of interest can be inferred.
To implement this method we first constructed donor and acceptor proteins that were directed to the endoplasmic reticulum (ER), the Golgi apparatus, and the plasma membrane (PM) with small targeting peptides (Table S1). The donor Renilla luciferase (Rluc8) or the acceptor venus (V) were fused to fragments of PTP1b for the ER, giantin for the Golgi, RIT for the PM, or to nothing for the cytosol. Confocal imaging verified the correct localization of each acceptor (Figure 1A). We then coexpressed all sixteen possible donor-acceptor pairs, and measured BRET in cell populations using a multimode microplate reader. Robust BRET (venus emission) was observed only when both donor and acceptor were fused to the same type of peptide, suggesting that these peptides targeted donors and acceptors to discrete membrane compartments (Figure 1B). Notably, the cytosolic proteins failed to participate in BRET altogether, indicating that at these levels of expression BRET requires local concentration of donors and acceptors on a membrane. The net BRET values observed in these experiments depend on several factors, including the abundance of donor and acceptor proteins, their orientation, and possible inhomogeneous distribution within a membrane compartment. Therefore, BRET indicates membrane colocalization in a qualitative manner, and absolute net BRET values from different compartments or proteins of interest are not directly comparable.
Figure 1. BRET reports the subcellular distribution and translocation of membrane proteins.

A) Confocal images of cells expressing V-PTP1b at the endoplasmic reticulum (ER), V-giantin at the Golgi apparatus, and V-RIT at the plasma membrane (PM; yellow). The plasma membrane is stained with FM1-43 (red). Scale bars, 10 μm. B) Net BRET ratios from cells expressing combinations of donor and acceptor proteins localized to the ER (PTP1b), Golgi apparatus (giantin) and PM (RIT), or localized in the cytosol (C1). Values represent means of 4–6 experiments; the s.e.m. was <0.01 when donor and acceptor were located in different compartments, and <0.04 when donor and acceptor were located in the same compartment. C) BRET ratios from cells expressing Rluc8-PTP1b, Rluc8-giantin, or Rluc8-RIT, together with either V-H-Ras or V-K-Ras. Cells were treated for 5 hours with either DMSO (control) or 2-bromopalmitate (30 μM) to block palmitoylation. Data represent mean ± s.d. (n = 4); *, P<0.01, unpaired t-test. D) BRET ratios from cells expressing VSVG-Rluc8 and V-PTP1b, V-giantin, or V-RIT. Cells were incubated overnight at 40°C, then switched to 32°C for the indicated time. Data represent mean ± s.d. (n = 3). E) BRET ratios from cells expressing FRB-Rluc8-K-Ras, an ER-localized FKBP moiety, and either V-PTP1b (ER) or V-H-Ras (PM). Rapamycin (1 μM) was added where indicated. Data are the average of 12 individual experiments. Smooth curves are least squares fits to a two component exponential function; fast and slow time constants were 3.9 and 22.7 seconds for the PM, and 4.5 and 33.1 seconds for the ER.
We next used these tools to study the localization and trafficking of well-described model proteins. The small GTPases H-Ras and K-Ras both possess prenyl groups that allow them to associate with membranes, as well as second signals that direct them primarily to the PM. H-Ras is palmitoylated, and must be periodically repalmitoylated at the Golgi apparatus to maintain a preference for the PM (5). K-Ras is not palmitoylated (it has instead a cluster of basic amino acids), and therefore does not transit the Golgi. To determine if BRET could detect this difference we fused venus to 25 amino acid C-terminal fragments of H-Ras and K-Ras, and coexpressed these proteins with targeted donors that “illuminated” the ER, Golgi or PM. V-H-Ras was an efficient BRET acceptor at the PM, but also produced a substantial signal at the Golgi, consistent with the steady-state presence of H-Ras in this compartment. In contrast, V-K-Ras was a good BRET acceptor only at the PM (Figure 1C). Preventing palmitoylation with 2-bromopalmitate (2-BP) interrupts the acylation cycle, and randomizes the endomembrane distribution of H-Ras (6). Accordingly, BRET indicated that 2-BP redistributed V-H-Ras from the PM to the ER and Golgi (Figure 1C). As expected, blocking palmitoylation had no effect on the subcellular distribution of V-K-Ras (Figure 1C). These results agree with previous imaging studies of Ras protein localization (5–8).
To demonstrate the ability of BRET to track transmembrane proteins through the biosynthetic secretory pathway we fused the temperature-sensitive vesicular stomatitis virus G protein tsO45 mutant to Rluc8 (VSVG-Rluc8). This mutant misfolds at 40°C and is retained in the ER membrane (9, 10), therefore BRET was most pronounced between VSVG-Rluc8 and the ER-localized acceptor in cells incubated at this temperature (Figure 1D). After shifting to a temperature permissive for correct folding (32°C) BRET between VSVG-Rluc8 and the ER acceptor decreased over time, whereas BRET between VSVG-Rluc8 and the Golgi and PM acceptors increased (Figure 1D), consistent with forward trafficking of this chimera through the secretory pathway (9, 10).
It was also possible to follow more rapid changes in membrane localization, such as those resulting from chemical-induced dimerization. For example, the C terminus of K-Ras fused to the FKBP-rapamycin binding domain and Rluc8 (FRB-Rluc8-K-Ras) was recruited from the PM to the ER by adding rapamycin in the presence of an ER-localized FKBP moiety (11). BRET between FRB-Rluc8-K-Ras and PM or ER acceptors was measured every 0.6 seconds, and indicated rapid translocation between these compartments (Figure 1E). The dominant component of the PM BRET decrease occurred with a time constant of 3.9 seconds, consistent with rapidly-reversible association of K-Ras with the PM (12, 13).
BRET sensitivity
One drawback of live-cell imaging of fluorescently-labeled proteins is that such proteins must often be overexpressed in order for fluorescent signals to be detectable above background autofluorescence. Because BRET is based on luminescence background signals are extremely low, and BRET is detectable with low levels of donor expression. Using purified Rluc8 we determined the sensitivity of our microplate reader under conditions similar to those used for BRET experiments (Figure S1A). We then used the resulting calibration curve to estimate the number of Rluc8 molecules expressed in cells. For example, cells expressing the pleckstrin homology domain of phospholipase C δ1 fused to Rluc8 (Rluc8-PH) generated photon counts consistent with the presence of 5.5 × 10⁻¹⁷ moles of Rluc8-PH per well, or approximately 200 Rluc8-PH molecules per cell. At this level of expression BRET between Rluc8-PH and V-H-Ras was readily detected (Figure S1B), consistent with colocalization of these proteins at the plasma membrane (14).
Although nonspecific BRET can be generated by a small number of membrane-associated donors, acceptors must be present at sufficient density to provide “coverage” of a significant fraction of the membrane surface. To estimate the density of acceptors necessary to produce detectable nonspecific BRET we constructed a cell line that expressed β2 adrenergic receptors fused to venus (β2AR-V) in a tetracycline-inducible manner. Addition of increasing concentrations of tetracycline induced expression of β2AR-V ranging from 3 × 10⁴ to 1.6 × 10⁶ receptor-acceptors per cell, or approximately 45–2,400 per μm2 of plasma membrane, as indicated by whole cell radioligand binding. Nonspecific BRET produced in these cells by transiently-expressed Rluc8-K-Ras was detectable and increased monotonically throughout this range (Figure S1C), as predicted by previous studies (15, 16). These acceptor densities are considerably higher than the densities of many endogenous membrane proteins. Since subcellular localization can be altered by overexpression, it may be generally preferable to express proteins of interest as BRET donors.
BRET reports membrane protein topology
Efficient energy transfer occurs between molecules that are within ~100 Å of each other, thus under ideal conditions BRET should be able to resolve molecules that are separated by this distance. This resolution greatly exceeds that of conventional diffraction-limited microscopy. For example, the locations of venus fused to a targeting peptide from monoamine oxidase (V-MoA) on the outer surface of the mitochondrial outer membrane (MOM) and venus fused to the transporter ABCb10 (ABC-V) on the inner surface of the mitochondrial inner membrane (MIM) (17) could not be distinguished using conventional confocal microscopy (Figure 2A). However, efficient BRET occurred from Rluc8-MoA to V-MoA and from ABC-Rluc8 to ABC-V, but not from Rluc8-MoA to ABC-V, or from ABC-Rluc8 to V-MoA (Figure 2B). This suggests that BRET can resolve outer and inner mitochondrial membrane proteins.
Figure 2. The spatial resolution of BRET is sufficient to indicate membrane topology.
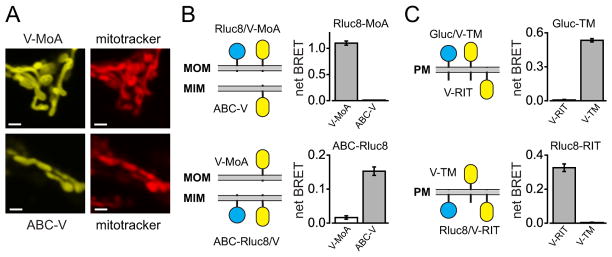
A) Confocal images of mitochondria in cells expressing V-MoA or ABC-V, and stained with mitotracker deep red 633. Scale bars, 0.7 μm. B) BRET ratios in cells expressing either Rluc8-MoA or ABC-Rluc8 together with either V-MoA or ABC-V. BRET was observed only when both donor and acceptor were located on the same membrane, either the mitochondrial outer membrane (MOM) or mitochondrial inner membrane (MIM). C) BRET ratios in cells expressing either Gluc-TM or Rluc8-RIT together with either V-TM or V-RIT. BRET was observed only when both donor and acceptor were located on the same side of the plasma membrane (PM). Data in B and C represent mean ± s.d. (n = 4).
Because a lipid bilayer is ~30 Å thick and a fluorescent protein fluorophore is contained within a rigid structure of similar dimensions, we asked if a single membrane would separate Rluc8 and venus enough to prevent efficient BRET. Indeed, intracellular Rluc8-RIT was unable to transfer energy to venus on the extracellular surface of the PM (V-TM; Figure 2C). In contrast, efficient BRET was observed between a surface-displayed BRET donor, Gluc-TM (from Gaussia princeps) and V-TM, but not between Gluc-TM and V-RIT (Figure 2C). We obtained similar results with BRET donors and acceptors located on the cytosolic or luminal surfaces of the ER membrane (Figure S2A). Trypsin decreased BRET between Gluc-TM and V-TM by >90% in intact cells, consistent with their location on the extracellular cell surface. This effect was not enhanced when cells were permeabilized with digitonin. In contrast, BRET between Rluc8-RIT and V-RIT was resistant to trypsin in intact cells, but became sensitive to trypsin after permeabilization (Figure S2B). Thus BRET can be used by itself or in conjunction with other methods (18) to determine membrane protein topology.
BRET can be scaled
Live-cell spectroscopy requires little user intervention for data acquisition, and thus is practical for large-scale experimental designs. To assess this capability we studied the trafficking of β2 adrenergic receptors (β2AR) and mutant receptors (β2AR W158A) during biosynthesis. Tryptophan 158 participates in interactions that stabilize β2AR (19), and mutation of this residue leads to retention of misfolded adrenergic receptors in the ER (Figure 3A and Figure S3) (20). We measured BRET between β2AR-Rluc8 or β2AR W158A-Rluc8 and acceptors located in six different subcellular compartments. The distribution of BRET signals was consistent with retention of β2AR W158A-Rluc8 in the ER (Figure 3A). Incubation of cells with the membrane-permeant antagonist alprenolol partially rescued trafficking of β2AR W158A-Rluc8 to the Golgi, the PM and endosomes (Figure 3A) (20). To determine the properties of adrenergic ligands necessary for this pharmacological chaperoning of β2AR W158A-Rluc8, we repeated this experiment with a panel of 83 adrenergic ligands and metabolites. The results indicated that almost all of the βAR-selective ligands were able to promote forward trafficking of β2AR W158A-Rluc8, irrespective of pharmacological classification as agonist or antagonist (Figure 3B). Several ligands failed to chaperone β2AR W158A-Rluc8 (e.g. epinephrine), most likely due to their inability to access the receptor binding site in the ER lumen. None of the highly hydrophilic (XLogP3 < 0) (21) β adrenergic ligands were effective chaperones for β2AR W158A-Rluc8 (Table S2). These results demonstrate the utility of BRET for low- to medium-throughput applications.
Figure 3. BRET is amenable to large-scale experments.

A) BRET signals observed between β2AR-Rluc8 or β2AR W158A-Rluc8 and acceptor proteins localized in the ER, Golgi (GA), PM, early endosomes (EE), late endosomes (LE) and recycling endosomes (RE), with or without overnight treatment with 10 μM alprenolol. Data represent mean ± s.d. (n = 4–11); *, P<0.01, unpaired t-test. Insets show confocal images of cells expressing β2AR-V or β2AR W158A-V; scale bars, 10 μm. B) The ratio of BRET observed with a PM acceptor to that observed with an ER acceptor in cells expressing β2AR W158A-Rluc8. Cells were incubated overnight with vehicle (DMSO) or a library of 83 adrenergic ligands and metabolites (at 10 μM). Data represent mean ± s.d. (n = 4).
Discussion
BRET provides a unique set of capabilities for studies of membrane protein localization and translocation in living cells. These capabilities overlap and complement those of other methods used to perform these tasks, such as conventional diffraction-limited and superresolution fluorescence microscopy. Like colocalization of proteins by fluorescence microscopy, BRET relies on reference proteins with well-known localizations. However, unlike microscopy BRET does not require extensive user intervention for data acquisition or analysis. This facilitates comparison of multiple experimental conditions in parallel, and eliminates the need for a user to select individual cells and regions of interest for analysis. The BRET ratio is a numeric index of location that is averaged across a population of cells. This averaging is an asset with respect to sensitivity, but will obscure changes that occur in minority subpopulations of cells.
Several factors can influence BRET due to colocalization, including the stoichiometry, absolute density, and orientation of donors and acceptors. This being the case, nonspecific BRET can change due to changes in overall donor or acceptor expression, donor or acceptor conformation, or membrane compartment surface area. Among these factors, only donor and acceptor expression levels can be easily measured. Therefore, BRET ratios can not be used to quantitatively compare membrane protein abundance in different compartments, or to compare the relative abundance of different proteins in a single compartment. On the other hand, changes in the density of a given membrane protein in a single compartment (e.g. due to trafficking events) can be inferred, provided that changes in these other factors can be ruled out. Even in this case, however, the change in BRET signal may not be directly proportional to the change in membrane protein abundance. This will only be the case if both donor and acceptor proteins are colocalized in a just one compartment, and donors are sufficiently sparse that they do not “compete” for acceptors. It is also necessary that donor and acceptor proteins do not form any specific complex, i.e. that BRET occurs due to random colocalization only.
Because BRET requires no external illumination the absolute sensitivity of the method can be very high. A few previous studies have used nonspecific fluorescence resonance energy transfer (FRET) to localize membrane proteins (3, 4), but this approach has not been widely adopted. We found that BRET was readily detected by an off-the-shelf microplate reader when each cell expressed a few hundred donor molecules. Sensitivity could be improved by increasing the number of cells per assay or by optimizing acceptor density, but this sensitivity already exceeds that of most live-cell imaging methods. The ability to determine membrane location with low levels of protein expression is important, because overexpression may lead to aberrant localization. In the case of translocating sensor proteins that bind to membrane-localized substrates (e.g. phosphoinositides), overexpressed sensors can sequester the molecules being studied, and thus distort changes produced by endogenous processes (22). The combination of sensitivity and throughput should make BRET particularly valuable for studies involving molecules that translocate to or from membranes.
Although donor proteins can be present at very low expression levels, nonspecific BRET requires a sufficient acceptor density to ensure that a significant fraction of donors will be close to an acceptor at random. Our results suggest that nonspecific BRET is detectable with ~500–1000 venus molecules per μm2. Given an estimated Förster distance (R0) of 5 nm for the Rluc8-venus pair, this range corresponds to ~4–8% of the surface area being within R0 of an acceptor. Cells apparently tolerate these (and even higher) densities of exogenous membrane proteins without overt toxicity. This is not entirely unexpected, since protein densities of ~25,000 per μm2 are not uncommon for biological membranes (23). Nevertheless, the possibility that overexpression of acceptor proteins might change the localization or trafficking of either donors or acceptors should not be ignored. Since the required acceptor density is much higher than the native densities of many membrane proteins, the most conservative approach is to label proteins of interest with the donor, and to label compartments of interest with the acceptor (which can be fused to small targeting peptides).
Under ideal conditions the spatial resolution of BRET is sufficient to determine membrane topology. However, in practicality the spatial resolution of BRET will be limited by the availability of donor or acceptor reference proteins that are located in compartments or domains of interest and nowhere else. Therefore, the method we describe will be most useful for discriminating noncontiguous membrane compartments and large domains within compartments. Discrimination of nanoscale domains within contiguous membrane compartments is theoretically possible, but such experiments will be more difficult to implement and interpret.
The temporal resolution of BRET is limited by the number of photons generated by the sample and the efficiency of the detector, as is the case with image-based methods. We have found that subsecond resolution is possible without optimization, and have previously recorded dynamic BRET signals with a 60 ms sampling interval (24).
In this study we applied BRET to cultured mammalian cells, but the method should be applicable to a wide variety of biological specimens. Because BRET does not require imaging, this method of localization is feasible in non-adherent cells, as well as in cells in tissues, embryos and whole organisms (25). We have demonstrated that BRET is readily scaled using equipment that is available to most laboratories, and throughput could be increased further with automation and higher density microplate formats. BRET could thus be useful for functional genomic screens much in the same way that high-throughput microscopy (high-content screening) is used for the same purpose. The information content of each BRET assay could be increased by multiplexing spectrally-distinct donors and acceptors, e.g. by monitoring membrane protein abundance in several compartments simultaneously (26).
In summary, BRET provides useful information regarding the subcellular location, translocation and trafficking of membrane proteins in live cells. The method is sensitive, is easily implemented with a standard platereader, requires little user intervention, and is amenable to large-scale experimental designs and a variety of specimens. This combination of features makes BRET a useful and versatile addition to image-based and biochemical methods to study membrane protein localization.
Materials and Methods
Plasmid DNA constructs
A plasmid encoding Rluc8 was provided by Dr. Sanjiv Sam Gambhir, and a plasmid containing the PH domain of PLC δ1 was provided by Dr. Tobias Meyer (both at Stanford University, Palo Alto, CA). A plasmid encoding venus-K-Ras was provided by Dr. Stephen R. Ikeda (NIAAA, Rockville, MD). Plasmids encoding giantin, MoA and an ER-targeted FKBP (CFP-FKBP-Cb5) were provided by Dr. Takanari Inoue (Johns Hopkins University, Baltimore, MD). Plasmids encoding RIT and H-Ras were provided by Dr. Mark R. Philips (New York University, New York, NY). Plasmids encoding CD3δ were provided by Dr. Jennifer Lippincott-Schwartz (NICHD, Bethesda, MD). All other constructs were made using an adaptation of the QuikChange (Stratagene) mutagenesis protocol and were verified by automated sequencing.
Cell culture and transfection
HEK 293 cells (ATCC) were propagated in plastic flasks and on polylysine-coated glass coverslips according to the supplier’s protocol. For the experiment shown in Figure 3B cells were grown directly on a white opaque 96-well plate. Cells were transfected in growth medium using linear polyethyleneimine (MW 25,000; Polysciences Inc., Warrington, PA) at an N/P ratio of 20, and were used for experiments 12–48 hours later.
BRET
Cells were washed with PBS, harvested by trituration, and transferred to opaque 96-well plates. For protease protection experiments cells were suspended in KMH buffer and exposed to trypsin with or without high-purity digitonin (200 μM) as previously described (18). Coelenterazine h (5 μM) was added to all wells immediately prior to making measurements. Luminescence measurements were made using a Mithras LB940 photon-counting plate reader (Berthold Technologies GmbH, Bad Wildbad, Germany). Raw BRET signals were calculated as the emission intensity at 520–545 nm divided by the emission intensity at 475–495 nm. Net BRET was this ratio minus the same ratio measured from cells expressing only the BRET donor (Rluc8 or Gluc).
Donor sensitivity calibration
Purified Rluc8 was provided by Dr. Sapna K. Deo (University of Miami, Miami, FL), and was serially diluted in PBS. For calibration (Figure S1A) each well contained, in addition to purified Rluc8, untransfected cells and digitonin (200 μM) to control for light scattering and possible changes in Rluc8 activity due to cellular elements. Cells expressing Rluc8 molecules were assayed under identical conditions. The number of Rluc8 molecules per cell was calculated by converting the photon count per well to Rluc8 molecule number using the fitted calibration curve and Avogadro’s number, and dividing by the number of cells in each well (~1–2 × 10⁵).
Radioligand binding
HEK 293 cells stably expressing β2AR-V under control of a tetracycline-inducible promoter (Flp-In T-Rex, Invitrogen, Carlsbad, CA) were seeded onto 24-well plates at 2 × 10⁵ cells per well. Expression of β2AR-V was induced by incubating with tetracycline (0–0.1 μg ml−1) for 24 hours. After induction cells were incubated in MEM containing 30 nM [3H]-CGP12177 for 90 minutes at room temperature. Cells were washed twice with ice cold MEM, and surface-bound ligand was extracted with 0.5 ml of 1 M NaOH for 2 hours. Radioactivity was counted by liquid scintillation counting in 3.5 ml of Ecoscint A (National Diagnostics, Inc., Atlanta, GA). Nonspecific binding was determined in the presence of 20 μM alprenolol.
Confocal imaging
Confocal images were acquired using a Leica (Wetzlar, Germany) SP2 scanning confocal microscope and a 63X, 1.4 NA objective. Cerulean and venus were excited with the 458 nm and 514 nm lines of an ArKr laser, and detected at 465–490 nm and 520–550 nm, respectively. FM1-43 (3 μM; Figure 1A) was excited at 458 nm and detected at >550 nm.
Supplementary Material
Acknowledgments
We thank Sapna Deo (University of Miami, Miami, FL) for providing purified Rluc8, and the many individuals who provided plasmid DNA constructs. This work was supported by NIH grants GM096762, GM078319 (N.A.L.), and GM076167 (G.W.).
Footnotes
References
- 1.Rimon N, Schuldiner M. Getting the whole picture: combining throughput with content in microscopy. J Cell Sci. 2011;124(Pt 22):3743–3751. doi: 10.1242/jcs.087486. [DOI] [PubMed] [Google Scholar]
- 2.Lippincott-Schwartz J, Manley S. Putting super-resolution fluorescence microscopy to work. Nat Methods. 2009;6(1):21–23. doi: 10.1038/nmeth.f.233. [DOI] [PMC free article] [PubMed] [Google Scholar]
- 3.Chiu VK, Bivona T, Hach A, Sajous JB, Silletti J, Wiener H, Johnson RL, 2nd, Cox AD, Philips MR. Ras signalling on the endoplasmic reticulum and the Golgi. Nat Cell Biol. 2002;4(5):343–350. doi: 10.1038/ncb783. [DOI] [PubMed] [Google Scholar]
- 4.Violin JD, Ren XR, Lefkowitz RJ. G-protein-coupled receptor kinase specificity for beta-arrestin recruitment to the beta2-adrenergic receptor revealed by fluorescence resonance energy transfer. J Biol Chem. 2006;281(29):20577–20588. doi: 10.1074/jbc.M513605200. [DOI] [PubMed] [Google Scholar]
- 5.Rocks O, Peyker A, Kahms M, Verveer PJ, Koerner C, Lumbierres M, Kuhlmann J, Waldmann H, Wittinghofer A, Bastiaens PI. An acylation cycle regulates localization and activity of palmitoylated Ras isoforms. Science. 2005;307(5716):1746–1752. doi: 10.1126/science.1105654. [DOI] [PubMed] [Google Scholar]
- 6.Goodwin JS, Drake KR, Rogers C, Wright L, Lippincott-Schwartz J, Philips MR, Kenworthy AK. Depalmitoylated Ras traffics to and from the Golgi complex via a nonvesicular pathway. J Cell Biol. 2005;170(2):261–272. doi: 10.1083/jcb.200502063. [DOI] [PMC free article] [PubMed] [Google Scholar]
- 7.Rocks O, Gerauer M, Vartak N, Koch S, Huang ZP, Pechlivanis M, Kuhlmann J, Brunsveld L, Chandra A, Ellinger B, Waldmann H, Bastiaens PI. The palmitoylation machinery is a spatially organizing system for peripheral membrane proteins. Cell. 2010;141(3):458–471. doi: 10.1016/j.cell.2010.04.007. [DOI] [PubMed] [Google Scholar]
- 8.Rocks O, Peyker A, Bastiaens PI. Spatio-temporal segregation of Ras signals: one ship, three anchors, many harbors. Curr Opin Cell Biol. 2006;18(4):351–357. doi: 10.1016/j.ceb.2006.06.007. [DOI] [PubMed] [Google Scholar]
- 9.Bergmann JE. Using temperature-sensitive mutants of VSV to study membrane protein biogenesis. Methods Cell Biol. 1989;32:85–110. doi: 10.1016/s0091-679x(08)61168-1. [DOI] [PubMed] [Google Scholar]
- 10.Presley JF, Cole NB, Schroer TA, Hirschberg K, Zaal KJ, Lippincott-Schwartz J. ER-to-Golgi transport visualized in living cells. Nature. 1997;389(6646):81–85. doi: 10.1038/38001. [DOI] [PubMed] [Google Scholar]
- 11.Komatsu T, Kukelyansky I, McCaffery JM, Ueno T, Varela LC, Inoue T. Organelle-specific, rapid induction of molecular activities and membrane tethering. Nat Methods. 2010;7(3):206–208. doi: 10.1038/nmeth.1428. [DOI] [PMC free article] [PubMed] [Google Scholar]
- 12.Leventis R, Silvius JR. Lipid-binding characteristics of the polybasic carboxy-terminal sequence of K-ras4B. Biochemistry. 1998;37(20):7640–7648. doi: 10.1021/bi973077h. [DOI] [PubMed] [Google Scholar]
- 13.Yokoe H, Meyer T. Spatial dynamics of GFP-tagged proteins investigated by local fluorescence enhancement. Nat Biotechnol. 1996;14(10):1252–1256. doi: 10.1038/nbt1096-1252. [DOI] [PubMed] [Google Scholar]
- 14.Stauffer TP, Ahn S, Meyer T. Receptor-induced transient reduction in plasma membrane PtdIns(4,5)P2 concentration monitored in living cells. Curr Biol. 1998;8(6):343–346. doi: 10.1016/s0960-9822(98)70135-6. [DOI] [PubMed] [Google Scholar]
- 15.Fung BK, Stryer L. Surface density determination in membranes by fluorescence energy transfer. Biochemistry. 1978;17(24):5241–5248. doi: 10.1021/bi00617a025. [DOI] [PubMed] [Google Scholar]
- 16.Wolber PK, Hudson BS. An analytic solution to the Forster energy transfer problem in two dimensions. Biophys J. 1979;28(2):197–210. doi: 10.1016/S0006-3495(79)85171-1. [DOI] [PMC free article] [PubMed] [Google Scholar]
- 17.Shirihai OS, Gregory T, Yu C, Orkin SH, Weiss MJ. ABC-me: a novel mitochondrial transporter induced by GATA-1 during erythroid differentiation. EMBO J. 2000;19(11):2492–2502. doi: 10.1093/emboj/19.11.2492. [DOI] [PMC free article] [PubMed] [Google Scholar]
- 18.Lorenz H, Hailey DW, Lippincott-Schwartz J. Fluorescence protease protection of GFP chimeras to reveal protein topology and subcellular localization. Nat Methods. 2006;3(3):205–210. doi: 10.1038/nmeth857. [DOI] [PubMed] [Google Scholar]
- 19.Hanson MA, Cherezov V, Griffith MT, Roth CB, Jaakola VP, Chien EY, Velasquez J, Kuhn P, Stevens RC. A specific cholesterol binding site is established by the 2. 8 A structure of the human beta2-adrenergic receptor. Structure. 2008;16(6):897–905. doi: 10.1016/j.str.2008.05.001. [DOI] [PMC free article] [PubMed] [Google Scholar]
- 20.Kobayashi H, Ogawa K, Yao R, Lichtarge O, Bouvier M. Functional rescue of beta-adrenoceptor dimerization and trafficking by pharmacological chaperones. Traffic. 2009;10(8):1019–1033. doi: 10.1111/j.1600-0854.2009.00932.x. [DOI] [PMC free article] [PubMed] [Google Scholar]
- 21.Cheng T, Zhao Y, Li X, Lin F, Xu Y, Zhang X, Li Y, Wang R, Lai L. Computation of octanol-water partition coefficients by guiding an additive model with knowledge. J Chem Inf Model. 2007;47(6):2140–2148. doi: 10.1021/ci700257y. [DOI] [PubMed] [Google Scholar]
- 22.Teruel MN, Meyer T. Translocation and reversible localization of signaling proteins: a dynamic future for signal transduction. Cell. 2000;103(2):181–184. doi: 10.1016/s0092-8674(00)00109-4. [DOI] [PubMed] [Google Scholar]
- 23.Engelman DM. Membranes are more mosaic than fluid. Nature. 2005;438(7068):578–580. doi: 10.1038/nature04394. [DOI] [PubMed] [Google Scholar]
- 24.Qin K, Dong C, Wu G, Lambert NA. Inactive-state preassembly of G(q)-coupled receptors and G(q) heterotrimers. Nat Chem Biol. 2011;7(10):740–747. doi: 10.1038/nchembio.642. [DOI] [PMC free article] [PubMed] [Google Scholar]
- 25.Dragulescu-Andrasi A, Chan CT, De A, Massoud TF, Gambhir SS. Bioluminescence resonance energy transfer (BRET) imaging of protein-protein interactions within deep tissues of living subjects. Proc Natl Acad Sci U S A. 2011;108(29):12060–12065. doi: 10.1073/pnas.1100923108. [DOI] [PMC free article] [PubMed] [Google Scholar]
- 26.Breton B, Sauvageau E, Zhou J, Bonin H, Le Gouill C, Bouvier M. Multiplexing of multicolor bioluminescence resonance energy transfer. Biophys J. 2010;99(12):4037–4046. doi: 10.1016/j.bpj.2010.10.025. [DOI] [PMC free article] [PubMed] [Google Scholar]
Associated Data
This section collects any data citations, data availability statements, or supplementary materials included in this article.