
Figure 2. The spatial resolution of BRET is sufficient to indicate membrane topology.
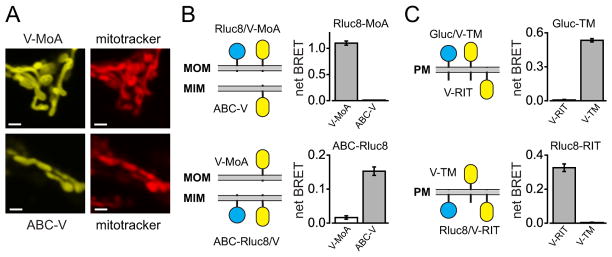
A) Confocal images of mitochondria in cells expressing V-MoA or ABC-V, and stained with mitotracker deep red 633. Scale bars, 0.7 μm. B) BRET ratios in cells expressing either Rluc8-MoA or ABC-Rluc8 together with either V-MoA or ABC-V. BRET was observed only when both donor and acceptor were located on the same membrane, either the mitochondrial outer membrane (MOM) or mitochondrial inner membrane (MIM). C) BRET ratios in cells expressing either Gluc-TM or Rluc8-RIT together with either V-TM or V-RIT. BRET was observed only when both donor and acceptor were located on the same side of the plasma membrane (PM). Data in B and C represent mean ± s.d. (n = 4).