

Abstract
The chronic and systemic administration of rapamycin extends life span in mammals. Rapamycin is a pharmacological inhibitor of mTOR. Metformin also inhibits mTOR signaling but by activating the upstream kinase AMPK. Here we report the effects of chronic and systemic administration of the two mTOR inhibitors, rapamycin and metformin, on adult neural stem cells of the subventricular region and the dendate gyrus of the mouse hippocampus. While rapamycin decreased the number of neural progenitors, metformin-mediated inhibition of mTOR had no such effect. Adult-born neurons are considered important for cognitive and behavioral health, and may contribute to improved health span. Our results demonstrate that distinct approaches of inhibiting mTOR signaling can have significantly different effects on organ function. These results underscore the importance of screening individual mTOR inhibitors on different organs and physiological processes for potential adverse effects that may compromise health span.
Electronic supplementary material
The online version of this article (doi:10.1007/s11357-013-9572-5) contains supplementary material, which is available to authorized users.
Keywords: Rapamycin, mTOR, Metformin, Neuronal progenitors
Introduction
The mTOR signaling pathway has a conserved role in the regulation of replicative and chronological life span in yeast and organismal life span in Caenorhabditis elegans, Drosophila, and mammals (Johnson et al. 2013). The inhibition of mTOR signaling with chronic, systemic 2.24-mg/kg (14 ppm) administration of rapamycin, a product of the soil bacteria Streptomyces hygroscopicus, extends life span in mice, even when introduced late in life (Harrison et al. 2009). Rapamycin 4.7, 14, and 42 ppm in food also slows age-dependent pathology of the liver, heart, and tendons (Wilkinson et al. 2012). A recent study demonstrated that chronic 2.24-mg/kg rapamycin inhibits age-associated cognitive decline (Halloran et al. 2012). Furthermore, rapamycin treatment was associated with anxiolytic and anti-depressive effects (Halloran et al. 2012).
While neurogenesis occurs primarily during embryonic and early postnatal mammalian development, the adult mammalian brain does retain the ability to produce new neurons. Cognitive functions, learning and memory, and behavioral health can be improved by increased adult neurogenesis (van Praag et al. 2000, 2005; Ramirez-Amaya et al. 2006; Deng et al. 2010). Additionally, antidepressants function by stimulating adult neurogenesis (Malberg et al. 2000; Santarelli et al. 2003; Encinas et al. 2006; Li et al. 2008; Wang et al. 2008). Neurogenesis in an adult mammal occurs in specialized regions of the brain such as the subventricular zone (SVZ) and the subgranular zone of the dentate gyrus (DG) (Kriegstein and Alvarez-Buylla 2009). In these regions, slowly cycling B cells (GFAP+), the self-renewing adult neural stem cell population, give rise to transient amplifying C cells (EGFR+), which in turn produce neuroblasts marked by the expression of doublecortin (DCX+). Adult-born neurons integrate into functional circuits (Li et al. 2009; Song et al. 2012). Adult neurogenesis decreases with aging and the loss of neurogenesis can be correlated with cognitive and behavioral decline (Kuhn et al. 1996; Lazarov et al. 2010; Snyder et al. 2011). Conversely, caloric restriction, which extends life span, increases adult neurogenesis (Levenson and Rich 2007; Lazarov et al. 2010).
From Drosophila to mice, multiple steps during neurogenesis—neural progenitor proliferation, survival, and differentiation into neurons—have been reported to engage the mTOR signaling pathway (Han et al. 2008; McNeill et al. 2008; Kim et al. 2009; Fishwick et al. 2010; Li et al. 2010; Raman et al. 2011; Palazuelos et al. 2012; Paliouras et al. 2012). For example, the loss of activators of mTOR signaling, IgfR1, in neural precursors, results in reduced proliferation in the SVZ and microcephaly (Kappeler et al. 2008; Liu et al. 2009; Lehtinen et al. 2011). Conversely, increased Igf activity resulted in increased proliferation in the SVZ and macrocephaly (Ye et al. 2004; Lehtinen et al. 2011). Two independent mTOR complexes—mTORC1 and mTORC2—are found in mammalian cells (Laplante and Sabatini 2012). Rapamycin is a well-characterized mTORC1 inhibitor (Guertin and Sabatini 2009). This macrolide first binds to the cyclophilin FKBP12 in mammalian cells, and the complex subsequently interacts with mTOR and inhibits its function. Paliouras et al. demonstrated that rapamycin infusion (0.5 mM) into the left ventricle of mice for 7 days results in a 48 % reduction of proliferating neural stem cell numbers (Paliouras et al. 2012). Furthermore, rapamycin reduces neural stem cell proliferation in vitro; both the size and number of neural stem cells grown as neurospheres were reduced following rapamycin treatment (Paliouras et al. 2012). Additionally, neural stem cells fail to differentiate normally in the presence of this drug (Paliouras et al. 2012). Four weeks of rapamycin treatment (10 mg/kg) significantly decreased social interaction time in mice (Zhou et al. 2009). In contrast, 1 and 4 weeks of rapamycin treatment (20 and 10 mg/kg, respectively) have been reported not to affect gross morphology of the important neurogenic niche, DG, or normal, newborn neurons and the performance of mice in open-field behavioral tests (Kim et al. 2009; Zhou et al. 2009).
Metformin represents an additional pharmacological approach to inhibit mTORC1 signaling (Mihaylova and Shaw 2011). This anti-diabetic biguanide acts by increasing AMP-activated protein kinase (AMPK) activity (Shaw et al. 2005). When activated, AMPK negatively regulates mTOR activation (Mihaylova and Shaw 2011). AMPK activation slows aging in C. elegans (Apfeld et al. 2004; Mair et al. 2011) and is being considered as a calorie restriction mimetic (Ingram et al. 2006). Therefore, metformin has been used for life extension in mammals and, in some studies although not all, has demonstrated gerosuppressive effects (Smith et al. 2010; Anisimov et al. 2011; Berstein 2012). Interestingly, 12 days of treatment with metformin has been shown to increase adult neurogenesis and spatial memory (Wang et al. 2012). However, the effect of longer term treatment remains unknown.
We directly investigated the effects of a chronic, systemic rapamycin or metformin treatment on proliferating neural progenitor cells of the SVZ and DG in mice. Here we report that a 9-week chronic administration of rapamycin, but not metformin, reduces the number of proliferating neural progenitors in the mammalian neurogenic niches in adult mice. Additionally, a similar decrease in proliferation and in neuronal differentiation was observed in murine adult neural stem cells cultured in vitro upon rapamycin treatment. In contrast, metformin treatment did not significantly reduce neural stem cell proliferation or differentiation. Our studies indicate that two distinct methods of inhibiting mTOR activity differentially affect mammalian adult neural stem cells.
Results
Chronic and systemic administration of rapamycin, but not metformin, decreases BrdU incorporation in SVZ and DG neurogenic niches
We used an ~9-week regimen of daily intraperitoneal (i.p.) injection of rapamycin at 75 μg/kg (low dose) or 2.5 mg/kg (high dose), or metformin at 200 mg/kg daily in adult C57BL/6J mice (Fig. 1a). The low-dose rapamycin was selected to match previously reported dosage that enhanced CD8 memory T cell generation (Araki et al. 2009). The high rapamycin dosage was selected to match the concentration reported to extend life span (Miller et al. 2011). The animals were 3 months old at the beginning of the treatment. Age-matched controls received daily PBS injections. The mice did not show any increase in food intake or body weight during this study; mice on high-dose rapamycin showed weight loss (Table 1). Sixteen hours following the last injection, the mice were harvested, and rapamycin concentration in the blood and metformin concentration in the plasma were quantitated (Fig. 1b). The inhibition of mTOR activity in the brain following the pharmacological treatments was confirmed by fluorescent immunohistochemical analyses of phospho-ribosomal S6 (rS6 ~ P) on brain sections. Our results demonstrate that both concentrations of rapamycin used in this study, as well as metformin, effectively reduced rS6 ~ P-specific immunostaining, indicating that mTOR signaling is inhibited in the brain following rapamycin and metformin treatment (Fig. 1c).
Fig. 1.

Chronic, systemic rapamycin and metformin administration in mice inhibits mTOR activity in the brain. a Schematic representation of chronic rapamycin and metformin treatment regimens and BrdU administration prior to tissue collection. Intraperitoneal (i.p.). b Rapamycin and metformin concentration in the blood and plasma, respectively, collected from mice before tissue collection. The last dose of rapamycin and metformin were given 16 h before sacrificing the mice. c Ribosomal S6 phosphorylation (rS6 ~ P), as detected by immunofluorescence, in sections from the cortex of control mice or mice treated with the indicated doses of rapamycin or metformin. Scale bar = 100 μm. Data are presented as representative of ≥5 mice per group
Table 1.
Neither rapamycin nor metformin significantly increase food intake or body weight
| Average (g) | SEM | |
|---|---|---|
| A | ||
| Control | 3.5 | 0.6 |
| Rapamycin 75 mg/kg | 3.5 | 0.2 |
| Rapamycin 2.5 mg/kg | 4.1 | 0.6 |
| Metformin | 5.0 | 0.9 |
| B | ||
| Control | 28.8 | 4.5 |
| Rapamycin 75 mg/kg | 29.1 | 0.5 |
| Rapamycin 2.5 mg/kg | 24.8 | 0.8 |
| Metformin | 28.7 | 0.8 |
Average food intake (per mouse per gram) during the study (A) and average body weight (per mouse) at end of study (B) with standard error of the mean (SEM)
To quantitate adult neural stem cell numbers, the mice were injected with BrdU 2 days prior to sacrifice (Fig. 1a). BrdU is incorporated in the DNA during S-phase and has been utilized to detect slowly cycling B cells and the proliferating C cells in adult neurogenic niches (Kee et al. 2002; Taupin 2007). First, BrdU incorporation in SVZ (Fig. 2a) was measured by analyses of serial sections encompassing the entire SVZ of adult mice. This experiment revealed that the number of BrdU+ cells was significantly decreased in both low- and high-dose rapamycin-treated mice (Fig. 2b and c). Interestingly, metformin treatment did not significantly alter the number of BrdU+ cells (Fig. 2b and c). Next, the number of BrdU+ cells was quantified as described in the “Experimental procedures” section, and statistical analyses revealed a significant difference in BrdU incorporation between control and rapamycin-treated, but not in metformin-treated, mice (Fig. 2d). To independently confirm the reduction in neural progenitor numbers, SVZ sections were stained with Ki67. While BrdU can be incorporated in apoptotic cells, Ki67 is a cell cycle marker. Consistent with the effect of the drug treatment on BrdU incorporation, a decreased number of Ki67+ cells were detected following rapamycin, but not metformin treatment (Supplementary Fig. S1).
Fig. 2.

Chronic rapamycin treatment, but not metformin, inhibits the proliferation of neural progenitors in the SVZ region of the adult mammalian brain. a Schematic indicating a region of interest (boxed area) in SVZ. b BrdU (red) incorporation as detected by immunofluorescence in the SVZ of control and treated mice. DAPI-stained nuclei are shown in blue. Scale bar = 100 μm. Arrows point to BrdU+ cells. c BrdU (green) and DAPI (blue) in the SVZ of control and treated mice. Scale bar = 25 μm. d Quantification of BrdU+ cells per square millimeter in the SVZ in control and treated mice. Data are presented as representative individual images or as mean ± SEM from ≥5 mice per group. **p < 0.01, ns is nonsignificant
We also measured BrdU incorporation in the DG, an additional neurogenic niche (Fig. 3a). Sections corresponding to DG were stained with anti-BrdU antibody, and the number of BrdU+ cells were counted and compared between control, rapamycin-treated and metformin-treated mice. We observed fewer BrdU+ cells in the DG of the rapamycin-treated mice, in comparison to control or metformin-treated mice (Fig. 3b and c). Taken together, our results demonstrate that chronic, systemic rapamycin, but not metformin, significantly reduced the number of cycling mammalian adult neural stem cells.
Fig. 3.
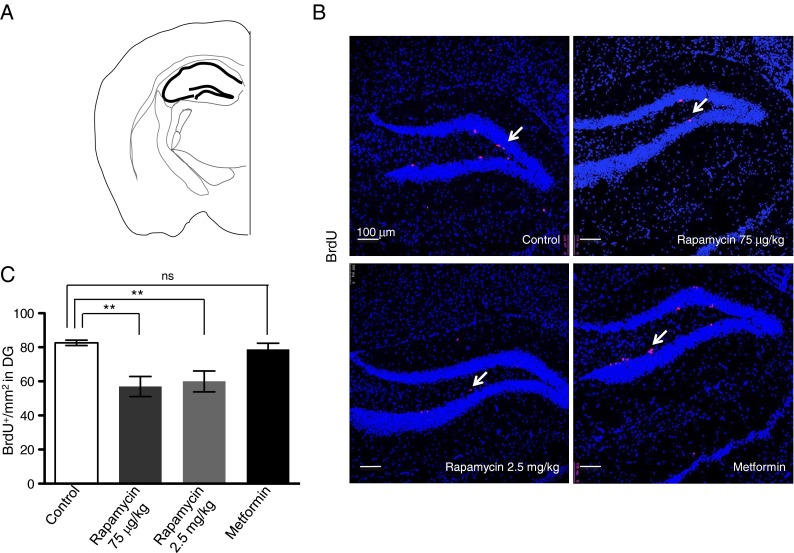
Chronic rapamycin treatment, but not metformin, inhibits the proliferation of neural progenitors in DG. a Schematic outlining DG. b BrdU incorporation (red) and DAPI (blue), as detected by immunofluorescence, in DG of control and treated mice. Scale bar = 100 μm. Arrow points to BrdU+ cells. c Quantification of BrdU+ cells per square millimeter in the DG in control and treated mice. Data are presented as representative individual images or as mean ± SEM from ≥5 mice per group. **p < 0.01, ns is nonsignificant
Neural progenitor proliferation in vitro is reduced by rapamycin but remains unaffected by metformin
To directly test the effects of rapamycin and metformin on neural progenitor proliferation, apoptosis and/or differentiation, we measured the effects of these drugs on primary, adult neural stem cells isolated from the SVZ of postnatal day 30 (p30) C57BL/6 mice and cultured in vitro. Neural stem cells were grown under two independent culture conditions, either as neurospheres or as an adherent monolayer. In vitro cultures were treated with 200 nM rapamycin or 500 nM metformin overnight, and the inhibition of mTOR was confirmed by rS6 ~ P immunoblotting. Under these conditions, both rapamycin and metformin treatment inhibited mTOR activity in these neural stem cells (Fig. 4a). Next, proliferation of the neural stem cells was measured by BrdU incorporation. Cells were incubated overnight with BrdU in the presence of rapamycin or metformin. Rapamycin treatment significantly inhibited the rate of proliferation as indicated by decreased proportion of BrdU+ cells (Fig. 4b; Table 2). Unlike rapamycin, metformin treatment did not reduce the proliferation of neural stem cells in vitro. Finally, we performed cell cycle analyses of control, rapamycin, and metformin-treated adult neural stem cells. Neural stem cells were grown under adherent conditions in the presence of rapamycin or metformin, and cell cycle analyses were performed by propidium iodide (PI) labeling and FACS. Similar to previous reports (Bez et al. 2003; Merlo et al. 2007), we found that under control conditions 78.73 ± 1.59 % of neural stem cells was in G1 phase, 9.0 ± 0.85 % in the S phase, and 11.40 ± 0.35 % in the G2/M phase (Table 3). Metformin treatment did not significantly alter this profile (Fig. 4c; Table 3). In contrast, rapamycin treatment increased the percentage of cells in the G1 phase and resulted in a consequent decrease in S and G2/M phases (Fig. 4c; Table 3). Rapamycin is known to cause G1 arrest in differentiated cells (Huang et al. 2003), and reduced S phase in the presence of rapamycin may account for reduced BrdU incorporation observed in vivo. Neither rapamycin nor metformin induced significant apoptosis (Fig. 4d). Taken together, these results are consistent with our in vivo BrdU incorporation studies and suggest that rapamycin inhibits the proliferation of neural progenitors.
Fig. 4.

Rapamycin, but not metformin, inhibits proliferation of neural stem cells in vitro. a Ribosomal S6 phosphorylation (rS6 ~ P) and total ribosomal S6 in neural stem cells cultured in vitro, as detected by immunoblotting after overnight rapamycin or metformin treatment. b Representative FACS plots of BrdU incorporation in adult neural stem cells after rapamycin or metformin treatment. c Representative FACS cell cycle analysis of neural stem cells after rapamycin or metformin treatment. d Representative FACS analysis of annexin V/PI staining in neural stem cells after rapamycin or metformin treatment. Data are presented as representative of three independent experiments
Table 2.
Rapamycin, but not metformin, inhibits the proliferation of neural progenitors in vitro
| Neurosphere | Adherent NSC | |
|---|---|---|
| Treatment | % Inhibition | % Inhibition |
| Rapamycin | 23.68 ± 3.09 | 22.57 ± 4.99 |
| Metformin | −0.30 ± 4.3 | 3.23 ± 3.5 |
Percentage inhibition of BrdU incorporation in neural stem cells isolated from p30 SVZ and grown in vitro as neurospheres or as an adherent monolayer. Data are presented as mean ± SEM of greater than or equal to three independent experimental repeats
Table 3.
Rapamycin, but not metformin, causes G1 phase arrest in vitro
| Treatment | G1 phase | S phase | G2 phase |
|---|---|---|---|
| Control | 78.73 ± 1.59 % | 9.0 ± 0.85 % | 11.40 ± 0.35 % |
| Rapamycin | 85.67 ± 0.96 % | 6.63 ± 0.68 % | 7.01 ± 0.51 % |
| Metformin | 78.90 ± 1.31 % | 10.10 ± 1.30 % | 10.25 ± 0.80 % |
Percentage of neural stem cells at different stages of the cell cycle following in vitro rapamycin and metformin treatment, as determined by PI staining and FACS analyses. Data are presented as mean ± SEM of greater than or equal to three independent experimental repeats
Rapamycin, but not metformin, reduces neuronal differentiation
We directly tested the effects of rapamycin and metformin on neuronal differentiation in vitro by using isolated neural stem cells. Following neurosphere cultures, differentiation was induced as described in the “Experimental procedures” section. Undifferentiated neural progenitors were identified as Nestin+, while differentiated neurons in culture were identified by Tuj1+ staining. Both control, as well as metformin-treated cells lost their Nestin-expression, and some cells became Tuj1+ upon neuronal differentiation (Fig. 5). Treatment with rapamycin inhibited this differentiation in vitro. Rapamycin-treated cells failed to express Tuj1 and retained Nestin expression (Fig. 5). These results are also consistent with the longer G1 observed in rapamycin-treated neural stem cells in vitro. Alterations in the precise length of G1 phase in stem cells have been correlated with defects in differentiation (Lange et al. 2009; Li et al. 2012). In summary, our in vitro results indicate that rapamycin inhibits neural progenitor proliferation and differentiation. Since the SVZ and DG neural progenitors are the source of adult born neurons, we hypothesized that neuronal differentiation may decrease following chronic, systemic rapamycin treatment. Consistent with this hypothesis, we observed that the number of DCX+ cells in the SVZ was reduced upon chronic, systemic rapamycin treatment in comparison to control brain (Supplementary Fig. S2). DCX is a widely used marker for identifying neuroblasts and immature neurons in vivo (Brown et al. 2003). However, metformin treatment did not alter the number of DCX+ cells (Supplementary Fig. S2). Therefore, the reduced proliferation of neural progenitors observed in vivo and in vitro in this study, along with the inhibition of in vitro differentiation, indicate that chronic, systemic rapamycin treatment results in reduced adult-born neurons.
Fig. 5.

Rapamycin, but not metformin, inhibits differentiation of neural stem cells in vitro. Representative images of undifferentiated or differentiated p30 neural stem cells after rapamycin or metformin treatment. Scale bar = 30 μm. Data are presented as representative of three independent experiments
Discussion
Our experiments demonstrate that ~9-week systemic administration of the mTOR inhibitor rapamycin reduced the number of neural progenitor cells in the adult mammalian brain. In contrast, a different pharmacological strategy of inhibiting mTOR indirectly through AMPK activation, did not significantly affect proliferation in the neurogenic niche. The molecular mechanisms accounting for the observed differences between the mTOR inhibitor rapamycin and metformin remain unclear at this point and will be the subject of future analyses. Differential effects of rapamycin and metformin could be ascribed to the unique effects of these drugs on mTORC1 versus mTORC2 complex, differential inhibition of downstream signaling components or alternative engagement of feedback regulatory pathways. The first possibility is the reported effect of rapamycin on the mTORC2 complex. Prolonged rapamycin treatment has been reported to inhibit mTORC2 (Sarbassov et al. 2006). Similarly, rapamycin-induced insulin resistance results from the disruption of the mTORC2 complex (Lamming et al. 2012). It is possible that the inhibition of adult neurogenesis by rapamycin may result from similar undesirable effects on mTORC2. Metformin-dependent AMPK signaling is likely to be restricted to the regulation of the mTORC1 complex. Secondly, differential effects on mTORC1 substrates can also account for the observed differences. For example, 4E-BP1 is the major effector for the cell cycle effects of rapamycin (Dudkin et al. 2001). Additionally, unique targets of AMPK such as Acetyl CoA carboxylase (Mihaylova and Shaw 2011), may offset the negative effects of rapamycin through unknown mechanisms. It will be interesting to perform an unbiased, comparative assessment of differential downstream target engagement in neural stem cells following chronic rapamycin and metformin treatment. Finally, differences in the response of the IRS/Akt or Grb10 feedback loops (Shah and Hunter 2005; Huang and Manning 2009; Hsu et al. 2011; Yu et al. 2011) following rapamycin versus metformin treatment in neural progenitors may account for the observed effects. Metformin and rapamycin have been reported to have opposing effects on Akt activation (Zakikhani et al. 2010). Additionally, AMPK activation in sensory neurons inhibits incision-induced acute and chronic pain and neuropathic pain by the simultaneous attenuation of both mTOR and ERK signaling (Melemedjian et al. 2011; Tillu et al. 2012). In contrast, we observe that both pharmacological and genetic inhibition of mTORC1 evokes spontaneous pain, mechanical hypersensitivity, and increased sensory neuron excitability (Melemedjian et al. 2013). Rapamycin releases the feedback inhibition of Grb10, which is an upstream regulator of MAPK pathway (Kebache et al. 2007; Hsu et al. 2011; Yu et al. 2011) and has previously been shown to increase ERK activation in TSC2−/− murine embryonic fibroblasts (Ghosh et al. 2006).
Adult neural progenitor cells and adult neurogenesis are generally considered positive characteristics that may improve or preserve cognitive function and behavioral health in aging. In our study, rapamycin reduces neural progenitor numbers. Additionally, rapamycin, or the inhibition of the mTORC1 and mTORC2 complexes, have been reported to inhibit dendritic arborization of hippocampal neurons (Urbanska et al. 2012). Therefore, chronic rapamycin treatment may have a paradoxical, negative effect on health span. It remains to be seen if metformin treatment, which lacked the adverse effects associated with rapamycin in our studies, would be suitable for extending both life span and health span across mammalian species. However, we cannot formally rule out the possibility that abnormal integration of adult-born neurons into pre-existing circuits contributes to aging and the inhibition of adult neurogenesis may be beneficial to health span. It is interesting to note that at least in the nematode C. elegans, the loss of certain neurons has been correlated with extended life span (Alcedo and Kenyon 2004). Careful assessment of a causal link between rapamycin effects on adult neurogenesis and learning, memory, and behavior in mammalian models of aging will be required for a comprehensive understanding of the impact of long-term rapamycin treatment in cognitive health span.
In summary, our study reveals that distinct approaches of inhibiting the mTOR pathway, especially in the context of long-term, systemic treatment consistent with life span extension, can have significantly different outcomes in terms of physiological or pathological responses. The effects of mTOR inhibitors on cellular correlates of health span must therefore be carefully and comprehensively analyzed in individual organs and systems. While here we examine the effects of two distinct pharmacological approaches for mTOR inhibition only on adult neural progenitor cells, immune function, for example, will constitute another important physiological parameter for the assessment of improved health span. Rapamycin being an immunosuppressant, a thorough assessment of its effect on innate and adaptive immune function in old mice is merited.
Experimental procedures
Mice
Adult male (12 weeks) C57BL/6J mice were purchased from the Jackson Laboratory (Bar Harbor, ME). All mice were housed under specific pathogen-free conditions at the University of Arizona, maintained under a strict 12-h light cycle and given a regular chow diet. Upon arrival, the mice were rested for 1 week prior to manipulation. The mice were kept in individual metabolic cages for an initial 24-h adaptation period followed by a 24-h period during which food intake was measured. Baseline, 4- and 8-week measurements were performed. The mice were given free access to food and water for the entire study period. The mice were weighed before and after being placed into the metabolic cages. All experimental procedures were conducted with approval from the University of Arizona Institutional Animal Care and Use Committee. Rapamycin (LC Labs) and metformin (Sigma) were administered by daily i.p. injection during the treatment period. Rapamycin was administered in a high (2.5 mg/kg) or low (75 μg/kg) dose. Metformin was administered at a dose of 200 mg/kg. Control mice received daily PBS i.p. injections. BrdU (50 mg/kg, Sigma) was given by i.p. injection every 12 h, beginning 48 h prior to harvest.
Antibodies
For immunoblotting, rabbit phospho-S6 ribosomal protein (Ser240/244, #5364) and mouse S6 ribosomal protein (#2317) antibodies were purchased from Cell Signaling and were used at a concentration of 1:1,000. For immunocytochemistry, mouse Tuj1 (MAB1637) and rabbit Nestin (MAB5922) antibodies were purchased from Millipore and used at a concentration of 1:250 and 1:500, respectively. For immunohistochemistry, rabbit DCX (ab18723), rat BrdU (ab6326), and rabbit Ki67 (ab16667) antibodies were purchased from Abcam and used at a concentration of 1:100. Rabbit Phospho-S6 ribosomal protein (Ser235/236) conjugated to Alexa Fluor 647 was purchased from Cell Signaling (4851) and used at 1:100.
Species-specific Alexa Fluor conjugated secondary antibodies were purchased from Invitrogen and used at 1:500. HRP-conjugated species-specific secondary antibodies were purchased from Promega and used at 1:2,000.
Measurement of rapamycin and metformin
Measurement of rapamycin and metformin in mouse blood were performed using a TSQ Quantum liquid HPLC-electrospray ionization-tandem mass spectrometry system (Thermo Finnigan, San Jose). Serial dilutions of a known amount of rapamycin or metformin spiked into blank EDTA mouse blood were used as internal standards for quantitation of the drugs in the blood. The scan for rapamycin was performed at 931.5 (M + NH4) + → 864.7 at a collision energy of 20 eV. Metformin was detected by selective reaction monitoring; parent mass/charge ratio for metformin is 130.1 and the fragment monitored is 71.1. The collision energy was 33 eV. Additional details are provided in “Supplementary experimental procedures.”
Immunohistochemistry
Mice were euthanized and perfused with 30 mL PBS before the brains were quickly removed and flash frozen in isopentane. Specimens were then stored at −80 °C. The brains were mounted using OCT and sectioned at 14 μm. For BrdU staining, slides were first fixed in 4 % PFA for 15 min and subsequently washed 3× in PBS for 10 min each. Slides were denatured in 2 N HCl for 15 min at 37 °C, and then for another 15 min in 2 N HCl at room temperature (RT). Slides were rinsed in boric acid buffer (0.2 M orthoboric acid, pH 8.4) and incubated for further 10 min at RT. They were then washed 3× in PBS, blocked in 5 % donkey serum with 0.1 % Triton X-100 for 2 h at RT. Sections were incubated in primary antibody in blocking buffer at 1:100 overnight at 4 °C. Slides were washed 3× in PBS with 0.1 % Triton X-100 (PBST) for 10 min each and subsequently incubated with secondary antibodies for 2 h at RT. Slides were washed in 3× in PBS for 10 min, and fixed again in 4 % PFA. Slides were subsequently washed and denatured again prior to blocking and incubation in the second primary antibody (DCX) overnight at 4 °C. After overnight incubation, the slides were washed 3× in PBS and incubated for 10 min in 100 ng/mL DAPI before being mounted in Prolong Gold Antifade Reagent (Invitrogen), cover-slipped and imaged using a Leica SP5 confocal microscope. For immunohistochemistry using p-S6 ribosomal protein antibodies, sections were fixed in 4 % PFA, washed 3× in PBS and then blocked in 10 % donkey serum in PBST for 2 h at RT. Sections were incubated with primary antibody at 1:100 in blocking buffer overnight at 4 °C. Sections were washed 3× with PBS and incubated for 10 min in 100 ng/mL DAPI before being cover-slipped and imaged on a Leica SP5 confocal microscope.
Quantification of BrdU+ cells
Fourteen-micrometer sections were collected beginning at the olfactory bulbs and ending at the cerebellum. Series of every 15th section through each sample were processed for BrdU immunohistochemistry as described above and every adjacent section was stained with H&E. The SVZ was defined as beginning at the bregma 1.41 mm until −0.11 mm. Only cells existing within 0.1 mm lateral to the ependymal lining were counted. No cells on the medial SVZ were considered. The total number of sections in which the SVZ appeared were ~85-100 (roughly 1.2 mm rostral-caudal). The DG was defined as beginning at the bregma −1.077 mm until the bregma −3.39 mm. The total number of sections in which the DG appeared were ~130–170 (roughly 2 mm rostral–caudal). The areas of the SVZ and DG were measured using ImageJ (NIH). For cell counting, the investigator was blinded to the experimental condition. BrdU-labeled cells were exhaustively counted on every 15th section through the entire DG or SVZ.
Neural stem cell isolation
For both neurosphere and adherent neural stem cell culture, postnatal day 30 (p30) C57BL/6 mice were used. Briefly, the brains were removed and placed in ice-cold Leibovitz’s L15 media (Invitrogen) for dissection. Using a microsurgery knife, a 1-mm coronal section was obtained corresponding to the region of the SVZ. Cuts were made vertically following the ventricle ventrally and horizontally following the ventricle dorsally. A small piece of SVZ was then dissected and placed into a 1.5-mL microcentrifuge tube containing 300 μL of 0.25 % Trypsin-EDTA in PBS and incubated at 37 °C for 20 min. Seven hundred microliter of complete media (see Supplementary Information) was added, and the tissue was gently triturated until single cell suspension was obtained. Cells were then plated either in complete media (for neurospheres) or N5 media (for adherent neural stem cell culture). The composition of N5 media is provided in the Supplementary Information. Overnight treatment with different concentrations of rapamycin and metformin were tested on neural stem cells and the concentrations showing maximal inhibition of mTOR (assayed by inhibition of rS6 phosphorylation) without significant cell death were used in the study (200 nM rapamycin and 500 μM metformin).
Immunoblotting
For immunoblotting, neurospheres were grown in the presence or absence of rapamycin or metformin for 3 h prior to lysing. For lysis, ice-cold 1 % NP-40 buffer (20 mM Tris–HCl at pH 8, 137 mM NaCl, 10 % glycerol, 1 % NP-40) supplemented with phosphatase and protease inhibitors (Halt protease and phosphatase inhibitor cocktail, Thermo Scientific) was used. Briefly, cells were washed 3× with ice-cold PBS and then resuspended in cold NP-40 buffer. Lysates were kept cold and sonicated ten times, 1 s each, and then centrifuged at 12,000 × g for 5 min at 4 °C. LDS sample loading buffer (Invitrogen) with DTT was added, and the immunoprecipitates were boiled for 5 min prior to loading onto precast SDS-PAGE gels (Invitrogen). Gels were transferred onto methanol pre-soaked PVDF membranes and subsequently blocked with 5 % BSA in TBS for 2 h. The blot was incubated in phospho-S6 ribosomal protein antibody (Cell Signaling, #5364, 1:1,000) overnight at 4 °C, after which blots were washed 3× with TBST (TBS + 0.1 % Tween) for 15 min each, followed by incubation with secondary antibodies (1:2,000) for 1 h at RT. Blots were then washed 3× for 30 min each in TBST, with a final wash in TBS alone. Blots were stripped and reprobed using total S6 ribosomal protein antibody (Cell Signaling, #2317, 1:1,000) overnight at 4 °C prior to secondary incubation and developing. All blots were developed using Super Signal West Dura (Thermo Scientific) on the UVP Imager.
Neural stem cell proliferation and apoptosis
Neurospheres and adherent neural stem cell cultures were treated overnight with with 200 nM rapamycin and 500 μM metformin. For proliferation assays, cells were grown overnight in the presence of 10 μM BrdU. BrdU was detected using a BrdU-APC (BD Pharmingen #552598) kit according to manufacturer’s instructions. For cell cycle analysis, cells were washed 3× with PBS and resuspended in 1 mL of ice-cold PBS in polypropylene tubes. For fixation, cells were gently vortexed while adding 3 mL of ice-cold absolute ethanol dropwise and then fixed overnight at 4 °C. For staining, cells were washed with ice-cold PBS and resuspended in 300 μL of propidium iodide solution (200 ng/mL RNAse A, 20 mg/mL propidium iodide, 0.1 % Triton X-100 in PBS) for 15 min at 37 °C. Data were collected using an Accuri C6 (BD Biosciences) and was analyzed using FlowJo (Tree Star). In vitro apoptosis experiments were performed on dissociated adherent neural stem cells using the ApoDetect Annexin V-FITC kit (Invitrogen #33-1200) according to the manufacturers’ instruction.
Neural stem cell culture and differentiation
Neurospheres were maintained in complete media. For differentiation, neurospheres were dissociated using TrypLE (Invitrogen) following manufacturer’s instructions and seeded onto acid-etched coverslips (70 % EtOH, 1 % HCL in PBS, 5 min followed by extensive PBS wash) in differentiation media #1 or without rapamycin or metformin for 2 days. The media was then changed to differentiation media #2 for 5 days with or without drug. The composition of differentiation media #1 and #2 is provided in the Supplementary Information.
All media were filter sterilized using a 0.2-μm filter. Adherent neural stem cells were maintained in N5 media. For in vitro proliferation and differentiation experiments, rapamycin was used at 200 nM, metformin was used at 500 μM.
Immunocytochemistry
Following differentiation, coverslips were fixed with 4 % PFA for 15 min at RT, then washed 3× with PBS and permeabilized with PBST for 15 min at RT. Cells were blocked for 2 h with 2 % normal horse serum (Invitrogen) in PBS at RT. Primary antibodies were diluted in 2 % normal horse serum and cells were incubated overnight at 4 °C. Subsequently, coverslips were washed 3× with PBS and secondary antibodies (Alexa-Fluor-488 and 594) diluted in 2 % normal horse serum were added for 2 h at RT. Following the secondary antibody incubation, cells were stained with 100 ng/mL DAPI for 10 min at RT. Finally, coverslips were washed 3× with PBS and mounted onto slides using ProLong Gold antifade reagent (Invitrogen) and sealed with nail polish. Images were obtained using a Leica SP5 confocal microscope.
Statistical analysis
Differences between the means of experimental groups were analyzed with a two-tailed t test (Prism GraphPad Software, Inc.). P values ≤ 0.05 were considered significant. A minimum of five mice per category (control, rapamycin 75 μg/kg, rapamycin 2.5 mg/kg and metformin-treated groups) were tested for all in vivo experiments described. In vitro experiments were performed in triplicates.
Electronic supplementary material
(DOC 96.5 kb)
Chronic rapamycin, but not metformin, treatment reduces neural progenitor numbers in the SVZ region of the adult mammalian brain. Ki67 staining in the SVZ of control and treated mice. Scale bar = 100 μm. Arrow points to Ki67+ cells. Data are presented as representative images. More than or equal to five mice were included per group (PDF 357 kb)
Chronic rapamycin treatment, but not metformin, reduces neuroblasts and/or immature neuron numbers. DCX (green) and DAPI (blue), as detected by immunofluorescence, in the SVZ of control, rapamycin, and metformin-treated mice. Scale bar = 50 μm. Data are presented as representative images. More than or equal to five mice were included per group (PDF 75 kb)
Acknowledgments
This research was supported by NIAID contract HHSN 272201100017C (NIH/NIAID N01-AI-00017) to J.N.-Z. and grants from the National Institutes of Health NIH/NCI CA95060 (S.G.), NIH/NINDS R01 NS065926 (T.J.P.), The American Pain Society (T.J.P.), The Rita Allen Foundation (T.J.P.), Pilot Biology of Aging Research Initiative from the Arizona Center on Aging (J.N.-Z.), NIH/NIDCR RC1 DE020335 (K.H.L.), NIH/NIDDK R01 DK073611 (H.L.B.), and the Arizona Cancer Center Core Support Grant (NCI 5P30 CA23074). We thank Carla V. Rothlin and Eugenio A. Carrera Silva for technical expertise and for the critical evaluation of the manuscript and helpful suggestions and discussions.
Footnotes
Authors Yael Kusne, Emily Goldberg, and Janko Nikolich-Zugich and Sourav Ghosh contributed equally to this work.
Contributor Information
Janko Nikolich-Zugich, Email: jnikolich@medadmin.arizona.edu.
Sourav Ghosh, Email: sourav.ghosh@arizona.edu.
References
- Alcedo J, Kenyon C. Regulation of C. elegans longevity by specific gustatory and olfactory neurons. Neuron. 2004;41:45–55. doi: 10.1016/S0896-6273(03)00816-X. [DOI] [PubMed] [Google Scholar]
- Anisimov VN, Berstein LM, Popovich IG, Zabezhinski MA, Egormin PA, Piskunova TS, Semenchenko AV, Tyndyk ML, Yurova MN, Kovalenko IG, Poroshina TE. If started early in life, metformin treatment increases lifespan and postpones tumors in female SHR mice. Aging (Albany NY) 2011;3:148–157. doi: 10.18632/aging.100273. [DOI] [PMC free article] [PubMed] [Google Scholar]
- Apfeld J, O'Connor G, McDonagh T, DiStefano PS, Curtis R. The AMP-activated protein kinase AAK-2 links energy levels and insulin-like signals to life span in C. elegans. Genes Dev. 2004;18:3004–3009. doi: 10.1101/gad.1255404. [DOI] [PMC free article] [PubMed] [Google Scholar]
- Araki K, Turner AP, Shaffer VO, Gangappa S, Keller SA, Bachmann MF, Larsen CP, Ahmed R. mTOR regulates memory CD8 T-cell differentiation. Nature. 2009;460:108–112. doi: 10.1038/nature08155. [DOI] [PMC free article] [PubMed] [Google Scholar]
- Berstein LM. Metformin in obesity, cancer and aging: addressing controversies. Aging (Albany NY) 2012;4:320–329. doi: 10.18632/aging.100455. [DOI] [PMC free article] [PubMed] [Google Scholar]
- Bez A, Corsini E, Curti D, Biggiogera M, Colombo A, Nicosia RF, Pagano SF, Parati EA. Neurosphere and neurosphere-forming cells: morphological and ultrastructural characterization. Brain Res. 2003;993:18–29. doi: 10.1016/j.brainres.2003.08.061. [DOI] [PubMed] [Google Scholar]
- Brown JP, Couillard-Despres S, Cooper-Kuhn CM, Winkler J, Aigner L, Kuhn HG. Transient expression of doublecortin during adult neurogenesis. J Comp Neurol. 2003;467:1–10. doi: 10.1002/cne.10874. [DOI] [PubMed] [Google Scholar]
- Deng W, Aimone JB, Gage FH. New neurons and new memories: how does adult hippocampal neurogenesis affect learning and memory? Nat Rev Neurosci. 2010;11:339–350. doi: 10.1038/nrn2822. [DOI] [PMC free article] [PubMed] [Google Scholar]
- Dudkin L, Dilling MB, Cheshire PJ, Harwood FC, Hollingshead M, Arbuck SG, Travis R, Sausville EA, Houghton PJ. Biochemical correlates of mTOR inhibition by the rapamycin ester CCI-779 and tumor growth inhibition. Clin Cancer Res. 2001;7:1758–1764. [PubMed] [Google Scholar]
- Encinas JM, Vaahtokari A, Enikolopov G. Fluoxetine targets early progenitor cells in the adult brain. Proc Natl Acad Sci U S A. 2006;103:8233–8238. doi: 10.1073/pnas.0601992103. [DOI] [PMC free article] [PubMed] [Google Scholar]
- Fishwick KJ, Li RA, Halley P, Deng P, Storey KG. Initiation of neuronal differentiation requires PI3-kinase/TOR signalling in the vertebrate neural tube. Dev Biol. 2010;338:215–225. doi: 10.1016/j.ydbio.2009.12.001. [DOI] [PubMed] [Google Scholar]
- Ghosh S, Tergaonkar V, Rothlin CV, Correa RG, Bottero V, Bist P, Verma IM, Hunter T. Essential role of tuberous sclerosis genes TSC1 and TSC2 in NF-kappaB activation and cell survival. Cancer Cell. 2006;10:215–226. doi: 10.1016/j.ccr.2006.08.007. [DOI] [PubMed] [Google Scholar]
- Guertin DA, Sabatini DM. The pharmacology of mTOR inhibition. Sci Signal. 2009;2:pe24. doi: 10.1126/scisignal.267pe24. [DOI] [PubMed] [Google Scholar]
- Halloran J, Hussong SA, Burbank R, Podlutskaya N, Fischer KE, Sloane LB, Austad SN, Strong R, Richardson A, Hart MJ, Galvan V. Chronic inhibition of mammalian target of rapamycin by rapamycin modulates cognitive and non-cognitive components of behavior throughout life span in mice. Neuroscience. 2012;223:102–113. doi: 10.1016/j.neuroscience.2012.06.054. [DOI] [PMC free article] [PubMed] [Google Scholar]
- Han J, Wang B, Xiao Z, Gao Y, Zhao Y, Zhang J, Chen B, Wang X, Dai J. Mammalian target of rapamycin (mTOR) is involved in the neuronal differentiation of neural progenitors induced by insulin. Mol Cell Neurosci. 2008;39:118–124. doi: 10.1016/j.mcn.2008.06.003. [DOI] [PubMed] [Google Scholar]
- Harrison DE, Strong R, Sharp ZD, Nelson JF, Astle CM, Flurkey K, Nadon NL, Wilkinson JE, Frenkel K, Carter CS, Pahor M, Javors MA, Fernandez E, Miller RA. Rapamycin fed late in life extends life span in genetically heterogeneous mice. Nature. 2009;460:392–395. doi: 10.1038/nature08221. [DOI] [PMC free article] [PubMed] [Google Scholar]
- Hsu PP, Kang SA, Rameseder J, Zhang Y, Ottina KA, Lim D, Peterson TR, Choi Y, Gray NS, Yaffe MB, Marto JA, Sabatini DM. The mTOR-regulated phosphoproteome reveals a mechanism of mTORC1-mediated inhibition of growth factor signaling. Science. 2011;332:1317–1322. doi: 10.1126/science.1199498. [DOI] [PMC free article] [PubMed] [Google Scholar]
- Huang J, Manning BD. A complex interplay between Akt, TSC2 and the two mTOR complexes. Biochem Soc Trans. 2009;37:217–222. doi: 10.1042/BST0370217. [DOI] [PMC free article] [PubMed] [Google Scholar]
- Huang S, Bjornsti MA, Houghton PJ. Rapamycins: mechanism of action and cellular resistance. Cancer Biol Ther. 2003;2:222–232. doi: 10.4161/cbt.2.3.360. [DOI] [PubMed] [Google Scholar]
- Ingram DK, Zhu M, Mamczarz J, Zou S, Lane MA, Roth GS, deCabo R. Calorie restriction mimetics: an emerging research field. Aging Cell. 2006;5:97–108. doi: 10.1111/j.1474-9726.2006.00202.x. [DOI] [PubMed] [Google Scholar]
- Johnson SC, Rabinovitch PS, Kaeberlein M. mTOR is a key modulator of ageing and age-related disease. Nature. 2013;493:338–345. doi: 10.1038/nature11861. [DOI] [PMC free article] [PubMed] [Google Scholar]
- Kappeler L, De Magalhaes Filho C, Dupont J, Leneuve P, Cervera P, Perin L, Loudes C, Blaise A, Klein R, Epelbaum J, Le Bouc Y, Holzenberger M. Brain IGF-1 receptors control mammalian growth and lifespan through a neuroendocrine mechanism. PLoS Biol. 2008;6:e254. doi: 10.1371/journal.pbio.0060254. [DOI] [PMC free article] [PubMed] [Google Scholar]
- Kebache S, Ash J, Annis MG, Hagan J, Huber M, Hassard J, Stewart CL, Whiteway M, Nantel A. Grb10 and active Raf-1 kinase promote Bad-dependent cell survival. J Biol Chem. 2007;282:21873–21883. doi: 10.1074/jbc.M611066200. [DOI] [PubMed] [Google Scholar]
- Kee N, Sivalingam S, Boonstra R, Wojtowicz JM. The utility of Ki-67 and BrdU as proliferative markers of adult neurogenesis. J Neurosci Methods. 2002;115:97–105. doi: 10.1016/S0165-0270(02)00007-9. [DOI] [PubMed] [Google Scholar]
- Kim JY, Duan X, Liu CY, Jang MH, Guo JU, Pow-anpongkul N, Kang E, Song H, Ming GL. DISC1 regulates new neuron development in the adult brain via modulation of AKT-mTOR signaling through KIAA1212. Neuron. 2009;63:761–773. doi: 10.1016/j.neuron.2009.08.008. [DOI] [PMC free article] [PubMed] [Google Scholar]
- Kriegstein A, Alvarez-Buylla A. The glial nature of embryonic and adult neural stem cells. Annu Rev Neurosci. 2009;32:149–184. doi: 10.1146/annurev.neuro.051508.135600. [DOI] [PMC free article] [PubMed] [Google Scholar]
- Kuhn HG, Dickinson-Anson H, Gage FH. Neurogenesis in the dentate gyrus of the adult rat: age-related decrease of neuronal progenitor proliferation. J Neurosci. 1996;16:2027–2033. doi: 10.1523/JNEUROSCI.16-06-02027.1996. [DOI] [PMC free article] [PubMed] [Google Scholar]
- Lamming DW, Ye L, Katajisto P, Goncalves MD, Saitoh M, Stevens DM, Davis JG, Salmon AB, Richardson A, Ahima RS, Guertin DA, Sabatini DM, Baur JA. Rapamycin-induced insulin resistance is mediated by mTORC2 loss and uncoupled from longevity. Science. 2012;335:1638–1643. doi: 10.1126/science.1215135. [DOI] [PMC free article] [PubMed] [Google Scholar]
- Lange C, Huttner WB, Calegari F. Cdk4/cyclinD1 overexpression in neural stem cells shortens G1, delays neurogenesis, and promotes the generation and expansion of basal progenitors. Cell stem cell. 2009;5:320–331. doi: 10.1016/j.stem.2009.05.026. [DOI] [PubMed] [Google Scholar]
- Laplante M, Sabatini DM. mTOR signaling in growth control and disease. Cell. 2012;149:274–293. doi: 10.1016/j.cell.2012.03.017. [DOI] [PMC free article] [PubMed] [Google Scholar]
- Lazarov O, Mattson MP, Peterson DA, Pimplikar SW, van Praag H. When neurogenesis encounters aging and disease. Trends Neurosci. 2010;33:569–579. doi: 10.1016/j.tins.2010.09.003. [DOI] [PMC free article] [PubMed] [Google Scholar]
- Lehtinen MK, Zappaterra MW, Chen X, Yang YJ, Hill AD, Lun M, Maynard T, Gonzalez D, Kim S, Ye P, D'Ercole AJ, Wong ET, LaMantia AS, Walsh CA. The cerebrospinal fluid provides a proliferative niche for neural progenitor cells. Neuron. 2011;69:893–905. doi: 10.1016/j.neuron.2011.01.023. [DOI] [PMC free article] [PubMed] [Google Scholar]
- Levenson CW, Rich NJ. Eat less, live longer? New insights into the role of caloric restriction in the brain. Nutr Rev. 2007;65:412–415. doi: 10.1111/j.1753-4887.2007.tb00319.x. [DOI] [PubMed] [Google Scholar]
- Li L, Xu B, Zhu Y, Chen L, Sokabe M, Chen L. DHEA prevents Abeta25-35-impaired survival of newborn neurons in the dentate gyrus through a modulation of PI3K-Akt-mTOR signaling. Neuropharmacology. 2010;59:323–333. doi: 10.1016/j.neuropharm.2010.02.009. [DOI] [PubMed] [Google Scholar]
- Li VC, Ballabeni A, Kirschner MW. Gap 1 phase length and mouse embryonic stem cell self-renewal. Proc Natl Acad Sci U S A. 2012;109:12550–12555. doi: 10.1073/pnas.1206740109. [DOI] [PMC free article] [PubMed] [Google Scholar]
- Li Y, Mu Y, Gage FH (2009) Development of neural circuits in the adult hippocampus. Curr Top Dev Biol 87:149–174 [DOI] [PubMed]
- Li Y, Luikart BW, Birnbaum S, Chen J, Kwon CH, Kernie SG, Bassel-Duby R, Parada LF. TrkB regulates hippocampal neurogenesis and governs sensitivity to antidepressive treatment. Neuron. 2008;59:399–412. doi: 10.1016/j.neuron.2008.06.023. [DOI] [PMC free article] [PubMed] [Google Scholar]
- Liu W, Ye P, O'Kusky JR, D'Ercole AJ. Type 1 insulin-like growth factor receptor signaling is essential for the development of the hippocampal formation and dentate gyrus. J Neurosci Res. 2009;87:2821–2832. doi: 10.1002/jnr.22129. [DOI] [PubMed] [Google Scholar]
- Mair W, Morantte I, Rodrigues AP, Manning G, Montminy M, Shaw RJ, Dillin A. Life span extension induced by AMPK and calcineurin is mediated by CRTC-1 and CREB. Nature. 2011;470:404–408. doi: 10.1038/nature09706. [DOI] [PMC free article] [PubMed] [Google Scholar]
- Malberg JE, Eisch AJ, Nestler EJ, Duman RS. Chronic antidepressant treatment increases neurogenesis in adult rat hippocampus. J Neurosci. 2000;20:9104–9110. doi: 10.1523/JNEUROSCI.20-24-09104.2000. [DOI] [PMC free article] [PubMed] [Google Scholar]
- McNeill H, Craig GM, Bateman JM. Regulation of neurogenesis and epidermal growth factor receptor signaling by the insulin receptor/target of rapamycin pathway in Drosophila. Genetics. 2008;179:843–853. doi: 10.1534/genetics.107.083097. [DOI] [PMC free article] [PubMed] [Google Scholar]
- Melemedjian OK, Asiedu MN, Tillu DV, Sanoja R, Yan J, Lark A, Khoutorsky A, Johnson J, Peebles KA, Lepow T, Sonenberg N, Dussor G, Price TJ. Targeting adenosine monophosphate-activated protein kinase (AMPK) in preclinical models reveals a potential mechanism for the treatment of neuropathic pain. Mol Pain. 2011;7:70. doi: 10.1186/1744-8069-7-70. [DOI] [PMC free article] [PubMed] [Google Scholar]
- Melemedjian OK, Khoutorsky A, Sorge RE, Yan J, Asiedu MN, Valdez A, Ghosh S, Dussor G, Mogil JS, Sonenberg N, Price TJ. mTORC1 inhibition induces pain via IRS-1-dependent feedback activation of ERK. Pain. 2013;154:1080–1091. doi: 10.1016/j.pain.2013.03.021. [DOI] [PMC free article] [PubMed] [Google Scholar]
- Merlo S, Calafiore M, Vancheri C, Luigi Canonico P, Copani A, Sortino MA. Astrocyte-like cells as a main target for estrogen action during neuronal differentiation. Mol Cell Neurosci. 2007;34:562–570. doi: 10.1016/j.mcn.2006.12.007. [DOI] [PubMed] [Google Scholar]
- Mihaylova MM, Shaw RJ. The AMPK signalling pathway coordinates cell growth, autophagy and metabolism. Nat Cell Biol. 2011;13:1016–1023. doi: 10.1038/ncb2329. [DOI] [PMC free article] [PubMed] [Google Scholar]
- Miller RA, Harrison DE, Astle CM, Baur JA, Boyd AR, de Cabo R, Fernandez E, Flurkey K, Javors MA, Nelson JF, Orihuela CJ, Pletcher S, Sharp ZD, Sinclair D, Starnes JW, Wilkinson JE, Nadon NL, Strong R. Rapamycin, but not resveratrol or simvastatin, extends life span of genetically heterogeneous mice. J Gerontol A Biol Sci Med Sci. 2011;66:191–201. doi: 10.1093/gerona/glq178. [DOI] [PMC free article] [PubMed] [Google Scholar]
- Palazuelos J, Ortega Z, Diaz-Alonso J, Guzman M, Galve-Roperh I. CB2 cannabinoid receptors promote neural progenitor cell proliferation via mTORC1 signaling. J Biol Chem. 2012;287:1198–1209. doi: 10.1074/jbc.M111.291294. [DOI] [PMC free article] [PubMed] [Google Scholar]
- Paliouras GN, Hamilton LK, Aumont A, Joppe SE, Barnabe-Heider F, Fernandes KJ. Mammalian target of rapamycin signaling is a key regulator of the transit-amplifying progenitor pool in the adult and aging forebrain. J Neurosci. 2012;32:15012–15026. doi: 10.1523/JNEUROSCI.2248-12.2012. [DOI] [PMC free article] [PubMed] [Google Scholar]
- Raman L, Kong X, Gilley JA, Kernie SG. Chronic hypoxia impairs murine hippocampal development and depletes the postnatal progenitor pool by attenuating mammalian target of rapamycin signaling. Pediatr Res. 2011;70:159–165. doi: 10.1203/PDR.0b013e3182218622. [DOI] [PMC free article] [PubMed] [Google Scholar]
- Ramirez-Amaya V, Marrone DF, Gage FH, Worley PF, Barnes CA. Integration of new neurons into functional neural networks. J Neurosci. 2006;26:12237–12241. doi: 10.1523/JNEUROSCI.2195-06.2006. [DOI] [PMC free article] [PubMed] [Google Scholar]
- Santarelli L, Saxe M, Gross C, Surget A, Battaglia F, Dulawa S, Weisstaub N, Lee J, Duman R, Arancio O, Belzung C, Hen R. Requirement of hippocampal neurogenesis for the behavioral effects of antidepressants. Science. 2003;301:805–809. doi: 10.1126/science.1083328. [DOI] [PubMed] [Google Scholar]
- Sarbassov DD, Ali SM, Sengupta S, Sheen JH, Hsu PP, Bagley AF, Markhard AL, Sabatini DM. Prolonged rapamycin treatment inhibits mTORC2 assembly and Akt/PKB. Mol Cell. 2006;22:159–168. doi: 10.1016/j.molcel.2006.03.029. [DOI] [PubMed] [Google Scholar]
- Shah OJ, Hunter T. Tuberous sclerosis and insulin resistance. Unlikely bedfellows reveal a TORrid affair. Cell Cycle. 2005;4:46–51. doi: 10.4161/cc.4.1.1343. [DOI] [PubMed] [Google Scholar]
- Shaw RJ, Lamia KA, Vasquez D, Koo SH, Bardeesy N, Depinho RA, Montminy M, Cantley LC. The kinase LKB1 mediates glucose homeostasis in liver and therapeutic effects of metformin. Science. 2005;310:1642–1646. doi: 10.1126/science.1120781. [DOI] [PMC free article] [PubMed] [Google Scholar]
- Smith DL, Jr, Elam CF, Jr, Mattison JA, Lane MA, Roth GS, Ingram DK, Allison DB. Metformin supplementation and lifespan in Fischer-344 rats. J Gerontol A Biol Sci Med Sci. 2010;65:468–474. doi: 10.1093/gerona/glq033. [DOI] [PMC free article] [PubMed] [Google Scholar]
- Snyder JS, Soumier A, Brewer M, Pickel J, Cameron HA. Adult hippocampal neurogenesis buffers stress responses and depressive behaviour. Nature. 2011;476:458–461. doi: 10.1038/nature10287. [DOI] [PMC free article] [PubMed] [Google Scholar]
- Song J, Christian KM, Ming GL, Song H (2012) Modification of hippocampal circuitry by adult neurogenesis. Dev Neurobiol 72:1032-1043 [DOI] [PMC free article] [PubMed]
- Taupin P. BrdU immunohistochemistry for studying adult neurogenesis: paradigms, pitfalls, limitations, and validation. Brain Res Rev. 2007;53:198–214. doi: 10.1016/j.brainresrev.2006.08.002. [DOI] [PubMed] [Google Scholar]
- Tillu DV, Melemedjian OK, Asiedu MN, Qu N, De Felice M, Dussor G, Price TJ. Resveratrol engages AMPK to attenuate ERK and mTOR signaling in sensory neurons and inhibits incision-induced acute and chronic pain. Mol Pain. 2012;8:5. doi: 10.1186/1744-8069-8-5. [DOI] [PMC free article] [PubMed] [Google Scholar]
- Urbanska M, Gozdz A, Swiech LJ, Jaworski J. Mammalian target of rapamycin complex 1 (mTORC1) and 2 (mTORC2) control the dendritic arbor morphology of hippocampal neurons. J Biol Chem. 2012;287:30240–30256. doi: 10.1074/jbc.M112.374405. [DOI] [PMC free article] [PubMed] [Google Scholar]
- van Praag H, Kempermann G, Gage FH. Neural consequences of environmental enrichment. Nat Rev Neurosci. 2000;1:191–198. doi: 10.1038/35044558. [DOI] [PubMed] [Google Scholar]
- van Praag H, Shubert T, Zhao C, Gage FH. Exercise enhances learning and hippocampal neurogenesis in aged mice. J Neurosci. 2005;25:8680–8685. doi: 10.1523/JNEUROSCI.1731-05.2005. [DOI] [PMC free article] [PubMed] [Google Scholar]
- Wang J, Gallagher D, DeVito LM, Cancino GI, Tsui D, He L, Keller GM, Frankland PW, Kaplan DR, Miller FD. Metformin activates an atypical PKC-CBP pathway to promote neurogenesis and enhance spatial memory formation. Cell Stem Cell. 2012;11:23–35. doi: 10.1016/j.stem.2012.03.016. [DOI] [PubMed] [Google Scholar]
- Wang JW, David DJ, Monckton JE, Battaglia F, Hen R. Chronic fluoxetine stimulates maturation and synaptic plasticity of adult-born hippocampal granule cells. J Neurosci. 2008;28:1374–1384. doi: 10.1523/JNEUROSCI.3632-07.2008. [DOI] [PMC free article] [PubMed] [Google Scholar]
- Wilkinson JE, Burmeister L, Brooks SV, Chan CC, Friedline S, Harrison DE, Hejtmancik JF, Nadon N, Strong R, Wood LK, Woodward MA, Miller RA. Rapamycin slows aging in mice. Aging Cell. 2012;11:675–682. doi: 10.1111/j.1474-9726.2012.00832.x. [DOI] [PMC free article] [PubMed] [Google Scholar]
- Ye P, Popken GJ, Kemper A, McCarthy K, Popko B, D'Ercole AJ. Astrocyte-specific overexpression of insulin-like growth factor-I promotes brain overgrowth and glial fibrillary acidic protein expression. J Neurosci Res. 2004;78:472–484. doi: 10.1002/jnr.20288. [DOI] [PubMed] [Google Scholar]
- Yu Y, Yoon SO, Poulogiannis G, Yang Q, Ma XM, Villen J, Kubica N, Hoffman GR, Cantley LC, Gygi SP, Blenis J. Phosphoproteomic analysis identifies Grb10 as an mTORC1 substrate that negatively regulates insulin signaling. Science. 2011;332:1322–1326. doi: 10.1126/science.1199484. [DOI] [PMC free article] [PubMed] [Google Scholar]
- Zakikhani M, Blouin MJ, Piura E, Pollak MN. Metformin and rapamycin have distinct effects on the AKT pathway and proliferation in breast cancer cells. Breast Cancer Res Treat. 2010;123:271–279. doi: 10.1007/s10549-010-0763-9. [DOI] [PubMed] [Google Scholar]
- Zhou J, Blundell J, Ogawa S, Kwon CH, Zhang W, Sinton C, Powell CM, Parada LF. Pharmacological inhibition of mTORC1 suppresses anatomical, cellular, and behavioral abnormalities in neural-specific Pten knock-out mice. J Neurosci. 2009;29:1773–1783. doi: 10.1523/JNEUROSCI.5685-08.2009. [DOI] [PMC free article] [PubMed] [Google Scholar]
Associated Data
This section collects any data citations, data availability statements, or supplementary materials included in this article.
Supplementary Materials
(DOC 96.5 kb)
Chronic rapamycin, but not metformin, treatment reduces neural progenitor numbers in the SVZ region of the adult mammalian brain. Ki67 staining in the SVZ of control and treated mice. Scale bar = 100 μm. Arrow points to Ki67+ cells. Data are presented as representative images. More than or equal to five mice were included per group (PDF 357 kb)
Chronic rapamycin treatment, but not metformin, reduces neuroblasts and/or immature neuron numbers. DCX (green) and DAPI (blue), as detected by immunofluorescence, in the SVZ of control, rapamycin, and metformin-treated mice. Scale bar = 50 μm. Data are presented as representative images. More than or equal to five mice were included per group (PDF 75 kb)