Abstract
Previous studies reported that the polycomb group gene Bmi-1 is downregulated in the aging brain. The aim of this study was to investigate whether decreased Bmi-1 expression accelerates brain aging by analyzing the brain phenotype of adult Bmi-1 heterozygous knockout (Bmi-1+/−) mice. An 8-month-old Bmi-1+/− brains demonstrated mild oxidative stress, revealed by significant increases in hydroxy radical and nitrotyrosine, and nonsignificant increases in reactive oxygen species and malonaldehyde compared with the wild-type littermates. Bmi-1+/− hippocampus had high apoptotic percentage and lipofuscin deposition in pyramidal neurons associated with upregulation of cyclin-dependent kinase inhibitors p19, p27, and p53 and downregulation of anti-apoptotic protein Bcl-2. Mild activation of astrocytes was also observed in Bmi-1+/− hippocampus. Furthermore, Bmi-1+/− mice showed mild spatial memory impairment in the Morris Water Maze test. These results demonstrate that heterozygous Bmi-1 gene knockout causes an early onset of age-related brain changes, suggesting that Bmi-1 has a role in regulating brain aging.
Electronic supplementary material
The online version of this article (doi:10.1007/s11357-013-9552-9) contains supplementary material, which is available to authorized users.
Keywords: Bmi-1, Brain aging, Reactive oxygen species, Reactive gliosis
Introduction
Aging leads to structural, functional, and metabolic deterioration within many organs and systems. Brain aging plays a leading role in the aging process since the central nervous system is responsible for regulating peripheral organ functions. In this regard, finding therapeutic targets for brain aging not only helps to protect brain functions, but also is conducive to improving the health status of the whole body, thus slowing the aging process (Bishop et al. 2010).
Bmi-1, a member of polycomb family of transcriptional repressors, has been implicated in controlling cell senescence by repression of p19Arf/MDM2/p53 pathway (Jacobs et al. 1999; Park et al. 2004; Molofsky et al. 2005). Recent studies have revealed that Bmi-1 has a role in regulating intracellular production of reactive oxygen species (ROS) and antioxidant defenses in various cells (Chatoo et al. 2009; Liu et al. 2009; Rizo et al. 2009; Venkataraman et al. 2010; Abdouh et al. 2012; Nakamura et al. 2012). Thus, as a common target of the cell cycle arrest and oxidative stress, Bmi-1 may play a key role in the aging process. Bmi-1 gene knockout (Bmi-1−/−) in mice results in growth retardation and a premature aging-like phenotype, often leading to death before weaning (van der Lugt et al. 1994; Leung et al. 2004). Heterozygous Bmi-1 gene knockout (Bmi-1+/−) mice exhibit an early aging-like phenotype characterized by hair loss, lens cataracts, reduced locomotor activity, and decreased lifespan by 35 % compared to wild-type (Bmi-1+/+) mice (Chatoo et al. 2009).
In the central nervous system, Bmi-1 is expressed in various types of brain cells including neural stem cells, neurons, and astrocytes, indicating its role in brain development and maintenance (Leung et al. 2004; Zencak et al. 2005; Chatoo et al. 2009). Our recent study reported that neurodegenerative-like changes such as neuronal apoptosis, synaptic loss, axonal demyelination, and reactive gliosis occur in premature Bmi-1−/− mice (Cao et al. 2012). Moreover, it has been shown that Bmi-1 is downregulated in aged human and mouse brains (Abdouh et al. 2012), suggesting that Bmi-1 is directly involved in the brain aging. However, the exact contribution of decreased Bmi-1 expression to the brain aging process remains unknown.
To address this issue, we examined various brain phenotypes including ROS levels, redox states, and hippocampus-related structures and cognitive functions of an 8-month-old Bmi-1+/− mice using biochemistry, immunohistochemistry, electron microscopy, and behavioral analyses. The results show that reduced Bmi-1 expression accelerates brain aging process, indicating that Bmi-1 is a potential therapeutic target for brain aging.
Materials and methods
Mice and genotyping
Bmi-1+/− and Bmi-1+/+ mice on a C57BL/6 J background were generated as described previously (Zhang et al. 2010). The male mice were selected for this study and housed for 8 months in ventilated microisolator-style caging with ad libitum access to water and food on a 12:12 light/dark cycle. The overall health including body weight, hair, and locomotor activity was examined monthly. All protocols of animal experiments were conducted in accordance with international standards on animal welfare and the guidelines of the Institute for Laboratory Animal Research of Nanjing Medical University. All efforts were made to minimize animal suffering and to reduce the number of animals used.
Measurement of oxidative/antioxidative parameters in brain homogenates
Mice were terminated by decapitation. Brains were quickly dissected out and homogenized in cold medium. The homogenate (10 %) was centrifuged at 4,000×g at 4 °C for 10 min and the supernatant was used for biochemical analysis. Protein contents were determined according to the Lowry method (Lowry et al. 1951). Commercial kits (Nanjing Jiancheng Bioengineering Institute, China) were used to detect hydroxyl radical, malondialdehyde (MDA) levels, reduced glutathione (GSH) levels, total antioxidative capabilities (T-AOC), and total superoxide dismutase (T-SOD) activities in mouse brain. The detailed methods have been described in our previously published report (Lei et al. 2008).
Determination of intracellular ROS in brain homogenates
ROS were detected by flow cytometric detection of DCFDA fluorescence (Herrera-Mundo and Sitges 2010; Lugo-Huitrón et al. 2011). Whole brain homogenates (500 μL) were preincubated in 2 % bovine serum albumin with or without 1 μM H2O2 at 37 °C for 30 min, then incubated with 50 μM DCFDA (Invitrogen Carlsbad, CA, USA) in a shaker at 37 °C for 30 min. At the end of the incubation process, the cells were washed with phosphate buffered saline (PBS), followed immediately by flow cytometry analysis using BD FACS Calibur (BD Biosciences, San Jose, CA, USA). The fluorescence of negative control was detected on untreated loaded with dye cells maintained in PBS only. Geometric mean was used to calculate the total intensity of DCFDA fluorescence. Results were expressed as a ratio of intracellular ROS levels in Bmi-1+/− brain cells under basal conditions.
Preparation of brain sections
The mice were anesthetized with sodium pentobarbital and transcardially perfused with 0.9 % saline, followed by 4 % paraformaldehyde (for immunohistochemistry) or 1 % paraformaldehyde plus 1 % glutaraldehyde (for conventional electron microscopy) in phosphate buffer (0.1 M, pH 7.4). The brains were dissected and postfixed overnight at 4 °C. For immunohistochemistry, brain tissues were dehydrated in a series of graded ethanol solutions and embedded in paraffin. The serial sagittal sections of the whole brain, or coronal sections of the hippocampus, were cut to thickness of 5 μm. For electron microscopy, 80 μm hippocampus cross-sections were sliced with a vibratome. The CA1 pyramidal cell layer was trimmed, dehydrated, and embedded in Epon 812. Ultrathin sections of 70 nm were obtained, counterstained on copper grids with both uranyl acetate and lead citrate, and examined with a Jeol 1200EX electron microscope (Nippon Denshi, Tokyo, Japan).
Immunohistochemistry
The protocols for immunohistochemistry have previously been described in detail (Hua et al. 2007). Briefly, after deparaffinization and rehydration, tissue sections were incubated with mouse monoclonal anti-Bmi-1 antibody (1:500, Mippore, Billerica, MA, USA), or mouse monoclonal antiglial fibrillary acidic protein (GFAP) antibody (1:1500, Sigma-Aldrich, Saint Louis, MO, USA) at 4 °C overnight. After rinsing in PBS, the sections were incubated with biotinylated goat anti-mouse or rabbit IgG (1:200) for 1 h at room temperature and visualized using Elite ABC Kit (Vector, Burlingame, CA, USA).
TUNEL staining
Apoptosis of hippocampus neurons was detected by TUNEL assay using the In Situ Cell Death Detection Kit (Roche Diagnostics GmbH, Mannheim, Germany). Briefly, deparaffinized sections were incubated with 20 μg/ml proteinase K for 10 min at room temperature, followed by incubation in a TUNEL reaction mixture containing fluorescein-terminal deoxynucleotidyl transferase and nucleotide mixture in reaction buffer for 60 min at 37 °C. After rinsing in PBS and counterstaining with Hoechst 33342, the sections were examined by a digital microscope (Leica Microsystems, Wetzlar, Germany).
Western blotting
Proteins were extracted from the hippocampus and quantified with a kit (Bio-Rad, Mississauga, Ontario, Canada). Ten micrograms protein samples were fractionated by SDS-PAGE and transferred to nitrocellulose membranes. The membranes were incubated overnight with a mouse monoclonal antibody against Bmi-1 (1:1,000, Millipore), nitrotyrosine (NTS; 1:1,000, Millipore), Bcl-2 (1:1,000, Sigma), p27 (1:1,000, Sigma), p53 (1:1,000, Santa Cruz BioTech, Santa Cruz, CA, USA) or β-tubulin (1:2,000, Santa Cruz), or a rabbit polyclonal antibody against either peroxiredoxin II (Prdx II; 1:500, Santa Cruz) or p19 (1:1,000, Santa Cruz). After rinsing in TBS, the membranes were incubated with goat anti-rabbit or mouse IgG-HRP (1:2,000, Vector) for 1 h at room temperature. The immunocomplexes were visualized using the ECL detection kit (Amersham Pharmacia Biotech, Canada). Membranes were scanned and analyzed using an Omega 16ic Chemiluminescence Imaging System (Ultra-Lum, Claremont, CA, USA). β-tubulin was used as an internal control for protein loading and transfer efficiency.
Quantitative analysis
The hippocampal CA1 area was selected to quantitatively analyze neuronal apoptosis and glial activation. The CA1 pyramidal layer is clearly identified by four to five layers of tightly packed neurons in the superior medial part of the hippocampal formation and its lateral margin is defined by the narrow and loosely organized CA2 zone (de Freitas et al. 2004; Franklin and Paxinos 2008). TUNEL-positive apoptotic neurons were identified by the presence of green fluorescence in the nucleus. The percentage of apoptotic neurons in the CA1 pyramidal cell layer was calculated. Activated astrocytes were characterized by hypertrophy of the soma and increased expression of GFAP in the processes, respectively. Resting astrocytes presented a small cell body with thin highly branched processes (VanGuilder et al. 2011). The percentage of activated astrocytes within the CA1 area was calculated. Four individual sections per mouse were averaged to provide a single value for each mouse.
For lipofuscin granule volume analysis, 16 CA1 pyramidal neurons, presenting with a complete nucleus and nucleolus, per animal were randomly selected and photographed at a magnification of 8,000×g allowing for the identification of lipofuscin granules within the cytoplasm. Using a grid replica (0.25 μm2 per one grille), the number of points that fell on lipofuscin granules were counted within each pyramidal neuron. The volume of lipofuscin granules was calculated according to Pappus’s theorem (Mironov and Mironov 1998; Assunção et al. 2011).
Statistical analysis
All statistical analyses were performed using SPSS software, version 16.0 (SPSS Inc., USA). Group differences were analyzed with Student’s t tests. Data are expressed as mean ± SEM. P value less than 0.05 was considered statistically significant.
Results
Bmi-1 protein expression in Bmi-1+/− brain
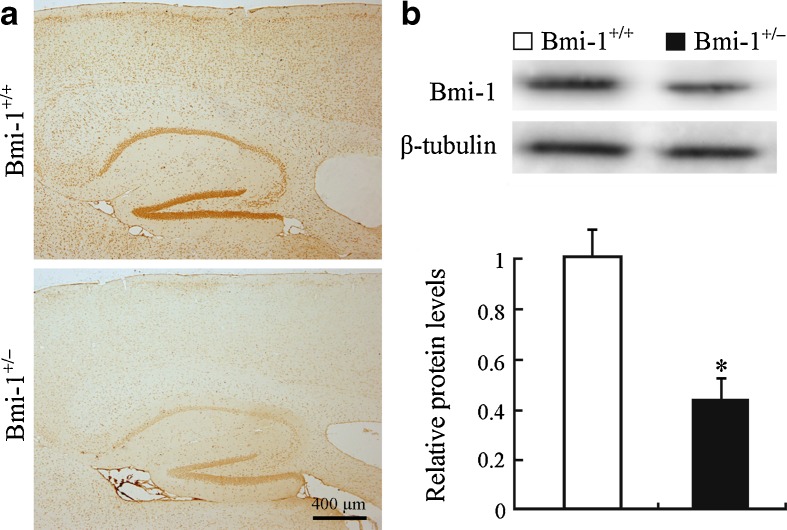
The effect of heterozygous knockout of the Bmi-1 gene on Bmi-1 protein expression was examined first. Bmi-1+/− mice showed significant decreases in immunoreactivity of Bmi-1 throughout the brain regions including hippocampus and cerebral cortex, compared with Bmi-1+/+ mice (Fig. 1a). Consistently, Western blot analysis showed that Bmi-1 protein levels in Bmi-1+/− hippocampus were about half that in the Bmi-1+/+ control (0.46 ± 0.08 vs. 1 ± 0.11, P = 0.0004; Fig. 1b).
Fig. 1.
Expression of Bmi-1 in the Bmi-1+/− brain. a A representative sagittal brain section showing that immunoreactive intensity of Bmi-1 was weak in the cerebral cortex and hippocampus of an 8-month-old Bmi-1+/− mice, compared with Bmi-1+/+ mice. b Western blotting and densitometric analysis revealed that Bmi-1 expression levels in the hippocampal homogenates of Bmi-1+/− mice were about half of that from Bmi-1+/+ controls. Data represent mean ± SEM from four mice per group performed in triplicate. *P < 0.05 vs. Bmi-1+/+ mice
ROS levels in Bmi-1+/− brain
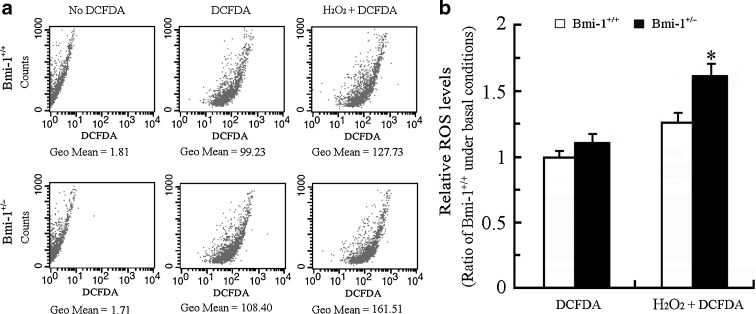
Accumulated intracellular ROS causes oxidative stress damage, which is generally an accepted molecular mechanism of cell senescence (Sohal and Orr 2012). Recent studies demonstrated that intracellular ROS levels are elevated in various cell types, such as bone marrow cells, splenocytes, thymocytes, hematopoietic stem cells, and neurons obtained from Bmi-1−/− mice (Chatoo et al. 2009; Liu et al. 2009; Abdouh et al. 2012). Targeting Bmi-1 by MicroRNA 128a increases intracellular ROS levels, and thus promotes senescence in cultured medulloblastoma cancer cells (Venkataraman et al. 2010). We determined the effect of Bmi-1 insufficiency on intracellular ROS levels in brain cells by flow cytometric detection of DCFDA fluorescence. The intracellular ROS levels did not show a great difference between Bmi-1+/− and Bmi-1+/− brain cells under basal conditions (1.12 ± 0.05 vs. 1 ± 0.04; P = 0.1144), but increased more in Bmi-1+/− brain cells than wild-type in response to H2O2 stimulation (1.62 ± 0.07 vs. 1.27 ± 0.06; P = 0.0066; Fig. 2). These data suggest that Bmi-1 insufficiency leads to decreased ROS scavenging capability or increased ROS production during oxidative stress.
Fig. 2.
The intracellular ROS levels in Bmi-1+/− brain cells. a The representative results showing ROS levels assessed by DCFDA fluorescence in Bmi-1+/+ and Bmi-1+/− brain cells under basal conditions, or without DCFDA staining (negative control), or following addition of 1 μM H2O2 treatment for 10 min (positive control). Geometric mean (Geo Mean) was used to calculate the total intensity of fluorescence. b The intracellular ROS levels in Bmi-1+/− brain cells did not show a great difference compared with wild type under basal conditions, but dramatically increased in response to H2O2 stimulation. Data represent mean ± SEM from five mice per group performed in triplicate. *P < 0.05 vs. Bmi-1+/+ mice
Redox states in Bmi-1+/− brain
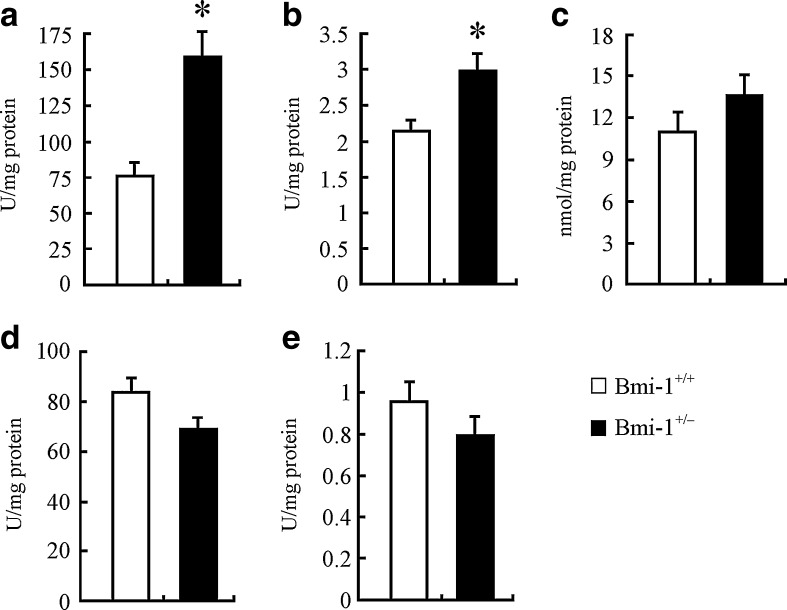
We examined the influence of mildly increased ROS on the redox states in Bmi-1+/− brain. The biochemical analyses showed that, compared to Bmi-1+/+ brain, Bmi-1+/− brain had significantly higher levels of the DNA oxidation index marker hydroxy radical (156.38 ± 16.57 vs. 74.77 ± 9.07 U/mg/protein; P = 0.005) and brain antioxidant GSH (2.99 ± 0.22 vs. 2.17 ± 0.16 U/mg/protein; P = 0.0229; Fig. 3a and b). In addition, MDA, a lipid peroxidation parameter, was slightly increased (13.79 ± 1.57 vs. 11.2 ± 0.95 U/mg/protein; P = 0.2031; Fig. 3c), while antioxidative parameters including T-SOD (69.46 ± 4.27 vs. 84.03 ± 5.69 U/mg/protein; P = 0.0866) and T-AOC (0.79 ± 0.09 vs. 0.96 ± 0.1 U/mg/protein; P = 0.2574) were mildly reduced in Bmi-1+/− brain (Fig. 3d and e).
Fig. 3.
Levels of oxidative/antioxidative parameters in Bmi-1+/− brain. a Bmi-1+/− brain demonstrated significantly higher hydroxy radical levels, compared to Bmi-1+/+ brain. b Reduced GSH levels were also significantly increased in Bmi-1+/− brain. c–f MDA was slightly increased (c), while T-SOD (e) and T-AOC (f) were mildly reduced in Bmi-1+/− brain. Data represent mean ± SEM from five mice per group performed in triplicate. *P < 0.05 vs. Bmi-1+/+ mice
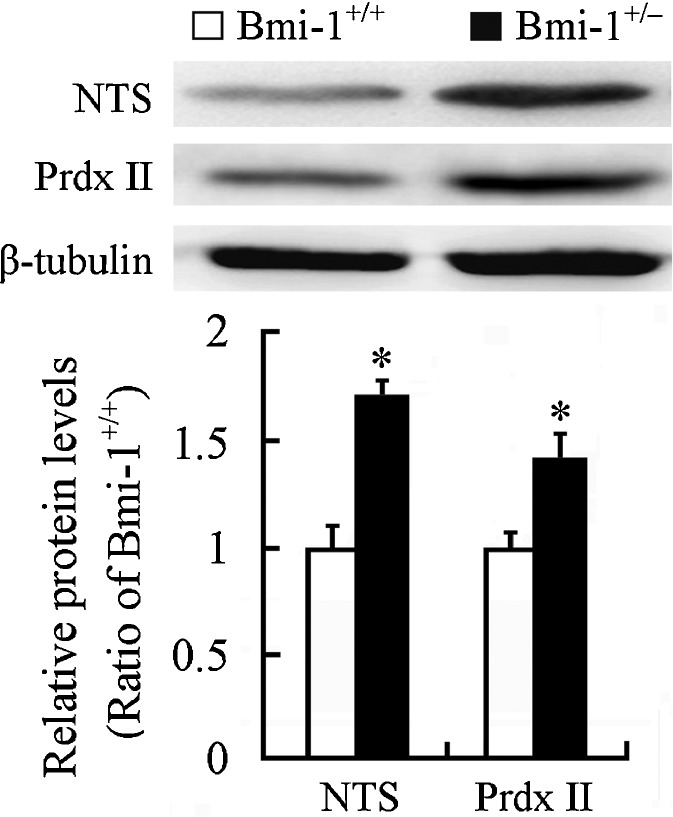
Western blot showed that expression level of NTS, an oxidative stress marker (Darwish et al. 2007), significantly increased in the Bmi-1+/− hippocampus (1.65 ± 0.05 vs. 1 ± 0.06; P = 0.0002). Interestingly, an antioxidant enzyme Prdx II was also upregulated compared with that in the Bmi-1+/+ hippocampus (1.42 ± 0.21 vs. 1 ± 0.1; P = 0.0014; Fig. 4). This finding is consistent with a previous study showing that Prdx II expression is increased in the aged hippocampus, which may contribute to against age-related oxidative damage (Kim et al. 2011). Together, these results indicate that slight increase in ROS levels caused by Bmi-1 insufficiency results in mild oxidative stress in adult brain.
Fig. 4.
Expression of oxidative/antioxidative proteins in the hippocampus of Bmi-1+/− mice. Western blotting and densitometric analysis revealed up-regulation of NTS and Prdx II in Bmi-1+/− hippocampus compared with Bmi-1+/+ control. Data represent mean ± SEM from four mice per group performed in triplicate. *P < 0.05 vs. Bmi-1+/+ mice
Pathological changes in Bmi-1+/− hippocampus
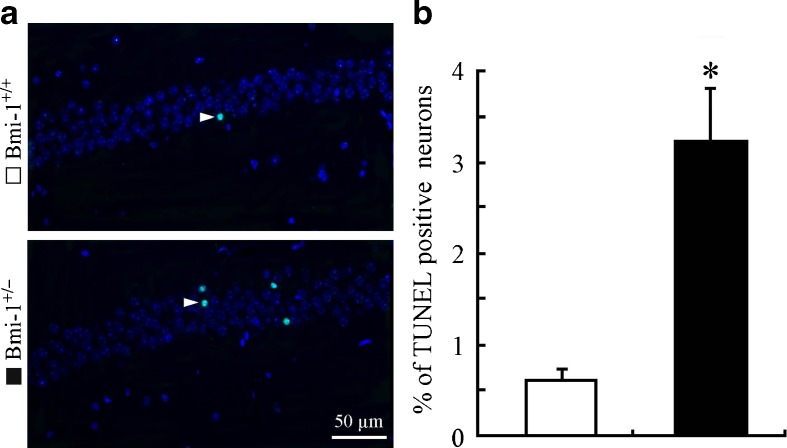
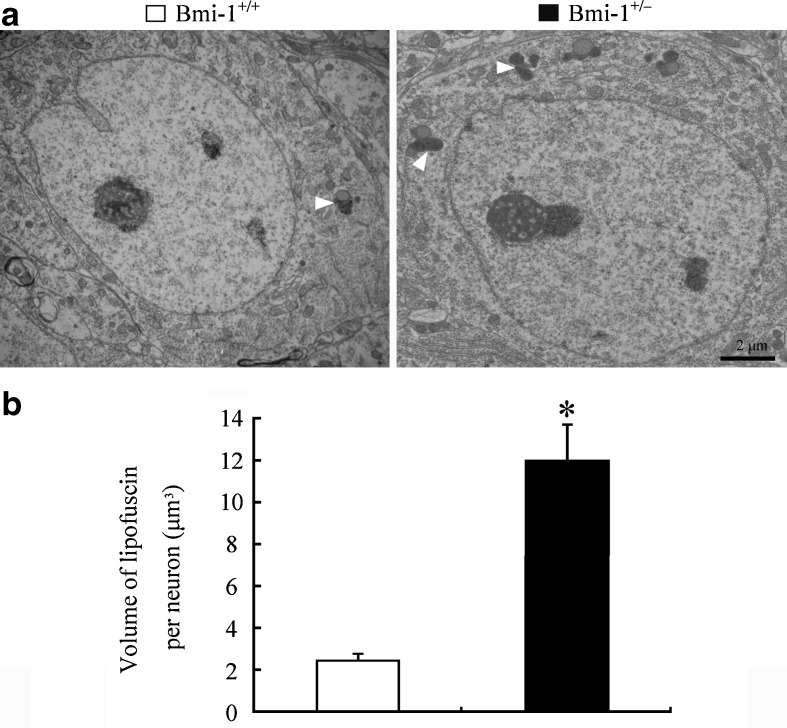
It is well known that hippocampal neurons are vulnerable to oxidative damage by ROS, displaying cellular apoptosis or senescence (Serrano and Klann 2004). We addressed the influence of the mild oxidative stress caused by Bmi-1 insufficiency on apoptosis of CA1 pyramidal cells which are responsible for excitatory synaptic transmission of the hippocampal circuitry (Burke and Barnes 2010). Bmi-1+/− mice showed an increased percentage of TUNEL positive apoptotic neurons in the CA1 pyramidal cell layer (3.24 ± 0. 56 vs. 0.62 ± 0.16 %; P = 0.001; Fig. 5a and b). Lipofuscin deposition and accumulation within the hippocampal neurons, a prominent and stable structural marker of cellular senescence (Terman and Brunk 2006; Assunção et al. 2011), was quantitatively analyzed to determine the influence of Bmi-1 insufficiency-induced brain oxidative stress. As expected, there were increases in volume of lipofuscin granules in the cytoplasm of CA1 pyramidal neurons of Bmi-1+/− mice, compared to Bmi-1+/+ littermates (11.94 ± 1.75 vs. 2.42 ± 0.31 μm3; P = 0.0007; Fig. 6a and b).
Fig. 5.
Apoptosis of neurons in the hippocampal CA1 region of Bmi-1+/− mice. a The representative micrographs showing TUNNEL positive apoptotic neurons (arrowheads) in the CA1 pyramidal layer of Bmi-1+/+ mice and Bmi-1+/− mice. b Quantitative analysis revealed a higher apoptotic percentage of CA1 pyramidal neurons in Bmi-1+/− mice than in Bmi-1+/+ controls. Data represent mean ± SEM from five mice per group. *P < 0.05 vs. Bmi-1+/+ mice
Fig. 6.
Accumulation of lipofuscin pigment within the hippocampal neurons of Bmi-1+/− mice. a Representative electron micrographs showing lipofuscin granules (arrowheads) in the somatic cytoplasm of hippocampal CA1 pyramidal neurons from Bmi-1+/+ mice and Bmi-1+/− mice. b Quantitative analysis revealed a higher volume of lipofuscin granules in the cytoplasm of Bmi-1+/− CA1 pyramidal neurons than Bmi-1+/− controls. Data represent mean ± SEM from four mice per group. *P < 0.05 vs. Bmi-1+/+ mice
Activation of astrocytes in Bmi-1+/− hippocampus
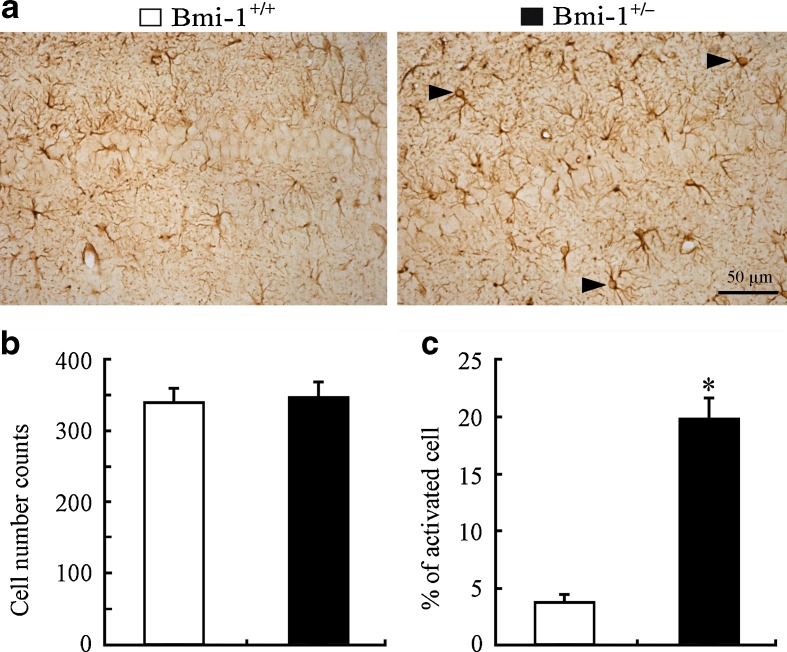
Apart from neuronal apoptosis and lipofuscin deposition, mild reactive astrogliosis, demonstrating increased glial activation rather than proliferation, is also one of pathological hallmarks of brain aging (Middeldorp and Hol 2011). Therefore, we observed the activation of GFAP-positive astrocytes in the Bmi-1+/− hippocampus. The activated astrocytes exhibiting hypertrophic cell bodies and intensely stained processes were observed in the Bmi-1+/− hippocampus (Fig. 7a). In contrast, Bmi-1+/+ hippocampus astrocytes existed in a normal “resting” state with small cell bodies and slim processes. Quantitative analyses of GFAP-positive astrocytes in the hippocampal CA1 area revealed no changes in the total numbers (351.38 ± 19.42 vs. 343.41 ± 17.33; P = 0.7103; Fig. 7b), but higher percentages of activated types in Bmi-1+/− mice compared to Bmi-1+/+ mice (19.84 ± 1.58 vs. 3.72 ± 0.41 %; P < 0.0001; Fig. 7c). These results demonstrated that mild reactive gliosis occurred in Bmi-1+/− hippocampus.
Fig. 7.
Astrocyte activation in the hippocampus of Bmi-1+/− mice. a The representative micrographs shows that GFAP-positive (+) activated astrocytes were frequently present in the hippocampal CA1 region of Bmi-1+/− mice but not Bmi-1+/+ mice. b, c Quantitative analysis revealed no significant increases in numbers of GFAP-positive (+) astrocytes, but a higher percentage of activated astrocytes in Bmi-1+/− mice when compared to Bmi-1+/+ controls. Data represent mean ± SEM from five mice per group. *P < 0.05 vs. Bmi-1+/+ mice
Altered expression of Bmi-1-related proteins in Bmi-1+/− hippocampus
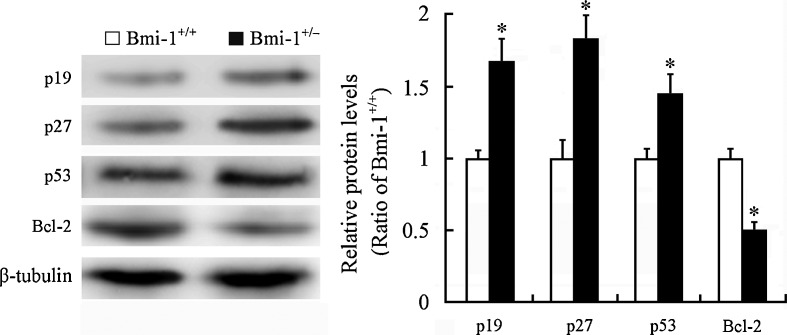
Bmi-1 has been shown to negatively regulate the p19Arf/MDM2/p53 senescence pathway (Jacobs et al. 1999; Park et al. 2004; Molofsky et al. 2005). The oncogene Bcl-2 is shown to suppress p53-mediated apoptosis (Zinkel et al. 2006). Western blotting revealed upregulation of p19 (1.67 ± 0.15 vs. 1 ± 0.07; P = 0.0068), p27 (1.77 ± 0.16 vs. 1 ± 0.08; P = 0.0046), and p53 (1.44 ± 0.13 vs. 1 ± 0.06; P = 0.0233) protein levels and downregulation of Bcl-2 expression (0.49 ± 0.05 vs. 1 ± 0.06; P = 0.0006) in the Bmi-1+/− hippocampus (Fig. 8). This may explain the molecular mechanism for a small proportion of hippocampal neurons undergoing apoptosis in Bmi-1+/− mice.
Fig. 8.
Expression of Bmi-1-associated proteins in the hippocampus of Bmi-1+/− mice. Western blotting and densitometric analysis revealed upregulation of p19, p27, and p53 and downregulation of Bcl-2 in Bmi-1+/− hippocampus compared with Bmi-1+/+ control. Data represent mean ± SEM from four mice per group performed in triplicate. *P < 0.05 vs. Bmi-1+/+ mice
We also investigated the influence of Bmi-1 insufficiency on spatial learning and memory capabilities of mice by using Morris water maze testing. The results suggest that Bmi-1+/− mice have mild spatial memory impairment which is a hallmark of the early stages of brain aging (for the detailed methods and results, please see Electronic supplementary material).
In addition, the overall health examine per month revealed that there were no obvious differences in body weight, hair and locomotor activity between Bmi-1+/− mice and their WT littermates (data not shown). This is consistent with the previous study showing that Bmi-1+/− mice does not exhibit high death rate and overall aging phenotypes, such as hair loss, lens cataracts, and reduced locomotor activity, until 15 months of age (Chatoo et al. 2009).
Discussion
The polycomb group gene Bmi-1 is implicated in both cell cycle regulation and oxidative stress (Molofsky et al. 2005; Liu et al. 2009). Bmi-1 deficiency has been shown to cause premature aging and neurodegeneration (van der Lugt et al. 1994; Leung et al. 2004; Cao et al. 2012). The present study has demonstrated that partial deletion of the Bmi-1 gene causes an early onset of phenotypes associated with brain aging, including mild oxidative stress, neuronal apoptosis, lipofuscin deposition, glial cell activation, and spatial memory impairment. This finding demonstrates the key role of Bmi-1 in the brain aging process. Moreover, consistent with previous in vitro results (Chatoo et al. 2009), the present work provides in vivo evidence that decreased Bmi-1 expression causes upregulation of cyclin-dependent kinase inhibitors p19, p27, and p53 and downregulation of anti-apoptotic protein Bcl-2, in turn resulting in hippocampal neuronal apoptosis. Our results also suggest that some compensatory mechanisms, including increased glutathione synthesis, may partially attenuate oxidative damage caused by Bmi-1 insufficiency. Together, these results strongly suggest that Bmi-1 is essential for development and long-term maintenance of brain structure and function.
Oxidative stress plays a key role in the onset and progression of aging and degenerative diseases (Andersen 2004). Excessive ROS can cause oxidative damage to lipids, proteins, and DNA, thus accelerating cell senescence (Barja 2004). Several in vitro studies have revealed a close correlation between Bmi-1 expression and intracellular ROS levels (Li et al. 2008; Chatoo et al. 2009; Venkataraman et al. 2010; Dong et al. 2011; Abdouh et al. 2012; Nakamura et al. 2012). For example, Bmi-1 deficiency in cultured cortical neurons results in abnormally high intracellular ROS and increased sensitivity to oxidative damage induced by 3-nitroproprionic acid (3-NP), an inhibitor of complex II of the mitochondria respiratory. Conversely, Bmi-1 overexpression in cortical neurons dramatically reduces the intracellular ROS in the baseline state and 3-NP-induced oxidative state (Abdouh et al. 2012). However, the current results show that partial deletion of the Bmi-1 gene does not significantly increase ROS levels in adult brain cells, suggesting a relatively complex influence of Bmi-1 expression on ROS accumulation in vivo. This presumption is based on the results that the levels of reduced GSH and Prdx II significantly increases in Bmi-1+/− brain when compared to the wild-type control. GSH, a naturally occurring tripeptide, plays an important role in protection against oxidative stress because it not only reacts directly with some ROS, but also acts as a substrate in the GSH peroxidase catalyzed detoxification of H202 and organic peroxides (Lushchak 2012). Prdxs are a family of antioxidant enzymes that are implicated to act as free radical scavengers (Wood et al. 2003). Prx II is shown to be distinctly expressed by neurons and upregulated in the hippocampus with age (Jin et al. 2005; Kim et al. 2011). Deficiency of Prx II exacerbates age-related mitochondrial oxidative damage and synaptic plasticity impairment (Kim et al. 2011). The above evidence suggests that increased GSH and Prx II may be responsible for partially ameliorating ROS accumulation and oxidative stress in Bmi-1+/− brain.
In addition, there were nonsignificant increases in the lipid peroxidation parameter MDA, but prominent increases in hydroxy radicals, a DNA oxidation index, in an 8-month-old Bmi-1+/− brain. Consistent with these results, our recent studies on Bmi-1−/− brains showed that both MDA and hydroxy radical levels increase at 4 weeks after the birth, but only hydroxy radical levels are increased at 2 weeks, as compared to Bmi-1+/+ controls (Cao et al. 2012). These results suggest that DNA is more vulnerable to oxidative damage than lipids, leading to cell senescence or apoptosis due to reduced cell self-repairing ability (Chen et al. 2007).
The volume of lipofuscin granules in the cytoplasm of CA1 pyramidal neurons was higher in Bmi-1+/− mice, although MDA in the whole brain was not significantly increased. This is consistent with the notion that the hippocampus is particularly vulnerable to oxidative stress during the aging process (Serrano and Klann 2004). Moreover, the pathological analysis showed that only about 3 % of pyramidal neurons underwent apoptosis but about 20 % astrocytes were activated in the hippocampus CA1 region of 8-month-old Bmi-1+/− mice (Fig. 6). This corresponds with earlier studies showing that a prominent feature of aged brain is glial cell activation instead of widespread neuronal loss (Mrak et al. 1997).
It is now clear that astrocytes are responsible for maintaining homeostasis of the central nervous system (Ransom and Ransom 2012). Astrocytes contain abundant antioxidases, including GSH peroxidase, SOD, and peroxidase and produce many antioxidants, such as GSH and active vitamin E, playing an essential role in preventing the accumulation of ROS and repairing oxidative damage (Wilson 1997). Mild to moderate reactive astrocytes are able to increase the productions of GSH and neurotrophic factors, and promote the remodeling of neural circuits (Colangelo et al. 2012). Therefore, mild activation of astrocytes may attenuate Bmi-1 insufficiency-caused oxidative damage in the adult brain.
In summary, the present results have demonstrated that Bmi-1 gene heterozygous knockout contributes to an early onset of brain aging. Combined with the previous phenotypic results (Chatoo et al. 2009), the data suggest that Bmi-1+/− mice may serve as a useful model for exploring the mechanisms of age-mediated oxidative damage in the brain. In order to determine the influence of long-term downregulation of Bmi-1 on brain structure and function, phenotyping of aged Bmi-1+/− mice will be necessary in future studies. The results will potentially shed light on protection against brain aging and age-related neurodegenerative diseases by targeting the endogenous expression of Bmi-1.
Electronic supplementary material
PDF 170 kb
Acknowledgments
We would like to thank Professor Anton Berns in the Netherlands Cancer Institute for providing Bmi1+/− mice. This work was supported by grants from the National Natural Science Foundation of China (nos. 30971020 and 81271210 to M. Xiao, nos. 30830103 and 81230009 to D. Miao, and no. 30901578 to T. Wu).
Contributor Information
Dengshun Miao, Email: dsmiao@njmu.edu.cn.
Ming Xiao, Email: mingx@njmu.edu.cn.
References
- Abdouh M, Chatoo W, El Hajjar J, David J, Ferreira J, Bernier G. Bmi1 is down-regulated in the aging brain and displays antioxidant and protective activities in neurons. PLoS One. 2012;7(2):e31870. doi: 10.1371/journal.pone.0031870. [DOI] [PMC free article] [PubMed] [Google Scholar]
- Andersen JK. Oxidative stress in neurodegeneration: cause or consequence? Nat Med. 2004;10:S18–S25. doi: 10.1038/nrn1434. [DOI] [PubMed] [Google Scholar]
- Assunção M, Santos-Marques MJ, Carvalho F, Lukoyanov NV, Andrade JP. Chronic green tea consumption prevents age-related changes in rat hippocampal formation. Neurobiol Aging. 2011;32(4):707–717. doi: 10.1016/j.neurobiolaging.2009.03.016. [DOI] [PubMed] [Google Scholar]
- Barja G. Free radicals and aging. Trends Neurosci. 2004;27(10):595–600. doi: 10.1016/j.tins.2004.07.005. [DOI] [PubMed] [Google Scholar]
- Bishop NA, Lu T, Yankner BA. Neural mechanisms of ageing and cognitive decline. Nature. 2010;464(7288):529–535. doi: 10.1038/nature08983. [DOI] [PMC free article] [PubMed] [Google Scholar]
- Burke SN, Barnes CA. Senescent synapses and hippocampal circuit dynamics. Trends Neurosci. 2010;33(3):153–161. doi: 10.1016/j.tins.2009.12.003. [DOI] [PMC free article] [PubMed] [Google Scholar]
- Cao G, Gu M, Zhu M, Gao J, Yin Y, Marshall C, Xiao M, Ding J, Miao D. Bmi-1 absence causes premature brain degeneration. PLoS One. 2012;7(2):e32015. doi: 10.1371/journal.pone.0032015. [DOI] [PMC free article] [PubMed] [Google Scholar]
- Chatoo W, Abdouh M, David J, Champagne MP, Ferreira J, Rodier F, Bernier G. The polycomb group gene Bmi1 regulates antioxidant defenses in neurons by repressing p53 pro-oxidant activity. J Neurosci. 2009;29(2):529–542. doi: 10.1523/JNEUROSCI.5303-08.2009. [DOI] [PMC free article] [PubMed] [Google Scholar]
- Chen JH, Hales CN, Ozanne SE. DNA damage, cellular senescence and organismal ageing: causal or correlative? Nucleic Acids Res. 2007;35(22):7417–7428. doi: 10.1093/nar/gkm681. [DOI] [PMC free article] [PubMed] [Google Scholar]
- Colangelo AM, Cirillo G, Lavitrano ML, Alberghina L, Papa M. Targeting reactive astrogliosis by novel biotechnological strategies. Biotechnol Adv. 2012;30(1):261–271. doi: 10.1016/j.biotechadv.2011.06.016. [DOI] [PubMed] [Google Scholar]
- Darwish RS, Amiridze N, Aarabi B. Nitrotyrosine as an oxidative stress marker: evidence for involvement in neurologic outcome in human traumatic brain injury. J Trauma. 2007;63(2):439–442. doi: 10.1097/TA.0b013e318069178a. [DOI] [PubMed] [Google Scholar]
- de Freitas V, da Silva Porto P, Assunção M, Cadete-Leite A, Andrade JP, Paula-Barbosa MM. Flavonoids from grape seeds prevent increased alcohol-induced neuronal lipofuscin formation. Alcohol Alcohol. 2004;39(4):303–311. doi: 10.1093/alcalc/agh069. [DOI] [PubMed] [Google Scholar]
- Dong Q, Oh JE, Chen W, Kim R, Kim RH, Shin KH, McBride WH, Park NH, Kang MK. Radioprotective effects of Bmi-1 involve epigenetic silencing of oxidase genes and enhanced DNA repair in normal human keratinocytes. J Invest Dermatol. 2011;131(6):1216–1225. doi: 10.1038/jid.2011.11. [DOI] [PubMed] [Google Scholar]
- Franklin KBJ, Paxinos G. The mouse brain in stereotaxic coordinates. 2. Amsterdam: Elsevier; 2008. [Google Scholar]
- Herrera-Mundo N, Sitges M. Mechanisms underlying striatal vulnerability to 3-nitropropionic acid. J Neurochem. 2010;114(2):597–605. doi: 10.1111/j.1471-4159.2010.06789.x. [DOI] [PubMed] [Google Scholar]
- Hua X, Lei M, Zhang Y, Ding J, Han Q, Hu G, Xiao M. Long-term d-galactose injection combined with ovariectomy serves as a new rodent model for Alzheimer’s disease. Life Sci. 2007;80(20):1897–1905. doi: 10.1016/j.lfs.2007.02.030. [DOI] [PubMed] [Google Scholar]
- Jacobs JJ, Kieboom K, Marino S, DePinho RA, van Lohuizen M. The oncogene and polycomb-group gene bmi-1 regulates cell proliferation and senescence through the ink4a locus. Nature. 1999;397(6715):164–168. doi: 10.1038/16476. [DOI] [PubMed] [Google Scholar]
- Jin MH, Lee YH, Kim JM, Sun HN, Moon EY, Shong MH, Kim SU, Lee SH, Lee TH, Yu DY, Lee DS. Characterization of neural cell types expressing peroxiredoxins in mouse brain. Neurosci Lett. 2005;381(3):252–257. doi: 10.1016/j.neulet.2005.02.048. [DOI] [PubMed] [Google Scholar]
- Kim SU, Jin MH, Kim YS, Lee SH, Cho YS, Cho KJ, Lee KS, Kim YI, Kim GW, Kim JM, Lee TH, Lee YH, Shong M, Kim HC, Chang KT, Yu DY, Lee DS. Peroxiredoxin II preserves cognitive function against age-linked hippocampal oxidative damage. Neurobiol Aging. 2011;32(6):1054–1068. doi: 10.1016/j.neurobiolaging.2009.05.017. [DOI] [PubMed] [Google Scholar]
- Lei M, Hua X, Xiao M, Ding J, Han Q, Hu G. Impairments of astrocytes are involved in the d-galactose-induced brain aging. Biochem Biophys Res Commun. 2008;369(4):1082–1087. doi: 10.1016/j.bbrc.2008.02.151. [DOI] [PubMed] [Google Scholar]
- Leung C, Lingbeek M, Shakhova O, Liu J, Tanger E, Saremaslani P, Van Lohuizen M, Marino S. Bmi1 is essential for cerebellar development and is overexpressed in human medulloblastomas. Nature. 2004;428(6980):337–341. doi: 10.1038/nature02385. [DOI] [PubMed] [Google Scholar]
- Li SK, Smith DK, Leung WY, Cheung AM, Lam EW, Dimri GP, Yao KM. FoxM1c counteracts oxidative stress-induced senescence and stimulates Bmi-1 expression. J Biol Chem. 2008;283(24):16545–16553. doi: 10.1074/jbc.M709604200. [DOI] [PMC free article] [PubMed] [Google Scholar]
- Liu J, Cao L, Chen J, Song S, Lee IH, Quijano C, Liu H, Keyvanfar K, Chen H, Cao LY, Ahn BH, Kumar NG, Rovira II, Xu XL, van Lohuizen M, Motoyama N, Deng CX, Finkel T. Bmi1 regulates mitochondrial function and the DNA damage response pathway. Nature. 2009;459(7245):387–392. doi: 10.1038/nature08040. [DOI] [PMC free article] [PubMed] [Google Scholar]
- Lugo-Huitrón R, Blanco-Ayala T, Ugalde-Muñiz P, Carrillo-Mora P, Pedraza-Chaverrí J, Silva-Adaya D, Maldonado PD, Torres I, Pinzón E, Ortiz-Islas E, López T, García E, Pineda B, Torres-Ramos M, Santamaría A, La Cruz VP. On the antioxidant properties of kynurenic acid: free radical scavenging activity and inhibition of oxidative stress. Neurotoxicol Teratol. 2011;33(5):538–547. doi: 10.1016/j.ntt.2011.07.002. [DOI] [PubMed] [Google Scholar]
- Lowry OH, Rosebrogh NJ, FARR AL, Radell RJ. Protein measurement with the Folin phenol reagent. J Biol Chem. 1951;193(1):265–275. [PubMed] [Google Scholar]
- Lushchak VI. Glutathione homeostasis and functions: potential targets for medical interventions. J Amino Acids. 2012;2012:736837. doi: 10.1155/2012/736837. [DOI] [PMC free article] [PubMed] [Google Scholar]
- Mrak RE, Griffin ST, Graham DI. Aging-associated changes in human brain. J Neuropathol Exp Neurol. 1997;56(12):1269–1275. doi: 10.1097/00005072-199712000-00001. [DOI] [PubMed] [Google Scholar]
- Middeldorp J, Hol EM. GFAP in health and disease. Prog Neurobiol. 2011;93(3):421–443. doi: 10.1016/j.pneurobio.2011.01.005. [DOI] [PubMed] [Google Scholar]
- Mironov AA, Jr, Mironov AA. Estimation of subcellular organelle volume from ultrathin sections through centrioles with adiscretized version of the vertical rotator. J Microsc. 1998;192(Pt 1):29–36. doi: 10.1046/j.1365-2818.1998.00392.x. [DOI] [PubMed] [Google Scholar]
- Molofsky AV, He S, Bydon M, Morrison SJ, Pardal R. Bmi-1 promotes neural stem cell self-renewal and neural development but not mouse growth and survival by repressing the p16Ink4a and p19Arf senescence pathways. Genes Dev. 2005;19(12):1432–1437. doi: 10.1101/gad.1299505. [DOI] [PMC free article] [PubMed] [Google Scholar]
- Nakamura S, Oshima M, Yuan J, Saraya A, Miyagi S, Konuma T, Yamazaki S, Osawa M, Nakauchi H, Koseki H, Iwama A. Bmi1 confers resistance to oxidative stress on hematopoietic stem cells. PLoS One. 2012;7(5):e36209. doi: 10.1371/journal.pone.0036209. [DOI] [PMC free article] [PubMed] [Google Scholar]
- Park IK, Morrison SJ, Clarke MF. Bmi1, stem cells, and senescence regulation. J Clin Invest. 2004;113(2):175–179. doi: 10.1172/JCI20800. [DOI] [PMC free article] [PubMed] [Google Scholar]
- Ransom BR, Ransom CB. Astrocytes: multitalented stars of the central nervous system. Methods Mol Biol. 2012;814:3–7. doi: 10.1007/978-1-61779-452-0_1. [DOI] [PubMed] [Google Scholar]
- Rizo A, Olthof S, Han L, Vellenga E, de Haan G, Schuringa JJ. Repression of BMI1 in normal and leukemic human CD34(+) cells impairs self-renewal and induces apoptosis. Blood. 2009;114(8):1498–1505. doi: 10.1182/blood-2009-03-209734. [DOI] [PubMed] [Google Scholar]
- Serrano F, Klann E. Reactive oxygen species and synaptic plasticity in the aging hippocampus. Ageing Res Rev. 2004;3(4):431–443. doi: 10.1016/j.arr.2004.05.002. [DOI] [PubMed] [Google Scholar]
- Sohal RS, Orr WC. The redox stress hypothesis of aging. Free Radic Biol Med. 2012;52(3):539–555. doi: 10.1016/j.freeradbiomed.2011.10.445. [DOI] [PMC free article] [PubMed] [Google Scholar]
- Terman A, Brunk UT. Oxidative stress, accumulation of biological ‘garbage’, and aging. Antioxid Redox Signal. 2006;8(1–2):197–204. doi: 10.1089/ars.2006.8.197. [DOI] [PubMed] [Google Scholar]
- van der Lugt NM, Domen J, Linders K, van Roon M, Robanus-Maandag E, te Riele H, van der Valk M, Deschamps J, Sofroniew M, van Lohuizen M, Berns A. Posterior transformation, neurological abnormalities, and severe hematopoietic defects in mice with a targeted deletion of the bmi-1 proto-oncogene. Genes Dev. 1994;8(7):757–769. doi: 10.1101/gad.8.7.757. [DOI] [PubMed] [Google Scholar]
- VanGuilder HD, Bixler GV, Brucklacher RM, Farley JA, Yan H, Warrington JP, Sonntag WE, Freeman WM. Concurrent hippocampal induction of MHC II pathway components and glial activation with advanced aging is not correlated with cognitive impairment. J Neuroinflammation. 2011;8:138. doi: 10.1186/1742-2094-8-138. [DOI] [PMC free article] [PubMed] [Google Scholar]
- Venkataraman S, Alimova I, Fan R, Harris P, Foreman N, Vibhakar R. MicroRNA 128a increases intracellular ROS level by targeting Bmi-1 and inhibits medulloblastomacancer cell growth by promoting senescence. PLoS One. 2010;5(6):e10748. doi: 10.1371/journal.pone.0010748. [DOI] [PMC free article] [PubMed] [Google Scholar]
- Wilson JX. Antioxidant defense of the brain: a role for astrocytes. Can J Physiol Pharmacol. 1997;75(10–11):1149–1163. doi: 10.1139/y97-146. [DOI] [PubMed] [Google Scholar]
- Wood ZA, Schröder E, Harris JR, Poole LB. Structure, mechanism and regulation of peroxiredoxins. Trends Biochem Sci. 2003;28(1):32–40. doi: 10.1016/S0968-0004(02)00003-8. [DOI] [PubMed] [Google Scholar]
- Zencak D, Lingbeek M, Kostic C, Tekaya M, Tanger E, Hornfeld D, Jaquet M, Munier FL, Schorderet DF, van Lohuizen M, Arsenijevic Y. Bmi1 loss produces an increase in astroglial cells and a decrease in neural stem cell population and proliferation. J Neurosci. 2005;25(24):5774–5783. doi: 10.1523/JNEUROSCI.3452-04.2005. [DOI] [PMC free article] [PubMed] [Google Scholar]
- Zhang HW, Ding J, Jin JL, Guo J, Liu JN, Karaplis A, Goltzman D, Miao D. Defects in mesenchymal stem cell self-renewal and cell fate determination lead to an osteopenic phenotype in Bmi-1 null mice. J Bone Miner Res. 2010;25(3):640–652. doi: 10.1359/jbmr.090812. [DOI] [PubMed] [Google Scholar]
- Zinkel S, Gross A, Yang E. BCL2 family in DNA damage and cell cycle control. Cell Death Differ. 2006;13(8):1351–1359. doi: 10.1038/sj.cdd.4401987. [DOI] [PubMed] [Google Scholar]
Associated Data
This section collects any data citations, data availability statements, or supplementary materials included in this article.
Supplementary Materials
PDF 170 kb


