

Abstract
Background
Impingement of the femoral neck with the acetabular component after metal-on-metal hip resurfacing arthroplasty (HRA) is a possible cause of edge loading and accelerated bearing wear. No attempt has been made to correlate radiographic impingement signs and blood metal ion levels.
Questions/purposes
We (1) compared serum cobalt (CoS) and chromium (CrS) concentrations between patients with and without radiographic impingement signs treated with unilateral HRA, (2) determined whether divot depth on the femoral neck correlated with CoS and CrS, and (3) assessed the predictive value of radiographic impingement signs for high levels of CoS and CrS.
Methods
A retrospective radiographic review of 141 patients with CoS and CrS analyses yielded 21 patients with and 120 without radiographic impingement signs (controls). Radiographic measurements included divot depth and orientation of the acetabular component to compute the contact patch to rim distance, a measure of functional head coverage. We defined a patient as having radiographic impingement signs if a remodeling of the femoral neck cortex showed a depression matching the predicted path of an impinging acetabular component. CoS and CrS were analyzed by inductively coupled plasma mass spectrometry and the radiographs were taken within 12 months of the last blood draw.
Results
Median CoS and CrS were greater in the impingement group than in controls in patients with less than 10-mm contact patch to rim distances. Divot depth did not correlate with CoS or CrS. In predicting elevated ion levels (≥ 7 μg/L), the presence of a radiographic impingement sign showed a sensitivity of 50% for CoS and 33% for CrS and a specificity of 87% for both CoS and CrS.
Conclusions
Radiographic impingement signs influenced CoS and CrS only when the functional head coverage was insufficient due to poor socket positioning. Radiographic impingement signs alone were not a good predictor of elevated metal ion levels.
Level of Evidence
Level III, diagnostic study. See Instructions for Authors for a complete description of levels of evidence.
Introduction
Hip resurfacing arthroplasty (HRA) has been performed since the mid-1970s and attracted renewed interest in the late 1990s with the rise of modern-generation metal-on-metal bearings [4, 11]. The study of metal ion concentrations in blood or serum showed that patients treated with metal-on-metal prosthetic joints have elevated cobalt and chromium levels compared with preoperative baseline levels [20, 25, 26]. Cobalt and chromium levels can be used to monitor the proper function of the prosthetic bearing [29]. Retrieval analyses of failed implants increased wear in edge-loaded implants [21, 23]. Impingement of the femoral neck with the rim of the acetabular component might cause edge loading of the bearing [16, 21]. Several studies radiographically identified cases of femoral neck to cup impingement, with prevalence values ranging from 6% to 22% [8, 12, 19, 30]. However, no attempt has been made to directly correlate radiographic evidence of femoral neck to cup impingement and metal ion serum concentrations.
We therefore (1) compared serum cobalt (CoS) and serum chromium (CrS) concentrations between patients with and without radiographic signs of impingement treated with unilateral HRA, (2) determined whether the depth of the divot on the femoral neck correlated with CoS and CrS, and (3) assessed the predictive value of radiographic signs of impingement for high levels of CoS and CrS.
Patients and Methods
The institutional review board approved our study and the patients consented to their participation in the study. From the database of the senior author (HCA) including 1094 patients (1360 hips) implanted with a Conserve® Plus hip resurfacing device (Wright Medical Technology, Inc, Arlington, TN, USA), we retrospectively selected the patients with unilateral implants who had a blood draw performed more than 2 years after surgery to measure CoS and CrS concentrations and high-quality plain radiographs taken either the day of the blood draw or within 12 months of that blood draw. For most patients, the recruitment into our ion studies was made based on their proximity to our center or their availability for further studies. In addition, some were recruited at the surgeon’s discretion for special interests, including mainly outstanding radiographic findings or poor acetabular component positioning. One hundred fifty patients met the inclusion criteria. We excluded nine patients who underwent revision surgery for aseptic loosening of the femoral or acetabular component because the metal ion levels could have been affected by the loosening condition. We reviewed the radiographs (AP pelvis and cross-table lateral [14] views) for the remaining 141 patients at each followup appointment to identify the hips presenting with radiographic signs of impingement as described by Gruen et al. [12]. A patient was defined as having radiographic signs of impingement if a remodeling of the femoral neck cortex showed a depression matching the predicted path of an impinging acetabular component, whether on the AP radiograph, the lateral radiograph, or both. Twenty-one patients presented with radiographic signs of impingement. We found radiographic signs of impingement on the lateral aspect of the femoral neck in eight hips, on the posterior aspect of the neck in 10 hips, and on both in three hips. We measured the depth of the divots [12] from digital outputs of the radiographs using ImageJ 1.41 image processing and analysis software (NIH, Bethesda, MD, USA). The measurements were normalized using the known outside diameter of the acetabular component. Two of us (AJW, MJL) completed the measurements twice, in a blinded fashion, on all 21 patients. The intraobserver reliability was high (intraclass correlation coefficient, 0.789) while the interobserver reliability of the method was somewhat lower (intraclass correlation coefficient, 0.616). We elected to use the mean scores collected by the two experimenters for subsequent analyses using the depth of the divot sign. These 21 patients constituted our study group. The 120 remaining patients without radiographic signs of impingement constituted our control group. We also measured contact patch to rim distance, which is an estimation of the distance between the point of contact of the joint reaction force with the cup and the inside edge of the cup rim (Fig. 1). This contact patch to rim distance estimation was computed as previously described in the literature [6, 16, 31], based on design coverage, component size, and acetabular cup abduction and anteversion angles measured from AP pelvis radiographs with Einzel-Bild-Roentgen-Analyse (EBRA) software (EBRA-CUP; University of Innsbruck, Innsbruck, Austria) [10, 17]. The contact patch to rim distance represents the functional coverage of the femoral component by the socket.
Fig. 1.

A schematic diagram represents the calculation of the contact patch to rim (CPR) distance. Angle α (14°) is the medial deviation of the joint reaction force from vertical in the frontal plane and angle β (16°) is the forward deviation of the joint reaction force from the transverse axis in the horizontal plane. These values represent average direction measurements made by Bergmann et al. [9] for the standing position. Reprinted with kind permission by Springer Science+Business Media from Amstutz HC, Le Duff MJ, Johnson AJ. Socket position determines hip resurfacing 10-year survivorship. Clin Orthop Relat Res. 2012;470:3127–3133.
The FDA has approved the Conserve® Plus HRA device. Previous publications [3, 6] described the Conserve® Plus hip resurfacing device, which features a one-piece acetabular component of variable femoral head coverage angle depending on component size. The coverage angle of the acetabular component sizes used in our study ranged from 160° to 163°. The blend radius of all acetabular components was 1.6 mm. The surgical technique was previously described in detail [1, 2, 5].
Followup visits were scheduled annually and included ROM measurements, UCLA hip scoring, and radiographic followup with AP pelvis radiographs taken in supine position. The two groups showed similar characteristics in male to female ratio, height, weight, BMI, femoral component size, percentage of hips with a low contact patch to rim distance (< 10 mm) [16, 31], and postoperative UCLA pain and activity score. The mean age of the patients at surgery was lower and the mean time between surgery and the last blood draw was longer for the impingement group than for the control group (Table 1). Hip flexion and abduction were greater for the impingement group than for the control group (Table 2).
Table 1.
Comparative demographics between the impingement and control groups
| Variable | Impingement group (n = 21) | Control group (n = 120) | p value |
|---|---|---|---|
| Age (years)* | 47 (26–68) | 52 (14–77) | 0.0607 |
| Male/female (number of patients) | 13 (62%)/8 (38%) | 74 (62%)/46 (38%) | 0.9898 |
| Weight (kg)* | 84 (59–134) | 82 (48–153) | 0.6265 |
| Height (cm)* | 176 (160–198) | 174 (154–198) | 0.3682 |
| BMI* | 27 (19–37) | 27 (17–42) | 0.9317 |
| Femoral component size (mm)* | 47 (42–54) | 47 (38–56) | 0.8828 |
| UCLA activity score (points)* | 7.1 (3–10) | 7.4 (4–10) | 0.4390 |
| CPR distance (mm) | 12.6 (3.2–24.1) | 13.9 (4.7–23.7) | 0.1846 |
| Number of patients with CPR distance < 10 mm | 8 (38%) | 22 (19%) | 0.0879 |
| Time to last blood draw (months)* | 106.1 (39–164) | 76.6 (24–164) | 0.0027 |
* Values are expressed as mean, with range in parentheses; CPR = contact patch to rim.
Table 2.
Comparative ROM measurements between the impingement and control groups
| Variable | Postoperative ROM (°) | p value | |
|---|---|---|---|
| Impingement group (n = 21) | Control group (n = 120) | ||
| Flexion | 135 (90–170) | 127 (90–165) | 0.0233 |
| Flexion contracture | 0 | 1.2 (0–40) | 0.2339 |
| Abduction | 53 (40–80) | 46 (25–75) | 0.0025 |
| Adduction | 31 (15–50) | 29 (10–45) | 0.3835 |
| Internal rotation | 47 (20–60) | 41 (0–85) | 0.1633 |
| External rotation | 42 (20–60) | 42 (10–75) | 0.9785 |
| Rotation arc | 87 (60–110) | 82 (20–120) | 0.2632 |
We collected blood samples in 9-mL S-Monovette® syringes (Sarstedt, Princeton, NJ, USA) using a Sarstedt Multi-Adapter and an Abbott Butterfly® Infusion Set (Abbott Laboratories, Abbott Park, IL, USA). The first syringe was used to rinse the needle and adapter and was not used in analysis. The samples clotted naturally for 1.5 hours before being centrifuged. Serum samples were stored in acid-washed tubes at −25° C until they were shipped in dry ice to outside laboratories (Rush University Medical Center Trace Metal Analysis Laboratory, Chicago, IL, USA; Applied Speciation and Consulting, Bothell, WA, USA; Kronos Science Laboratory Services, Phoenix, AZ, USA; London Laboratory Services Group, London, ON, Canada; ARUP Laboratories, Salt Lake City, UT, USA) for analysis. All samples were analyzed using inductively coupled plasma mass spectrometry.
For patients who underwent multiple ion tests, we used the CoS and CrS values of the last blood draw. One hundred nine patients had radiographic studies performed the same day and 32 patients had their radiographs taken within 12 months of the blood draw. We used Mann-Whitney U tests for all comparisons of CoS and CrS between the study and control groups. The statistical dependence of divot depth and CoS or CrS was studied by computation of the Spearman rho correlation coefficient. Using the cutoff point of 7 μg/L or greater as an operational definition of high level for both CoS and CrS as suggested by the Medicines and Healthcare products Regulatory Agency [22], we used logistic regression analysis to assess the adjusted effects of contact patch to rim distance, presence of radiographic signs of impingement, and patient UCLA activity score on the outcome of low versus high metal serum concentrations. Finally, sensitivity and specificity of the presence of radiographic impingement signs for elevated ion levels were calculated. All statistical analyses were carried out using Stata® Version 6 (StataCorp LP, College Station, TX, USA).
Results
Radiographic signs of impingement were associated with elevated CoS and CrS levels. The median CoS was greater (p = 0.0598) in the impingement group (1.8 μg/L; range, 0.3–140.0 μg/L) than in the control group (1.1 μg/L; range, 0.2–58.4 μg/L). The median CrS was also greater (p = 0.0081) in the impingement group (2.7 μg/L; range, 0.4–61.9 μg/L) than in the control group (1.5 μg/L; range, 0.1–46.3 μg/L). Among patients with contact patch to rim distances of 10 mm or more, the patients with and without radiographic signs of impingement did not differ, with a median CoS of 1.2 μg/L versus 1.1 μg/L (p = 0.5722) and a median CrS of 1.7 μg/L versus 1.3 μg/L (p = 0.3691). In contrast, among patients with contact patch to rim distances of less than 10 mm, both CoS and CrS were greater in the impingement group than in the control group, with a median CoS of 13.6 μg/L versus 1.3 μg/L (p = 0.0522) and a median CrS of 17.9 μg/L versus 1.9 μg/L (p = 0.0086) (Fig. 2). The logistic regression showed a significant relationship between low contact patch to rim distance and high CoS (p = 0.003) or CrS (p = 0.001) but no association between presence of radiographic signs of impingement or activity level and CoS or CrS (Table 3).
Fig. 2A–B.

Box plots indicate (A) CoS values and (B) CrS values for the radiographic impingement sign (RIS) and control groups, separated by contact patch to rim (CPR) distance status and using 10 mm as the cutoff point. Only the last postoperative values were included. The boxes show the interquartile range; the horizontal line represents the median; and the whiskers show the extreme values.
Table 3.
Logistic regression showing the effect of variables on low (< 7 μg/L) versus high (≥ 7 μg/L) CoS and CrS
| Variable | Odds ratio | p value | 95% CI |
|---|---|---|---|
| CoS | |||
| CPR distance | 0.674 | 0.003 | 0.521–0.872 |
| Radiographic impingement signs | 4.060 | 0.110 | 0.729–22.613 |
| UCLA activity | 0.851 | 0.635 | 0.438–1.653 |
| CrS | |||
| CPR distance | 0.716 | 0.001 | 0.590–0.869 |
| Radiographic impingement signs | 2.031 | 0.355 | 0.452–9.126 |
| UCLA activity | 0.695 | 0.151 | 0.423–1.142 |
CPR = contact patch to rim; CoS = serum cobalt; CrS = serum chromium.
The depth of the divot did not correlate with CoS or CrS. Within the impingement group, the divot signs had a mean depth of 2.7 mm (range, 1.2–6.2 mm). This measurement did not correlate with either CoS levels (Spearman rho, −0.1886; p = 0.4130) or CrS levels (Spearman rho, −0.1170; p = 0.6134).
Among the 21 patients with radiographic impingement signs, four had elevated CoS and CrS (Table 4). Among the 120 patients without impingement, four had elevated CoS and eight had elevated CrS. The sensitivity of the presence of radiographic impingement signs to predict elevated ion levels (≥ 7 μg/L) was 50% for CoS and 33% for CrS. The specificity of the presence of radiographic impingement signs to predict elevated ion levels (≥ 7 μg/L) was 87% for both CoS and CrS.
Table 4.
Relevant characteristics for the group of patients with radiographic impingement signs
| ID | Sex | Age (years) | Head size (mm) | Cup abduction angle (°) | Cup anteversion angle (°) | CPR distance (mm) | Divot depth (mm) | Impingement location | CoS (μg/L) | CrS (μg/L) | Time to last draw (months) | ROM flexion (°) | ROM abduction (°) |
|---|---|---|---|---|---|---|---|---|---|---|---|---|---|
| 13 | Male | 41 | 48 | 34 | 21 | 16.2 | 2.8 | Lateral | 1.0 | 1.2 | 159 | 125 | 40 |
| 45 | Male | 51 | 50 | 43 | 13 | 17.6 | 1.2 | Lateral | 3.8 | 6.5 | 165 | 120 | 40 |
| 228 | Male | 52 | 54 | 40 | 20 | 17.3 | 2.3 | Lateral | 1.7 | 1.2 | 127 | 135 | 45 |
| 235 | Male | 39 | 52 | 37 | 21 | 16.9 | 2.3 | Lateral | 2.2 | 2.7 | 109 | 145 | 50 |
| 353 | Female | 39 | 44 | 47 | 29 | 9.3 | 2.2 | Posterior | 1.3 | 3.1 | 124 | 150 | 65 |
| 358* | Male | 40 | 48 | 66 | 36 | 3.2 | 3.5 | Posterior | 121.6 | 61.9 | 120 | 130 | 55 |
| 372* | Female | 68 | 42 | 54 | 40 | 4.2 | 3.7 | Posterior and lateral | 33.6 | 47.8 | 129 | 150 | 60 |
| 412 | Male | 33 | 54 | 38 | 9 | 22.1 | 2.8 | Lateral | 1.9 | 3.5 | 124 | 130 | 50 |
| 435 | Male | 47 | 50 | 40 | 26 | 13.7 | 2.6 | Posterior | 0.3 | 0.4 | 123 | 145 | 50 |
| 462 | Male | 42 | 50 | 42 | 15 | 17.1 | 2.0 | Lateral | 1.1 | 1.7 | 124 | 130 | 50 |
| 463 | Female | 48 | 42 | 48 | 28 | 8.9 | 2.5 | Posterior | 1.8 | 4.6 | 105 | 135 | 50 |
| 509 | Male | 54 | 46 | 26 | 34 | 11.9 | 6.2 | Posterior and lateral | 0.8 | 1.1 | 98 | 140 | 45 |
| 532 | Male | 45 | 46 | 51 | 26 | 9.8 | 3.0 | Posterior | 24.0 | 30.6 | 123 | 95 | 45 |
| 537 | Male | 52 | 50 | 38 | 30 | 12.5 | 2.4 | Lateral | 0.5 | 0.9 | 105 | 130 | 60 |
| 552 | Male | 64 | 48 | 39 | 20 | 15.3 | 4.2 | Posterior and lateral | 1.2 | 1.8 | 39 | 130 | 45 |
| 634 | Female | 46 | 42 | 52 | 19 | 10.3 | 2.0 | Posterior | 1.9 | 2.1 | 81 | 130 | 50 |
| 667 | Male | 62 | 50 | 32 | 3 | 24.1 | 1.7 | Lateral | 6.0 | 6.4 | 97 | 125 | 50 |
| 696 | Female | 55 | 46 | 51 | 37 | 6.7 | 3.1 | Posterior | 0.8 | 1.7 | 88 | 130 | 60 |
| 756 | Female | 27 | 42 | 45 | 19 | 12.2 | 2.1 | Posterior | 0.5 | 1.0 | 48 | 140 | 80 |
| 789* | Female | 40 | 46 | 52 | 32 | 8.0 | 1.8 | Posterior | 140.0 | 60.0 | 72 | 140 | 50 |
| 846 | Female | 53 | 42 | 51 | 34 | 6.7 | 2.1 | Posterior | 3.3 | 5.3 | 66 | 170 | 65 |
| Mean | 47 | 47 | 44.1 | 24.3 | 12.6 | 2.7 | 1.8 (median) | 2.7 (median) | 106 | 135 | 53 |
* The patient underwent revision surgery to a THA; CPR = contact patch to rim; CoS = serum cobalt; CrS = serum chromium.
Discussion
HRA has been under scrutiny in light of the complications associated with metal-on-metal bearing prostheses. The measurement of cobalt and chromium levels has been recommended for their predictive and diagnostic value when assessing the function of these implants [29]. It has been postulated that impingement of the femoral neck with the acetabular component may be a cause of edge loading [15, 16, 21], but no direct relationship between elevated ion levels and femoral neck to cup impingement has been established. We investigated the relationship between radiographic signs of impingement and serum ion levels, assessing the predictive value of impingement on serum ion levels.
Our study has several limitations. First, this was a retrospective study and there were different time lines within and between the groups with respect to serum ion draws; in particular, more time had elapsed between surgery and the blood draw in the patients with radiographic signs of impingement. There is evidence in the literature that ion levels do not increase over time after steady-state wear has been achieved in well-functioning hips [3, 7, 13]. We believe that the validity of comparing ion levels between the two groups is preserved. Also, radiographic signs of impingement usually appear on radiographs within 24 months after surgery [8, 12], and our minimum followup for this study was 2 years (mean 79 months for the control group). It is unlikely that patients with impingement were mistakenly attributed to the control group because of insufficient time of radiographic followup. On the other hand, the time differential may have somewhat affected the study of the depth of radiographic impingement signs because different stages of impingement may have been occurring at the time the radiographic evaluation was made, although Ball and Schmalzried [8] suggest that radiographic impingement signs show no further progression after 2 years. Second, we also learned that serum ion levels [16] vary between HRA designs. We used the Conserve® Plus prostheses in our study, and although one could infer that the same pathologic process may be occurring with other implants, our study remains limited to this specific device because coverage and radial clearance between femoral and acetabular components affect component wear [28] and the magnitude of the blend radius is likely to influence bone remodeling in hips with radiographic signs of impingement. Future aggregate research may provide a wider spectrum of the effects of impingement on CoS and CrS levels across multiple implants and identify which factors affect the susceptibility of a device to impingement and/or increased serum ion levels. Third, we viewed radiographic signs of impingement via cross-table lateral and AP radiographs from two different locations. We found radiographic signs of impingement on the posterior and the lateral aspects of the femoral neck, but due to the relatively small sample size, we were unable to further subdivide the groups to investigate the importance, if any, of the location of radiographic impingement signs on serum ion levels. As we continue to follow our patients with radiographic signs of impingement and measure their serum ion levels, future studies may shed some light on the possible influence of the location of impingement on ion levels.
We found an association between increased serum ion levels and impingement with a higher median CoS and CrS in the impingement group. However, when we stratified the groups by contact patch to rim distance (low, ≤ 10 mm), we noticed that radiographic signs of impingement only resulted in higher ion levels in patients with low contact patch to rim distance. It has been previously observed that a low contact patch to rim distance is a strong predictor of high ion levels [16, 31], and this was once again reaffirmed in our study. It appears that, with a well-positioned acetabular cup, impingement does not affect CoS or CrS. This is consistent with the results of our multivariate model, showing no significant association between radiographic signs of impingement and high CoS or CrS levels after adjusting for contact patch to rim distance and activity level. These results are in agreement with those of Leslie et al. [18] who showed increased wear rates in vitro in metal-on-metal bearings combining microseparation (a condition that could result from impingement) with out-of-range cup positioning.
The depth of the divot did not correlate with ion levels in this study, suggesting that neither the presence nor the magnitudes of these defects are reliable indications for the ordering of metal ion studies. It could be speculated that, as the neck remodels, the magnitude of impingement and the stresses between the neck and the cup may actually be offloaded, reducing the risk of edge loading secondary to impingement.
In the current study, we found that radiographic signs of impingement could not be reliably used as a predictor of high ion levels; the sensitivity was low with only four of our 21 patients with radiographic impingement signs having CoS and CrS levels of more than 7 μg/L (Fig. 3). More importantly, we found that all four of the patients with radiographic signs of impingement and high ions had malpositioned cups with a contact patch to rim distance of less than 10 mm (Fig. 4). We revised three of the four patients to conventional THA at an average of 107 months (range, 72–130 months). All three were revised because of the presence of adverse tissue reactions visible on MRI performed with metal artifact reduction sequencing. The fourth patient is being monitored. Of the 21 patients with impingement signs, eight had contact patch to rim distances of less than 10 mm, among which four presented high ion levels (Table 4), suggesting that the combination of insufficient functional coverage and impingement leads to a 50% chance of excessive bearing wear. At this time, we do not have any satisfactory explanation as to why one half of the patients combining the two conditions had essentially normal metal ion concentrations while the other half presented very high levels. A case can be made for the need to compute contact patch to rim distance as a key variable to any study of metal ions after metal-on-metal hip arthroplasty. We recognize that the measurement of cup anteversion to calculate contact patch to rim distance may be a challenge because of the expense of the EBRA software used in this study. However, the ischiolateral method based on cross-table lateral radiographs described by Pulos et al. [24] provides measurements consistent with those of EBRA [27], making it an excellent alternative method in centers where EBRA is not available.
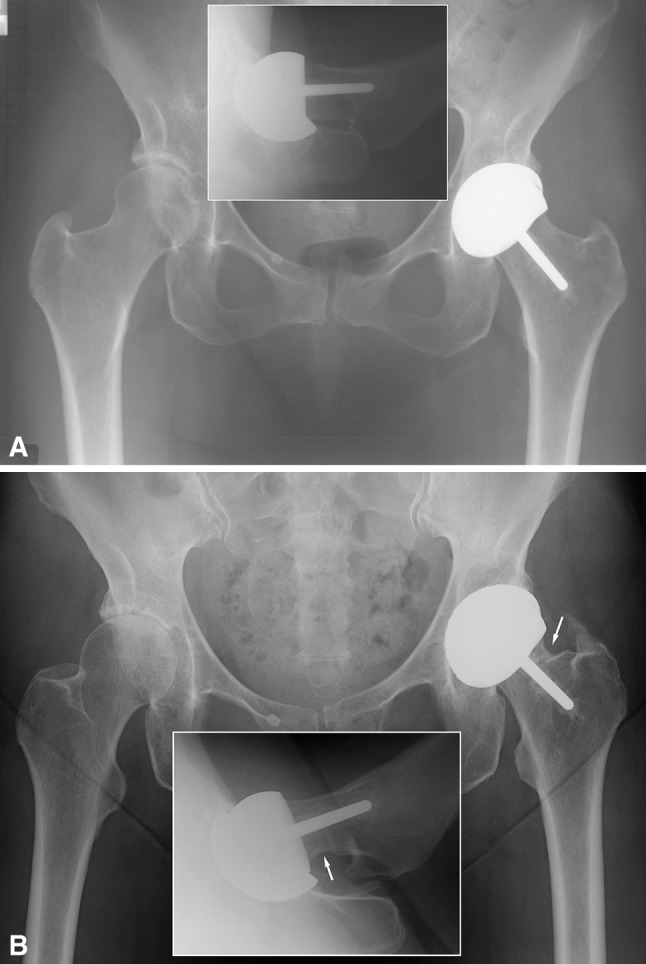
Fig. 3A–B.

(A) A postoperative AP radiograph and a cross-table lateral view (insert) show the hip of a 53-year-old man (ID 509). The acetabular component was inserted with a 26° abduction angle and a 34° anteversion angle. (B) A 10-year postoperative AP radiograph and a cross-table lateral view (insert) show the patient is asymptomatic but has radiographic impingement signs on the lateral and posterior aspects of the femoral neck (arrows).
Fig. 4A–B.
(A) A postoperative AP radiograph and a cross-table lateral view of the AP radiograph (insert) show the hip of a 68-year-old woman (ID 372). (B) An 11-year postoperative AP radiograph and cross-table view (insert) show radiographic impingement signs on the lateral and posterior aspects of the femoral neck (arrows).
In summary, we found that the presence of a radiographic sign of impingement does not lead to a pathologic process resulting in high CoS and CrS when functional coverage is sufficient. However, combined with poor positioning of the cup, impingement may be the trigger leading to elevated ion levels. Most importantly, this study reiterates the importance of proper acetabular component orientation to provide sufficient functional coverage of the femoral head and avoid excessive bearing wear in HRA.
Footnotes
One of the authors (HCA) certifies that he has received or may receive payments or benefits, during the study period, an amount of USD 10,000 to USD 100,000), from Wright Medical Technology Inc (Arlington, TN, USA).
All ICMJE Conflict of Interest Forms for authors and Clinical Orthopaedics and Related Research editors and board members are on file with the publication and can be viewed on request.
Clinical Orthopaedics and Related Research neither advocates nor endorses the use of any treatment, drug, or device. Readers are encouraged to always seek additional information, including FDA approval status, of any drug or device before clinical use.
Each author certifies that his or her institution approved the human protocol for this investigation, that all investigations were conducted in conformity with ethical principles of research, and that informed consent for participation in the study was obtained.
References
- 1.Amstutz HC. “Top 10” technical pearls for successfully performing hip resurfacing arthroplasty. Tech Orthop. 2010;25:73–79. doi: 10.1097/BTO.0b013e3181d2d6e7. [DOI] [Google Scholar]
- 2.Amstutz HC, Beaulé PE, Dorey FJ, Le Duff MJ, Campbell PA, Gruen TA. Metal-on-metal hybrid surface arthroplasty—surgical technique. J. Bone Joint Surg. Am. 2006;88:234–249. doi: 10.2106/JBJS.F.00273. [DOI] [PubMed] [Google Scholar]
- 3.Amstutz HC, Campbell PA, Dorey FJ, Johnson AJ, Skipor A, Jacobs JJ. Do ion concentrations after metal-on-metal hip resurfacing increase over time? A prospective study. J Arthroplasty. 2013;28:695–700. doi: 10.1016/j.arth.2012.07.040. [DOI] [PubMed] [Google Scholar]
- 4.Amstutz HC, Le Duff MJ. Background of metal-on-metal resurfacing. Proc Inst Mech Eng H. 2006;220:85–94. doi: 10.1243/095441105X69088. [DOI] [PubMed] [Google Scholar]
- 5.Amstutz HC, Le Duff MJ, Campbell PA, Dorey FJ. The effects of technique changes on aseptic loosening of the femoral component in hip resurfacing: results of 600 Conserve Plus with a 3–9 year follow-up. J Arthroplasty. 2007;22:481–489. doi: 10.1016/j.arth.2006.08.001. [DOI] [PubMed] [Google Scholar]
- 6.Amstutz HC, Le Duff MJ, Johnson AJ. Socket position determines hip resurfacing 10-year survivorship. Clin Orthop Relat Res. 2012;470:3127–3133. doi: 10.1007/s11999-012-2347-y. [DOI] [PMC free article] [PubMed] [Google Scholar]
- 7.Back DL, Young DA, Shimmin AJ. How do serum cobalt and chromium levels change after metal-on-metal hip resurfacing? Clin Orthop Relat Res. 2005;438:177–181. doi: 10.1097/01.blo.0000166901.84323.5d. [DOI] [PubMed] [Google Scholar]
- 8.Ball ST, Schmalzried TP. Posterior femoroacetabular impingement (PFAI)—after hip resurfacing arthroplasty. Bull NYU Hosp Jt Dis. 2009;67:173–176. [PubMed] [Google Scholar]
- 9.Bergmann G, Deuretzbacher G, Heller M, Graichen F, Rohlmann A, Strauss J, Duda GN. Hip contact forces and gait patterns from routine activities. J Biomech. 2001;34:859–871. doi: 10.1016/S0021-9290(01)00040-9. [DOI] [PubMed] [Google Scholar]
- 10.Biedermann R, Tonin A, Krismer M, Rachbauer F, Eibl G, Stockl B. Reducing the risk of dislocation after total hip arthroplasty: the effect of orientation of the acetabular component. J Bone Joint Surg Br. 2005;87:762–769. doi: 10.1302/0301-620X.87B6.14745. [DOI] [PubMed] [Google Scholar]
- 11.Grigoris P, Roberts P, Panousis K, Bosch H. The evolution of hip resurfacing arthroplasty. Orthop Clin North Am. 2005;36:125–134. doi: 10.1016/j.ocl.2005.01.006. [DOI] [PubMed] [Google Scholar]
- 12.Gruen TA, Le Duff MJ, Wisk LE, Amstutz HC. Prevalence and clinical relevance of radiographic signs of impingement in metal-on-metal hybrid hip resurfacing. J Bone Joint Surg Am. 2011;93:1519–1526. doi: 10.2106/JBJS.I.01723. [DOI] [PubMed] [Google Scholar]
- 13.Heisel C, Streich N, Krachler M, Jakubowitz E, Kretzer JP. Characterization of the running-in period in total hip resurfacing arthroplasty: an in vivo and in vitro metal ion analysis. J Bone Joint Surg Am. 2008;90:125–133. doi: 10.2106/JBJS.H.00437. [DOI] [PubMed] [Google Scholar]
- 14.Johnson CR. A new method for roentgenographic examination of the upper end of the femur. J Bone Joint Surg. 1932;14:859–866. [Google Scholar]
- 15.Langton DJ, Joyce TJ, Mangat N, Lord J, Van Orsouw M, De Smet K, Nargol AV. Reducing metal ion release following hip resurfacing arthroplasty. Orthop Clin North Am. 2011;42:169–180. doi: 10.1016/j.ocl.2011.01.006. [DOI] [PubMed] [Google Scholar]
- 16.Langton DJ, Sprowson AP, Joyce TJ, Reed M, Carluke I, Partington P, Nargol AV. Blood metal ion concentrations after hip resurfacing arthroplasty: a comparative study of articular surface replacement and Birmingham hip resurfacing arthroplasties. J Bone Joint Surg Br. 2009;91:1287–1295. doi: 10.1302/0301-620X.91B10.22308. [DOI] [PubMed] [Google Scholar]
- 17.Langton DJ, Sprowson AP, Mahadeva D, Bhatnagar S, Holland JP, Nargol AV. Cup anteversion in hip resurfacing: validation of EBRA and the presentation of a simple clinical grading system. J Arthroplasty. 2009;25:607–613. doi: 10.1016/j.arth.2009.08.020. [DOI] [PubMed] [Google Scholar]
- 18.Leslie IJ, Williams S, Isaac G, Ingham E, Fisher J. High cup angle and microseparation increase the wear of hip surface replacements. Clin Orthop Relat Res. 2009;467:2259–2265. doi: 10.1007/s11999-009-0830-x. [DOI] [PMC free article] [PubMed] [Google Scholar]
- 19.Lim SJ, Kim JH, Moon YW, Park YS. Femoroacetabular cup impingement after resurfacing arthroplasty of the hip. J Arthroplasty. 2012;27:60–65. doi: 10.1016/j.arth.2011.02.014. [DOI] [PubMed] [Google Scholar]
- 20.MacDonald SJ, McCalden RW, Chess DG, Bourne RB, Rorabeck CH, Cleland D, Leung F. Metal-on-metal versus polyethylene in hip arthroplasty: a randomized clinical trial. Clin Orthop Relat Res. 2003;406:282–296. doi: 10.1097/00003086-200301000-00039. [DOI] [PubMed] [Google Scholar]
- 21.Matthies A, Underwood R, Cann P, Ilo K, Nawaz Z, Skinner J, Hart AJ. Retrieval analysis of 240 metal-on-metal hip components, comparing modular total hip replacement with hip resurfacing. J Bone Joint Surg Br. 2011;93:307–314. doi: 10.1302/0301-620X.93B3.25551. [DOI] [PubMed] [Google Scholar]
- 22.Medicines and Healthcare products Regulatory Agency. Medical Device Alert. All metal-on-metal (MoM) hip replacements (MDA/2012/008). Available at: http://www.mhra.gov.uk/home/groups/dts-bs/documents/medicaldevicealert/con143787.pdf. Accessed October 12, 2012.
- 23.Morlock MM, Bishop N, Zustin J, Hahn M, Ruther W, Amling M. Modes of implant failure after hip resurfacing: morphological and wear analysis of 267 retrieval specimens. J Bone Joint Surg Am. 2008;90:89–95. doi: 10.2106/JBJS.H.00621. [DOI] [PubMed] [Google Scholar]
- 24.Pulos N, Tiberi JV, 3rd, Schmalzried TP. Measuring acetabular component position on lateral radiographs—ischio-lateral method. Bull NYU Hosp Jt Dis. 2011;69(suppl 1):S84–S89. [PubMed] [Google Scholar]
- 25.Savarino L, Granchi D, Ciapetti G, Cenni E, Nardi Pantoli A, Rotini R, Veronesi C, Baldini N, Giunti A. Ion release in patients with metal-on-metal hip bearings in total joint replacement: a comparison with metal-on-polyethylene bearings. J Biomed Mater Res. 2002;63:467–474. doi: 10.1002/jbm.10299. [DOI] [PubMed] [Google Scholar]
- 26.Skipor AK, Campbell PA, Paterson LM, Amstutz HC, Schmalzried TP, Jacobs JJ. Serum and urine metal levels in patients with metal-on-metal surface arthroplasty. J Mater Sci Mater Med. 2002;13:1227–1234. doi: 10.1023/A:1021179029640. [DOI] [PubMed] [Google Scholar]
- 27.Tiberi JV, Pulos N, Kertzner M, Schmalzried TP. A more reliable method to assess acetabular component position. Clin Orthop Relat Res. 2012;470:471–476. doi: 10.1007/s11999-011-2006-8. [DOI] [PMC free article] [PubMed] [Google Scholar]
- 28.Underwood RJ, Zografos A, Sayles RS, Hart AJ, Cann P. Edge loading in metal-on-metal hips: low clearance is a new risk factor. Proc Inst Mech Eng H. 2012;226:217–226. doi: 10.1177/0954411911431397. [DOI] [PMC free article] [PubMed] [Google Scholar]
- 29.Van Der Straeten C, Grammatopoulos G, Gill HS, Calistri A, Campbell P, De Smet KA. The 2012 Otto Aufranc Award. The interpretation of metal ion levels in unilateral and bilateral hip resurfacing. Clin Orthop Relat Res. 2013;471:377–385. doi: 10.1007/s11999-012-2526-x. [DOI] [PMC free article] [PubMed] [Google Scholar]
- 30.Yoo MC, Cho YJ, Chun YS, Rhyu KH. Impingement between the acetabular cup and the femoral neck after hip resurfacing arthroplasty. J Bone Joint Surg Am. 2011;93:99–106. doi: 10.2106/JBJS.J.01771. [DOI] [PubMed] [Google Scholar]
- 31.Yoon JP, Le Duff MJ, Johnson AJ, Takamura KM, Ebramzadeh E, Amstutz HC. Contact patch to rim distance predicts metal ion levels in hip resurfacing. Clin Orthop Relat Res. 2013;471:1615–1621. doi: 10.1007/s11999-012-2711-y. [DOI] [PMC free article] [PubMed] [Google Scholar]