Abstract
A PET insert with detector having smaller crystals and placed near a region of interest in a conventional PET scanner can improve image resolution locally due to the Virtual-Pinhole PET (VP-PET) effect. This improvement is from the higher spatial sampling of the imaging area near the detector. We have built a prototype half-ring PET insert for head-and-neck cancer imaging applications. In this paper, we extend the use of the insert to breast imaging and show that such a system provides high resolution images of breast and axillary lymph nodes while maintaining the full imaging field of view capability of a clinical PET scanner. We characterize the resolution and contrast recovery for tumors across the imaging field of view. First, we model the system using Monte Carlo methods to determine its theoretical limit of improvement. Simulations were conducted with hot spherical tumors embedded in background activity at tumor-to-background contrast ranging from 3:1 to 12:1. Tumors are arranged in a Derenzo-like pattern with their diameters ranging from 2 to 12 mm. Experimental studies were performed using a chest phantom with cylindrical breast attachment. Tumors of different sizes arranged in a Derenzo-like pattern with tumor-to- background ratio of 6:1 are inserted into the breast phantom. Imaging capability of mediastinum and axillary lymph nodes is explored. Both Monte Carlo simulations and experiment show clear improvement in image resolution and contrast recovery with VP-PET half ring insert. The degree of improvement in resolution and contrast recovery depends on location of the tumor. The full field of view imaging capability is shown to be maintained. Minor artifacts are introduced in certain regions.
1. Introduction
Breast cancer continues to be the second leading cause of mortality due to cancer in women and it will affect 12.29% of women born today [1]. It has been shown that early detection when tumor size is small increases the chances of survival to as high as 98% over a 5 year period [2, 3]. Positron Emission Tomography (PET) is used in the staging, restaging and evaluation of response to treatment of the disease. However, currently Fludeoxyglucose (FDG)-PET is not useful for early stages of the disease.
Clinical PET provides quantitative measurement of radionuclide activity concentration in body. Whole body imaging capability provided by clinical PET is useful in detecting distant metastasis or an unexpected primary tumor. However, clinical PET scanners have limited resolution and hence, the ability to identify tumors that are well differentiated (thus, having low contrast) or having a small volume (such as ductal carcinoma in situ) are limited [4], [5]. Since tumor size correlates with probability of metastasis [6], an improvement in image resolution potentially improves cancer management and patient care.
It is well known that PET resolution is limited by positron range, photon accollinearity and detector intrinsic spatial resolution. Although spatial resolution could possibly be improved by having smaller crystals, the higher cost of detectors for a whole body PET system is prohibitive. Equally important is the fact that even if one uses these high cost higher resolution detectors for a clinical whole body PET scanner, the improvement in resolution will be still limited by photon accollinearity.
Traditional PET systems have detectors arranged in a ring to encompass the object. Various methods to improve the resolution of such systems have been previously explored. For example, the use of depth of interaction detectors can improve image resolution of scanners with small diameter. Wobbling the PET system or the bed can also increase the spatial sampling in PET systems.
The need for higher spatial resolution in breast cancer applications has led to the development of Positron Emission Mammography (PEM) systems. PEM systems achieve higher resolution by using smaller sized crystals, with detector placed around the region of interest. A variety of PEM scanners have been designed with resolution ranging from 2 to 3 mm [7, 8, 9, 10, 11, 12, 13, 14]. Although PEM systems generally have good resolution and have high sensitivity, their field of view (FoV) is often limited to the breast tissues, and cannot detect lesions and lymph nodes behind the chest wall.
We have proposed an innovative class of PET systems, namely Virtual Pinhole PET (VP-PET), whereby a PET insert device is integrated into a conventional PET system to improve its image resolution locally. This PET insert has smaller crystal size than the conventional system and can be positioned closer to the area of interest.
We previously built a micro insert system [15, 16] illustrating the VP-PET concept. The micro insert is a full ring insert device that can be integrated into a MicroPET scanner to increase resolution for small animal imaging. We have shown an improvement in image resolution from 1.7 mm FWHM without insert to 1.0 mm FWHM with the insert. Other groups have explored technologies that employ similar magnifying geometry such as Si-Si ring inside a BGO-BGO ring [17, 18], the Zoom-In system [19, 20], surgical PET imaging probe [21], time-of-flight PET imaging probe [22] and a prostate imaging probe [23].
Recently, we have built a half ring insert [24] for clinical head and neck imaging. In this study, we use this prototype device to test our hypothesis that VP-PET technology will allow imaging of breast tissues and lymph nodes in axilla and mediastinum regions with high resolution, while at the same time maintaining the whole body imaging capability of a clinical PET scanner.
The organization of this paper is as follows. We will present a brief introduction of our prototype VP-PET system and image reconstruction. Then we describe Monte Carlo simulation and experimental approaches that are designed to test our hypothesis. Reconstructed images followed by quantitative examination are presented in the results section. Some of the limitations and future directions are outlined in the discussion section.
2. Materials and Methods
2.1. Prototype System Description
A prototype VP-PET insert with a semicircular geometry was built for clinical research. This insert, called the VP-PET half ring insert, is shown in Figure 1. It consists of 2×2×5 mm Lutetium Oxyorthosilicate(LSO) crystals, with 13×13 crystals in each module. Fourteen modules are arranged in a half ring format having a radius of 124 mm. Two half ring are arranged inside a custom made aluminum holder.
Figure 1.
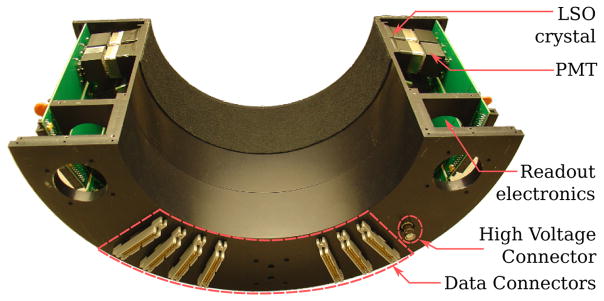
VP-PET half ring insert with cover open. The LSO detector module is connected to the Photomultiplier tube (PMT) and the PMT is connected to readout electronics. The back panel has data connectors that allow connection to electronics in Siemens PET/CT.
The VP-PET half ring insert is integrated into a Siemens Biograph 40 clinical scanner (Figure 2), to allow coincidence event detection between the insert and scanner detectors, as well as within individual systems themselves.
Figure 2.
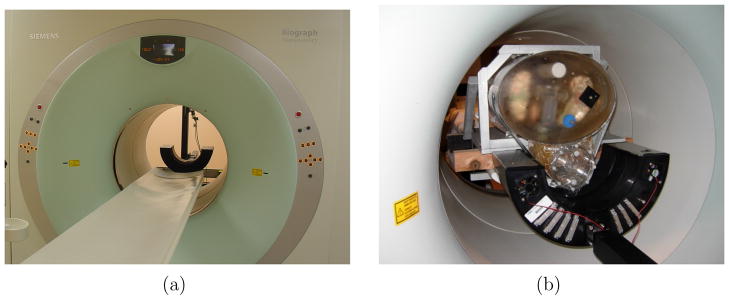
(a) Front View of insert integrated into a Siemens Biograph 40 scanner; (b) Back View of the PET/CT scanner with insert. The chest phantom with custom breast attachment used for the experiments are mounted on the bed with an aluminum holder.
The Siemens Biograph 40 is equipped with 4×4×20 mm LSO crystals with 13×13 crystals in each block. The clinical scanner has 4 detector rings, each with 48 modules arranged to have a radius of 438 mm. One of the detector rings was disabled in order to use its electronics to process the insert detectors.
The VP-PET half ring insert is centered axially and concentrically with the 3 ring scanner rings for maximum symmetry to aid in the reconstruction process.
2.2. Image Reconstruction and Correction techniques
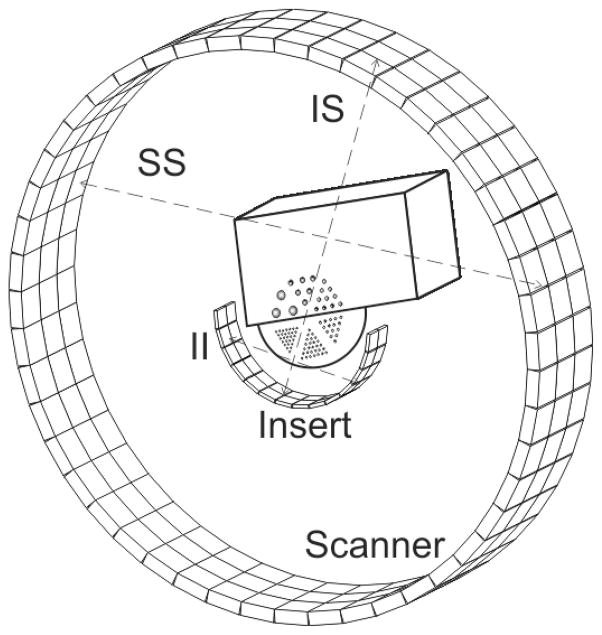
As described by Pal et al. [25], the addition of the insert into a standard PET scanner gives rise to three different sets of coincidence measurements. The scanner-scanner (SS) coincidences occur between two scanner detectors and are lower resolution. The insert-scanner (IS) coincidences occur between insert and scanner detectors and are of higher resolution. The highest resolution insert-insert (II) data is between insert detectors.
We have developed a fully 3D maximum likelihood reconstruction framework that jointly estimates the radionuclide activity concentration using all 3 types of coincidences. The geometric system matrix is computed through the sub-crystal approach [26], where crystal detectors are divided into sub-crystals, and the tube of response is measured as the average length of intersection of each line joining the sub-crystals with a candidate voxel, divided by the square of the distance between the detectors.
Scatter correction is based on single scatter simulation, where the initial radionuclide distribution is roughly estimated with 10 iterations without scatter. This initial image is down sampled to estimate scatter distribution. The estimate is scaled by fitting the tail to the measured coincidence count and added to the forward model. The application of single scatter simulation to estimate and correct scatter in VP-PET half ring insert has been previously validated [27].
Attenuation correction is based on a composite μ-map, where the body attenuation is calculated by scaling acquired CT images to equivalent 511 keV attenuation. The insert attenuation map was based on a composite attenuation image formed by measuring attenuation coefficients of a single detector module and aluminum using a 68Ge source, and substituting these values into a CAD model.
Normalization is based on component based normalization [28], and statistically estimated by acquiring coincidence data from a 68Ge phantom with known activity distribution. All the imaging studies in this work were corrected and reconstructed using the above framework, including scanner images when the VP-PET insert is not in the system. This ensures that the differences observed are solely due to VP-PET insert hardware, instead of software or algorithm.
Keesing et al. [29] provides more details on the reconstruction and correction framework for VP-PET with comparison to standard Siemens PET/CT reconstruction. All the images presented in this paper was reconstructed until the 50th iteration, by which the objective function has converged such that the change in the objective function is less than 10−5 of the value at iteration 50. The Monte Carlo simulated data is shown with no regularization. Log-cosh regularization using One-Step-Late algorithm was used for reconstructing experimental data. The parameters chosen for the regularization are the same as in [29].
2.3. Imaging studies
To compare different imaging studies, we consider a typical 70 kg patient with water density of 1 g/cm3. With a typical injected dose of 10 mCi (370 MBq) of 18F-FDG uniformly distributed in the patient, the background activity concentration within the body is 0.143 μCi/cm3 (5291 Bq/cm3).
2.3.1. Monte Carlo Simulation
To test the suitability of using VP-PET technology for breast cancer imaging, a model of a patient with tumors in the breast was simulated using Monte Carlo simulation techniques and reconstructed. The Monte Carlo package was developed in-house because commonly accepted Monte Carlo packages, such as GATE, do not support the co-existence of multiple types of PET detectors in a system. Futhermore, our Monte Carlo simulation only tracks gamma ray interaction in materials through photoelectric and Compton interactions. Therefore it has a significant speed advantage.
Annihilation sites were randomly distributed based on a given activity distribution. Back-to-back gamma photons were generated isotropically. Photon accollinearity was modeled by pivoting one of the two gamma rays around the axis of the other. The accollinearity angle was randomly sampled, distributed as a Gaussian with FWHM of 0.4 degrees. Positron range was not simulated in this study to reduce simulation time.
The gamma ray photons are tracked though multiple photoelectric and Compton interactions. The deposited energy of a gamma photon within a detector is saved, and a detection event is flagged if the deposited energy is greater than a given threshold. For this simulation, the lower energy threshold was set to 435 keV.
Initial simulation with random events showed that random events were well corrected using the delayed window technique in reconstruction. Therefore, for the simulations presented, random events were not tracked to save simulation time.
A phantom that consists of a chest and a breast was simulated to mimic a patient with breast cancer. An illustration of the phantom is shown in Figure 3. The chest was modeled as a box with dimensions 280×180×300 mm, and the breast as a hemisphere with radius 75 mm. A Derenzo-like pattern of spherical tumors with varied diameter was embedded in the breast region. The simulation was performed at tumor-to-background contrast ranging from 3:1 to 12:1 for 5 and 15 minute acquisition times. The tumors in the phantom have diameters of 2, 3, 4, 6, 8 and 12 mm (See Figure 6).
Figure 3.
Illustration of the phantom used in Monte Carlo simulations with geometry of the VP-PET half ring insert and Siemens Biograph 40 clinical scanner. The figure shows insert-insert (II), insert-scanner (IS) and scanner-scanner (SS) coincidences.
Figure 6.
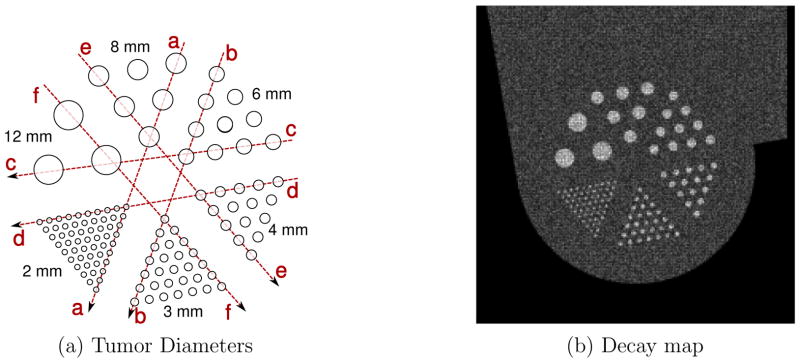
(a) Illustration of the tumor plane of the phantom used in Monte Carlo simulation, showing dotted lines for line profile analysis and (b) decay map for 2.26 minute 18F-FDG acquisition, 3:1 tumor to background ratio showing radionuclide decay
2.3.2. Imaging Setup
To mimic a patient body, an experiment was assembled with a Data Spectrum Elliptical Lung-Spine Body Phantom as the chest, with a custom acrylic cylindrical phantom as the breast (See Figure 2). The space between the chest and breast was filled with a Urethane elastomer, Skinex (BJB Enterprises Inc, CA). This compound was found to have CT attenuation similar to water. The compound was molded to fill the volume between the two phantoms.
Hollow fillable spherical glass tumors with diameters 3.3, 4.3, 6, 8, 9.6 and 11.4 mm (Pattern “1”, Figure 4) were arranged inside the breast cylindrical phantom to mimic host lesions. Another set of glass tumors was embedded within the chest phantom, to measure contrast and resolution for tumors in the axilla/mediastinum region, which was outside the high resolution image FoV. The diameters of these tumors are 3.59, 5, 6.32, 8, 9.6, 10.09 and 11.4 mm (Pattern “2”, Figure 4). The wall thickness of these glass spheres are less than 0.5 mm. The phantoms were held using a custom-made aluminum frame, attached to the patient bed.
Figure 4.
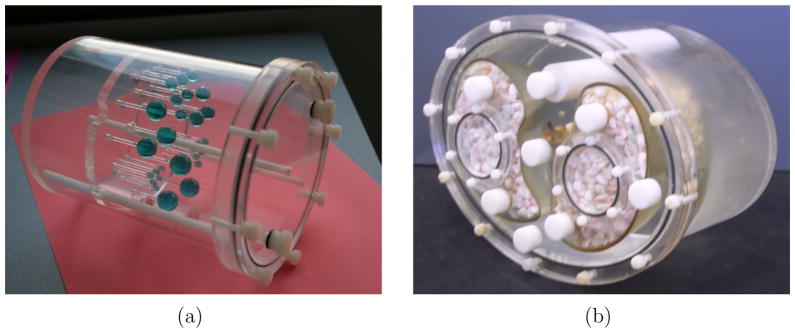
(a) Custom breast phantom with Derenzo-like pattern of spherical glass tumors (b) Data Spectrum Elliptical Lung-Spine Body Phantom
The phantoms were first scanned with the insert for 150, 150, 300, and 600 seconds for a total scan time of 20 minutes. Then, the VP-PET insert was removed, and the phantom was re-scanned in the 3 ring scanner configuration, starting at 30 minutes from the first scan. A CT scan is also performed just prior to PET acquisition in both cases for attenuation correction.
To test the performance of our system, we designed two experiments with distant tumors in two different positions within the chest phantom. In the first experiment, we placed additional tumors on the axilla region of the body. Then, to investigate the possibility of imaging tumors closer to the insert, near the region where artifacts are higher, we placed the tumors in the mediastinum.
The volume of the chest phantom and breast attachment was estimated to be 6535 cm3 and the breast was 1043 cm3 by weighing the empty phantoms before and after they had been filled with water.
For both the experiments, we followed the same dilution plan, described as follows. We targeted an input activity ratio of 6 to 1. To obtain this contrast ratio, we first diluted the activity to 650 ml, to form the main activity volume. A 10 ml sample was taken, diluted to 20 ml to form the tumor volume, and put in glass spherical tumors. 87 ml of the main activity volume was transferred to the breast attachment and 546 ml was filled in the chest phantom. Both phantoms were filled with water, sealed and allowed to mix. The final activity concentration of both breast and chest phantoms are 0.0833 times the activity concentration in the main activity volume. The activity concentration in the tumors is 0.5 times the activity concentration in the original main activity volume. Thus, the final activity ratio is 6 to 1 or the contrast ratio is 5, where
| (1) |
where Atumor is the mean activity in the tumor and Abackground is the mean activity in the background. In Monte Carlo simulation, the centers of the tumors are known. For experimental data, we determine the center of the tumors from registered CT images. The tumor Region-of-Interest (ROI) is defined as a spherical ball around the tumor center with radius equal to 0.75 times the radius of the tumor. For a particular tumor diameter, the value of voxels within the ROI’s of those tumors are averaged to obtain Atumor. The background ROI is chosen from a region in the chest or breast depending on the position of the tumor.
In both the experiments, to validate the activity concentration, we took samples of breast, chest and tumor volumes and measured the counts per minute in a well counter.
3. Results
3.1. Monte Carlo Simulation
The background activity concentration that was simulated in Monte Carlo is 0.062486 μCi/cm3 (2311 Bq/cm3). The equivalent activity is 0.064598 μCi/cm3 (2390 Bq/cm3) in 18F-FDG, considering the branching ratio. Therefore, the activity concentration in a typical human study is 2.211 times that simulated in Monte Carlo. Based on this, 5 minutes of Monte Carlo simulation is equivalent to 2.26 minutes of a typical clinical FDG study and 15 minutes simulation is equivalent to 6.78 minutes of a typical clinical FDG study.
The decay map, shown in Figure 6 b) is a recording of positron annihilation during the simulation. The figure is for the lowest acquisition scan time of 2.26 minutes of 18F-FDG. The input tumor to background ratio in this experiment was 3:1. The decay map was quantized to reconstruction voxel size of 1×1×2 mm. The smallest tumors are clearly delineated. The figure demonstrates that resolution degradation is not due to voxelization of the decay map, but because of the inherent resolution limitation of the PET scanner.
Figure 7 shows a full view of the reconstructed images from Monte Carlo simulation, for the 6.78 minute of 18F-FDG acquisition with 12:1 tumor to background ratio. The Monte Carlo simulation shows that there is potential for improvement in the image resolution in the central region, without losing the whole field of view imaging capability of a standard clinical PET scanner.
Figure 7.
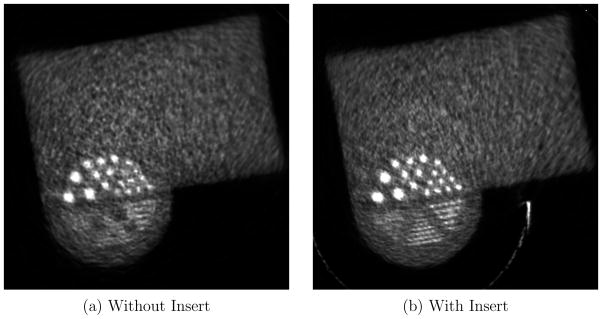
Full field of view of tumor plane slice of reconstructed phantom used in Monte Carlo simulation with 12:1 tumor-to-background ratio for 6.78 minute of 18F-FDG acquisition at 50 iterations
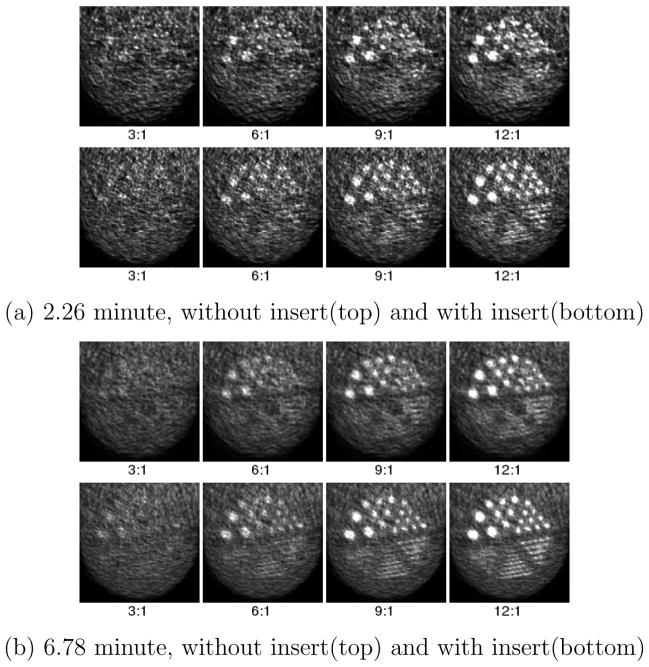
Figure 8 shows a close-up view of the breast region. This axial plane passes through the center of the reconstructed spherical tumors. Figure 8 (a) is equivalent to 2.26 minutes of a typical human study scan using 18F-FDG. The reconstructed images without and with insert are shown in the top and bottom row respectively. There is a clear improvement in resolution when the VP-PET insert is present. With the 2.26 minute acquisition, the scanner without insert can only distinguish tumors with 6 mm diameter when the tumor to background ratio is 12:1. With the VP-PET insert, we are able to detect tumors of the same size at lower tumor to background ratios of 6:1. Alternatively, the VP-PET insert can detect 4 mm diameter tumors if the tumor to background ratio is 12:1.
Figure 8.
Closeup view of the Derenzo-like pattern in the phantom used in Monte Carlo simulation at 2.26 minute and 6.78 minute acquisition with 18F-FDG, and 3:1, 6:1, 9:1 and 12:1 tumor to background ratio
Figure 8 (b) is equivalent to 6.78 minutes of a typical human study with 18F-FDG. Comparing the two separate acquisition times with the same tumor to background ratio of 9:1, 6 mm tumors are distinguishable only in the 6.78 minute scan time set without insert. With the insert, they are easily identifiable at 2.26 minutes. This points to the possibility of reduction of patient scan time or dose reduction when utilizing the VP-PET insert.
Contrast recovery curves are shown for 2.26 and 6.78 minute acquisition for different tumor to background contrast ratios in Figure 9, where
Figure 9.
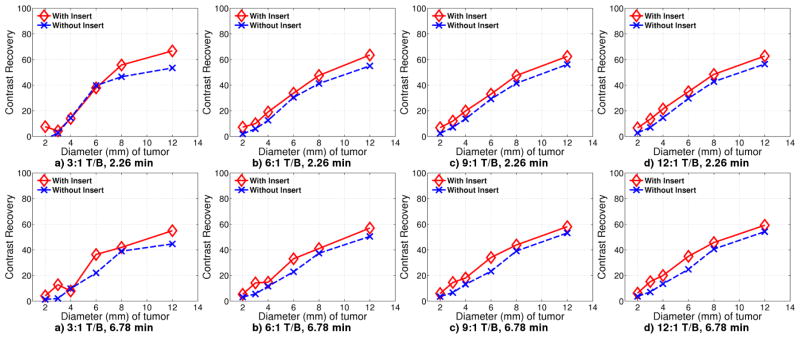
Contrast recovery curves for Monte Carlo simulation with 18F-FDG acquisition for 2.26 minutes with Tumor/Background ratio of a) 3:1 b) 6:1 c) 9:1 d) 12:1, and 6.78 minutes with Tumor/Background ratio of e) 3:1 f) 6:1 g) 6:1 h) 12:1
| (2) |
where Cinput is the input contrast and Coutput is the output contrast.
Although tumor sizes of 3 mm and 4 mm diameter are unresolvable for 6.78 minute acquisition with contrast ratio 9:1 and below, the contrast recovery curve is unaffected. The 3:1 contrast ratio at 2.26 minutes is severely data limited, causing higher error rates. There is no improvement with insert until the tumor diameter reaches 8 mm.
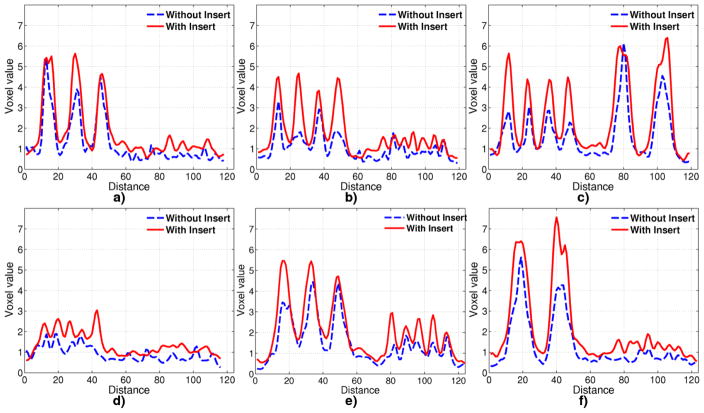
To better visualize improvement in resolution, line profiles are extracted through the tumor centers as shown in Figure 6. The line profiles from the 6.78 minute acquisition and 12:1 tumor to background ratio are shown in Figure 10. For these values, the component based normalization procedure during reconstruction is designed such that the background with insert and without insert are scaled to the same background concentration of 1.0. That is, post reconstruction scaling is not done for the Monte Carlo studies. For the largest 3 tumors, of 6, 8 and 12 mm diameter, the profiles from the VP-PET system have higher peak-to-valley ratio. Profile with insert for 12 mm diameter tumor show at top, while the profile is still spiked without the insert. Profiles in Figure 10 b) and f) establish that 3 mm tumors are resolvable with the insert, but not without insert. The smallest 2 mm diameter tumor is not resolvable with or without insert.
Figure 10.
Line profile through tumors in images reconstructed from Monte Carlo simulation for 6.78 minute acquisition with 18F-FDG through lines shown in Figure 6
Figure 8 b) and 10 show that the resolution from Monte Carlo simulation without insert on the standard clinical scanner is between 4 and 6 mm, whereas with the insert, the resolution is improved to between 2 and 3 mm. Note that the resolution improvement is for the central region of the system. Away from the center, the improvement has not been validated using Monte Carlo.
3.2. Experimental Results
3.2.1. Experiment 1
Samples of 1 cm3 were taken from the chest phantom, breast attachment, and tumor volume, and counted in a well counter for 1 minute each. From the results, the tumor to chest background activity ratio is 5.89:1 and tumor to breast background activity ratio is 6.7:1.
For this experiment, the original activity was 3.94 mCi (145.78 MBq) of 64Cu at the start of the scan with the insert. The activity concentration in the background is approximately 0.5051 μCi/cm3 (18688.7 Bq/cm3) of 64Cu. Correcting for the branching fraction, this is equivalent to 0.0919 μCi/cm3 (3400 Bq/cm3) of 18F. This is approximately 0.6427 times the activity concentration in a typical patient scan. Another view is that the 5 (or 15) minute acquisition in the phantom imaging experiment is equivalent to 3.2 (or 9.64) minutes of the typical clinical FDG scan.
Figure 11 show the reconstructed images in the tumor plane for a 12.85 minute acquisition, reconstructed with 50 iterations. The insert improves image resolution for tumors in both the breast and the axilla. However, the images with the insert show some streaking artifacts on the right corner of the phantom. These artifacts are caused by heavy attenuation of Lines-of-Response(LOR) between scanner detectors passing through multiple crystal volumes in the insert. For all image voxels along those LORs, there is no or very low data collected along the direction of the LOR. Additionally, the LOR attenuation varies drastically if it passes through gaps in the insert crystal array as opposed to passing through the crystal. As a result, even a slight misalignment between the expected position of the insert and actual position can cause artifacts.
Figure 11.
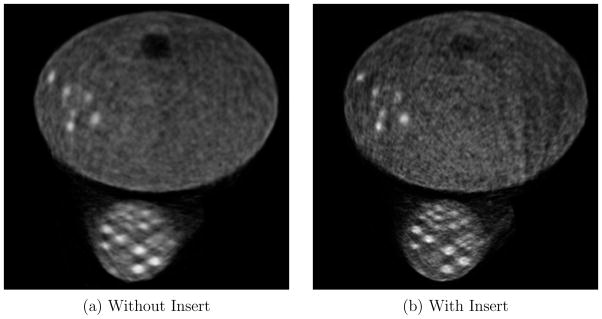
Experiment 1: Full field of view of tumor plane, for 12.85 minute acquisition with 18F-FDG, reconstructed at 50 iterations
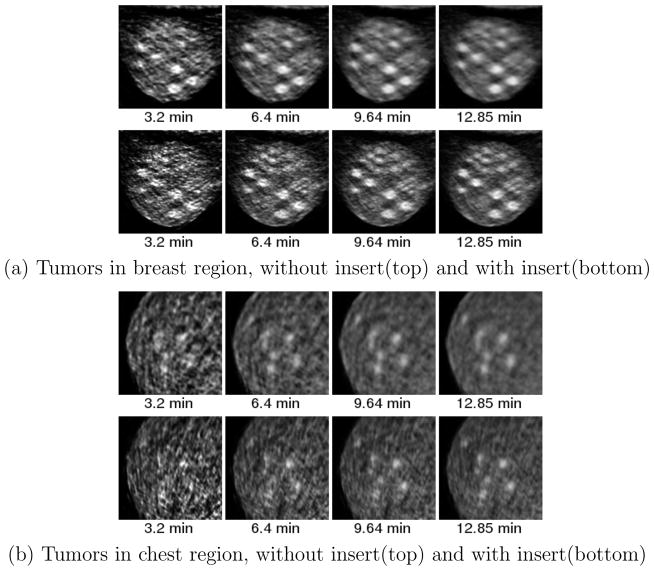
Figure 5 illustrates the locations and the diameters of the tumors in the breast and chest region. Figure 12 shows the close-up images of (a) the breast region and (b) the axilla region for different acquisition times.
Figure 5.

(a) and (b) Two spherical glass sphere patterns with diameter of the corresponding tumors in mm. The photograph of Pattern “1” can be seen in Figure 4 Left). Dotted lines are drawn through the tumors to show the cuts for line profiles in the results section. Illustration of experimental setup for experiments 1 (c) and 2 (d), showing the arrangement of the Data Spectrum Elliptical Lung-Spine Body Phantom with Breast attachment with Skinex spacer in between is also shown. The glass sphere patterns, “1” and “2”, are arranged in different locations and orientations in the breast attachment and chest phantom for both experiments.
Figure 12.
Zoomed image of breast and axilla tumors for experiment 1 at a) 3.2 minute b) 6.4 minute c) 9.64 minute d) 12.85 minute 18F-FDG. Top row is without insert and bottom row is with insert
Figure 13 shows contrast recovery curves for tumors in breast and axilla for 3.2, 6.4, 9.64 and 12.85 minutes of acquisition. For breast tumors, the background is chosen to be a uniform region in the breast, and for chest tumors, the background is chosen in the chest. The contrast recovery plots were scaled after reconstruction such that the background is 1.0.
Figure 13.
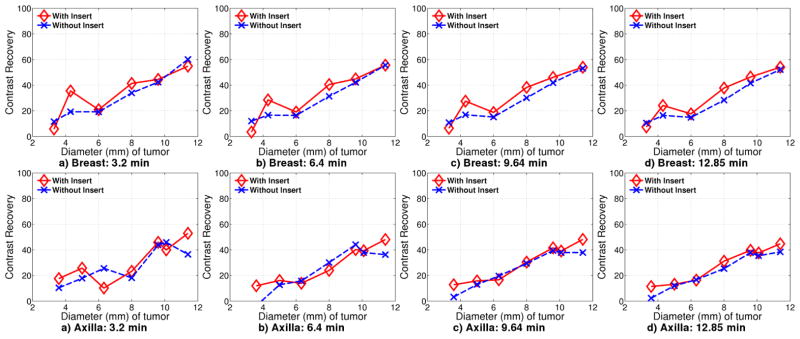
Contrast recovery curves for Experiment 1 for tumors located in breast and chest at a) 3.2 minute b) 6.4 minute c) 9.64 minute d) 12.85 minute
For breast tumors, the contrast recovery with the insert is consistently better than without the insert, especially at longer scan times. The contrast recovery for 3.3 mm diameter tumors with the insert is lower than contrast recovery without the insert. These tumors are not resolvable regardless of whether the insert is used.
In the graphs, 6 mm and 11.4 mm diameter tumors have only minimal improvement with the insert. The 6 mm diameter tumors are located near the center of scanner FoV where the scanner image resolution is the highest. For the insert images, these tumors are located in the top of the high resolution region in the FoV where the improvement is due to insert-scanner data only, and not due to insert-insert data. In contrast, the 4.3 mm tumors are located in a region that will have II, IS and SS data, leading to better contrast recovery. For the 11.4 mm diameter tumors, contrast recovery is almost same for with and without insert as expected since the scanner is adequate for resolving these larger tumors.
For tumors in axilla, there is almost no difference in contrast recovery between the two cases, with or without the insert, especially at long scan times. These tumors are far from the insert high resolution FoV and the performance is determined mostly by scanner-scanner (SS) coincidence data.
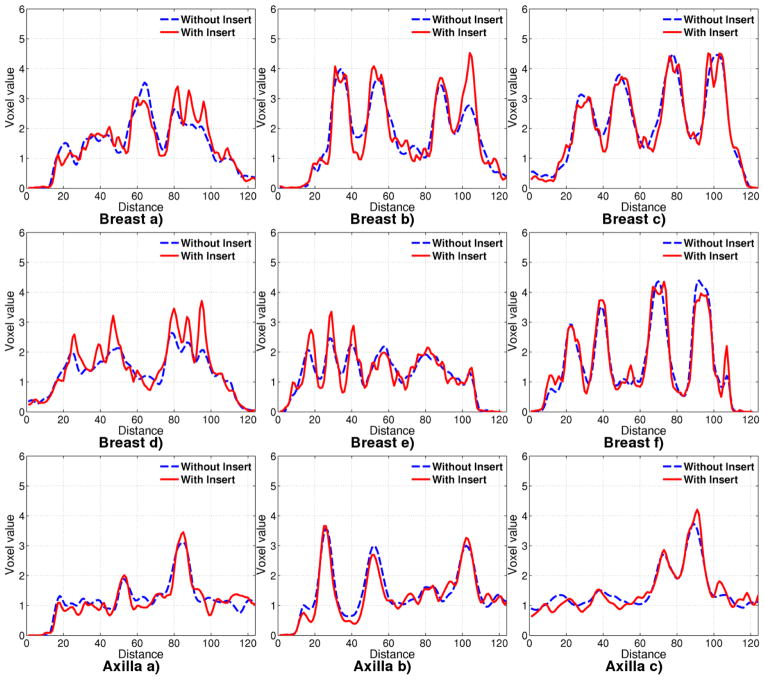
Line profiles, as shown by red lines in Figure 5, are drawn through the phantom on the axial plane containing all the tumors in Figure 14. The profiles are scaled post reconstruction such that the background, as measured in breast and chest, is at 1.0.
Figure 14.
Line profiles in Experiment 1 drawn through tumors located in breast and chest for 12.85 minute acquisition.
In the breast, the larger diameter tumors (especially the 11.4 mm tumor) exhibit matched line profiles regardless of use of the insert, just as in contract recovery (Figure 14 c and f). Using the insert provides a slight improvement in resolution for tumors of diameters 8 mm and 9.6 mm. The improvement is markedly better for tumors of 4.3 and 6 mm diameter. For the 6 mm diameter tumor, the line profiles are much better with insert although the contrast recovery is almost the same. For these tumors, images obtained with insert has higher peak-to-valley ratio than images obtained without the insert. The contrast recovery curve with insert, computed using mean tumor ROI, is brought down due to the spiky nature of the tumor reconstruction.
For the 3.3 mm diameter tumor, there is little difference with and without the insert, except that the noise with the insert has higher frequency content than without the insert. This is because of the higher spatial frequency sampling from II and IS lines passing through this tumor.
For tumors in the axilla region, the profiles with and without insert are almost similar, although tumor peaks are slightly better resolved than without insert. As already mentioned, this is not surprising because the axilla performance is determined by SS coincidence data which is largely independent of the insert.
3.2.2. Experiment 2
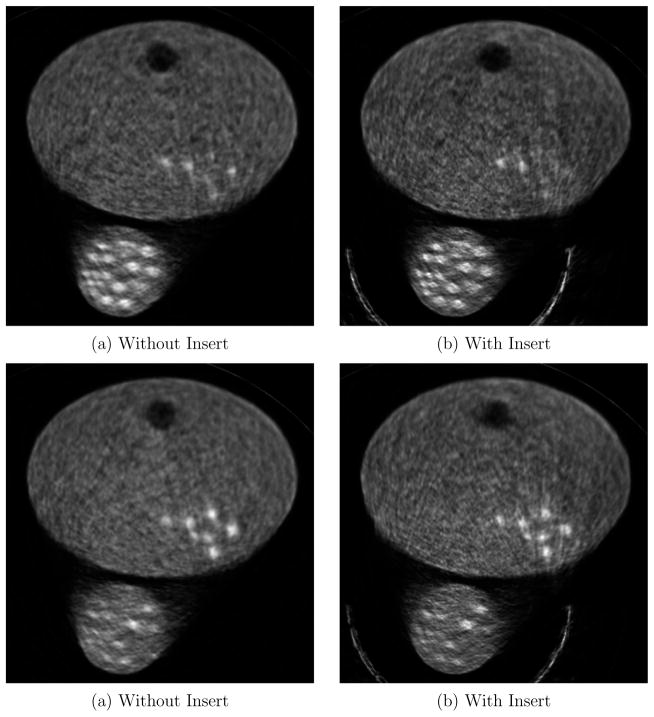
Experiment 1 showed artifacts along lines emanating from one corner of the insert. To test the performance of the system when tumors are in that region, we placed tumors in the chest region next to the insert, and repeated the experiment. This is the expected position of mediastinal tumors and lymph nodes.
As in experiment 1, we took samples of 1 cm3 from the breast, chest and tumor volume and measured it in a well counter. The measured ratio of tumor to chest background activity is 7.27:1 and tumor to breast background activity is 6.19:1.
The approximate total activity in breast, chest and tumors at the beginning of scan was 6.5 mCi (240.5 MBq) of 64Cu. The activity concentration in the background is approximately 0.833 μCi/cm3 (30821 Bq/cm3)of 64Cu. Correcting for the branching fraction, this is equivalent to 0.152 μCi/cm3 (5624 Bq/cm3) of 18F, which is about 1.06 times the activity concentration in a typical patient study of 0.143 μCi/cm3 (5291 Bq/cm3) of 18F. Therefore, a 5 (or 15) minute acquisition of the experiment is equivalent to 5.3 (or 15.9) minutes of a typical patient scan.
The full field of view reconstructed images are shown in Figure 15. For this experiment, we were unable to position all the tumors in the same axial plane. Therefore, two slices 6 mm apart are shown, one centered at tumors in the breast, and the other centered at tumors in the chest region. The half ring insert has one crystal gap at the axial center of the system between two insert half rings, where the insert performance is slightly degraded due to missing in-plane coincidence data. For this experiment, the axial slice with missing in-plane coincidence data lies between the slice with breast tumors and chest tumors that are shown.
Figure 15.
Experiment 2: Full field of view of tumor plane, for 21.2 minute acquisition, reconstructed at 50 iterations. The top row is a slice centered in Breast tumor plane. The bottom row is a slice centered in Mediastinal tumor plane.
Figure 17 shows contrast recovery curves for breast and chest tumors. The contrast recovery for breast tumors is slightly better with insert than without. However, this is not always true in the chest region due to the location of the tumors.
Figure 17.
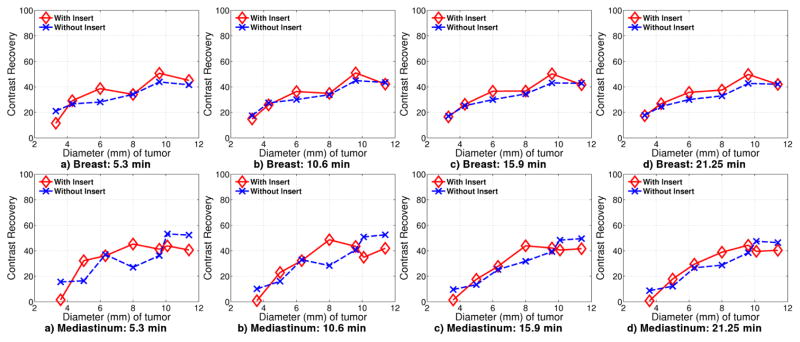
Contrast recovery curves for Experiment 2 for tumors located in breast and chest at a) 5.3 minute b) 10.6 minute c) 15.9 minute d) 21.2 minute
The 8 mm diameter tumor in breast is above the high resolution imaging region, but is still covered by IS data. IS LORs passing through this region originate from the left corner of the insert and pass through a large portion of the chest phantom. This could explain the lower contrast recovery. In experiment 1, the 6 mm breast tumors are in the same location and show a similar dip in the contrast recovery.
Tumors of diameter 3.3 mm are not resolvable with or without insert. The 4.3 mm diameter tumor is also above the higher resolution region provided by the insert, and further more, close to the chest phantom.
For tumors in the mediastinal region, the tumors have better contrast recovery for sizes between 5 mm and 8 mm. The tumor of diameter 6.32 mm has contrast recovery with the insert almost equal to that without the insert. The largest two tumors of diameter 11.4 mm and 9.6 mm have worse contrast recovery with the insert than without the insert. This could be due to the position of one of the 9.6 mm and the 11.4 mm tumors, at the right most edge of the phantom. The region here is sampled by the side surface of the crystal that is 5 mm long and as such, image reconstruction is expected to be worse in this region.
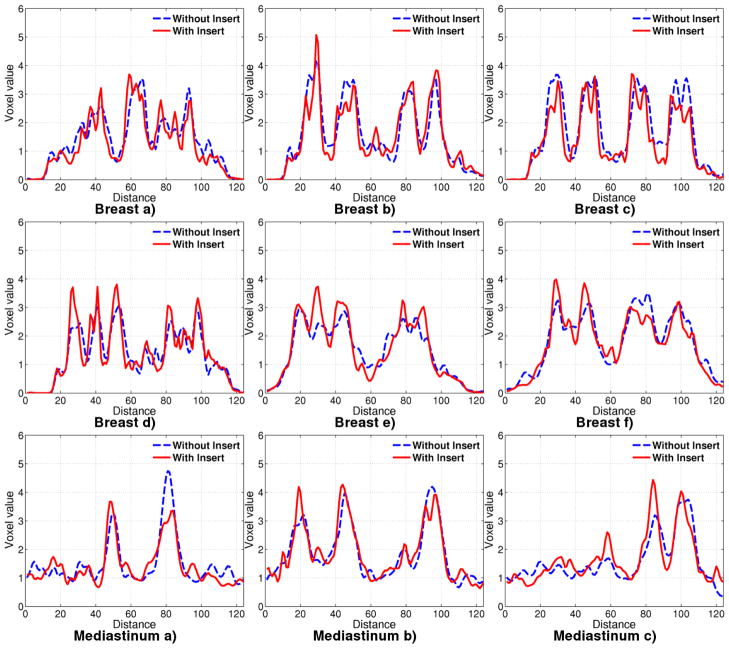
In Figure 18, the line profiles are drawn through lines as depicted in Figure 5, for 21.2 minutes of acquisition. Although 3.3 mm tumors are not all resolvable with or without the insert, those tumors along the horizontal direction, are individually distinguishable as seen in line profile Breast (a). This could be attributed to the fact that we have better horizontal resolution in this area due to IS lines of response.
Figure 18.
Line profiles in Experiment 2 drawn through tumors located in breast and chest for 21.2 minute acquisition.
Tumors of 4.3 mm diameter are also distinguishable in the profile plot through Breast a), but not all distinguishable in d). The tumors of 6 mm diameter are clearly distinguishable with the insert in profiles d) and e). The largest tumors of diameter 9.6 mm and 11.4 mm have similar performance with and without the insert.
The line profiles through the mediastinal tumors placed close to the insert edge, in the chest, show that it is possible to obtain good resolution recovery. For the 10.09 mm diameter tumor placed away from the insert, the profile with the insert does not perform as well as without the insert. However, a 5 mm diameter tumor is clearly distinguishable with the insert in profile c), but not without the insert.
4. Discussion
In this paper, we have extended our existing half ring VP-PET insert for breast cancer imaging applications. The VP-PET insert improves image resolution locally. This enables us to detect smaller tumors and lymph nodes that was unresolvable without insert. The contrast recovery is also improved for tumors close to the insert, which helps in better quantification. Addition of the VP-PET insert is not at the price of whole body imaging capability. Along with proving higher resolution local imaging capability, we have learned additional insights in design of asymmetric PET systems in order to avoid artifacts. This work portends highly flexible and customizable PET imaging.
Whereas in the past, PET imaging was restricted to factory set design, the new paradigm enables clinicians to customize the acquisition geometry to obtain optimal images based on known data about the disease. Such systems would enable physicians to zoom in to the specific regions by changing the geometry of the scanning system. The main problems that need to be solved for having a flexible system are the automatic or manual positioning of the detectors next to a patient, and precise telemetry to determine the location of the detectors. Our group is investigating the first of such imaging systems, with an adjustable and modular at panel insert system.
Building such systems requires redevelopment of detector systems and their associated read out circuitry, along with better data processing electronics. SiPM based detectors offer small packaging and modularity, eliminating the need for bulky PMT’s. Newer electronics technologies such as the Siemens QuickSilver system [30], based on a ring topology for system electronics offers a scalable architecture for such systems.
Having an insert with highly attenuating detectors in the field of view, requires more advanced reconstruction techniques. Certain assumptions, often made in conventional systems, no longer hold. This is the case especially when one line of response overlaps a detector crystal. In our study, we have seen that multiple lines of response attenuated along a certain direction, passing through multiple insert crystals, create artifacts along that direction. Different techniques to correct the artifacts were explored, including using component based normalization from multiple phantom positions, and removing those lines of response completely. They were not successful in reducing the artifacts. Either smarter design of insert systems such that the body being imaged is not affected by such lines or specialized correction techniques in reconstruction such as filling in incomplete data through interpolation in data space is necessary. Despite the presence of artifact in some region of the FoV, the images may still be useful clinically as long as the physicians understand the source of the artifact and limitations of the system.
Although a regularization based on the log-cosh function was chosen, it is not the optimal choice. The parameters that were chosen were global across the image space. The combination of high and low resolution regions in the reconstructed image suggest a spatially variant regularization as a better alternative. Optimization of regularization function is beyond the scope of this work and is left for future study.
Currently, the reconstruction code does not model photon accollinearity or positron range effects. The modeling is important for a more accurate reconstruction code. Another option is to de-blur the final reconstructed image with measured point spread function, as was implemented in Siemens HD-PET technology. Potentially, these improvements would enable even higher resolution.
Further down the chain, strides have to be made in image reconstruction algorithms, which reconstruct PET data for arbitrary systems in a timely fashion. Currently, reconstruction takes approximately 72 hours to complete. To be useful in the clinic, reconstruction time has to cut down to the order of minutes instead of hours or days. The implementation in this paper does not include an ordered subsets approach. Although the reconstruction algorithms we have used are iterative in nature, the multiply-add nature of the forward and backward projection enable simple parallelization. The current code is parallelized using OpenMP and runs on x86 based systems. The goal of real time image reconstruction might involve taking advantage of newer technological developments such as GPU computing or Intel’s Many Integrated Core architecture.
The weights for the projections are stored in look up tables on the disk. Although compressed for symmetry, the size of the look up table is still substantially large. Future research would involve investigation into on-the-fly computation of the system matrix, compression of the system matrix or a combination of both as was done by Zhou and Qi [31].
5. Conclusion
We have proven our hypothesis that placing a high resolution insert in the field of view of a PET scanner can improve its image resolution within a selected FoV without compromising its whole body imaging capability. Although Monte Carlo simulation predicts up to 3 mm tumor detectability with the prototype half-ring insert, the experimental tumor detectability with 6:1 input tumor to background ratio was limited to 4.3 mm. This discrepancy could be the result of imperfect construction of the real system or incomplete physics model used in the Monte Carlo simulation. Nevertheless, resolution improvement can be seen from both types of studies using the insert system.
The addition of the VP-PET half ring insert into the scanner introduces minor artifacts in the reconstructed images. The artifacts could be due to attenuation of coincidence gamma rays along certain lines passing through heavily attenuating regions of the insert or due to slight mismatch between the geometry used in reconstruction and the real system.
The capability of the system to maintain the imaging FoV to include breast tissues as well as axillary and mediastinal lymph nodes has been shown. For tumors in the axilla, there is not significant difference in system performance with or without the insert because the tumors were located far away from the insert due to the system geometry. For mediastinal tumors, depending on the location, an improvement in contrast recovery and resolution can be seen. The closer the tumor is to the insert, better the resolution and contrast recovery.
Figure 16.
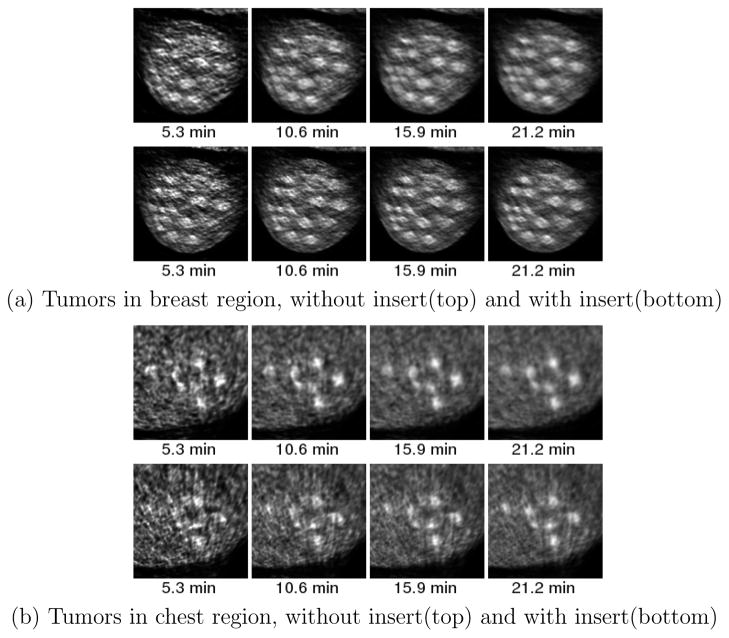
Zoomed image of breast and mediastinal tumors for experiment 2 at a) 5.3 minute b) 10.6 minute c) 15.9 minute d) 21.2 minute. Top row is without insert and bottom row is with insert
Acknowledgments
This work is supported in part by the National Cancer Institute of the National Institutes of Health (grant R33-CA110011) and by Susan G. Komen for the Cure (grant BCTR0601279). We would also like to thank the Fashion Footwear Charitable Foundation, Inc and the Alvin J. Siteman Cancer Center at Washington University School of Medicine and Barnes-Jewish Hospital in St. Louis, MO for their support. The Siteman Cancer Center is supported in part by an NCI Comprehensive Cancer Center Support Grant #P30 CA91842.
Computations were performed using the facilities of the Washington University Center for High Performance Computing, which were partially provided through grant NCRR 1S10RR022984-01A1.
References
- 1.Howlader N, Noone AM, Krapcho M, Neyman N, Aminou R, Altekruse SF, Kosary CL, Ruhl J, Tatalovich Z, Cho H, Mariotto A, Eisner MP, Lewis DR, Chen HS, Feuer EJ, Cronin KA, editors. SEER Cancer Statistics Review, 1975–2009 (Vintage 2009 Populations) National Cancer Institute; Bethesda, MD: [Google Scholar]
- 2.American Cancer Society. National Cancer Data Base. Technical report. 2005 [Google Scholar]
- 3.American Cancer Society. Breast cancer survival rates by stage. 2012 [Google Scholar]
- 4.Avril N, Dose J, Janicke F, Bense S, Ziegler S, Laubenbacher C, Romer W, Pache H, Herz M, Allgayer B, Nathrath W, Graeff H, Schwaiger M. Metabolic Characterization of Breast Tumors With Positron Emission Tomography Using F-18 Flurodeoxyglucose. Journal of Clinical Oncology. 1996;14(6):1848–1857. doi: 10.1200/JCO.1996.14.6.1848. [DOI] [PubMed] [Google Scholar]
- 5.Avril N, Rosé Ca, Schelling M, Dose J, Kuhn W, Bense S, Weber W, Ziegler S, Graeff H, Schwaiger M. Breast imaging with positron emission tomography and fluorine-18 fluorodeoxyglucose: use and limitations. Journal of clinical oncology. 2000 Oct;18(20):3495–3502. doi: 10.1200/JCO.2000.18.20.3495. [DOI] [PubMed] [Google Scholar]
- 6.Henson Donald Earl, Ries Lynn A. Progress in early breast cancer detection. Cancer. 1990 May;65(9 Suppl):2155–8. doi: 10.1002/1097-0142(19900501)65:9+<2155::aid-cncr2820651412>3.0.co;2-o. [DOI] [PubMed] [Google Scholar]
- 7.Thompson CJ, Murthy K, Weinberg Irving N, Mako F. Feasibility study for positron emission mammography. Medical Physics. 1994;21(4):529–38. doi: 10.1118/1.597169. [DOI] [PubMed] [Google Scholar]
- 8.Rosen Eric L, Turkington Timothy G, Soo Mary Scott, Baker Jay a, Edward Coleman R. Detection of primary breast carcinoma with a dedicated, large-field-of-view FDG PET mammography device: initial experience. Radiology. 2005 Feb;234(2):527–534. doi: 10.1148/radiol.2342040654. [DOI] [PubMed] [Google Scholar]
- 9.Doshi Niraj K, Shao Yiping, Silverman Robert W, Cherry Simon R. Design and evaluation of an LSO PET detector for breast cancer imaging. Medical physics. 2000 Jul;27(7):1535–1543. doi: 10.1118/1.599019. [DOI] [PubMed] [Google Scholar]
- 10.Doshi Niraj K, Silverman Robert W, Shao Yiping, Cherry Simon R. maxPET, a dedicated mammary and axillary region PET imaging system for breast cancer. IEEE Transactions on Nuclear Science. 2001 Jun;48(3):811–815. [Google Scholar]
- 11.Abreu Maria C, Aguiar João D, Almeida Fernando G, Almeida Pedro, Bento Pedro, Carriço Bruno, Ferreira Miguel, Ferreira Nuno C, Gonçalves Fernando, Leong Carlos, Lopes Filipe, Lousã Pedro, Martins Mónica V, Matela Nuno, Mendes Pedro R, Moura Rui, Nobre João, Oliveira Nuno, Ortigão Catarina, Peralta Luís, Pereira Rui, Rego Joel, Ribeiro Rui, Rodrigues Pedro, Sampaio José, Santos Ana I, Silva Luís, Silva José C, Sousa Patrick, Teixeira Isabel C, Teixeira João P, Trindade Andreia, Varela João. Design and Evaluation of the Clear-PEM Scanner for Positron Emission Mammography. IEEE Transactions on Nuclear Science. 2006;53(1):71–77. [Google Scholar]
- 12.Camarda Manuela, Belcari Nicola, Guerra Alberto Del, Galeotti Stefano, Morsani Fabio, Herbert Deborah J, Vaiano Angela. Development of the YAP-PEM scanner for breast cancer imaging. Physica medica. 2006 Jan;21(Suppl 1):114–116. doi: 10.1016/S1120-1797(06)80040-2. [DOI] [PubMed] [Google Scholar]
- 13.Zhang Jin, Olcott Peter D, Chinn Garry, Foudray Angela MK, Levin Craig S. Study of the performance of a novel 1 mm resolution dual-panel PET camera design dedicated to breast cancer imaging using Monte Carlo simulation. Medical Physics. 2007;34(2):689–702. doi: 10.1118/1.2409480. [DOI] [PMC free article] [PubMed] [Google Scholar]
- 14.MacDonald Lawrence, Edwards John, Lewellen Thomas, Haseley David, Rogers James, Kinahan Paul E. Clinical imaging characteristics of the positron emission mammography camera: PEM Flex Solo II. Journal of nuclear medicine. 2009 Oct;50(10):1666–1675. doi: 10.2967/jnumed.109.064345. [DOI] [PMC free article] [PubMed] [Google Scholar]
- 15.Wu Heyu, Pal Debashish, Song Tae Yong, O’Sullivan Joseph A, Tai Yuan-Chuan. Micro insert: a prototype full-ring PET device for improving the image resolution of a small-animal PET scanner. Journal of nuclear medicine. 2008;49(10):1668–1676. doi: 10.2967/jnumed.107.050070. [DOI] [PMC free article] [PubMed] [Google Scholar]
- 16.Wu Heyu, Pal Debashish, O’Sullivan Joseph A, Tai Yuan-Chuan. A feasibility study of a prototype PET insert device to convert a general-purpose animal PET scanner to higher resolution. Journal of nuclear medicine. 2008 Jan;49(1):79–87. doi: 10.2967/jnumed.107.044149. [DOI] [PubMed] [Google Scholar]
- 17.Park Sang-June, Leslie Rogers W, Clinthorne Neal H. Design of a very high-resolution small animal PET scanner using a silicon scatter detector insert. Physics in medicine and biology. 2007 Aug;52(15):4653–4677. doi: 10.1088/0031-9155/52/15/019. [DOI] [PubMed] [Google Scholar]
- 18.Clinthorne Neal H, Park Sang-June, Leslie Rogers W, Chiao Ping-Chun. Multi-resolution image reconstruction for a high-resolution small animal PET device. IEEE Nuclear Science Symposium Conference Record. 2003;3:1997–2001. [Google Scholar]
- 19.Zhou Jian, Qi Jinyi. Theoretical analysis and simulation study of a high-resolution zoom-in PET system. Physics in medicine and biology. 2009 Sep;54:5193–5208. doi: 10.1088/0031-9155/54/17/008. [DOI] [PubMed] [Google Scholar]
- 20.Zhou Jian, Qi Jinyi. Adaptive imaging for lesion detection using a zoom-in PET system. IEEE transactions on medical imaging. 2011 Jan;30(1):119–130. doi: 10.1109/TMI.2010.2064173. [DOI] [PMC free article] [PubMed] [Google Scholar]
- 21.Huh Sam S, Leslie Rogers W, Clinthorne Neal H. Real time image reconstruction using GPUs for a surgical PET imaging probe system. 2009 IEEE Nuclear Science Symposium Conference Record (NSS/MIC); October 2009.pp. 4148–4153. [Google Scholar]
- 22.Miyaoka Robert S, Li Xiaoli, William CJ, Hunter Eric Yuan, Lewellen Thomas. Design of a time-of-flight PET imaging probe. IEEE Nuclear Science Symposium Conference Record; 2011. pp. 3661–3664. [Google Scholar]
- 23.Delfino Evan P, Majewski Stan, Raylman Raymond R, Stolin Alexander. Towards 1mm PET resolution using DOI modules based on dual-sided SiPM readout. Nuclear Science Symposium Conference Record (NSS/MIC); October 2010.IEEE; pp. 3442–3449. [Google Scholar]
- 24.Wu Heyu, Song Tae Yang, Pal Debashish, Keesing Daniel B, Komarov Sergey A, O’Sullivan Joseph A, Tai Yuan-Chuan. A high resolution PET insert system for clinical PET/CT scanners; Nuclear Science Symposium Conference Record; 2008. pp. 5442–5444. [Google Scholar]
- 25.Pal Debashish, O’Sullivan Joseph A, Wu Heyu, Janecek Martin, Tai Yuan-Chuan. 2D linear and iterative reconstruction algorithms for a PET-insert scanner. Physics in medicine and biology. 2007 Jul;52(14):4293–310. doi: 10.1088/0031-9155/52/14/018. [DOI] [PubMed] [Google Scholar]
- 26.Huesman Ronald H, Klein Gregory J, Moses William W, Qi Jinyi, Reutter Bryan W, Virador Patrick RG. List-mode maximum-likelihood reconstruction applied to positron emission mammography (PEM) with irregular sampling. IEEE transactions on medical imaging. 2000 May;19(5):532–537. doi: 10.1109/42.870263. [DOI] [PubMed] [Google Scholar]
- 27.Komarov Sergey A, Wu Heyu, Keesing Daniel B, O’Sullivan Joseph A, Tai Yuan-Chuan. Compton Scattering in Clinical PET/CT With High Resolution Half Ring PET Insert Device. IEEE Transactions on Nuclear Science. 2010 Jan;57(3):1045–1051. doi: 10.1109/TNS.2010.2046754. [DOI] [PMC free article] [PubMed] [Google Scholar]
- 28.Bai Bing, Li Q, Holdsworth CH, Asma E, Tai Yuan-Chuan, Chatziioannou Arion F, Leahy Richard M. Model-based normalization for iterative 3D PET image reconstruction. Physics in medicine and biology. 2002 Aug;47(15):2773–2784. doi: 10.1088/0031-9155/47/15/316. [DOI] [PubMed] [Google Scholar]
- 29.Keesing Daniel B, Mathews Aswin, Komarov Sergey A, Wu Heyu, Song Tae Yong, O’Sullivan Joseph A, Tai Yuan-Chuan. Image reconstruction and system modeling techniques for virtual-pinhole PET insert systems. Physics in medicine and biology. 2012 May;57(9):2517–2538. doi: 10.1088/0031-9155/57/9/2517. [DOI] [PMC free article] [PubMed] [Google Scholar]
- 30.Newport DF, Siegel SB, Swann BK, Atkins BE, Mcfarland AR, Pressley DR, Lenox MW, Nutt RE. QuickSilver: A Flexible, Extensible, and High-Speed Architecture for Multi-Modality Imaging. IEEE Nuclear Science Symposium Conference Record; 2006. pp. 2333–2334. [Google Scholar]
- 31.Zhou Jian, Qi Jinyi. Fast and efficient fully 3D PET image reconstruction using sparse system matrix factorization with GPU acceleration. Physics in Medicine and Biology. 2011 Oct;56(20):6739–6757. doi: 10.1088/0031-9155/56/20/015. [DOI] [PMC free article] [PubMed] [Google Scholar]


