Abstract
Chromodomain helicase DNA binding protein 5 (CHD5) was previously proposed to function as a potent tumor suppressor by acting as a master regulator of a tumor-suppressive network. CHD5 is down-regulated in several cancers, including leukemia and is responsible for tumor generation and progression. However, the mechanism of CHD5 down-regulation in leukemia is largely unknown. In this study, quantitative reverse-transcriptase polymerase chain reaction and western blotting analyses revealed that CHD5 was down-regulated in human leukemia cell lines and samples. Luciferase reporter assays showed that most of the baseline regulatory activity was localized from 500 to 200 bp upstream of the transcription start site. Bisulfite DNA sequencing of the identified regulatory element revealed that the CHD5 promoter was hypermethylated in human leukemia cells and samples. Thus, CHD5 expression was inversely correlated with promoter DNA methylation in these samples. Treatment with DNA methyltransferase inhibitor 5-aza-2′-deoxycytidine (DAC) activates CHD5 expression in human leukemia cell lines. In vitro luciferase reporter assays demonstrated that methylation of the CHD5 promoter repressed its promoter activity. Furthermore, a chromatin immunoprecipitation assay combined with qualitative PCR identified activating protein 2 (AP2) as a potential transcription factor involved in CHD5 expression and indicated that treatment with DAC increases the recruitment of AP2 to the CHD5 promoter. In vitro transcription-factor activity studies showed that AP2 over-expression was able to activate CHD5 promoter activity. Our findings indicate that repression of CHD5 gene expression in human leukemia is mediated in part by DNA methylation of its promoter.
Introduction
Previous studies report that tumors and cell lines commonly harbor deletions in genes that encode proteins protecting against malignancy. For example, a deletion in human chromosome 1p36, first reported for a neuroblastoma in 1977 [1], has been associated with cancer. This discovery precipitated a rush of studies demonstrating that 1p36 is deleted in a broad range of human cancers, including those of neural, epithelial and hematopoietic origin. Neural-related malignancies associated with 1p36 deletion include neuroblastoma [1], [2], [3], meningioma [4], melanoma [5], pheochromocytoma [6] and oligodendroglioma [7]. 1p36 deletions are also associated with hematopoietic malignancies, including acute myelogenous leukemia (AML) [8], chronic myelogenous leukemia (CML) [9] and non-Hodgkin’s lymphoma [10], as well as with epithelial malignancies, including those of the thyroid [11], colon [12], cervix [13] and breast [14]. These data suggest that one or more tumor suppressor genes located in 1p36 are lost or inactivated in a variety of human cancers.
Based on sequence similarity with members of the chromodomain superfamily of proteins, the human chromodomain helicase DNA binding protein 5 (CHD5) is believed to function as a chromatin remodeling protein [15]. CHD5 is one of nine members of the family, which are characterized the unique combination of chromatin organizing modulator, helicase and DNA-binding domains. In addition, CHD5, CHD3 and CHD4 also have plant homeodomain (PHD) motifs [16].
CHD3 and CHD4 are components of the nucleosome remodeling complex; an assembly of proteins that remodels chromatin by sliding nucleosomes out of the way, thereby providing polymerase with the access needed to activate gene expression. Other than this homology between CHD5 and previously described chromatin remodeling proteins, little functional data existed for this protein. Further supporting the role of CHD5 in cancer, the mouse Chd5 has been identified as a tumor suppressor.
CHD5 expression has been shown to be epigenetically silenced by promoter hypermethylation in a variety of human cancers, including neuroblastomas [17], colorectal cancer [18], breast cancer [19], cervix cancer [19], hepatocarcinoma [19], gastric cancer [20] and lung cancer [21]. In addition, CHD5 mutations have been implicated in head and neck squamous cell carcinoma [22], human prostate cancer [23], ovarian cancer [24], ovarian clear cell carcinoma [25], cutaneous melanoma [26], hepatocellular carcinoma [27], neuroblastomas [28], metastatic prostate tumors [29], breast cancer and colorectal cancers [30]. Furthermore, KDM4A lysine (K)-specific demethylase 4A (KDM4A) has been shown to inactivate CHD5 expression through transcriptional repression [31].
In addition to regulating processes that are fundamental for cancer prevention, CHD5 expression is also a favorable predictor of survival following anticancer therapy [17], [32], [33], [34]. Several results indicate that the chromatin remodeling function of CHD5 might be important for preventing cancer. Loss of Chd5 enhances proliferation; whereas Chd5 gain compromises proliferation [35]. Restoration of CHD5 expression inhibited proliferation and tumor growth in neuroblastoma [36], breast cancer [37] and lung cancer [21] cells. CHD5 facilitates expression of a tumor-suppressive network that includes p16 and p19, encoded by the cyclin-dependent kinase inhibitor 2A (Cdkn2a) locus [35]. The ability of CHD5 to bind unmodified histone 3 (H3) is essential for tumor suppression [38]. Mutation of the CHD5 PHD domain abrogated CHD5–H3 interaction and consequently compromised proliferation inhibition, inducing differentiation and suppressing tumorigenesis [38]. CHD5 binds and regulates an extensive number of cancer-associated loci, including tumorigenic Cdkn2a, and other genes encoding proteins implicated in chromatin dynamics and cancer-associated pathways. These data taken together strongly suggest that CHD5 modulates the expression of multiple genes regulating pathways involved in tumorigenic processes [38]. Excessive activation of these tumor-suppressive pathways causes apoptosis, cellular senescence, and neonatal death, all of which are dependent on p16, p19 and p53 [35].
Deletions of regions including Chd5 in a mouse model of chromosomally unstable lymphoma showed that CHD5 is one of only three genes mapping to the minimally common region of deletion that they discovered in human T-cell acute lymphoblastic leukemia/lymphoma [39]. However, deletions of the human 1p36 region identified for several hematopoietic malignancies, including acute AML [8], CML [9] and non-Hodgkin’s lymphoma [10], did not include CHD5. Although this does not support CHD5 deficiency as a causal event in these cancers, the finding that mice heterozygous for the 4.3-Mb interval encompassing Chd5 are prone to spontaneous lymphoma [35] and that CHD5 is deleted in lymphoid cancers in mice provide evidence that CHD5 deficiency plays a key role in these hematopoietic malignancies [39].
Given the pivotal role of CHD5 in leukemia, we hypothesize that CHD5 is inactivated in leukemia and sought to elucidate the mechanism of inactivation. Here we demonstrate the following: CHD5 was down-regulated in human leukemia cell lines and samples, the important regulatory region of the CHD5 gene is localized 500–200 bp upstream of the transcription start site (TSS), hypermethylation was observed in these important regulatory elements, and the hypermethylation of the CHD5 promoter repressed transcriptional activity. Furthermore, the activating protein 2 (AP2) binding site was identified as a region strongly regulating CHD5 expression. Our findings indicate that repression of CHD5 gene expression in human leukemia is mediated in part by hypermethylation of the identified CHD5 regulatory element.
Materials and Methods
Human tissues and cells
Human leukemia cell lines K-562, HL-60, KG-1a and Jurkat were purchased from American Type Culture Collection (Manassas, VA) and were maintained in RPMI 1640 medium (Gibco, Grand Island, NY, USA) supplemented with 10% fetal bovine serum (Gibco). Bone marrow obtained from 12 healthy donors, 50 acute lymphoblastic leukemia (ALL) patients, 50 AML patients and 50 chronic CML patients (Table S1) was donated by Southern Hospital,Guamgzhou, China. These leukemic samples were selected randomly from primary patients. The Southern Hospital Institutional Review Board approved this study, and written informed consent was obtained before sample collection. Mononuclear cells (MCs) were separated from bone marrow using Ficoll-Paque PLUS (GE Healthcare, Piscataway, NJ, USA) according to the manufacturer’s instructions, and used for analysis of CHD5 expression and methylation status.
Quantitative reverse transcriptase-polymerase chain reaction (qRT-PCR)
Total RNA was prepared using Trizol reagent (Invitrogen, Carlsbad, CA, USA) according to the manufacturer’s instructions. RT-PCR was performed on 0.5 mg total RNA using a PrimeScript RT Reagent Kit with gDNA Eraser (Takara, Japan). qPCR was performed using an ABI 7500 Real-Time PCR system and a SYBR Premix Ex TaqTM II kit (Takara). Gene expression of CHD5 was normalized to β-actin and all samples were analyzed in triplicate. Primers for qRT-PCR are shown in Table 1.
Table 1. Primers for qRT-PCR.
Western blot analysis
Cells were lysed in Laemmli buffer and protein concentrations were determined using Bio-Rad protein assay kits (Bio-Rad, Hercules, USA) and 50−100 µg protein was analyzed by using standard procedures, with antibodies specific for CHD5 (1:1000, rabbit monoclonal; Abcam, Cambridge,USA) and β-actin (AC-15, mouse monoclonal, 1:1000; Abcam). Immunoreactive bands were visualized by chemiluminescent detection (ECL detection kit; PEL,Arkansas, USA.). β-Actin was included as a loading control. All extracts were prepared in duplicate, and at least three independent experiments were conducted.
Bisulfite DNA sequencing (BGS)
Human promoter of CHD5 was analyzed using Methyl Primers Express software (Applied Biosystems, Foster City, CA) and MethPrimer to identify CpG islands, and corresponding primers were used for BGS. Genomic DNA was isolated using the genomic DNA isolation kit (Qiagen,Valencia, CA). DNA (1 µg) was converted with EpiTect Bisulfite Kit (Qiagen). BGS primers [5′-GTTGTTTTGAAGATTTTGTTTT -3′ and 5′-CTAATTACTATAACAACCCCATCCC-3'] were used to amplify the CpG island located at 560–240 bp upstream of the TSS. The PCR products were purified using agarose gel electrophoresis and the Qiagen purification kit (Qiagen), and were cloned into the PMD18-T Vector (Takara) for sequencing. A minimum of eight colonies were selected for sequencing. Methylation data from BGS were analyzed using BiQ Analyzer software to generate lollipop diagrams (which list the percentage of methylation at each CpG) and to calculate the efficiency of bisulfite conversion. Analysis of non-CpG cytosines indicated the efficiency of bisulfite conversion was ∼99%.
Drug treatments
For dose–response experiments, K-562 and Jurkat cells were treated with DNA methyltransferase inhibitor 5-aza-2-deoxycytidine (DAC; Sigma, St Louis, MO, USA) at 0, 0.5, 2.5, 5, 10, and 20 µmol/L for 4 days, and HL-60 and KG-1a cells at 0, 0.1, 0.5, 1, 2.5, and 5 µmol/L. The medium was exchanged every other day with the same concentration of DAC. All experiments were performed in duplicate and repeated twice.
DNA-based bioinformatics
The location and putative domains of the CHD5 prompter were predicted using the UCSC Genome Browser (http://genome.ucsc.edu/cgi-bin/hgGateway). The promoter was analyzed for transcription factor binding sites (TBSs) using WWW Promoter Scan [40] and TFSEARCH software [41].
Transient transfection and luciferase assay
The CHD5 promoter was obtained by whole gene synthesis using the 2000 bp sequence upstream of the TSS. The synthesized promoter was cloned into the pGL4.10 (Promega, Madison, WI, USA), a promoterless luciferase expression vector, to produce the pGL4.10-CHD5-2000 to −1 recombinant vector. A set of reporter constructs containing truncated CHD5 promoter sequences generated by progressively deleting 200 or 100 bp from the 5' or 3' end were PCR amplified from pGL4.10-CHD5-P-WT and self-ligated. Constructs pGL4.10-CHD5-2000 to −370 and pGL4.10-CHD5-356 to −1, in which the AP2 binding site (located at –369 to –357 bp from the TSS) is deleted, were PCR amplified from pGL4.10-CHD5-2000 to −1. A 321 bp region located at –560 to –240 was PCR amplified from pGL4.10-CHD5-2000 to −1 and the fragments were methylated in vitro with SssI, HpaII and HhaI methylases (New England Biolabs), or no enzyme (mock), according to the manufacturer’s instructions. SssI methylates all 5′-CpG-3′ sites, HpaII methylates only the CpG within the sequence 5′-CCGG-3′, and HhaI methylates only the CpG within the sequence 5′-GCGC-3′. Methylation efficiency was confirmed using HhaI, HpaII, and McrBC digestion (NEB). Methylated or mock-methylated fragments were ligated back into pGL4.10 vector to produce reporter constructs (pGL4.1-CHD5-P-CR for mock-methylated fragment). Primers used to generate these reporter constructs are listed in Table 2.
Table 2. Primers for construction of reporter constructs.
| Region of the deleted CHD5 promoter (upstream of TST) | Primer | Sequence |
| −1800bp to −1bp | CHD5-PD1-F | ATGAGCATCTCGGCTCTAATTTGTTG |
| CHD5-PD1-R | AGATCTTGATATCCTCGAGG | |
| −1600bp to −1bp | CHD5-PD2-F | TTGGGGGGCTGGTAACTGAG |
| CHD5-PD2-R | AGATCTTGATATCCTCGAGG | |
| −1400bp to −1bp | CHD5-PD3-F | GCCTGCTTCCCTGAAGAGTGTT |
| CHD5-PD3-R | AGATCTTGATATCCTCGAGG | |
| −1200bp to −1bp | CHD5-PD4-F | GGCAATAAAATTGAACGGGA |
| CHD5-PD4-R | AGATCTTGATATCCTCGAGG | |
| −1000bp to −1bp | CHD5-PD5-F | AGGCGCTCATTTAAAATTCC |
| CHD5-PD5-R | AGATCTTGATATCCTCGAGG | |
| −800bp to −1bp | CHD5-PD6-F | GGGCTTTTTGGAAGGGGGCA |
| CHD5-PD6-R | AGATCTTGATATCCTCGAGG | |
| −600bp to −1bp | CHD5-PD7-F | GTCCCGGCGCCTGTGAACCG |
| CHD5-PD7-R | AGATCTTGATATCCTCGAGG | |
| −400bp to −1bp | CHD5-PD8-F | TCGGGTCCGCGGGCGCGCGG |
| CHD5-PD8-R | AGATCTTGATATCCTCGAGG | |
| −200bp to −1bp | CHD5-PD9-F | CCGTGCCGCCGTGCCTCTGG |
| CHD5-PD9-R | AGATCTTGATATCCTCGAGG | |
| −2000bp to −200bp | CHD5-PD10-F | AAGCTTGGCAATCCGGTACTGTTGGTAAAGC |
| CHD5-PD10-R | CGGGGGGGCGGCACACATGC | |
| −2000bp to −400bp | CHD5-PD11-F | AAGCTTGGCAATCCGGTACTGTTGGTAAAGC |
| CHD5-PD11-R | CGGCCGAGCGGGCAGTCGGG | |
| −2000bp to −600bp | CHD5-PD12-F | AAGCTTGGCAATCCGGTACTGTTGGTAAAGC |
| CHD5-PD12-R | CCACCCCGCTCCCGGCTCCG | |
| −2000bp to −800bp | CHD5-PD13-F | AAGCTTGGCAATCCGGTACTG |
| CHD5-PD13-R | CTCCAGGCTGGGTGCAGCTG | |
| −2000bp to −1000bp | CHD5-PD14-F | AAGCTTGGCAATCCGGTACTGTTGGTAAA |
| CHD5-PD14-R | CCAGTCTCCGCGGCGGCAAG | |
| −2000bp to −1200bp | CHD5-PD15-F | AAGCTTGGCAATCCGGTACT |
| CHD5-PD15-R | AGCAAACCCCAAACAAAAGA | |
| −2000bp to −1400bp | CHD5-PD16-F | AAGCTTGGCAATCCGGTACT |
| CHD5-PD16-R | CAGGAAACCAAAGGGCCTCC | |
| −2000bp to −1600bp | CHD5-PD17-F | AAGCTTGGCAATCCGGTACT |
| CHD5-PD17-R | CACCTCTCTAATCCCTTTCA | |
| −2000bp to −1800bp | CHD5-PD18-F | AAGCTTGGCAATCCGGTACT |
| CHD5-PD18-R | CAGTCATAATCCTCTCCCCA | |
| −2000bp to −700bp and −600bp to −1bp | CHD5-PD19-F | GTCCCGGCGCCTGTGAACCG |
| CHD5-PD19-R | AGACTGTGGGTCTGATTTAC | |
| −2000bp to −700bp and −500bp to −1bp | CHD5-PD20-F | CGAGCGGCGGCGGCTGGCTC |
| CHD5-PD20-R | AGACTGTGGGTCTGATTTAC | |
| −2000bp to −700bp and −400bp to −1bp | CHD5-PD21-F | TCGGGTCCGCGGGCGCGCGG |
| CHD5-PD21-R | AGACTGTGGGTCTGATTTAC | |
| −2000bp to −700bp and −300bp to −1bp | CHD5-PD22-F | TTCTCTGCTGTTAACTAGTC |
| CHD5-PD22-R | AGACTGTGGGTCTGATTTAC | |
| −2000bp to −700bp and −200bp to −1bp | CHD5-PD23-F | CCGTGCCGCCGTGCCTCTGG |
| CHD5-PD23-R | AGACTGTGGGTCTGATTTAC | |
| −2000bp to −700bp and −100bp to−1bp | CHD5-PD24-F | GCAGGCTAAGGCGGCCGAGA |
| CHD5-PD24-R | AGACTGTGGGTCTGATTTAC | |
| −2000bp to −100bp | CHD5-PD25-F | AAGCTTGGCAATCCGGTACT |
| CHD5-PD25-R | TCCCCGCAAAGCCCGGGCGC | |
| −2000bp to −200bp | CHD5-PD26-F | AAGCTTGGCAATCCGGTACTGTTGGTAAAGC |
| CHD5-PD26-R | CGGGGGGGCGGCACACATGC | |
| −2000bp to −300bp | CHD5-PD27-F | AAGCTTGGCAATCCGGTACT |
| CHD5-PD27-R | CAAGTTGGGGGACTAGTCCT | |
| −2000bp to −400bp | CHD5-PD28-F | AAGCTTGGCAATCCGGTACTGTTGGTAAAGC |
| CHD5-PD28-R | CGGCCGAGCGGGCAGTCGGG | |
| −2000bp to −500bp | CHD5-PD29-F | AAGCTTGGCAATCCGGTACTGTTGGTAAA |
| CHD5-PD29-R | CCTGCGAAGGCGCTGGGCCC | |
| −2000bp to −600bp | CHD5-PD30-F | AAGCTTGGCAATCCGGTACTGTTGGTAAAGC |
| CHD5-PD30-R | CCACCCCGCTCCCGGCTCCG | |
| 2000bp to −370bp and −356bp to −1bp | CHD5-P-AP-2-D-F | GGGCGCCCCCCGGTCCCCACC |
| CHD5-P-AP-2-D-R | CGTCGAGGCGTCCGCGCG | |
| –560bp to –240bp | CHD5-P-CR-F | GCTGCCCTGAAGACCCTG |
| CHD5-P-CR-R | CTGGTTGCTGTGGCAACC |
Cells were cultured in 24-well plates. Twenty-four hours after seeding, medium was changed and cells were co-transfected with pGL4.10 vector or one of the recombinant pGL4.10 vectors and pGL4.74 (Promega), or co-transfected with pGL4.74 vector, expression vector for human AP-2 (Addgene Plasmid 12100) [42] and pGL4.1-CHD5-P-CR or pGL4.10. The pGL4.10 vector contains luc gene, and the pGL4.74 contains Renilla gene. After 24 hours, cells were harvested, and luciferase activities were measured using the Dual-Luciferase Reporter Assay System (Promega) according to the manufacturer’s instructions. The promoterless pGL4.10 vector (pGL4.10-Basic) was used as a negative control. The pGL4.10-CMV vector, which includes the CMV promoter, was used as positive control for reporter construct experiments. The relative Luc luciferase activity of full length and truncated CHD5 promoters was calculated by normalizing to Renilla luciferase activity and compared to normalized Luc luciferase activity from the pGL4.10-Basic vector. The experiment was repeated twice to confirm the reproducibility of results.
Chromatin immunoprecipitation and quantitative PCR
Chromatin immunoprecipitation (ChIP) analysis was performed using the Pierce® Agarose ChIP Kit (Pierce, Waltham, USA). Chromatin was precipitated with an AP2α antibody (#3208, Cell Signaling Technology, Danvers, MA). The abundance of specific DNA sequences in the immunoprecipitates was determined by qPCR. ChIP-qPCR primers ChIP-CHD5-P-F (5'-GCGGGGGCGGTGTTTCCT-3') and ChIP-CHD5-P-R (5'-CAGGGGGAGCCGTCGAGG-3') were used for the region containing the AP2 binding site (–369 to –357). The –468 to –360 region was amplified to determine by qPCR. Samples were run in triplicate, and data were normalized to 10% input DNA amplifications, after subtraction of signals obtained from antibody isotype control. ChIP was repeated twice to confirm the reproducibility of results.
Statistical analysis
Comparisons between two groups were performed by paired sample t tests and between three or more experimental groups by one-way analysis of variance. The correlation between methylation and CHD5 expression was calculated by Spearman’s correlation. All data are presented as mean ± standard deviation (SD). P<0.001 was considered statistically significant unless otherwise indicated.
Results
Expression of CHD5 gene in leukemia cell lines and samples
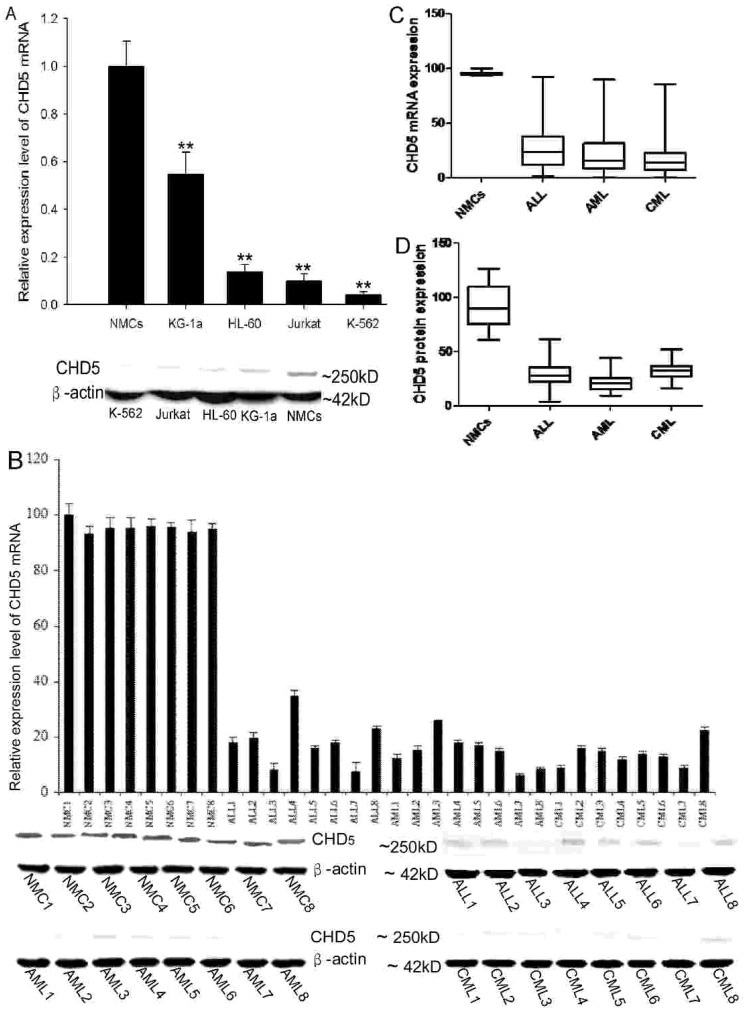
To determine whether CHD5 expression was down-regulated in leukemia, we initially examined expression level of CHD5 mRNA and protein in leukemia cell lines. K-562, HL-60 and Jurkat cells had markedly lower CHD5 expression relative to normal mononuclear cells (NMCs). However, CHD5 expression in KG-1a cells was only slightly lower (Figure 1A; P<0.01). Additionally, MCs obtained from bone marrow from leukemia patients were analyzed for CHD5 expression. In NMCs, the median expression of CHD5 mRNA was 95.58 (range, 93.333–100). The median expression in ALL, AML and CML was 18.20 (range, 7.666–35), 14.75 (range, 6–25.66) and 13.79 (range, 9–22.333), respectively (Figure 1B). Furthermore, ALL, AML and CML samples had much lower CHD5 protein expression compared to the expression in NMCs (Figure 1B). Statistical analysis revealed that distributions of CHD5 mRNA and protein expression were significantly lower in ALL, AML and CML than in NMCs (Figure 1 CD; P≤0.001). These data demonstrated that CHD5 gene expression was down-regulated in leukemia cells.
Figure 1. CHD5 expression is down-regulated in leukemia cell lines and samples.
CHD5 expression was determined for K-562, KG-1a, HL-60 and Jurkat cell lines by qRT-PCR (top) and western blotting (bottom) (A). Representative results of CHD5 mRNA (top) and protein (bottom) expression from ALL, AML and CML patients are presented (B). The distribution of CHD5 mRNA (C) and protein level (D) in ALL, AML and CML samples and NMCs (included for comparison) were calculated. For all experiments, β-actin was detected as an internal control. All data are presented as mean ± SD. P<0.001 was considered statistically significant (**).
Mapping important regulatory elements within the CHD5 promoter
According to the National Cancer Institute (NCI), the frequency of 1p36 deletion in leukemia samples is less than 5%, and some of these 1p36 deletions do not include the CHD5 gene. In leukemia cases where the normal CHD5 gene is intact, the reduction in CHD5 expression must be due to another mechanism than the absence of the gene sequence. To clarify this issue, we examined transcriptional regulation of CHD5 expression.
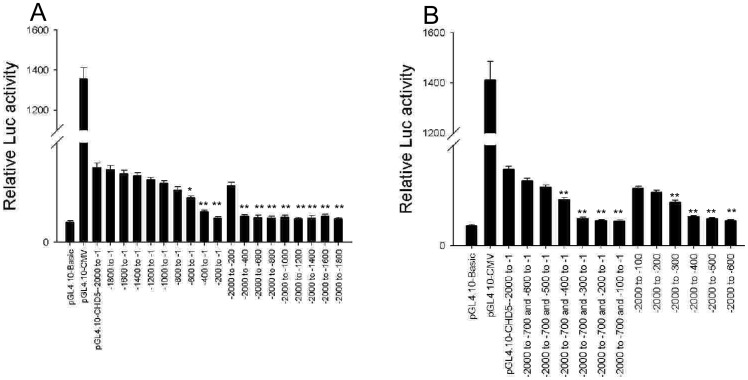
Analysis of the human CHD5 gene sequence using UCSC Genome Browser software indicated that the putative CHD5 promoter is located 2000 bp upstream of the TSS and includes a CpG island (Figure S1). To map the regulatory regions important for CHD5 gene transcription, we cloned full length and truncated CHD5 promoter sequences into luciferase reporter constructs. Expression from the full length CHD5 promoter construct was high in K-562 cells compared to expression from the promotorless pGL4.10 vector (Figure 2 A; P<0.01). CHD5 promoters with deletions in the –600 to –200 region exhibited significant less transcriptional activity than the full length promoter (Figure 2 A; P<0.01). Furthermore, promoter sequences generated by sequential 100 bp truncations of the 5' end starting at –700 bp or of the 3' end starting at the TSS exhibited significantly reduced transcriptional activity when the –500 to –200 region was deleted (Figure 2 B; P<0.01). These data suggest that an important regulatory element is located in the –500 to –200 region upstream of the TSS. Furthermore, this important regulatory element completely overlapped with the putative core CHD5 promoter located –472 to –222 upstream of the TSS, as predicted by WWW Promoter Scan software [40].
Figure 2. Mapping regulatory elements within the CHD5 promoter.
The reporter constructs containing the full length (–2000 to –1) CHD5 promoter or partial promoter sequences progressively truncated by 200 bp (A) or 100 bp (B) at the 5' or 3' end were measured for luciferase activity in K-562 cells. The promoterless pGL4.10-Basic vector was used as a negative control. The pGL4.10-CMV vector, which uses the CMV promoter, was used as a positive reporter construct. The relative Luc activity of full length and truncated CHD5 promoters were normalized to Renilla luciferase activity and compared to normalized Luc luciferase activity from pGL4.10-Basic. All data are presented as mean ± SD. P<0.001 was considered statistically significant (**).
Methylation status of the CHD5 promoter in leukemia cell lines
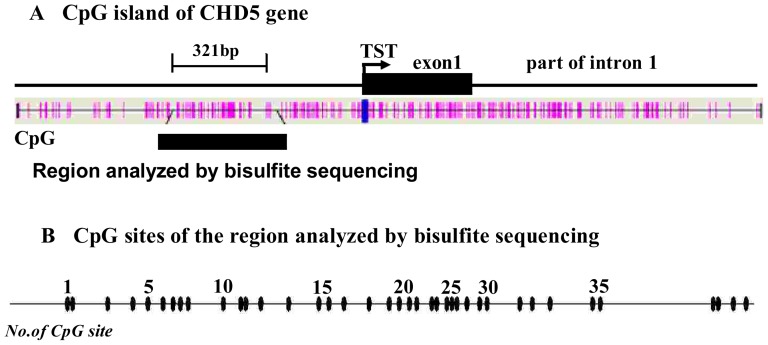
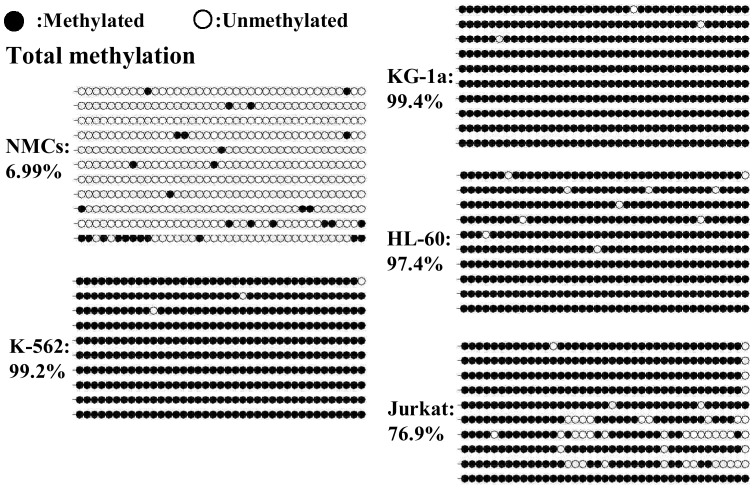
Cancer is characterized by "methylation imbalance," in which genome-wide hypomethylation is accompanied by localized hypermethylation, and an increase in the expression of DNA methyltransferase [43]. DNA methylation is one of several cellular epigenetic mechanisms that control gene expression. To evaluate the contribution of epigenetic silencing to the reduced CHD5 gene expression observed in leukemia cells, we investigated whether the identified CHD5 promoter regulatory element was methylated in leukemia cell lines. The methylation status in K-562, KG-1a, HL-60 and Jurkat cells was examined by BGS of the 39 CpG dinucleotides located in the –560 to –240 region of the CHD5 promoter (Figure 3). NMCs were included in this experiment for comparison. All CpG dinucleotides were almost methylated completely in these cells (methylation density in K-562, KG-1a, HL-60 and Jurkat cells was 99.2%, 99.4%, 97.4% and 76.9%, respectively). In contrast, the methylation density in NMCs was much lower (6.99%) (Figure 4).
Figure 3. The location of a CpG island (A) and 39 CpG sites analyzed by BGS (B) in the CHD5 promoter.
CpG sites are indicated with pink vertical bars. The positions analyzed by BGS are indicated with black vertical bars. The TSS is indicated with an arrow.
Figure 4. The methylation status of the –560 to –240 region of the CHD5 promoter.
The CpG island, located at –560 to –240, was analyzed by BGS. Methylation data from BGS were analyzed by BiQ Analyzer software to generate the lollipop diagram and to calculate the efficiency of bisulfite conversion. Analysis of non-CpG cytosines indicated the efficiency of bisulfite conversion at ∼99%. The lollipop diagram presented the percentage of methylation of each CpG. The overall methylation percentage indicates the total proportion of methylated CpGs in this region taking into account all sequenced alleles.
Activation of CHD5 gene expression by epigenetic modulatory drugs in leukemia cell lines
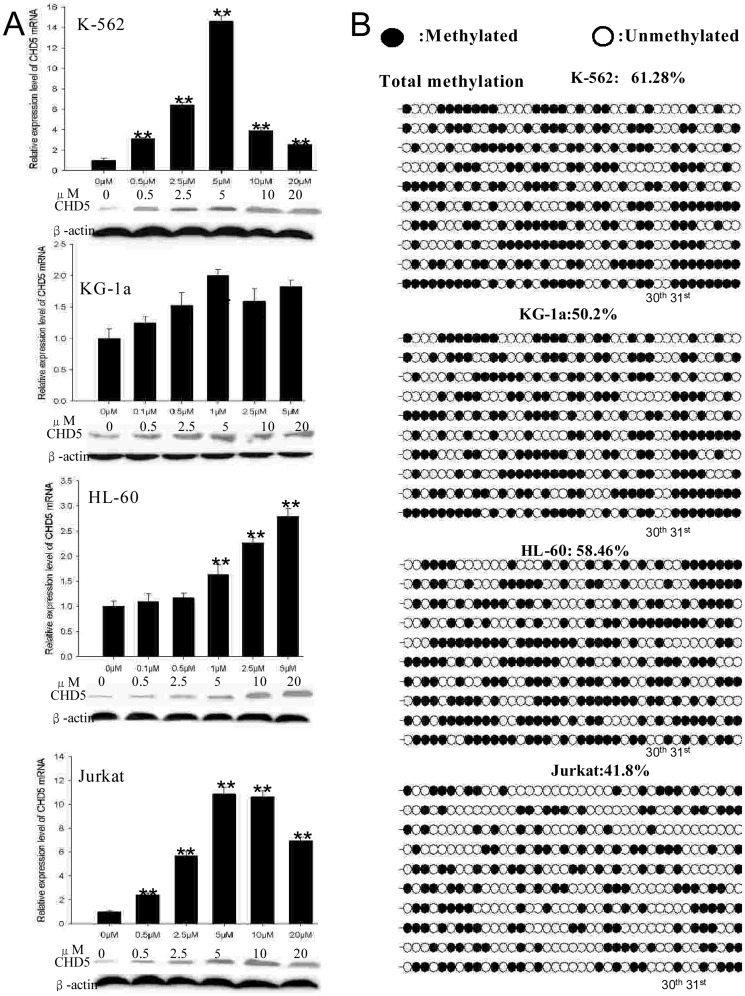
The association between these epigenetic aberrations and the putative transcriptional inactivation of CHD5 gene was assessed in leukemia cell lines. Cells were grown in increasing concentrations of DAC and CHD5 expression was measured using qRT-PCR and western blotting. DAC elicited a dose-dependent induction of CHD5 expression in all cell lines (Figure 5 A; P<0.01) that was most dramatic in K-562 and Jurkat cells (one order of magnitude higher expression), cells that initially exhibited the lowest initial CHD5 expression. To confirm the demethylation effect of DAC, BGS was performed on treated cell lines. Overall methylation of the CHD5 promoter in was reduced in K-562 (99.2% to 61.28%), KG-1a (99.4% to 50.02%), HL-60 (97.4% to 58.46%) and Jurkat cells (76.9% to 41.8%) treated with DAC (Figure 5 B). Furthermore, methylation density of the 30th and 31st CpG sites (Figure S2) was significantly decreased in DAC-treated K-562 and Jurkat cells, which exhibited the most significant restoration of CHD5 transcript levels (Figure 5 B).
Figure 5. The methylation status of CHD5 promoter and corresponding CHD5 expression in leukemia cell lines treated with DAC.
K-562, Jurkat, HL-60 and KG-1a cells were treated with DNA methyltransferase inhibitor DAC at the indicated concentrations. CHD5 expression (A) was analyzed by qPCR (top) and western blotting (bottom). Data are shown as mean ± SD. The methylation status (B) of the –560 to –240 region of the CHD5 promoter was analyzed by BGS.
Methylation status of CHD5 promoter in leukemia samples
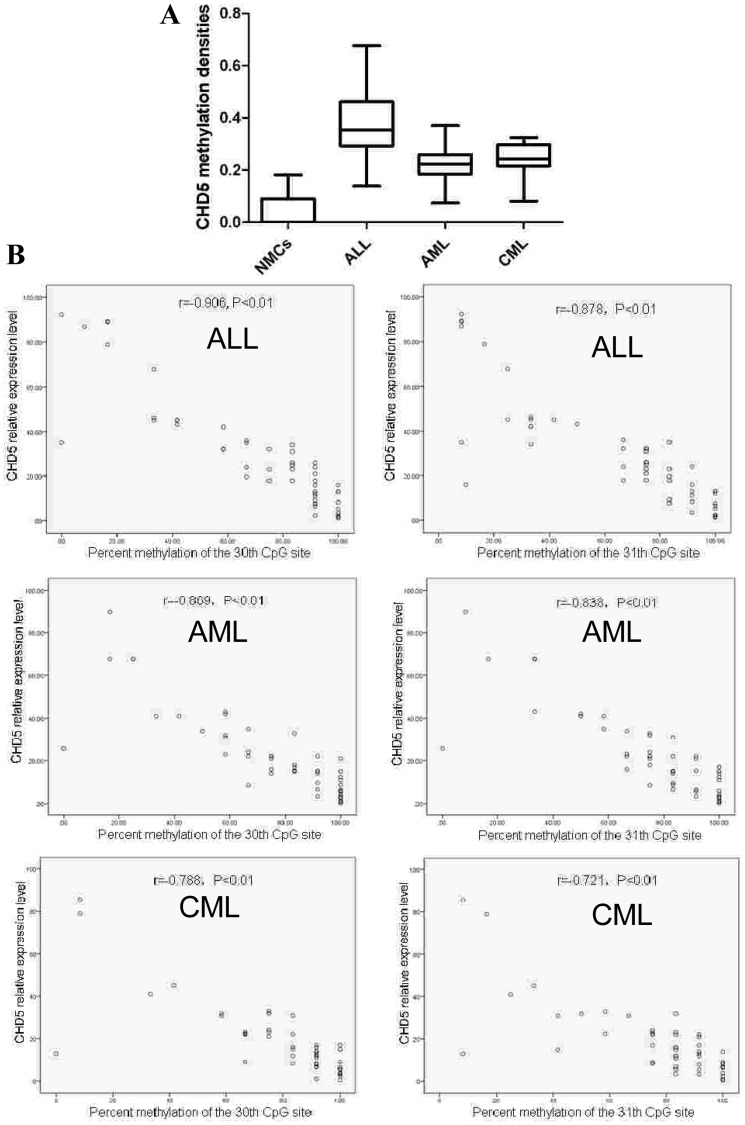
To determine whether the identified CHD5 promoter regulatory element was also hypermethylated in leukemia samples exhibiting reduced CHD5 expression, the methylation of the CpG island (–560 to –240) was methylated. Median methylation densities in ALL, AML, CML and NMCs were 38.5% (range, 0.14–0.677), 22.9% (range, 0.167–0.296), 24.5% (range, 0.189–0.297) and 7.2% (range, 0–0.182), respectively (Figure 6 A; P<0.01). Furthermore, the degree of methylation at the 30th and 31st CpG sites were inversely correlated with the CHD5 expression level (Figure 6 B; P<0.01).
Figure 6. Relationship between CHD5 expression level and CHD5 promoter methylation status.
The CpG island located at –560 to –240 was analyzed by BGS. The distribution of overall methylation percentage of CHD5 promoter in ALL, AML and CML and NMCs was calculated (A). The correlation between the methylation level of 30th and 31st CpG sites and CHD5 expression level was analyzed by Spearman’s correlation (B).
Repression of human CHD5 promoter activity by DNA methylation
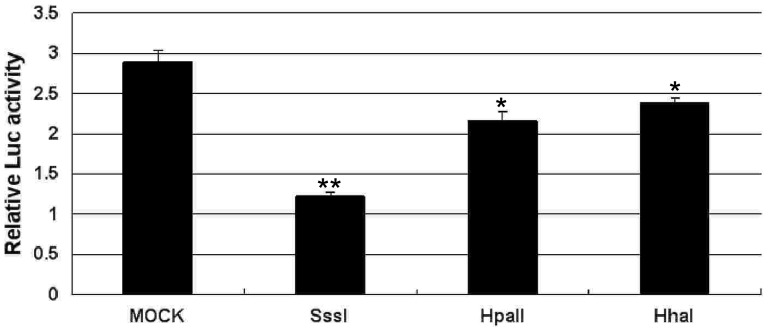
To examine whether DNA methylation directly represses CHD5 promoter activity, we cloned the identified CHD5 promoter regulatory element (–560 to –240) into a luciferase reporter construct. We methylated the cloned insert using SssI methylase (methylation of 39 CpGs), HpaII methyltransferase (methylation of 6 CpGs) or HhaI methylase (methylation of 8 CpGs). Furthermore, the 30th and 31st CpG sites were methylated by SssI methylase and HpaII methyltransferase, but not by HhaI methylase. Proper methylation of inserts was confirmed by digestion with the restriction enzymes McrBC, HpaII and HhaI. CHD5 promoter activity was tested by transfection of the luciferase construct containing methylated CHD5 promoter. Methylation with SssI, HpaII or HhaI methylases repressed CHD5 promoter activity in K-562. Repression was methylation dose dependent in that SssI, which methylates all CpG sites, exhibited the greatest repression, HpaII, which methylates 6 CpG sites, exhibited moderate repression, and HhaI, which methylates 6 or 8 CpG sites, exhibited the least repression of CHD5 promoter activity (Figure 7; P<0.01).
Figure 7. Repression of CHD5 promoter activity by DNA methylation.
A set of reporter constructs of methylated or mock-methylated fragments of the –560 to –240 region were measured for luciferase activity in K-562 cells. The relative Luc activities of methylated and mock CHD5 promoters were normalized to Renilla luciferase activity. All data are presented as mean ± SD. P<0.001 was considered statistically significant (**).
Identification of the AP2 binding site in the CHD5 promoter regulatory element
After identifying an important regulatory element at –500 to –200 of the CHD5 promoter and confirming that methylation of this site regulates expression, we examined the promoter sequence for known TBSs using WWW Promoter Scan [40] and TFSEARCH software [41]. The analysis identified a putative AP2 binding site at –369 to –357, a region that includes the 30th and 31st CpG sites. It is known that AP2 binding is methylation sensitive and that methylation of this site regulates transcription [44], [45], [46].
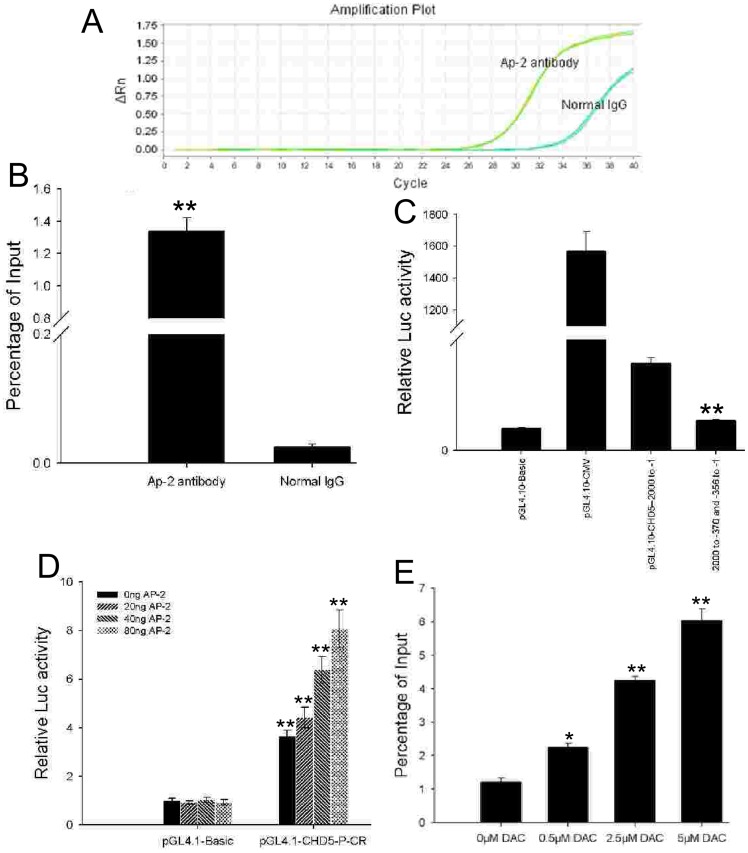
The AP2 binding site was confirmed by ChIP-qPCR using an AP2 antibody and luciferase constructs with CHD5 promoter sequences mutated at the AP2 site (Figure 8A B C; P<0.01). In vitro transcription-factor activity studies indicated that CHD5 promoter activity gradually increased following AP2 up-regulation (Figure 8D; P<0.01). To examine whether epigenetic change affects the binding of the AP2 to the CHD5 promoter region, ChIP-qPCR analysis using an AP2-specific antibody was performed. AP2 binding increased significantly in K-562 cells upon treatment with DAC (Figure 8E; P<0.01). We conclude that the increase in AP2 binding to the CHD5 promoter did not result from AP2 up-regulation, as DAC treatment did not significantly increase AP2 expression levels (Figure S3). These data provide functional evidence that decreased AP2 binding to the CHD5 promoter in K-562 cells resulting from hypermethylation contributes to the suppression of CHD5 expression. Specifically, these results support a link between dense CpG island hypermethylation in the CHD5 promoter and transcriptional inactivation of the gene.
Figure 8. Identification of the AP2 binding site in the CHD5 promoter regulatory element.
ChIP-qPCR assay indicated that AP2 binds to the identified regulatory element of the CHD5 promoter (A, B). Normal IgG was used as a negative control. The pGL4.10-CHD5-2000 to -370 and pGL4.10-CHD5-356 vectors, in which the AP2 binding site was deleted, were measured for luciferase activity in K-562 cells (C). The pGL4.1-CHD5-P-CR vector, harboring the –560 to –240 region, was measured for luciferase activity in K-562 cells (D). ChIP-qPCR analysis showed that DAC treatment enhanced AP2 binding to the CHD5 promoter. All data are presented as mean ± SD. P<0.001 was considered statistically significant (**).
Discussion
Several cancer cell lines and tumors from neural (neuroblastoma and glioma) [47], [48], [49] and epithelial (colon and breast) [12], [14], [47] lineages have 1p36 deletions that encompass the CHD5 gene. The 1p36 region is also deleted in 5% of all hematopoietic malignancies, including AML [8], CML [9] and non-Hodgkin’s lymphoma [10]. Despite the fact that 1p36 deletions in other hematopoietic malignancies do not include the CHD5 gene [8], [9], [10], CHD5 deficiency has been shown to be important in these cases [35], [39]. Recent studies have indicated that CHD5 expression is epigenetically silenced by hypermethylation of the CHD5 promoter in cancer cells in which the CHD5 gene is not deleted [17], [18], [19], [20], [21].
In this study, we found that CHD5 is down-regulated in human leukemia cell lines as well as clinical samples. This observation suggests that CHD5 could be used as a candidate gene for developing a biomarker panel for hematopoietic malignancies.
It has been reported that the CHD5 promoter was strongly methylated in the –780 to –450 region (Figure S2) in neuroblastoma cell lines with 1p36 deletions, but not cell lines with two copies of the CHD5 gene [36]. The methylated region (Figure S2) we identified (–500 to –200) is proximal to the region described in this report. It remains to be seen whether tissue-specific differences exist in the methylation of this region and modulate transcriptional regulation of the CHD5 gene.
Several results support the hypothesis that the methylation of the CHD5 promoter is responsible for the reduced expression observed in leukemia cells. CHD5 expression was up-regulated when cells were grown in the presence of DNA methyltransferase inhibitor DAC. In vitro methylation of the CHD5 promoter directly repressed promoter activity. We further showed that decreased expression of CHD5 in malignant tissues was significantly associated with hypermethylation of the CHD5 promoter, showing a relationship between methylation and reduced CHD5 expression in leukemia. Furthermore, the methylation level of 30th and 31st CpG sites, both located in the AP2 binding site, correlated inversely with CHD5 expression. AP2 binding site is known to be methylation sensitive and that methylation of the site leads to transcriptional repression. The role of methylation in AP2 binding of the CHD5 promoter was investigated with a ChIP-qPCR assay, which identified AP2 as a candidate transcription factor involved in CHD5 expression. In addition, our in vitro transcription factor activity studies revealed an important effect for AP2 on CHD5 expression. Furthermore, it was shown that DAC treatment increases the recruitment of AP2 to the CHD5 promoter.
The findings of our study suggest that CHD5 promoter methylation is a mechanism for controlling CHD5 expression in human cancer. However, we did find some discordance between methylation and expression of CHD5 gene. For example, the KG-1a cell line had the most hypermethylated promoter but expressed more CHD5 than the other cell lines. In addition, reduced CHD5 expression was not accompanied with hypermethylation of the CHD5 promoter in some leukemia samples. These observations suggest that there are multiple mechanisms involve in the regulation of CHD5 expression. Although homozygous genetic inactivation of CHD5 was not observed in neuroblastomas [36], the down-regulation of CHD5 expression resulted from the deletion of a CHD5 allele as well as from strong methylation of the CHD5 promoter [36]. Mutation and promoter hypermethylation of the CHD5 gene was observed in ovarian cancer exhibiting reduced CHD5 expression [24]. The low expression of CHD5 in colorectal cancer is correlated with hypermethylation of the CpG island in the CHD5 promoter and translational repression mediated by miR-211 [50]. Recently, it has been demonstrated that CHD5 promoter hypermethylation results in low or absent CHD5 protein levels in lung cancer [21] and that elevated JMJD2A expression observed in lung tumors of both human and mouse could contribute to the reduction of CHD5 levels [31].
CHD5 promoter hypermethylation may be associated with heterozygous loss of CHD5, mutation of the CHD5 gene and transcriptional repression mediated by other factors in our leukemia samples and cell lines. For example, CHD5 promoter hypermethylation and heterozygous loss of CHD5 was observed in HL-60 and K-562 cells (Figure S4). In fact, the mechanism of CHD5 expression regulation in different tissue types and developmental stages may be far more complicated than anticipated. Nonetheless, this epigenetic mechanism could reduce expression enough to silence CHD5 gene functionally.
In summary, we have shown that CHD5 is down-regulated in leukemia cells by promoter methylation, which suggests that CHD5 is a potential prognostic biomarker that may enrich therapeutic options. Additionally, we identified the AP2 transcription factor as a new powerful regulator for CHD5 expression. The data obtained from this study contribute to our understanding of the mechanisms regulating CHD5 gene expression in hematopoietic tumorigenesis, and facilitate optimization of anti-tumor therapy focused on repression of CHD5 expression.
Supporting Information
Putative CHD5 promoter. Analysis of the human CHD5 gene using UCSC Genome Browser software indicated that the putative CHD5 promoter was probably located 2000 bp upstream of TSS and overlapped with a CpG island.
(TIF)
The graphical representation of the methylated region. The methylated region that Zhao et al identified at −560 to −240 is somewhat proximal to the region that Fujita et al have identified at −780 to −450. The DNA sequence of −780 to −450 marked by underline was partially overlapped with DNA sequence of −560 to −240 marked by box. These CpG sites is marked by green shading. The sequence of all CpG sites located at −560 to −240 marked by sequential number.
(TIF)
AP2 expression in K-56 cell lines treated with DAC. K-562 cells were treated with DNA methyltransferase inhibitor DAC at the indicated concentrations. AP2 expression was determined by qRT-PCR (A) and western blotting (B). β-Actin was detected as an internal control. All data are presented as mean ± SD.
(TIF)
Visualization of chromosomal aberrations of K-562 and HL-60 cell lines. The SKY/M-FISH for K-562 (A) and HL-60 (B) cell lines were quoted from SKY/M-FISH and CGH Database at NCBI (NCI and NCBI SKY/M-FISH and CGH Database (2001), http://www.ncbi.nlm.nih.gov/sky/skyweb.cgi).
(TIF)
Patient samples.
(DOC)
Funding Statement
This work was funded by the National Natural Science Foundation of China (81100383/H0812, 81000226/H0812) and the Natural Science Foundation of Guangdong Province (S2011040005521, A2011360). The funders had no role in study design, data collection and analysis, decision to publish, or preparation of the manuscript.
References
- 1. Brodeur GM, Sekhon G, Goldstein MN (1977) Chromosomal aberrations in human neuroblastomas. Cancer 40: 2256–2263. [DOI] [PubMed] [Google Scholar]
- 2. White PS, Maris JM, Beltinger C, Sulman E, Marshall HN, et al. (1995) A region of consistent deletion in neuroblastoma maps within human chromosome 1p36.2−36.3. Proc Natl Acad Sci U S A 92: 5520–5524. [DOI] [PMC free article] [PubMed] [Google Scholar]
- 3. White PS, Thompson PM, Gotoh T, Okawa ER, Igarashi J, et al. (2005) Definition and characterization of a region of 1p36.3 consistently deleted in neuroblastoma. Oncogene 24: 2684–2694. [DOI] [PubMed] [Google Scholar]
- 4. Piaskowski S, Rieske P, Szybka M, Wozniak K, Bednarek A, et al. (2005) GADD45A and EPB41 as tumor suppressor genes in meningioma pathogenesis. Cancer Genet Cytogenet 162: 63–67. [DOI] [PubMed] [Google Scholar]
- 5. Poetsch M, Dittberner T, Woenckhaus C (2003) Microsatellite analysis at 1p36.3 in malignant melanoma of the skin: fine mapping in search of a possible tumour suppressor gene region. Melanoma Res 13: 29–33. [DOI] [PubMed] [Google Scholar]
- 6. Moley JF, Brother MB, Fong CT, White PS, Baylin SB, et al. (1992) Consistent association of 1p loss of heterozygosity with pheochromocytomas from patients with multiple endocrine neoplasia type 2 syndromes. Cancer Res 52: 770–774. [PubMed] [Google Scholar]
- 7. Bello MJ, Leone PE, Vaquero J, de Campos JM, Kusak ME, et al. (1995) Allelic loss at 1p and 19q frequently occurs in association and may represent early oncogenic events in oligodendroglial tumors. Int J Cancer 64: 207–210. [DOI] [PubMed] [Google Scholar]
- 8. Mori N, Morosetti R, Mizoguchi H, Koeffler HP (2003) Progression of myelodysplastic syndrome: allelic loss on chromosomal arm 1p. Br J Haematol 122: 226–230. [DOI] [PubMed] [Google Scholar]
- 9. Mori N, Morosetti R, Spira S, Lee S, Ben-Yehuda D, et al. (1998) Chromosome band 1p36 contains a putative tumor suppressor gene important in the evolution of chronic myelocytic leukemia. Blood 92: 3405–3409. [PubMed] [Google Scholar]
- 10. Melendez B, Cuadros M, Robledo M, Rivas C, Fernandez-Piqueras J, et al. (2003) Coincidental LOH regions in mouse and humans: evidence for novel tumor suppressor loci at 9q22-q34 in non-Hodgkin's lymphomas. Leuk Res 27: 627–633. [DOI] [PubMed] [Google Scholar]
- 11. Kleer CG, Bryant BR, Giordano TJ, Sobel M, Merino MJ (2000) Genetic Changes in Chromosomes 1p and 17p in Thyroid Cancer Progression. Endocr Pathol 11: 137–143. [DOI] [PubMed] [Google Scholar]
- 12. Praml C, Finke LH, Herfarth C, Schlag P, Schwab M, et al. (1995) Deletion mapping defines different regions in 1p34.2-pter that may harbor genetic information related to human colorectal cancer. Oncogene 11: 1357–1362. [PubMed] [Google Scholar]
- 13. Cheung TH, Lo KW, Yim SF, Poon CS, Cheung AY, et al. (2005) Clinicopathologic significance of loss of heterozygosity on chromosome 1 in cervical cancer. Gynecol Oncol 96: 510–515. [DOI] [PubMed] [Google Scholar]
- 14. Bieche I, Champeme MH, Matifas F, Cropp CS, Callahan R, et al. (1993) Two distinct regions involved in 1p deletion in human primary breast cancer. Cancer Res 53: 1990–1994. [PubMed] [Google Scholar]
- 15. Thompson PM, Gotoh T, Kok M, White PS, Brodeur GM (2003) CHD5, a new member of the chromodomain gene family, is preferentially expressed in the nervous system. Oncogene 22: 1002–1011. [DOI] [PubMed] [Google Scholar]
- 16. Marfella CG, Imbalzano AN (2007) The Chd family of chromatin remodelers. Mutat Res 618: 30–40. [DOI] [PMC free article] [PubMed] [Google Scholar]
- 17. Koyama H, Zhuang T, Light JE, Kolla V, Higashi M, et al. (2012) Mechanisms of CHD5 Inactivation in neuroblastomas. Clin Cancer Res 18: 1588–1597. [DOI] [PMC free article] [PubMed] [Google Scholar]
- 18. Mokarram P, Kumar K, Brim H, Naghibalhossaini F, Saberi-firoozi M, et al. (2009) Distinct high-profile methylated genes in colorectal cancer. PLoS One 4: e7012. [DOI] [PMC free article] [PubMed] [Google Scholar]
- 20. Wang X, Lau KK, So LK, Lam YW (2009) CHD5 is down-regulated through promoter hypermethylation in gastric cancer. J Biomed Sci 16: 95. [DOI] [PMC free article] [PubMed] [Google Scholar]
- 21. Zhao R, Yan Q, Lv J, Huang H, Zheng W, et al. (2012) CHD5, a tumor suppressor that is epigenetically silenced in lung cancer. Lung Cancer 76: 324–331. [DOI] [PubMed] [Google Scholar]
- 22. Agrawal N, Frederick MJ, Pickering CR, Bettegowda C, Chang K, et al. (2011) Exome sequencing of head and neck squamous cell carcinoma reveals inactivating mutations in NOTCH1. Science 333: 1154–1157. [DOI] [PMC free article] [PubMed] [Google Scholar]
- 23. Berger MF, Lawrence MS, Demichelis F, Drier Y, Cibulskis K, et al. (2011) The genomic complexity of primary human prostate cancer. Nature 470: 214–220. [DOI] [PMC free article] [PubMed] [Google Scholar]
- 24. Gorringe KL, Choong DY, Williams LH, Ramakrishna M, Sridhar A, et al. (2008) Mutation and methylation analysis of the chromodomain-helicase-DNA binding 5 gene in ovarian cancer. Neoplasia 10: 1253–1258. [DOI] [PMC free article] [PubMed] [Google Scholar]
- 25. Jones S, Wang TL, Shih Ie M, Mao TL, Nakayama K, et al. (2010) Frequent mutations of chromatin remodeling gene ARID1A in ovarian clear cell carcinoma. Science 330: 228–231. [DOI] [PMC free article] [PubMed] [Google Scholar]
- 26. Lang J, Tobias ES, Mackie R (2011) Preliminary evidence for involvement of the tumour suppressor gene CHD5 in a family with cutaneous melanoma. Br J Dermatol 164: 1010–1016. [DOI] [PubMed] [Google Scholar]
- 27. Li M, Zhao H, Zhang X, Wood LD, Anders RA, et al. (2011) Inactivating mutations of the chromatin remodeling gene ARID2 in hepatocellular carcinoma. Nat Genet 43: 828–829. [DOI] [PMC free article] [PubMed] [Google Scholar]
- 28. Okawa ER, Gotoh T, Manne J, Igarashi J, Fujita T, et al. (2008) Expression and sequence analysis of candidates for the 1p36.31 tumor suppressor gene deleted in neuroblastomas. Oncogene 27: 803–810. [DOI] [PubMed] [Google Scholar]
- 29. Robbins CM, Tembe WA, Baker A, Sinari S, Moses TY, et al. (2011) Copy number and targeted mutational analysis reveals novel somatic events in metastatic prostate tumors. Genome Res 21: 47–55. [DOI] [PMC free article] [PubMed] [Google Scholar]
- 30. Sjoblom T, Jones S, Wood LD, Parsons DW, Lin J, et al. (2006) The consensus coding sequences of human breast and colorectal cancers. Science 314: 268–274. [DOI] [PubMed] [Google Scholar]
- 31. Mallette FA, Richard S (2013) JMJD2A promotes cellular transformation by blocking cellular senescence through transcriptional repression of the tumor suppressor CHD5. Cell Rep 2: 1233–1243. [DOI] [PubMed] [Google Scholar]
- 32. Du X, Wu T, Lu J, Zang L, Song N, et al. (2012) Decreased expression of chromodomain helicase DNA-binding protein 5 is an unfavorable prognostic marker in patients with primary gallbladder carcinoma. Clin Transl Oncol 15: 198–204. [DOI] [PubMed] [Google Scholar]
- 33. Garcia I, Mayol G, Rodriguez E, Sunol M, Gershon TR, et al. (2010) Expression of the neuron-specific protein CHD5 is an independent marker of outcome in neuroblastoma. Mol Cancer 9: 277. [DOI] [PMC free article] [PubMed] [Google Scholar]
- 34. Wong RR, Chan LK, Tsang TP, Lee CW, Cheung TH, et al. (2011) CHD5 Downregulation Associated with Poor Prognosis in Epithelial Ovarian Cancer. Gynecol Obstet Invest 72: 203–207. [DOI] [PubMed] [Google Scholar]
- 35. Bagchi A, Papazoglu C, Wu Y, Capurso D, Brodt M, et al. (2007) CHD5 is a tumor suppressor at human 1p36. Cell 128: 459–475. [DOI] [PubMed] [Google Scholar]
- 36. Fujita T, Igarashi J, Okawa ER, Gotoh T, Manne J, et al. (2008) CHD5, a tumor suppressor gene deleted from 1p36.31 in neuroblastomas. J Natl Cancer Inst 100: 940–949. [DOI] [PMC free article] [PubMed] [Google Scholar]
- 37. Wu X, Zhu Z, Li W, Fu X, Su D, et al. (2012) Chromodomain helicase DNA binding protein 5 plays a tumor suppressor role in human breast cancer. Breast Cancer Res 14: R73. [DOI] [PMC free article] [PubMed] [Google Scholar]
- 38. Paul S, Kuo A, Schalch T, Vogel H, Joshua-Tor L, et al. (2013) Chd5 requires PHD-mediated histone 3 binding for tumor suppression. Cell Rep 3: 92–102. [DOI] [PMC free article] [PubMed] [Google Scholar]
- 39. Maser RS, Choudhury B, Campbell PJ, Feng B, Wong KK, et al. (2007) Chromosomally unstable mouse tumours have genomic alterations similar to diverse human cancers. Nature 447: 966–971. [DOI] [PMC free article] [PubMed] [Google Scholar]
- 40. Prestridge DS (1995) Predicting Pol II promoter sequences using transcription factor binding sites. J Mol Biol 249: 923–932. [DOI] [PubMed] [Google Scholar]
- 41. Heinemeyer T, Wingender E, Reuter I, Hermjakob H, Kel AE, et al. (1998) Databases on transcriptional regulation: TRANSFAC, TRRD and COMPEL. Nucleic Acids Res 26: 362–367. [DOI] [PMC free article] [PubMed] [Google Scholar]
- 42. Williams T, Tjian R (1991) Analysis of the DNA-binding and activation properties of the human transcription factor AP-2. Genes Dev 5: 670–682. [DOI] [PubMed] [Google Scholar]
- 43. Baylin SB, Herman JG, Graff JR, Vertino PM, Issa JP (1998) Alterations in DNA methylation: a fundamental aspect of neoplasia. Adv Cancer Res 72: 141–196. [PubMed] [Google Scholar]
- 44. Hermann R, Doerfler W (1991) Interference with protein binding at AP2 sites by sequence-specific methylation in the late E2A promoter of adenovirus type 2 DNA. FEBS Lett 281: 191–195. [DOI] [PubMed] [Google Scholar]
- 45. McPherson LA, Baichwal VR, Weigel RJ (1997) Identification of ERF-1 as a member of the AP2 transcription factor family. Proc Natl Acad Sci U S A 94: 4342–4347. [DOI] [PMC free article] [PubMed] [Google Scholar]
- 46. McPherson LA, Weigel RJ (1999) AP2alpha and AP2gamma: a comparison of binding site specificity and trans-activation of the estrogen receptor promoter and single site promoter constructs. Nucleic Acids Res 27: 4040–4049. [DOI] [PMC free article] [PubMed] [Google Scholar]
- 47. Bagchi A, Mills AA (2008) The quest for the 1p36 tumor suppressor. Cancer Res 68: 2551–2556. [DOI] [PMC free article] [PubMed] [Google Scholar]
- 48. Bello MJ, Leone PE, Nebreda P, de Campos JM, Kusak ME, et al. (1995) Allelic status of chromosome 1 in neoplasms of the nervous system. Cancer Genet Cytogenet 83: 160–164. [DOI] [PubMed] [Google Scholar]
- 49. Law ME, Templeton KL, Kitange G, Smith J, Misra A, et al. (2005) Molecular cytogenetic analysis of chromosomes 1 and 19 in glioma cell lines. Cancer Genet Cytogenet 160: 1–14. [DOI] [PubMed] [Google Scholar]
- 50. Cai C, Ashktorab H, Pang X, Zhao Y, Sha W, et al. (2012) MicroRNA-211 expression promotes colorectal cancer cell growth in vitro and in vivo by targeting tumor suppressor CHD5. PLoS One 7: e29750. [DOI] [PMC free article] [PubMed] [Google Scholar]
Associated Data
This section collects any data citations, data availability statements, or supplementary materials included in this article.
Supplementary Materials
Putative CHD5 promoter. Analysis of the human CHD5 gene using UCSC Genome Browser software indicated that the putative CHD5 promoter was probably located 2000 bp upstream of TSS and overlapped with a CpG island.
(TIF)
The graphical representation of the methylated region. The methylated region that Zhao et al identified at −560 to −240 is somewhat proximal to the region that Fujita et al have identified at −780 to −450. The DNA sequence of −780 to −450 marked by underline was partially overlapped with DNA sequence of −560 to −240 marked by box. These CpG sites is marked by green shading. The sequence of all CpG sites located at −560 to −240 marked by sequential number.
(TIF)
AP2 expression in K-56 cell lines treated with DAC. K-562 cells were treated with DNA methyltransferase inhibitor DAC at the indicated concentrations. AP2 expression was determined by qRT-PCR (A) and western blotting (B). β-Actin was detected as an internal control. All data are presented as mean ± SD.
(TIF)
Visualization of chromosomal aberrations of K-562 and HL-60 cell lines. The SKY/M-FISH for K-562 (A) and HL-60 (B) cell lines were quoted from SKY/M-FISH and CGH Database at NCBI (NCI and NCBI SKY/M-FISH and CGH Database (2001), http://www.ncbi.nlm.nih.gov/sky/skyweb.cgi).
(TIF)
Patient samples.
(DOC)


