

Abstract
Background
Diamond–Blackfan anemia is a rare congenital red blood cell dysplasia that develops soon after birth. RPL11 mutations account for approximately 4.8% of human DBA cases with defective hematopoietic phenotypes. However, the mechanisms by which RPL11 regulates hematopoiesis in DBA remain elusive. In this study, we analyzed the transcriptome using deep sequencing data from an Rpl11-deficient zebrafish model to identify Rpl11-mediated hematopoietic failure and investigate the underlying mechanisms.
Results
We characterized hematological defects in Rpl11-deficient zebrafish embryos by identifying affected hematological genes, hematopoiesis-associated pathways, and regulatory networks. We found that hemoglobin biosynthetic and hematological defects in Rpl11-deficient zebrafish were related to dysregulation of iron metabolism-related genes, including tfa, tfr1b, alas2 and slc25a37, which are involved in heme and hemoglobin biosynthesis. In addition, we found reduced expression of the hematopoietic stem cells (HSC) marker cmyb and HSC transcription factors tal1 and hoxb4a in Rpl11-deficient zebrafish embryos, indicating that the hematopoietic defects may be related to impaired HSC formation, differentiation, and proliferation. However, Rpl11 deficiency did not affect the development of other blood cell lineages such as granulocytes and myelocytes.
Conclusion
We identified hematopoietic failure of Rpl11-deficient zebrafish embryos using transcriptome deep sequencing and elucidated potential underlying mechanisms. The present analyses demonstrate that Rpl11-deficient zebrafish may serve as a model of DBA and may provide insights into the pathogenesis of mutant RPL11-mediated human DBA disease.
Keywords: Zebrafish, Hematopoiesis, Rpl11, RNA-Seq, Transcriptome, DBA
Background
Ribosomal protein dysfunction causes abnormal ribosomal particle assembly and affects protein synthesis in all cell types. Although RP dysfunction affects multiple tissues and systems, pathological defects in hematopoietic systems, such as aberrant development in Diamond–Blackfan anemia (DBA), are the most frequently observed phenotypes [1-3].
Mutations in RP genes reduce the efficiency of ribosome biogenesis, which is indispensable for immature erythrocytes in early and rapid growth phases [4]. Defective ribosome biosynthesis leads to excessive release of RPs such as RPL5 and RPL11, which may increase p53 activity by activating the RPS MDM2-p53 signaling pathway [5]. Because erythroid progenitor cells are highly sensitive to p53 activation [6], subsequent activation of the p53 pathway in erythroid progenitor cells leads to cell cycle arrest and apoptosis and finally to hematopoietic disorders. Interestingly, these hematopoietic defects were rescued by increased RP expression or reduced p53 activity in zebrafish and in erythroid progenitor cells from DBA patients [7-10]. It was also observed that Rpl22l1 plays essential roles in hematopoiesis, but acts independently of p53 and does not induce apoptosis [11].
DBA is a rare congenital red blood cell dysplasia that develops soon after birth. This disorder is mainly characterized by reduced reticulocyte counts, selective red cell aplasia, and macrocytosis, while a number of other blood cell lineages, such as neutrophils and platelets, are maintained or slightly decreased. Furthermore, DBA patients suffer other developmental defects, such as short stature, cleft lip, hand deformities, kidney and heart hypoplasia, and tumor predisposition [12-14]. Ribosome biogenesis defects have been identified as a major cause of DBA, and mutations of genes encoding RPs have emerged as the main cause of DBA. Indeed, various mutations have been found in coding and noncoding regions of at least 13 RPs, including RPL5, RPS7, RPL9, RPS10, RPL11, RPS15, RPS17, RPS19, RPS24, RPS26, RPL36, RPS27a, and RPL35a, accounting for about 55% of all DBA cases [15-23]. RPS19 was the first identified causative gene in DBA patients, and its mutations account for 25% of DBA cases [24].
RPL11 is one of 79 vertebrate RPs, and its gene mutations occur on coding and intronic binding regions of chromosome 1 [17]. DBA patients with mutations in RPL11 show typical hematopoietic defects, and 67% of these have physical deformities, especially of the thumb [17]. In particular, RPL11 dysfunction results in abnormal erythrocyte development, markedly decreased progenitor cell proliferation, delayed erythroid differentiation, and markedly increased apoptosis [25]. Importantly, these are different from the deficiencies in DBA patients with RPS19 mutations [25]. Hence, divergent mechanisms underlie hematopoietic defects in DBA patients with different RP mutations. Moreover, RPL11 dysfunction in erythroblasts lead to aberrant erythroblast differentiation, reduced hemoglobin, and unusual cell morphology [26].
Zebrafish are a classic animal model for mechanistic studies of embryonic development, hematopoiesis, and DBA [27,28]. Knockdown of most RP genes causes developmental defects in the brain of zebrafish, indicating that the vast majority of RP functions are associated with nervous system development [29]. Several reports focus on regulation of zebrafish hematopoiesis by the RP proteins Rps7, Rpl11, Rps19, and Rps29 [8-10,30]. Rpl11 dysfunction in zebrafish embryos leads to defective development, hematopoiesis, brain development, and shape dysplasia [8,29,31]. Furthermore, Danilova et al. reported that the hematopoietic defects caused by Rpl11 dysfunction were fully reversed by the inhibition of p53 activity in zebrafish mutants [8], indicating that p53 may regulate Rpl11 in zebrafish [25,31]. However, hematopoiesis in zebrafish with dysfunctional Rps19 is not fully recovered by inhibition of p53 [32]. Presumably, these varying phenotypic defects in zebrafish embryos with dysfunctional Rpl11 are regulated by multifactorial interactions of genes, regulatory networks, and signaling pathways.
High-throughput transcriptome sequencing is now widely accepted as a useful tool for investigating human disease mechanisms and gene functions. However, this technology has not been widely used in zebrafish research. Using microarray technology, Danilova et al. (2011) studied the impact of Rpl11 deficiency on hematopoiesis of zebrafish embryos. However, because of the limitations of detectable gene transcripts, some important aspects of Rpl11 functions in zebrafish may only be elucidated using high-throughput sequencing.
In this study, we examined genome-wide transcription by high-throughput transcriptome sequencing of Rpl11-deficient zebrafish embryos. In combination with bioinformatic analyses, we studied affected genes, hematopoiesis-related signaling pathways, and molecular regulatory networks in Rpl11-deficient zebrafish embryos. We found that Rpl11 deficiency leads to defects of hemoglobin synthesis and hematopoiesis, which were caused by dysregulation of iron metabolism-related genes and impaired HSC differentiation and proliferation. These analyses provide new insights into the pathogenesis of mutant Rpl11-mediated DBA.
Results
Hematopoietic defects in Rpl11-deficient zebrafish embryos
To investigate the regulation of Rpl11 in hematopoiesis in zebrafish embryos, we initially established an Rpl11-deficient zebrafish model using MO knockdown technology. We observed various phenotypes in this model, including smaller brains, tail deformities, and hematopoietic defects, which were consistent with other studies [8,29,31]. Benzidine staining of Rpl11-deficient zebrafish embryos at 48 hpf showed that globin expression was significantly decreased compared with that in control MO embryos, indicating defects of globin synthesis during late erythroid differentiation (Figure 1A–D). Subsequently, deep sequencing was performed to investigate the impact of Rpl11 on the transcriptome of Rpl11-deficient and control MO embryos at 48 hpf. The effectiveness of translational inhibition by Rpl11 MO was confirmed by examining the green fluorescent fusion protein under a fluorescence microscope (Figure 1E–F).
Figure 1.
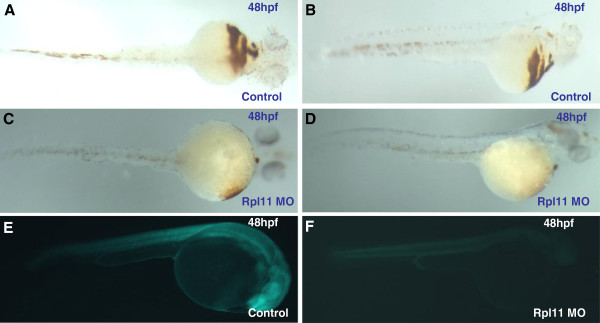
Benzidine staining of Rpl11-deficient zebrafish embryos and the effectiveness of translational inhibition by Rpl11 MO. (A, B, C, D), O-staining shows markedly reduced numbers of hemoglobin-stained blood cells in Rpl11-knockdown embryos; (E, F), The Rpl11–egfp construct was assembled by inserting a partial sequence of Rpl11 cDNA (containing 60 bps from the 5′ UTR) and the N-terminus of egfp into modified pEGFP-N1 (the ATG codon of EGFP was removed). The sequence of Rpl11 MO1 compliments 1–24 bp of Rpl11 cDNA. Embryos co-injected with 25 ng Rpl11–EGFP DNA and 0.5 ng control MO expressed EGFP, and Rpl11–EGFP expression was inhibited by co-injection with 0.5 ng Rpl11 MO; B, D, E, and F are the lateral view; A and C are the ventral view.
Transcriptome changes in Rpl11-deficient zebrafish embryos
To comprehensively reflect the impact of Rpl11 deficiency on the transcriptome of zebrafish embryos, we collected 40–50 Rpl11-deficient and MO control zebrafish embryos at 48 hpf from at least three separate experiments and constructed two mRNA-seq sequencing libraries in parallel. High-throughput sequencing was performed on the Hi-Seq2000 sequencing platform in parallel. The number of sequenced gene transcript reads was 35–40 million. Sequencing data were mapped to the latest Zv9 version of the zebrafish genome. Subsequently, 15–17 million readable gene transcripts were mapped to the zebrafish genome with 41–45% mapping efficiency (Additional file 1: Table S1). On average, more than 10,000 gene transcripts were mapped to known zebrafish genes, accounting for at least 70% of annotated genes. The percentage of detected unique gene transcripts was similar to that detected in previous studies [33,34], indicating that the present sequencing represented the vast majority of zebrafish genes.
All sequenced gene transcript reads were standardized to FPKM [35], and gene expression was presented (Additional file 2: Table S2). The R package DEGseq was used to compare transcriptomes of Rpl11-deficient zebrafish embryos and MO control embryos. In total, we identified 572 significantly differentially expressed genes (DEGs, FC >2, p-value <0.05); 483 were downregulated and 89 were upregulated. We also identified DEGs using screening thresholds set at p-value <0.05 and FC >1.5 (Additional file 3: Table S3). In addition, we found 10 specifically expressed genes (p-value <0.05) that were only expressed in one sample (Additional file 4: Table S4). Among these, four were significantly upregulated in Rpl11-deficient zebrafish embryos, whereas expression of the other six was almost completely inhibited, indicating high dependence of gene expression on Rpl11.
Gene ontology analysis of Rpl11 in zebrafish embryos
To investigate the biological functions of Rpl11 in zebrafish embryos, we performed GO analyses of genes that were significantly regulated by Rpl11 deficiency using AmiGO software (http://www.geneontology.org/). Since IPA software does not contain the zebrafish gene annotation that must be transformed into human genes before analysis, we used the GO analysis tool in the ZFIN database to get more detailed information of Rpl11 functions in zebrafish. GO analyses showed that upregulated genes were specifically enriched in functions associated with iron metabolism, including iron transport, intracellular iron homeostasis, and iron binding (Additional file 5: Figure S1 and Additional file 6: Table S5). Three zebrafish genes were involved in these iron-related functions, including zgc:194125, zgc:109934, and zgc:173594 (Additional file 7: Figure S3). However, no detailed gene annotations exist in the latest version (Zv9) of the zebrafish genome. Interestingly, a single human mitochondrial ferritin (FTMT) homolog was found for all three of these zebrafish genes, and its aberrant expression resulted in accumulation of mitochondrial iron, disruption of intracellular iron homeostasis [36], and reduction in iron utilization for heme and hemoglobin synthesis [37]. Downregulated genes were specifically enriched in functions associated with development and differentiation of the nervous system, generation of neurons and brain development, molecular metabolic regulation, developmental regulation of cells and tissues, regulation of gene transcription, regulation of RNA synthesis and metabolism, and other functions (Additional file 5: Figure S2 and Additional file 6: Table S5). Thus, GO analyses demonstrated that Rpl11 participates in the regulation of multiple biological processes in zebrafish embryos, and particularly in hematopoietic iron metabolism-associated pathways.
Hematological genes affected by Rpl11 deficiency in zebrafish embryos
To further investigate hematopoietic failures caused by Rpl11 deficiency in zebrafish, we analyzed affected hematological genes in Rpl11-deficient zebrafish embryos at 48 hpf. To provide a more detailed list of hematological genes affected by Rpl11 deficiency, the screening criteria were set at FC >1.5 and p-value <0.05. In total, 33 differentially expressed hematological genes were identified (Additional file 8: Figure S4), and description of these genes were summarized in Table 1. Heatmap analyses showed that most (24/33) hematological genes were significantly downregulated by Rpl11 deficiency (Figure 2A). Subsequent GO analyses demonstrated that these hematological genes were specifically enriched in diverse hematopoiesis-associated biological processes, including oxidation–reduction processes, heme binding, hypoxic oxygen binding, oxygen transporter activity, iron transport, and oxygen transport (Figure 2B). Hematological genes involved in GO items were summarized in (Additional file 9: Table S6).
Table 1.
Affected hematological genes in Rpl11-deficient zebrafish embryos at 48 hpf
| Genes | Fold change | p-Value | Description | Human homolog |
|---|---|---|---|---|
| hbbe3 |
↑3.12 |
0 |
Hemoglobin beta embryonic-3 |
HBE1 |
| hbbe2 |
↑1.56 |
3.84E-23 |
Hemoglobin beta embryonic-2 |
HBE1 |
| zgc:153284 |
↑2.32 |
6.20E-13 |
zgc:153284 |
- |
| cyp26a1 |
↑3.13 |
0.001089 |
Cytochrome P450, subfamily XXVIA, polypeptide 1 |
CYP26A1 |
| ddx18 |
↑1.58 |
0.003224 |
DEAD (Asp-Glu-Ala-Asp) box polypeptide 18 |
DDX18 |
| cyp24a1 |
↑6.16 |
0.014658 |
Cytochrome P450, family 24, subfamily A, polypeptide 1 |
CYP24A1 |
| ptgs2a |
↑2.21 |
0.023441 |
Prostaglandin-endoperoxide synthase 2a |
- |
| zgc:56493 |
↓1.63 |
2.38E-18 |
zgc:56493 |
TXN |
| cox4i1 |
↓1.52 |
6.39E-17 |
Cytochrome c oxidase subunit IV isoform 1 |
COX4I1 |
| pdia3 |
↓2.94 |
1.45E-13 |
Protein disulfide isomerase family A, member 3 |
PDIA3 |
| pdia4 |
↓3.75 |
7.23E-10 |
Protein disulfide isomerase associated 4 |
PDIA4 |
| hdac1 |
↓1.68 |
8.99E-08 |
Histone deacetylase 1 |
HDAC1 |
| Cat |
↓3.66 |
2.19E-06 |
Catalase |
CAT |
| rrm2 |
↓2.04 |
1.47E-05 |
Ribonucleotide reductase M2 polypeptide |
- |
| p4hb |
↓2.02 |
2.57E-05 |
Procollagen-proline, 2-oxoglutarate 4-dioxygenase, beta polypeptide |
P4HB |
| rrm1 |
↓1.82 |
3.28E-05 |
Ribonucleotide reductase M1 polypeptide |
RRM1 |
| cyp2aa8 |
↓2.29 |
0.000119 |
cytochrome P450, family 2, subfamily AA, polypeptide 8 |
- |
| tp53 |
↓1.66 |
0.000172 |
Tumor protein p53 |
TP53 |
| agxt2l1 |
↓4.63 |
0.000349 |
Alanine-glyoxylate aminotransferase 2-like 1 |
AGXT2L1 |
| pdip5 |
↓2.06 |
0.000366 |
Protein disulfide isomerase-related protein (provisional) |
PDIA6 |
| alas2 |
↓1.60 |
0.000435 |
Aminolevulinate, delta-, synthetase 2 |
ALAS2 |
| Max |
↓1.88 |
0.000645 |
myc-associated factor X |
MAX |
| isca1 |
↓1.72 |
0.000755 |
Iron-sulfur cluster assembly 1 |
ISCA1 |
| sh3bgrl3 |
↓2.39 |
0.002398 |
SH3 domain binding glutamic acid-rich protein like 3 |
SH3BGRL3 |
| pgrmc1 |
↓1.86 |
0.003269 |
Progesterone receptor membrane component 1 |
PGRMC1 |
| snrnp70 |
↓1.76 |
0.006001 |
Small nuclear ribonucleoprotein 70 (U1) |
SNRNP70 |
| cyp2aa4 |
↓2.27 |
0.007172 |
Cytochrome P450, family 2, subfamily AA, polypeptide 4 |
- |
| mta2 |
↓1.62 |
0.009737 |
Metastasis associated 1 family, member 2 |
MTA2 |
| sema3d |
↓4.42 |
0.016997 |
Semaphorin 3d |
SEMA3D |
| txndc5 |
↓1.53 |
0.029683 |
Thioredoxin domain containing 5 |
TXNDC5 |
| Mb |
↓2.85 |
0.037113 |
Myoglobin |
MB |
| slc40a1 |
↓1.96 |
0.037939 |
Solute carrier family 40 (iron-regulated transporter), member 1 |
SLC40A1 |
| pgrmc2 | ↓1.63 | 0.038689 | Progesterone receptor membrane component 2 | PGRMC2 |
Differentially expressed hematological genes in Rpl11-deficient zebrafish embryos were identified (Fold change >1.5, p-value <0.05).
Figure 2.
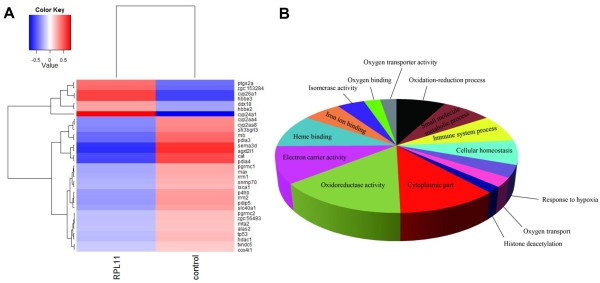
Analysis of affected hematological genes in Rpl11-deficient zebrafish embryos at 48 hpf. A, Cluster analysis of affected hematological genes. A total of 33 hematological genes exhibited changed expression in Rpl11-deficient zebrafish embryos at 48 hpf (FC >1.5, p-value <0.05). Hematological genes were clustered in upregulated and downregulated groups, and most affected hematopoietic genes were downregulated in Rpl11-deficient zebrafish embryos at 48 hpf; B, Gene ontology (GO) enrichment of affected hematological genes in Rpl11-deficient zebrafish embryos at 48 hpf. Among hematological genes, the largest three fractions represented oxidoreductase activity, cytoplasmic component, and electron carrier activity. Hematological genes with iron metabolism-associated functions such as heme and iron binding were also enriched.
Identification of hematopoiesis-associated pathways disturbed in Rpl11-deficient zebrafish
Key signaling pathways in mammals are highly conserved in zebrafish. To elucidate the roles of Rpl11 in the regulation of hematopoiesis in zebrafish embryos, we used IPA software to identify the signaling pathways that are most affected (p-value <0.01) by Rpl11 deficiency. Separate pathways were constructed with upregulated and downregulated genes (Additional file 10: Table S7). Among the five most affected signaling pathways, we identified three hematopoiesis pathways that were upregulated, including glucocorticoid receptor signaling [38,39], IGF-1 signaling [40-42], and IL-17A signaling in fibroblasts [43], and two hematopoiesis-related pathways that were downregulated, including Wnt/β-catenin signaling [44-48] and Aryl hydrocarbon receptor signaling [49] (Table 2). Among these pathways, Wnt/β-catenin signaling has been characterized as essential for formation, self-renewal, and development of hematopoietic stem cells (HSCs) [48], which are closely associated with hematopoiesis. Taken together, Rpl11 deficiency disturbed hematopoiesis-related signaling pathways in zebrafish embryos, at least partially explaining the ensuing hematopoietic failure.
Table 2.
Affected hematopoiesis-associated signaling pathways in Rpl11-deficient zebrafish embryos at 48 hpf
| Ingenuity canonical pathways | -log (p-value) | Up/down regulation | Functions | Reference |
|---|---|---|---|---|
| Wnt/β-catenin signaling |
3.81E + 00 |
Down |
HSC formation, self-renewal, and differentiation |
[44-48] |
| Aryl hydrocarbon receptor signaling |
3.70E + 00 |
Down |
Maintenance of HSC quiescence |
[49] |
| IGF-1 signaling |
4.28E + 00 |
Up |
Regulation of hematopoiesis and proliferation of hematopoietic stem cell progenitor cells |
[40-42] |
| IL-17A signaling in fibroblasts |
4.27E + 00 |
Up |
Linking T cell function and hematopoiesis, mediating the hematopoietic response |
[43] |
| Glucocorticoid receptor signaling | 3.67E + 00 | Up | Stimulation of BFU-E progenitor self-renewal and regulation of stress erythropoiesis | [38,39] |
Identification of regulatory networks affected by Rpl11 deficiency in zebrafish embryos
We used IPA software to determine whether molecular regulatory networks were disturbed by Rpl11 deficiency in zebrafish embryos (Additional file 11: Figure S5A-C, Figure S6A-E, and Additional file 12: Table S8). Analyses showed no specifically enriched hematopoiesis-associated regulatory networks of differentially regulated genes. Potentially, hematopoiesis-associated networks may have been weakened by more important functions of Rpl11 in zebrafish embryos and were therefore not detectable or were obscured by networks regulating hematopoiesis by unknown mechanisms. Through these networks, Rpl11 may play critical regulatory roles in cell development, proliferation, and apoptosis, nervous system development, embryonic development, immunological disease, and tumor pathology. We also identified central network nodes that may directly or indirectly associate with RPL11, including MMP9, AP1, SERPINE1, CTGF, FOS, JUNB, SOCS3, SOX2, TWIST1, CCND1, MMP2, and APP.
Potential mechanisms through which Rpl11 regulates hematopoiesis in zebrafish embryos
Benzidine staining of Rpl11-deficient zebrafish embryos showed that hemoglobin biosynthesis was significantly diminished, suggesting defects in hemoglobinization and late erythroid differentiation, which are consistent with the hypochromic anemia typical of iron, heme, or globin deficit in zebrafish embryos [50]. Focusing on the genes associated with erythrocyte iron metabolism, we found that the majority of genes involved in zebrafish iron metabolism were abnormally expressed (Table 3). These included alas2, cp, fth1a/b, htt, aco2, slc25a37, sfxn1, tfa, and tfr1b, suggesting that Rpl11 deficiency in zebrafish might affect multiple aspects of iron metabolism that are closely regulated in highly hemoglobinized erythrocytes. For example, reduced expression of tfa and tfr1b transcripts indicates damaged iron acquisition by erythrocytes and that of slc25a37 and alas2 indicates aberrant iron utilization by erythrocytes (Figure 3A). Moreover, upregulation of three homologs of human FTMT in Rpl11-deficient zebrafish embryos, including zgc:194125, zgc:109934, and zgc:173594 (Additional file 7: Figure S3), could lead to imbalances in cytoplasmic and mitochondrial iron metabolism in erythrocytes [37]. At present, it is widely reported that dysfunction of these genes in animal models leads to hematopoiesis-associated diseases such as siderocytic and microcytic anemia (Table 3). Taken together, aberrant expression of these genes may seriously damage iron metabolism, iron supply for heme biosynthesis, and hemoglobin biosynthesis during late erythroid differentiation, finally resulting in defective hematopoiesis in zebrafish embryo.
Table 3.
Summary of affected iron metabolism-related genes in Rpl11-deficient zebrafish embryos
| Zebrafish gene | Fold change | Functions | Hematopoiesis-associated phenotypes | Human homolog | Reference |
|---|---|---|---|---|---|
| alas2 |
↓1.44 |
First enzyme of heme synthesis |
X-linked sideroblastic anemia |
ALAS2 |
[51] |
| tfa |
↓1.89 |
Fe(III)-carrier in plasma |
Severe anemia |
TF |
[52] |
| tfr1b |
↓2.75 |
Membrane receptor for Fe(II)-TF |
Embryonic lethality and hematopoietic defect |
TFRC |
[53] |
| aco2 |
↓1.3 |
Bind to IREs; Fe sensors |
Microcytic anemia |
IRP2 |
[54] |
| fth1a |
↓1.35 |
Prevents Fe toxicity during erythropoiesis |
Embryonic lethality |
FTH1 |
[55,56] |
| fth1b |
↓1.83 |
||||
| slc25a37 |
↓1.77 |
Iron transport into mitochondria |
Embryonic lethal with profound anemia; hypochromic anemia |
SLC25A37 |
[57,58] |
| cp |
↓2.88 |
Oxidizes exported Fe2+ |
Hypochromic microcytic anemia |
CP |
[59] |
| htt |
↓1.27 |
Transferrin receptor trafficking |
Hypochromic anemia |
HTT |
[60] |
| sfxn1 |
↓2.19 |
Mitochondrial transport and iron metabolism |
Siderocytic anemia |
SFXN1 |
[61] |
| zgc:194125 |
↑2.73 |
Iron homeostasis and heme synthesis |
Sideroblastic anemia |
FTMT |
[37,62] |
| zgc:109934 |
↑2.36 |
||||
| zgc:173594 | ↑4.12 |
The arrow up and down respectively stand for up- and down-regulation of genes in Rpl11-deficient zebrafish embryos.
Figure 3.

qPCR analysis of changes in the expression of genes potentially associated with hematological defects in Rpl11-deficient zebrafish embryos. A, Analysis of changes in expression of genes associated with iron and heme metabolism in Rpl11-deficient zebrafish embryos; B, Analysis of changes in expression of molecular blood cell lineage markers. Gene expression was represented as mean ± SD and One-way ANOVA was performed for comparison between MO control and Rpl11-deficient embryos (***P < 0.001, **P < 0.01, * < 0.05, n = 3). Gene expression in MO control samples was normalized to 1.
HSCs are capable of self-renewal and have the potential to differentiate into all blood cell lineages, including erythrocytes. Runt-related transcription factor 1 (Runx1) was previously shown to be necessary for formation of HSCs. However, mRNA expression of runx1 was too low (FPKM <1) to represent its actual expression in zebrafish embryos using RNA-Seq data. Thus, we assessed the proliferation and differentiation of HSCs in Rpl11-deficient zebrafish embryos by observing the expression of the HSC marker cmyb. As shown in Figure 3B and Additional file 13: Table S9, we observed a marked decrease in the mRNA expression of cmyb, indicating reduction in HSCs in Rpl11-deficient zebrafish embryos. In addition, we observed dramatic reductions in mRNA expression of HSC transcription factors, including hoxb4a, which regulates HSC expansion [63], and tal1, which controls differentiation and development of HSCs [64]. Given occasional dysplasia of blood cell lineages other than erythrocytes in DBA patients, we determined whether Rpl11 deficiency affected the development and proliferation of granulocytes, lymphocytes, and myelocytes by observing the cellular markers ikzf1, spi1, and mpx, respectively. qPCR analyses showed no changes in expression of these markers in Rpl11-deficient zebrafish embryos (Figure 3B), suggesting that development and proliferation of lymphocytes, myelocytes, and granulocytes were unaffected by Rpl11 deficiency. Taken together, hematopoietic failure in Rpl11-deficient zebrafish may be attributed to defective erythropoiesis in zebrafish embryo HSCs.
Discussion
P53 pathway acts independently of Rpl11-deficiency in zebrafish embryos
In previous studies, hematopoiesis was sensitive to p53 activation [6], and p53 pathway was shown to be activated in DBA patients [25,65] and in RP-deficient zebrafish with defective hematopoiesis [9,10,30]. However, we did not observe upregulation of p53 signaling in Rpl11-deficient zebrafish embryos. Potentially slight changes in expression of p53-related genes were obscured by more marked transcriptional consequences of Rpl11 deficiency in zebrafish embryos. However, these observations are consistent with RPL11-independent activation of the p53 pathway in DBA patients [25]. In addition, p53 expression was decreased in tumor cells with dysfunctional RPs [66], suggesting that p53 expression may be sensitive to tumor and tissue environments. Consistent with cells of DBA patients, we speculate that cells of Rpl11-deficient zebrafish embryos may carry characteristics of tumor cells [13,17,67].
It remains unclear whether the entire hematopoietic defective phenotype of DBA is associated with increased expression of p53 or p53-independent mechanisms [25]. Indeed, in a recent report, dysfunctional Rpl22 and Rpl22l1 led to blockage of HSC emergence. Although Rpl22l1 plays essential roles in hematopoiesis, it did not induce apoptosis and acted independently of p53 [11]. In this study, we tested the effects of p53 on phenotypes of Rpl11-deficient zebrafish embryos by observing changes in the expression of the HSC formation marker cmyb in Rpl11 morphants and Rpl11 and p53 in double morphants at 48 hpf. In these experiments, decreased cmyb expression was not significantly rescued by p53 MO at the base of the Rpl11 MO construct (Figure 4A-C). In addition, we also tested the effects of p53 on defective hematopoietic phenotypes of Rpl11-deficient zebrafish embryos by performing hemoglobin staining of embryos injected with Rpl11 MO and Rps19 MO, both individually and with coinjections of p53 MO. O-staining showed a significant reduction in the number of hemoglobin stained blood cells in individual Rpl11 or Rps19 knockdowns. The Rps19 MO phenotype was partially rescued by coinjection with p53 MO, whereas the Rpl11 MO phenotype was not (Figure 4D-I). Taken together, these results demonstrated that Rpl11 leads to hematopoietic defects in zebrafish embryos through p53-independent pathways.
Figure 4.
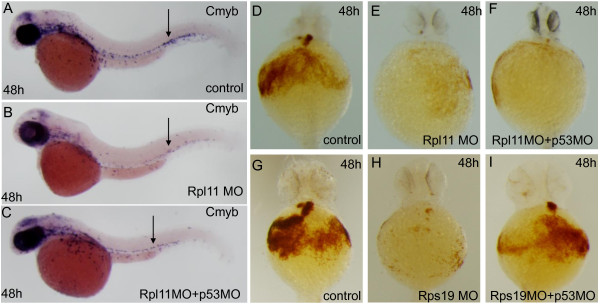
Rpl11 deficiency is required for hematopoietic defects through p53-independent pathways in zebrafish embryos. A-C, Rpl11 is required for HSC formation through p53-independent pathways. The expression of cmyb was significantly decreased in Rpl11 morphants and in Rpl11 and p53 double morphants at 48 hpf compared with that in control embryos. D-I, Rpl11 deficiency caused defective hematopoietic phenotypes in zebrafish embryos through p53-independent pathways. Hemoglobin staining of embryos individually injected with Rpl11 MO or Rps19 MO and coinjected with p53 MO were performed. D and G are controls, E and H are Rpl11 MO or Rps19 knockdown, and F and I are Rpl11 MO and Rps19 MO coinjected with p53 MO, respectively. Panel A–C, lateral views; D-I, ventral views.
Hemoglobin genes’ translation could be inhibited in Rpl11-deficient zebrafish embryos
We observed markedly reduced hemoglobin expression in Rpl11-deficient zebrafish embryos and analyzed globin expression using RT-PCR analysis data (Additional file 14: Figure S7). In total, we identified six globin transcripts hbaa1, hbae1, hbae3, hbbe1, hbbe2, and hbbe3 in zebrafish embryos at 48 hpf in RNA-Seq data. Among these, hbae1, hbae3, hbbe1, and hbbe3 are specifically expressed in embryos, while hbbe2 and hbaa1 are specifically expressed in larvae and adults, respectively [68]. Quantitative PCR analyses demonstrated decreased hbaa1 and hbbe1 expression, but increased hbae1, hbae3, hbbe2, and hbbe3 expression to varying degrees (Additional file 14: Figure S7). Given the reduced availability of heme and iron in Rpl11-deficient zebrafish, we deduced that translation of globins might depend on the availability of heme [69]. Because RPL11 deficiency specifically impairs the translation of erythroid genes in murine and human erythroblasts [26], we hypothesized that Rpl11 may specifically inhibit erythroid-specific globin translation in zebrafish embryos.
Dysfunction of iron- and heme-metabolism related genes in Rpl11-deficient zebrafish
Erythrocyte hemoglobinization involves upregulation and close integration of the heme synthesis and iron supply pathways during hematopoiesis. In Rpl11-deficient zebrafish, the vast majority of iron and heme metabolism-related genes were downregulated, contributing significantly to defective hemoglobinization and hematopoiesis. Hematopoiesis requires large amounts of iron. In serum, most iron is bound to transferrin (Tf; tfa in zebrafish), which directs iron to hemoglobin via transferrin receptor (TfR1; tfr1b in zebrafish)-mediated endocytosis [70,71]. TfR1 (tfr1b) is highly expressed in erythrocytes and is directly associated with hemoglobin synthesis and erythroid progenitor maturation [71,72]. On binding, the Fe(III)–transferrin–TfR1 complex is rapidly internalized, and iron atoms are released and directed to the mitochondria for heme synthesis [70,71]. The mitochondrial iron transporter SLC25A37 (slc25a37 in zebrafish) is also highly expressed in erythrocytes, and its activity has been shown to be rate limiting for heme synthesis in erythrocytes [57,58]. Moreover, deficiency of the Drosophila homolog mfrn causes a 90% decrease in heme synthesis, and knockout of Slc25a37 in mice leads to embryonic lethality with profound anemia [58]. Zebrafish with the mutant slc25a37 show severe hypochromic anemia due to defective mitochondrial iron uptake [57]. ALAS2 is an erythroid-specific rate-limiting enzyme responsible for synthesis of protoporphyrin IX, which is transported out of the mitochondria and installed in globin chains for hemoglobin biosynthesis [73]. Indeed, mutations of Alas2 in mice caused sideroblastic anemia [51]. Finally, FTMT was not expressed in normal erythroblasts but was highly expressed in patients with sideroblastic anemia [62]. Upregulation of FTMT results in accumulation of mitochondrial iron followed by disruption of intracellular iron homeostasis [36]. Moreover, overexpression of FTMT limits the availability of iron for heme synthesis and impairs mitochondrial iron metabolism [37]. We also observed increased expression of the putative zebrafish FTMT homologs zgc:194125, zgc:109934, and zgc:173594 in Rpl11-deficient zebrafish embryos, further indicating hematopoiesis-associated disease exists in Rpl11-deficient zebrafish. Taken together, these observations suggest that Rpl11 participates in zebrafish hematopoiesis as a regulator of iron and heme metabolism.
Rpl11-deficient zebrafish could serve as a human DBA model
RPL11 gene mutation leads to disease phenotypes of human DBA, including hematopoietic defects and physical deformities [18]. In zebrafish, Rpl11 deficiency leads to hematopoietic and metabolic defects [8] as well as brain developmental abnormalities [31]. Zebrafish with dysfunctional RPs have been regarded as suitable animal models for DBA studies [30]. Using the Rpl11-deficient zebrafish model and transcriptome deep sequencing, we have added crucial details to the understanding of the biological functions of Rpl11 in zebrafish and have elucidated potential mechanisms by which Rpl11 regulates hematopoiesis. Future studies will determine which pathways and regulatory mechanisms are common to both human DBAs and this zebrafish model. Zebrafish may serve as model systems for human diseases, and hence, our findings provide an important resource and shed new insights for the study of human DBA diseases.
Conclusion
In this study, we established an Rpl11-deficient zebrafish model that showed defective hemoglobinization and hematopoiesis. To elucidate the mechanisms of hematopoietic failure, we performed mRNA transcriptome deep sequencing of Rpl11-deficient and control MO zebrafish embryos and systematically characterized Rpl11-mediated disturbances in hematological gene expression, hematopoiesis-related signaling pathways, and regulatory networks in zebrafish. We also elucidated potential mechanisms by which Rpl11 regulates hematopoiesis through genes associated with iron metabolism and proliferation and development of HSCs in zebrafish embryos or through hematopoiesis-associated pathways with unknown mechanisms (Figure 5). The present data provide new insights into the pathogenesis of RPL11-mediated DBA.
Figure 5.
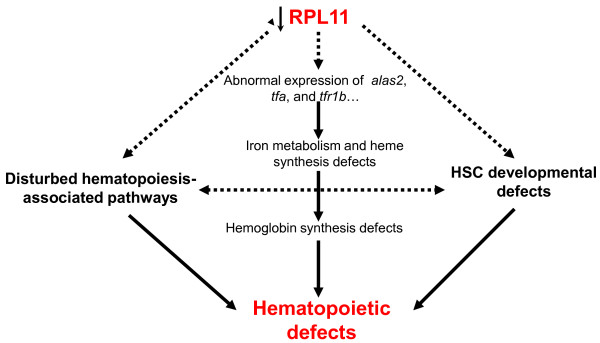
Potential molecular mechanisms by which Rpl11 deficiency leads to hematopoietic defects in zebrafish embryos. In this study, we deduced three potential mechanisms by which Rpl11 deficiency leads to hematopoietic defects in zebrafish embryos. First, Rpl11 deficiency led to abnormal expression of a set of iron metabolism- and heme synthesis-related genes. Second, Rpl11 deficiency disturbed proliferation and development of HSCs. Finally, Rpl11 deficiency disturbed several hematopoiesis-associated pathways. Solid lines represent mechanisms that have been confirmed in this or other studies, and dashed lines represent mechanisms that require further validation.
Methods
Zebrafish embryo maintenance, Rpl11 morpholino (MO) microinjection, and hemoglobin staining
Wild-type zebrafish (Danio rerio; AB type) were maintained under standard library conditions and zebrafish embryo stages (hours post fertilization; hpf) were determined as described previously [74,75]. All studies of zebrafish were approved by the Animal Care and Use Committee of Huazhong University of Science and Technology. Rpl11 Morphlino (MO; 5-CTTCTTCTCGCTCTGGTCCGCCATG-3) and control MO (5-CTTATTCGCGCTATGGTCGGCAATG-3) were obtained from Gene-Tools, LLC. The Rps19 MO, p53 MO, and control MO were previously described [76]. Zebrafish embryos at the one-cell stage were injected with MOs using a microinjector (WPI SYS-PV830). Based on the literature and our initial injection trials, 0.5-ng Rpl11 MO and control MO were chosen as the optimal concentration. The effectiveness of translational inhibition by this Rpl11 MO was tested in vivo using a Rpl11–egfp green fluorescent fusion protein. We found that at a dose of 0.5 ng/embryo, most GFP expression was knocked down. Hemoglobin in zebrafish embryos was analyzed using o-dianisidine (Sigma) as described [77]. All images were collected using an Olympus microscope with a digital camera (OLYMPUS IX71) and were imported into Adobe Photoshop CS2 9.0.2 for orientation and figure preparation.
Total RNA isolation, library preparation, and sequencing
Immediately after harvesting, 40–50 pooled embryos at 48 hpf from at least three experiment were snap-frozen in liquid nitrogen and stored at −80°C. Total RNA was extracted from pooled embryos using TRIzol reagent (Invitrogen) according to the manufacturer’s instructions. RNA concentrations were determined using NanoDrop 2000 (Thermo Scientific). The integrity of RNA samples was determined using 1.2% agarose gel electrophoresis, followed by removal of the residual genomic DNA with RNase-free DNase I (Ambion). Libraries of mRNA were constructed using the Illumina mRNA-Seq library preparation kit according to the manufacturer’s instructions. Concentration and size distribution of the libraries were determined on an Agilent Bioanalyzer DNA 2000 chip (Agilent Technologies), followed by sequencing on an Illumina Hiseq 2000 Genome Analyser platform in pair-end mode by 100-bp lengths. A total of 35–40 million reads were collected for further analysis.
RNA-Seq data analysis
Reads were processed and aligned to the UCSC zebrafish reference genome (build Zv9/danRer7, Jul. 2010) using TopHat (version 1.3.3) [78]. TopHat incorporates the Bowtie v0.12.7 algorithm to perform alignments. In brief, TopHat initially removes a portion of reads based on the quality of information accompanying each read and maps qualified reads to the reference genome. The reference index was built using Bowtie with a fasta file for the entire genome of zebrafish, which was downloaded from UCSC (http://genome.ucsc.edu/). Parameters were set by default, but the number of threads to align reads was set at 6. TopHat aligned read files were then entered into Cufflinks (version 1.2.1) software for further analyses, including transcript assembly, abundance estimation, and differential expression and regulation testing in RNA-Seq samples [79]. To calculate gene expression intensity, read counts were normalized to the number of fragments per kilobase of transcript per million mapped reads (FPKM) according to the gene length and total mapped reads [78]. Confidence intervals for estimates of FPKM were calculated using a Bayesian inference method [80]. The R package DEGseq was used to identify DEGs from RNA-Seq data. Genes with FPKM less than 1 were removed from analyses. DEGs were characterized according to the criterion of fold change (FC) >2.0 and p-value <0.05.
RT-PCR
Real-time RT-PCR was performed to verify the expression of genes detected in mRNA-seq experiments involving Rpl11-deficient and MO control zebrafish embryos. Reverse transcription was performed using the cDNA Reverse Transcription Kit (Fermentas) with oligo d(T)s. RT-PCR was performed using SYBR Green PCR Master Mix (Fermentas) with a CFX-96 Real-time PCR system according to the manufacturer’s instructions (Bio-Rad) (Additional file 15: Table S10). PCR products were analyzed using agarose gel electrophoresis to identify bands of expected sizes. Gene expression was calculated according to the real-time PCR manual of Bio-Rad and normalized to the expression of β-actin. Data were represented as mean ± SD and One-way ANOVA was performed for comparison between MO control and Rpl11-deficient embryos.
IPA analysis
Gene interaction networks and signaling pathways were generated using Ingenuity Pathways Analysis (IPA) software (http://www.ingenuity.com/) from Ingenuity® Systems. This software was used to analyze data from a variety of experimental platforms and to provide accurate biological insights into interactions between genes, proteins, chemicals, pathways, cellular phenotypes, and disease processes. Differentially expressed genes were processed using DEGseq and screened according to the criteria FC >2 and p-value <0.05. These genes were submitted to IPA for biological function, canonical pathway, and interaction network analyses. Since the current edition of IPA cannot accept and identify zebrafish gene IDs, we matched these differentially expressed zebrafish genes with their human homologs using the homolog database HomoloGene, which was downloaded from NCBI. After conversion to human homolog genes, these homologs were submitted to IPA, sets of genes that were enriched for a particular function or pathway were identified, and enrichment ratios were calculated. To determine the significance of enrichment in a particular function, IPA calculates the significance value based on the measure of involvement of the gene in the input data set with its respective molecular functions and signaling pathways [81]. The significance of networks was calculated using Fisher’s exact test, and p-values were executed using negative logarithmic transformation.
Screening of differentially expressed hematological genes
Zebrafish gene sets associated with hematological systems were identified by searching with the keywords “erythroid,” “hematopoietic,” “globin,” and “hema” using the AmiGO software of the Gene Ontology (GO) database (http://www.geneontology.org/). Differentially expressed genes (FC >2.0, p-value <0.05) detected by DEGseq were mapped to this hematological gene set, which indicated the differentially expressed hematological genes in our data set. Mapping and drawing of the scatter diagrams were accomplished using R scripts.
Cluster analysis
Expression intensities of differentially expressed hematological genes were used in cluster analyses. Gene expression intensity was normalized using the equation , where x i is the FPKM value and is the mean FPKM value of a gene calculated from two samples. Average linkage hierarchical clustering was performed in this study using Pearson distance as the measure between genes and samples. Computation and visualization were achieved using the heatmap plus package in R.
Data access
Supporting data sets are available in the Gene Expression Omnibus, with the accession number GSE45699. The following link has been created to allow review of record GSE51326 while it remains in private status: http://www.ncbi.nlm.nih.gov/geo/query/acc.cgi?token=mzcbuyyipbixhun&acc=GSE51326.
Abbreviations
DBA: Diamond–Blackfan anemia; Rpl11: Ribosomal protein L11; HSC: Hematopoietic stem cells; FPKM: The number of fragments per kilobase of transcript per million mapped reads; DEGs: Differentially expressed genes; RPs: Ribosomal proteins.
Competing interests
The authors declare that they have no competing interests.
Authors' contributions
ZZ was involved in mRNA-Seq library preparation, carried out bioinformatics studies and data organization, and drafted the manuscript. HJ established Rpl11-deficient zebrafish model, carried out zebrafish related experiments, and participated in data organization. QZ participated in the sequence alignment and bioinformatics analysis. YW, YZ, QJ and WZ participated in zebrafish related experiments. WY and TC participated in its overall design and instruction, and revised it critically for important intellectual content. XF and XZ conceived of the study, participated in coordination, and gave final approval of the version to be published. All authors read and approved the final manuscript.
Supplementary Material
RNA-seq reads mapping analysis.
All gene transcripts detected in Rpl11-deficient and MO control zebrafish embryos using RNA-seq.
All DEGs in Rpl11-deficient zebrafish embryos at 48 hpf. This table includes up- and downregulated genes in Rpl11-deficient zebrafish embryos (fold change>1.5 or 2, p-value<0.05).
Specifically expressed genes in MO control and Rpl11-deficient zebrafish embryos.
GO enrichment of up- and downregulated genes in Rpl11-deficient zebrafish embryos at 48 hpf. GO enrichment includes three analytical aspects: biological process, molecular function, and cellular component. DEGs in Rpl11-deficient zebrafish embryos at 48 hpf (FC >2, p-value <0.05) were included in this analysis. Blue labeled functions are associated with DEGs in Rpl11-deficient zebrafish embryos. This figure was generated using AmiGO software (http://www.geneontology.org/). Figure S1, GO enrichment of upregulated genes in Rpl11-deficient zebrafish embryos at 48 hpf. Figure S2, GO enrichment of downregulated genes in Rpl11-deficient zebrafish embryos at 48 hpf.
Genes involved in GO enrichment of up- and downregulated DEGs in Rpl11-deficient zebrafish embryos.
qPCR analyses of human FTMT homologs in Rpl11-deficient zebrafish embryos at 48 hpf. These genes were zgc:194125, zgc:173594, and zgc:109934, which were specifically enriched in iron metabolism-associated functions such as iron transport and cellular iron homeostasis in GO analyses, and were upregualted in Rpl11-deficient zebrafish embryos (Mean ± SD, one-way ANOVA, **P < 0.01, *<0.05, n = 3). Gene expression in MO control samples was normalized to 1.
Scatter plot of DEGs in Rpl11-deficient zebrafish embryos at 48 hpf. DEGs affected by Rpl11 deficiency in zebrafish embryos at 48 hpf are shown (FC >1.5, p-value <0.05), and affected hematological genes (highlighted red) were further analyzed.
Affected hematological genes enriched in GO items.
Disturbed signaling pathways in Rpl11-deficient zebrafish embryos. This table includes up- and downregulated signaling pathways in Rpl11-deficient zebrafish embryos at 48 hpf.
Networks affected by Rpl11 deficiency in zebrafish embryos at 48 hpf. Networks were generated using online IPA software, and highly enriched networks were selected (Score > 20). Genes labeled red and green were up- and downregulated, respectively. Figure S5 (A-C), Upregulated networks affected by Rpl11 deficiency in zebrafish embryos at 48 hpf. A, Networks of cellular function and maintenance, small molecule biochemistry, and carbohydrate metabolism. B, Networks of cellular development, cellular growth and proliferation, and connective tissue development and function. C, Networks of cell death and survival, connective tissue disorders, and immunological disease. Figure S6 (A-E), Downregulated networks affected by Rpl11 deficiency in zebrafish embryos at 48 hpf. A, Networks of developmental disorders, skeletal and muscular disorders, and digestive system development and function. B, Networks of cellular development, visual system development and function, nervous system development and function, cellular growth and proliferation, connective tissue development and function, neurological disease, and tissue morphology. C, Networks of cell death and survival, cardiac pulmonary embolism, and cardiovascular disease. D, Networks of cancer, cell cycle, and tissue morphology. E, Networks of cell cycle, cell morphology, and cell-to-cell signaling and interaction.
Genes involved in regulatory interacting networks disturbed in Rpl11-deficiet zebrafish embryos.
Description of blood cell lineage markers. Description of blood cell lineage markers, including cmyb, hoxb4a, tal1, mpx, spi1, and ikzf1, were shown. Blood cell lineages, including hematopoietic stem cells, granulocytes, myelocytes, and lymphoid progenitors were detected in this study. Fold change represents FPKM in Rpl11-deficient zebrafish embryos compared to that of MO control.
RT-PCR analyses of changes in the expression of globin genes in zebrafish embryos after Rpl11 knockdown. A, RT-PCR analysis of changes in expression of globin genes in zebrafish embryos after Rpl11 knockdown (Mean ± SD, one-way ANOVA, **P < 0.01, *<0.05, n = 3). Gene expression in MO control samples was normalized to 1; B, Description of globin genes detected in deep sequencing samples.
RT-PCR primers used in this study.
Contributor Information
Zhaojun Zhang, Email: zhangzhaojun@big.ac.cn.
Haibo Jia, Email: haibo.jia@hust.edu.cn.
Qian Zhang, Email: zhangqian@big.ac.cn.
Yang Wan, Email: wanyang1988pumc@126.com.
Yang Zhou, Email: zhou1988@hust.edu.cn.
Qiong Jia, Email: jia.qiong2007@163.com.
Wanguang Zhang, Email: wgzhang@tjh.tjmu.edu.cn.
Weiping Yuan, Email: wpyuan@ihcams.ac.cn.
Tao Cheng, Email: chengt@pumc.edu.cn.
Xiaofan Zhu, Email: zhuxf6465@gmail.com.
Xiangdong Fang, Email: fangxd@big.ac.cn.
Acknowledgements
This work was supported by the “Strategic Priority Research Program” of the Chinese Academy of Sciences, Stem Cell and Regenerative Medicine Research (XDA01040405); National “Twelfth Five-Year” Plan for Science & Technology Support (2013BAI01B09); the following funds from the Ministry of Science and Technology (2013CB945300, 2012CB966603, 2013CB966902, 2010CB945204, 2012AA022502); NSFC (81090414, 81170470, 81130074, 31171387, 31000640, 81070390, 31371300, 31100924); the National Key Scientific Instrument and Equipment Development Projects of China (2011YQ03013404); Hubei National Natural Science Foundation Grant 2010CDB02402 and State Key Laboratory of Experimental Hematology Pilot Project Grant (ZK12-05, ZK13-05).
References
- Narla A, Ebert BL. Ribosomopathies: human disorders of ribosome dysfunction. Blood. 2010;14(16):3196–3205. doi: 10.1182/blood-2009-10-178129. [DOI] [PMC free article] [PubMed] [Google Scholar]
- Lipton JM, Ellis SR. Diamond Blackfan anemia 2008–2009: broadening the scope of ribosome biogenesis disorders. Curr Opin Pediatr. 2010;14(1):12–19. doi: 10.1097/MOP.0b013e328334573b. [DOI] [PMC free article] [PubMed] [Google Scholar]
- Ganapathi KA, Shimamura A. Ribosomal dysfunction and inherited marrow failure. Br J Haematol. 2008;14(3):376–387. doi: 10.1111/j.1365-2141.2008.07095.x. [DOI] [PubMed] [Google Scholar]
- Sieff CA, Yang J, Merida‒Long LB, Lodish HF. Pathogenesis of the erythroid failure in Diamond Blackfan anaemia. Br J Haematol. 2010;14(4):611–622. doi: 10.1111/j.1365-2141.2009.07993.x. [DOI] [PMC free article] [PubMed] [Google Scholar]
- Deisenroth C, Zhang Y. The ribosomal protein-Mdm2-p53 pathway and energy metabolism bridging the Gap between feast and famine. Genes Cancer. 2011;14(4):392–403. doi: 10.1177/1947601911409737. [DOI] [PMC free article] [PubMed] [Google Scholar]
- Dutt S, Narla A, Lin K, Mullally A, Abayasekara N, Megerdichian C, Wilson FH, Currie T, Khanna-Gupta A, Berliner N. et al. Haploinsufficiency for ribosomal protein genes causes selective activation of p53 in human erythroid progenitor cells. Blood. 2011;14(9):2567–2576. doi: 10.1182/blood-2010-07-295238. [DOI] [PMC free article] [PubMed] [Google Scholar]
- Hamaguchi I, Ooka A, Brun A, Richter J, Dahl N, Karlsson S. Gene transfer improves erythroid development in ribosomal protein S19-deficient Diamond-Blackfan anemia. Blood. 2002;14(8):2724–2731. doi: 10.1182/blood.V100.8.2724. [DOI] [PubMed] [Google Scholar]
- Danilova N, Sakamoto KM, Lin S. Ribosomal protein L11 mutation in zebrafish leads to haematopoietic and metabolic defects. Br J Haematol. 2011;14(2):217–228. doi: 10.1111/j.1365-2141.2010.08396.x. [DOI] [PMC free article] [PubMed] [Google Scholar]
- Duan J, Ba Q, Wang Z, Hao M, Li X, Hu P, Zhang D, Zhang R, Wang H. Knockdown of ribosomal protein S7 causes developmental abnormalities via p53 dependent and independent pathways in zebrafish. Int J Biochem Cell Biol. 2011;14(8):1218–1227. doi: 10.1016/j.biocel.2011.04.015. [DOI] [PubMed] [Google Scholar]
- Taylor AM, Humphries JM, White RM, Murphey RD, Burns CE, Zon LI. Hematopoietic defects in rps29 mutant zebrafish depend upon p53 activation. Exp Hematol. 2012;14(3):228–237. doi: 10.1016/j.exphem.2011.11.007. [DOI] [PMC free article] [PubMed] [Google Scholar]
- Zhang Y, Duc A-CE, Rao S, Sun X-L, Bilbee AN, Rhodes M, Li Q, Kappes DJ, Rhodes J, Wiest DL. Control of hematopoietic stem cell emergence by antagonistic functions of ribosomal protein paralogs. Dev Cell. 2013;14(4):411–425. doi: 10.1016/j.devcel.2013.01.018. [DOI] [PMC free article] [PubMed] [Google Scholar]
- Ball SE, McGuckin CP, Jenkins G, Gordon-Smith EC. Diamond-Blackfan anaemia in the U.K.: analysis of 80 cases from a 20-year birth cohort. Br J Haematol. 1996;14(4):645–653. doi: 10.1046/j.1365-2141.1996.d01-1839.x. [DOI] [PubMed] [Google Scholar]
- Lipton JM, Atsidaftos E, Zyskind I, Vlachos A. Improving clinical care and elucidating the pathophysiology of Diamond Blackfan anemia: an update from the Diamond Blackfan Anemia Registry. Pediatr Blood Cancer. 2006;14(5):558–564. doi: 10.1002/pbc.20642. [DOI] [PubMed] [Google Scholar]
- Ellis SR, Gleizes PE. Diamond Blackfan anemia: ribosomal proteins going rogue. Semin Hematol. 2011;14(2):89–96. doi: 10.1053/j.seminhematol.2011.02.005. [DOI] [PubMed] [Google Scholar]
- Boria I, Garelli E, Gazda HT, Aspesi A, Quarello P, Pavesi E, Ferrante D, Meerpohl JJ, Kartal M, Da Costa L. et al. The ribosomal basis of Diamond-Blackfan Anemia: mutation and database update. Hum Mutat. 2010;14(12):1269–1279. doi: 10.1002/humu.21383. [DOI] [PMC free article] [PubMed] [Google Scholar]
- Da Costa L, Moniz H, Simansour M, Tchernia G, Mohandas N, Leblanc T. Diamond-Blackfan anemia, ribosome and erythropoiesis. Transfus Clin Biol. 2010;14(3):112–119. doi: 10.1016/j.tracli.2010.06.001. [DOI] [PMC free article] [PubMed] [Google Scholar]
- Gazda HT, Sheen MR, Vlachos A, Choesmel V, O’Donohue MF, Schneider H, Darras N, Hasman C, Sieff CA, Newburger PE. et al. Ribosomal protein L5 and L11 mutations are associated with cleft palate and abnormal thumbs in Diamond-Blackfan anemia patients. Am J Hum Genet. 2008;14(6):769–780. doi: 10.1016/j.ajhg.2008.11.004. [DOI] [PMC free article] [PubMed] [Google Scholar]
- Cmejla R, Cmejlova J, Handrkova H, Petrak J, Petrtylova K, Mihal V, Stary J, Cerna Z, Jabali Y, Pospisilova D. Identification of mutations in the ribosomal protein L5 (RPL5) and ribosomal protein L11 (RPL11) genes in Czech patients with Diamond‒Blackfan anemia. Hum Mutat. 2009;14(3):321–327. doi: 10.1002/humu.20874. [DOI] [PubMed] [Google Scholar]
- Quarello P, Garelli E, Carando A, Brusco A, Calabrese R, Dufour C, Longoni D, Misuraca A, Vinti L, Aspesi A. Diamond-Blackfan anemia: genotype-phenotype correlations in Italian patients with RPL5 and RPL11 mutations. Haematologica. 2010;14(2):206–213. doi: 10.3324/haematol.2009.011783. [DOI] [PMC free article] [PubMed] [Google Scholar]
- Gazda HT, Grabowska A, Merida-Long LB, Latawiec E, Schneider HE, Lipton JM, Vlachos A, Atsidaftos E, Ball SE, Orfali KA. Ribosomal protein S24 gene is mutated in Diamond-Blackfan anemia. Am J Hum Genet. 2006;14(6):1110–1118. doi: 10.1086/510020. [DOI] [PMC free article] [PubMed] [Google Scholar]
- Cmejla R, Cmejlova J, Handrkova H, Petrak J, Pospisilova D. Ribosomal protein S17 gene (RPS17) is mutated in Diamond‒Blackfan anemia. Hum Mutat. 2007;14(12):1178–1182. doi: 10.1002/humu.20608. [DOI] [PubMed] [Google Scholar]
- Farrar JE, Nater M, Caywood E, McDevitt MA, Kowalski J, Takemoto CM, Talbot CC Jr, Meltzer P, Esposito D, Beggs AH. Abnormalities of the large ribosomal subunit protein, Rpl35A, in diamond-blackfan anemia. Blood. 2008;14(5):1582–1592. doi: 10.1182/blood-2008-02-140012. [DOI] [PMC free article] [PubMed] [Google Scholar]
- Doherty L, Sheen MR, Vlachos A, Choesmel V, O’donohue MF, Clinton C, Schneider HE, Sieff CA, Newburger PE, Ball SE. Ribosomal protein genes RPS10 and RPS26 are commonly mutated in Diamond-Blackfan anemia. Am J Hum Genet. 2010;14(2):222–228. doi: 10.1016/j.ajhg.2009.12.015. [DOI] [PMC free article] [PubMed] [Google Scholar]
- Draptchinskaia N, Gustavsson P, Andersson B, Pettersson M. The gene encoding ribosomal protein S19 is mutated in Diamond-Blackfan anaemia. Nat Genet. 1999;14(2):169–175. doi: 10.1038/5951. [DOI] [PubMed] [Google Scholar]
- Moniz H, Gastou M, Leblanc T, Hurtaud C, Crétien A, Lécluse Y, Raslova H, Larghero J, Croisille L, Faubladier M. Primary hematopoietic cells from DBA patients with mutations in RPL11 and RPS19 genes exhibit distinct erythroid phenotype in vitro. Cell Death Dis. 2012;14(7):e356. doi: 10.1038/cddis.2012.88. [DOI] [PMC free article] [PubMed] [Google Scholar]
- Horos R, Ijspeert H, Pospisilova D, Sendtner R, Andrieu-Soler C, Taskesen E, Nieradka A, Cmejla R, Sendtner M, Touw IP. et al. Ribosomal deficiencies in Diamond-Blackfan anemia impair translation of transcripts essential for differentiation of murine and human erythroblasts. Blood. 2012;14(1):262–272. doi: 10.1182/blood-2011-06-358200. [DOI] [PubMed] [Google Scholar]
- Storer NY, Zon LI. Zebrafish Models of p53 Functions. Cold Spring Harb Perspect Biol. 2010;14(8):a001123. doi: 10.1101/cshperspect.a001123. [DOI] [PMC free article] [PubMed] [Google Scholar]
- Jing L, Zon LI. Zebrafish as a model for normal and malignant hematopoiesis. Dis Model Mech. 2011;14(4):433–438. doi: 10.1242/dmm.006791. [DOI] [PMC free article] [PubMed] [Google Scholar]
- Uechi T, Nakajima Y, Nakao A, Torihara H, Chakraborty A, Inoue K, Kenmochi N. Ribosomal protein gene knockdown causes developmental defects in zebrafish. PLoS One. 2006;14(1):e37. doi: 10.1371/journal.pone.0000037. [DOI] [PMC free article] [PubMed] [Google Scholar]
- Torihara H, Uechi T, Chakraborty A, Shinya M, Sakai N, Kenmochi N. Erythropoiesis failure due to RPS19 deficiency is independent of an activated Tp53 response in a zebrafish model of Diamond–Blackfan anaemia. Br J Haematol. 2011;14(5):648–654. doi: 10.1111/j.1365-2141.2010.08535.x. [DOI] [PubMed] [Google Scholar]
- Chakraborty A, Uechi T, Higa S, Torihara H, Kenmochi N. Loss of ribosomal protein L11 affects zebrafish embryonic development through a p53-dependent apoptotic response. PLoS One. 2009;14(1):e4152. doi: 10.1371/journal.pone.0004152. [DOI] [PMC free article] [PubMed] [Google Scholar]
- Provost E, Wehner KA, Zhong X, Ashar F, Nguyen E, Green R, Parsons MJ, Leach SD. Ribosomal biogenesis genes play an essential and p53-independent role in zebrafish pancreas development. Development. 2012;14(17):3232–3241. doi: 10.1242/dev.077107. [DOI] [PMC free article] [PubMed] [Google Scholar]
- Vesterlund L, Jiao H, Unneberg P, Hovatta O, Kere J. The zebrafish transcriptome during early development. BMC Dev Biol. 2011;14(1):30. doi: 10.1186/1471-213X-11-30. [DOI] [PMC free article] [PubMed] [Google Scholar]
- Aanes H, Winata CL, Lin CH, Chen JP, Srinivasan KG, Lee SG, Lim AY, Hajan HS, Collas P, Bourque G. Zebrafish mRNA sequencing deciphers novelties in transcriptome dynamics during maternal to zygotic transition. Genome Res. 2011;14(8):1328–1338. doi: 10.1101/gr.116012.110. [DOI] [PMC free article] [PubMed] [Google Scholar]
- Mortazavi A, Williams BA, McCue K, Schaeffer L, Wold B. Mapping and quantifying mammalian transcriptomes by RNA-Seq. Nat Methods. 2008;14(7):621–628. doi: 10.1038/nmeth.1226. [DOI] [PubMed] [Google Scholar]
- Nie G, Sheftel AD, Kim SF, Ponka P. Overexpression of mitochondrial ferritin causes cytosolic iron depletion and changes cellular iron homeostasis. Blood. 2005;14(5):2161–2167. doi: 10.1182/blood-2004-07-2722. [DOI] [PubMed] [Google Scholar]
- Richardson DR, Lane DJR, Becker EM, Huang MLH, Whitnall M, Rahmanto YS, Sheftel AD, Ponka P. Mitochondrial iron trafficking and the integration of iron metabolism between the mitochondrion and cytosol. Proc Natl Acad Sci U S A. 2010;14(24):10775–10782. doi: 10.1073/pnas.0912925107. [DOI] [PMC free article] [PubMed] [Google Scholar]
- Bauer A, Tronche F, Wessely O, Kellendonk C, Reichardt HM, Steinlein P, Schutz G, Beug H. The glucocorticoid receptor is required for stress erythropoiesis. Genes Dev. 1999;14(22):2996–3002. doi: 10.1101/gad.13.22.2996. [DOI] [PMC free article] [PubMed] [Google Scholar]
- Flygare J, Rayon Estrada V, Shin C, Gupta S, Lodish HF. HIF1alpha synergizes with glucocorticoids to promote BFU-E progenitor self-renewal. Blood. 2011;14(12):3435–3444. doi: 10.1182/blood-2010-07-295550. [DOI] [PMC free article] [PubMed] [Google Scholar]
- Correa PN, Axelrad AA. Production of erythropoietic bursts by progenitor cells from adult human peripheral blood in an improved serum-free medium: role of insulinlike growth factor 1. Blood. 1991;14(11):2823–2833. [PubMed] [Google Scholar]
- Klusmann JH, Godinho FJ, Heitmann K, Maroz A, Koch ML, Reinhardt D, Orkin SH, Li Z. Developmental stage-specific interplay of GATA1 and IGF signaling in fetal megakaryopoiesis and leukemogenesis. Genes Dev. 2010;14(15):1659–1672. doi: 10.1101/gad.1903410. [DOI] [PMC free article] [PubMed] [Google Scholar]
- Ratajczak J, Zhang Q, Pertusini E, Wojczyk B, Wasik M, Ratajczak M. The role of insulin (INS) and insulin-like growth factor-I (IGF-I) in regulating human erythropoiesis. Studies in vitro under serum-free conditions: comparison to other cytokines and growth factors. Leukemia. 1998;14(3):371–381. doi: 10.1038/sj.leu.2400927. [DOI] [PubMed] [Google Scholar]
- Krstic A, Mojsilovic S, Jovcic G, Bugarski D. The potential of interleukin-17 to mediate hematopoietic response. Immunol Res. 2012;14(1–2):34–41. doi: 10.1007/s12026-012-8276-8. [DOI] [PubMed] [Google Scholar]
- Marks-Bluth J, Pimanda JE. Cell signalling pathways that mediate haematopoietic stem cell specification. Int J Biochem Cell Biol. 2012;14(12):2175–2184. doi: 10.1016/j.biocel.2012.09.007. [DOI] [PubMed] [Google Scholar]
- Luis TC, Naber BAE, Roozen PPC, Brugman MH, de Haas EFE, Ghazvini M, Fibbe WE, van Dongen JJM, Fodde R, Staal FJT. Canonical Wnt signaling regulates hematopoiesis in a dosage-dependent fashion. Cell Stem Cell. 2011;14(4):345–356. doi: 10.1016/j.stem.2011.07.017. [DOI] [PubMed] [Google Scholar]
- Ruiz-Herguido C, Guiu J, D’Altri T, Ingles-Esteve J, Dzierzak E, Espinosa L, Bigas A. Hematopoietic stem cell development requires transient Wnt/beta-catenin activity. J Exp Med. 2012;14(8):1457–1468. doi: 10.1084/jem.20120225. [DOI] [PMC free article] [PubMed] [Google Scholar]
- Tran HT, Sekkali B, Van Imschoot G, Janssens S, Vleminckx K. Wnt/β-catenin signaling is involved in the induction and maintenance of primitive hematopoiesis in the vertebrate embryo. Proc Natl Acad Sci USA. 2010;14(37):16160–16165. doi: 10.1073/pnas.1007725107. [DOI] [PMC free article] [PubMed] [Google Scholar]
- Zhang C, Patient R, Liu F. Hematopoietic stem cell development and regulatory signaling in zebrafish. Biochim Biophys Acta. 2012;14(2):2370–2374. doi: 10.1016/j.bbagen.2012.06.008. [DOI] [PubMed] [Google Scholar]
- Singh KP, Garrett RW, Casado FL, Gasiewicz TA. Aryl hydrocarbon receptor-null allele mice have hematopoietic stem/progenitor cells with abnormal characteristics and functions. Stem Cells Dev. 2010;14(5):769–784. doi: 10.1089/scd.2010.0333. [DOI] [PMC free article] [PubMed] [Google Scholar]
- Wingert RA, Galloway JL, Barut B, Foott H, Fraenkel P, Axe JL, Weber GJ, Dooley K, Davidson AJ, Schmid B. et al. Deficiency of glutaredoxin 5 reveals Fe-S clusters are required for vertebrate haem synthesis. Nature. 2005;14(7053):1035–1039. doi: 10.1038/nature03887. [DOI] [PubMed] [Google Scholar]
- Bottomley SS, May BK, Cox TC, Cotter PD, Bishop DF. Molecular defects of erythroid 5-aminolevulinate synthase in X-linked sideroblastic anemia. J Bioenerg Biomembr. 1995;14(2):161–168. doi: 10.1007/BF02110031. [DOI] [PubMed] [Google Scholar]
- Roy CN, Weinstein DA, Andrews NC. 2002 E. Mead Johnson award for research in pediatrics lecture: the molecular biology of the anemia of chronic disease: a hypothesis. Pediatr Res. 2003;14(3):507–512. doi: 10.1203/01.PDR.0000049513.67410.2D. [DOI] [PubMed] [Google Scholar]
- Levy JE, Jin O, Fujiwara Y, Kuo F, Andrews NC. Transferrin receptor is necessary for development of erythrocytes and the nervous system. Nat Genet. 1999;14(4):396–399. doi: 10.1038/7727. [DOI] [PubMed] [Google Scholar]
- Cooperman SS, Meyron-Holtz EG, Olivierre-Wilson H, Ghosh MC, McConnell JP, Rouault TA. Microcytic anemia, erythropoietic protoporphyria, and neurodegeneration in mice with targeted deletion of iron-regulatory protein 2. Blood. 2005;14(3):1084–1091. doi: 10.1182/blood-2004-12-4703. [DOI] [PMC free article] [PubMed] [Google Scholar]
- Ferreira C, Bucchini D, Martin ME, Levi S, Arosio P, Grandchamp B, Beaumont C. Early embryonic lethality of H ferritin gene deletion in mice. J Biol Chem. 2000;14(5):3021–3024. doi: 10.1074/jbc.275.5.3021. [DOI] [PubMed] [Google Scholar]
- Thompson K, Menzies S, Muckenthaler M, Torti FM, Wood T, Torti SV, Hentze MW, Beard J, Connor J. Mouse brains deficient in H-ferritin have normal iron concentration but a protein profile of iron deficiency and increased evidence of oxidative stress. J Neurosci Res. 2003;14(1):46–63. doi: 10.1002/jnr.10463. [DOI] [PubMed] [Google Scholar]
- Shaw GC, Cope JJ, Li L, Corson K, Hersey C, Ackermann GE, Gwynn B, Lambert AJ, Wingert RA, Traver D. Mitoferrin is essential for erythroid iron assimilation. Nature. 2006;14(7080):96–100. doi: 10.1038/nature04512. [DOI] [PubMed] [Google Scholar]
- Paradkar PN, Zumbrennen KB, Paw BH, Ward DM, Kaplan J. Regulation of mitochondrial iron import through differential turnover of mitoferrin 1 and mitoferrin 2. Mol Cell Biol. 2009;14(4):1007–1016. doi: 10.1128/MCB.01685-08. [DOI] [PMC free article] [PubMed] [Google Scholar]
- Jeong SY, David S. Age-related changes in iron homeostasis and cell death in the cerebellum of ceruloplasmin-deficient mice. J Neurosci. 2006;14(38):9810–9819. doi: 10.1523/JNEUROSCI.2922-06.2006. [DOI] [PMC free article] [PubMed] [Google Scholar]
- Lumsden AL, Henshall TL, Dayan S, Lardelli MT, Richards RI. Huntingtin-deficient zebrafish exhibit defects in iron utilization and development. Hum Mol Genet. 2007;14(16):1905–1920. doi: 10.1093/hmg/ddm138. [DOI] [PubMed] [Google Scholar]
- Fleming MD, Campagna DR, Haslett JN, Trenor CC, Andrews NC. A mutation in a mitochondrial transmembrane protein is responsible for the pleiotropic hematological and skeletal phenotype of flexed-tail (f/f) mice. Genes Dev. 2001;14(6):652–657. doi: 10.1101/gad.873001. [DOI] [PMC free article] [PubMed] [Google Scholar]
- Cazzola M, Invernizzi R, Bergamaschi G, Levi S, Corsi B, Travaglino E, Rolandi V, Biasiotto G, Drysdale J, Arosio P. Mitochondrial ferritin expression in erythroid cells from patients with sideroblastic anemia. Blood. 2003;14(5):1996–2000. doi: 10.1182/blood-2002-07-2006. [DOI] [PubMed] [Google Scholar]
- Antonchuk J, Sauvageau G, Humphries RK. HOXB4-induced expansion of adult hematopoietic stem cells ex vivo. Cell. 2002;14(1):39–45. doi: 10.1016/S0092-8674(02)00697-9. [DOI] [PubMed] [Google Scholar]
- Wilson NK, Miranda-Saavedra D, Kinston S, Bonadies N, Foster SD, Calero-Nieto F, Dawson MA, Donaldson IJ, Dumon S, Frampton J. The transcriptional program controlled by the stem cell leukemia gene Scl/Tal1 during early embryonic hematopoietic development. Blood. 2009;14(22):5456–5465. doi: 10.1182/blood-2009-01-200048. [DOI] [PubMed] [Google Scholar]
- Fumagalli S, Thomas G. The role of p53 in ribosomopathies. Seminars in hematology. 2011;14(2):97–105. doi: 10.1053/j.seminhematol.2011.02.004. [DOI] [PubMed] [Google Scholar]
- MacInnes AW, Amsterdam A, Whittaker CA, Hopkins N, Lees JA. Loss of p53 synthesis in zebrafish tumors with ribosomal protein gene mutations. Proc Natl Acad Sci U S A. 2008;14(30):10408–10413. doi: 10.1073/pnas.0805036105. [DOI] [PMC free article] [PubMed] [Google Scholar]
- Lipton JM, Federman N, Khabbaze Y, Schwartz CL, Hilliard LM, Clark JI, Vlachos A. Osteogenic sarcoma associated with Diamond-Blackfan anemia: a report from the Diamond-Blackfan Anemia Registry. J Pediatr Hematol Oncol. 2001;14(1):39–44. doi: 10.1097/00043426-200101000-00009. [DOI] [PubMed] [Google Scholar]
- Ganis JJ, Hsia N, Trompouki E, de Jong JLO, DiBiase A, Lambert JS, Jia ZY, Sabo PJ, Weaver M, Sandstrom R. et al. Zebrafish globin switching occurs in two developmental stages and is controlled by the LCR. Dev Biol. 2012;14(2):185–194. doi: 10.1016/j.ydbio.2012.03.021. [DOI] [PMC free article] [PubMed] [Google Scholar]
- Chen JJ. Regulation of protein synthesis by the heme-regulated eIF2alpha kinase: relevance to anemias. Blood. 2007;14(7):2693–2699. doi: 10.1182/blood-2006-08-041830. [DOI] [PMC free article] [PubMed] [Google Scholar]
- Ponka P. Tissue-specific regulation of iron metabolism and heme synthesis: distinct control mechanisms in erythroid cells. Blood. 1997;14(1):1–25. [PubMed] [Google Scholar]
- De Domenico I, Ward DM, Kaplan J. Regulation of iron acquisition and storage: consequences for iron-linked disorders. Nat Rev Mol Cell Biol. 2008;14(1):72–81. doi: 10.1038/nrm2295. [DOI] [PubMed] [Google Scholar]
- Hentze MW, Muckenthaler MU, Andrews NC. Balancing acts: molecular control of mammalian iron metabolism. Cell. 2004;14(3):285–297. doi: 10.1016/S0092-8674(04)00343-5. [DOI] [PubMed] [Google Scholar]
- Furuyama K, Kaneko K, Vargas VPD. Heme as a magnificent molecule with multiple missions: heme determines its own fate and governs cellular homeostasis. Tohoku J Exp Med. 2007;14(1):1–16. doi: 10.1620/tjem.213.1. [DOI] [PubMed] [Google Scholar]
- Westerfield M, Doerry E, Douglas S. Zebrafish in the Net. Trends Genet. 1999;14(6):248–249. doi: 10.1016/S0168-9525(99)01741-2. [DOI] [PubMed] [Google Scholar]
- Kimmel CB, Ballard WW, Kimmel SR, Ullmann B, Schilling TF. Stages of embryonic development of the zebrafish. Dev Dyn. 1995;14(3):253–310. doi: 10.1002/aja.1002030302. [DOI] [PubMed] [Google Scholar]
- Jia Q, Zhang Q, Zhang ZJ, Wang YQ, Zhang WG, Zhou Y, Wan Y, Cheng T, Zhu XF, Fang XD. et al. Transcriptome analysis of the zebrafish model of diamond-blackfan anemia from RPS19 deficiency via p53-dependent and -independent pathways. Plos One. 2013;14(8):e71782. doi: 10.1371/journal.pone.0071782. [DOI] [PMC free article] [PubMed] [Google Scholar]
- Hr D, Kieran MW, Chan FY, Barone LM, Yee K, Rundstadler JA, Pratt S, Ransom D, Zon LI. Intraembryonic hematopoietic cell migration during vertebrate development. Proc Natl Acad Sci U S A. 1995;14(23):10713–10717. doi: 10.1073/pnas.92.23.10713. [DOI] [PMC free article] [PubMed] [Google Scholar]
- Trapnell C, Williams BA, Pertea G, Mortazavi A, Kwan G, van Baren MJ, Salzberg SL, Wold BJ, Pachter L. Transcript assembly and quantification by RNA-Seq reveals unannotated transcripts and isoform switching during cell differentiation. Nat Biotechnol. 2010;14(5):511–515. doi: 10.1038/nbt.1621. [DOI] [PMC free article] [PubMed] [Google Scholar]
- Roberts A, Trapnell C, Donaghey J, Rinn JL, Pachter L. Improving RNA-Seq expression estimates by correcting for fragment bias. Genome Biol. 2011;14(3):R22. doi: 10.1186/gb-2011-12-3-r22. [DOI] [PMC free article] [PubMed] [Google Scholar]
- Jiang H, Wong WH. Statistical inferences for isoform expression in RNA-Seq. Bioinformatics. 2009;14(8):1026–1032. doi: 10.1093/bioinformatics/btp113. [DOI] [PMC free article] [PubMed] [Google Scholar]
- Hegde A, Qiu NC, Qiu X, Ho SH, Tay KQ, George J, Ng FS, Govindarajan KR, Gong Z, Mathavan S. et al. Genomewide expression analysis in zebrafish mind bomb alleles with pancreas defects of different severity identifies putative Notch responsive genes. PLoS One. 2008;14(1):e1479. doi: 10.1371/journal.pone.0001479. [DOI] [PMC free article] [PubMed] [Google Scholar]
Associated Data
This section collects any data citations, data availability statements, or supplementary materials included in this article.
Supplementary Materials
RNA-seq reads mapping analysis.
All gene transcripts detected in Rpl11-deficient and MO control zebrafish embryos using RNA-seq.
All DEGs in Rpl11-deficient zebrafish embryos at 48 hpf. This table includes up- and downregulated genes in Rpl11-deficient zebrafish embryos (fold change>1.5 or 2, p-value<0.05).
Specifically expressed genes in MO control and Rpl11-deficient zebrafish embryos.
GO enrichment of up- and downregulated genes in Rpl11-deficient zebrafish embryos at 48 hpf. GO enrichment includes three analytical aspects: biological process, molecular function, and cellular component. DEGs in Rpl11-deficient zebrafish embryos at 48 hpf (FC >2, p-value <0.05) were included in this analysis. Blue labeled functions are associated with DEGs in Rpl11-deficient zebrafish embryos. This figure was generated using AmiGO software (http://www.geneontology.org/). Figure S1, GO enrichment of upregulated genes in Rpl11-deficient zebrafish embryos at 48 hpf. Figure S2, GO enrichment of downregulated genes in Rpl11-deficient zebrafish embryos at 48 hpf.
Genes involved in GO enrichment of up- and downregulated DEGs in Rpl11-deficient zebrafish embryos.
qPCR analyses of human FTMT homologs in Rpl11-deficient zebrafish embryos at 48 hpf. These genes were zgc:194125, zgc:173594, and zgc:109934, which were specifically enriched in iron metabolism-associated functions such as iron transport and cellular iron homeostasis in GO analyses, and were upregualted in Rpl11-deficient zebrafish embryos (Mean ± SD, one-way ANOVA, **P < 0.01, *<0.05, n = 3). Gene expression in MO control samples was normalized to 1.
Scatter plot of DEGs in Rpl11-deficient zebrafish embryos at 48 hpf. DEGs affected by Rpl11 deficiency in zebrafish embryos at 48 hpf are shown (FC >1.5, p-value <0.05), and affected hematological genes (highlighted red) were further analyzed.
Affected hematological genes enriched in GO items.
Disturbed signaling pathways in Rpl11-deficient zebrafish embryos. This table includes up- and downregulated signaling pathways in Rpl11-deficient zebrafish embryos at 48 hpf.
Networks affected by Rpl11 deficiency in zebrafish embryos at 48 hpf. Networks were generated using online IPA software, and highly enriched networks were selected (Score > 20). Genes labeled red and green were up- and downregulated, respectively. Figure S5 (A-C), Upregulated networks affected by Rpl11 deficiency in zebrafish embryos at 48 hpf. A, Networks of cellular function and maintenance, small molecule biochemistry, and carbohydrate metabolism. B, Networks of cellular development, cellular growth and proliferation, and connective tissue development and function. C, Networks of cell death and survival, connective tissue disorders, and immunological disease. Figure S6 (A-E), Downregulated networks affected by Rpl11 deficiency in zebrafish embryos at 48 hpf. A, Networks of developmental disorders, skeletal and muscular disorders, and digestive system development and function. B, Networks of cellular development, visual system development and function, nervous system development and function, cellular growth and proliferation, connective tissue development and function, neurological disease, and tissue morphology. C, Networks of cell death and survival, cardiac pulmonary embolism, and cardiovascular disease. D, Networks of cancer, cell cycle, and tissue morphology. E, Networks of cell cycle, cell morphology, and cell-to-cell signaling and interaction.
Genes involved in regulatory interacting networks disturbed in Rpl11-deficiet zebrafish embryos.
Description of blood cell lineage markers. Description of blood cell lineage markers, including cmyb, hoxb4a, tal1, mpx, spi1, and ikzf1, were shown. Blood cell lineages, including hematopoietic stem cells, granulocytes, myelocytes, and lymphoid progenitors were detected in this study. Fold change represents FPKM in Rpl11-deficient zebrafish embryos compared to that of MO control.
RT-PCR analyses of changes in the expression of globin genes in zebrafish embryos after Rpl11 knockdown. A, RT-PCR analysis of changes in expression of globin genes in zebrafish embryos after Rpl11 knockdown (Mean ± SD, one-way ANOVA, **P < 0.01, *<0.05, n = 3). Gene expression in MO control samples was normalized to 1; B, Description of globin genes detected in deep sequencing samples.
RT-PCR primers used in this study.